Immigrants from Australia 3 or more Vehicles in Household
COMPARE
Immigrants from Australia
Select to Compare
3 or more Vehicles in Household
Immigrants from Australia 3 or more Vehicles in Household
18.1%
3+ VEHICLES AVAILABLE
2.0/ 100
METRIC RATING
246th/ 347
METRIC RANK
Immigrants from Australia 3 or more Vehicles in Household Correlation Chart
The statistical analysis conducted on geographies consisting of 227,053,605 people shows a substantial positive correlation between the proportion of Immigrants from Australia and percentage of households with 3 or more vehicles available in the United States with a correlation coefficient (R) of 0.503 and weighted average of 18.1%. On average, for every 1% (one percent) increase in Immigrants from Australia within a typical geography, there is an increase of 2.6% in percentage of households with 3 or more vehicles available.
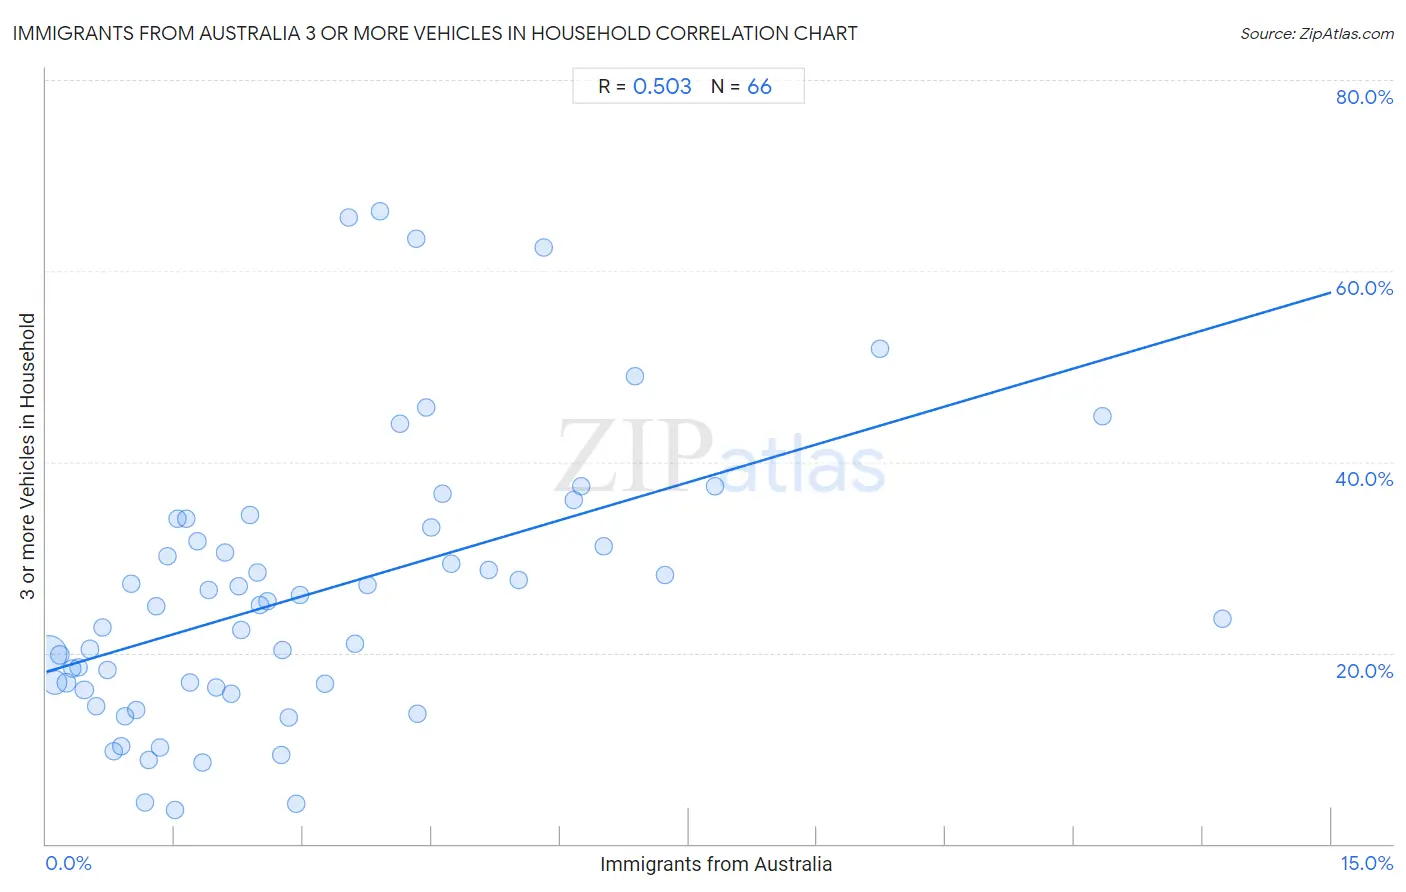
It is essential to understand that the correlation between the percentage of Immigrants from Australia and percentage of households with 3 or more vehicles available does not imply a direct cause-and-effect relationship. It remains uncertain whether the presence of Immigrants from Australia influences an upward or downward trend in the level of percentage of households with 3 or more vehicles available within an area, or if Immigrants from Australia simply ended up residing in those areas with higher or lower levels of percentage of households with 3 or more vehicles available due to other factors.
Demographics Similar to Immigrants from Australia by 3 or more Vehicles in Household
In terms of 3 or more vehicles in household, the demographic groups most similar to Immigrants from Australia are Immigrants from Belize (18.1%, a difference of 0.070%), Carpatho Rusyn (18.0%, a difference of 0.16%), Mongolian (18.1%, a difference of 0.23%), Immigrants from Eastern Africa (18.0%, a difference of 0.29%), and Immigrants from Europe (18.1%, a difference of 0.35%).
| Demographics | Rating | Rank | 3 or more Vehicles in Household |
| Immigrants from Middle Africa | 3.1 /100 | #239 | Tragic 18.2% |
| Immigrants from China | 2.9 /100 | #240 | Tragic 18.2% |
| Africans | 2.7 /100 | #241 | Tragic 18.2% |
| Hopi | 2.5 /100 | #242 | Tragic 18.2% |
| Immigrants from Europe | 2.4 /100 | #243 | Tragic 18.1% |
| Mongolians | 2.3 /100 | #244 | Tragic 18.1% |
| Immigrants from Belize | 2.1 /100 | #245 | Tragic 18.1% |
| Immigrants from Australia | 2.0 /100 | #246 | Tragic 18.1% |
| Carpatho Rusyns | 1.9 /100 | #247 | Tragic 18.0% |
| Immigrants from Eastern Africa | 1.8 /100 | #248 | Tragic 18.0% |
| Immigrants from Saudi Arabia | 1.7 /100 | #249 | Tragic 18.0% |
| Venezuelans | 1.7 /100 | #250 | Tragic 18.0% |
| Alsatians | 1.5 /100 | #251 | Tragic 18.0% |
| Immigrants from Southern Europe | 1.4 /100 | #252 | Tragic 17.9% |
| Immigrants from Ethiopia | 1.3 /100 | #253 | Tragic 17.9% |
Immigrants from Australia 3 or more Vehicles in Household Correlation Summary
| Measurement | Immigrants from Australia Data | 3 or more Vehicles in Household Data |
| Minimum | 0.030% | 3.6% |
| Maximum | 13.7% | 66.2% |
| Range | 13.7% | 62.7% |
| Mean | 3.1% | 26.2% |
| Median | 2.3% | 24.9% |
| Interquartile 25% (IQ1) | 1.1% | 16.4% |
| Interquartile 75% (IQ3) | 4.3% | 33.1% |
| Interquartile Range (IQR) | 3.2% | 16.7% |
| Standard Deviation (Sample) | 2.8% | 14.6% |
| Standard Deviation (Population) | 2.8% | 14.5% |
Correlation Details
| Immigrants from Australia Percentile | Sample Size | 3 or more Vehicles in Household |
[ 0.0% - 0.5% ] 0.030% | 148,063,259 | 19.9% |
[ 0.0% - 0.5% ] 0.099% | 50,255,809 | 16.9% |
[ 0.0% - 0.5% ] 0.16% | 12,158,823 | 19.7% |
[ 0.0% - 0.5% ] 0.24% | 6,396,237 | 16.9% |
[ 0.0% - 0.5% ] 0.31% | 2,827,897 | 18.4% |
[ 0.0% - 0.5% ] 0.37% | 2,571,340 | 18.4% |
[ 0.0% - 0.5% ] 0.44% | 1,327,114 | 16.1% |
[ 0.5% - 1.0% ] 0.51% | 1,065,468 | 20.4% |
[ 0.5% - 1.0% ] 0.58% | 790,062 | 14.4% |
[ 0.5% - 1.0% ] 0.66% | 358,900 | 22.7% |
[ 0.5% - 1.0% ] 0.72% | 217,523 | 18.2% |
[ 0.5% - 1.0% ] 0.78% | 279,099 | 9.7% |
[ 0.5% - 1.0% ] 0.87% | 99,023 | 10.2% |
[ 0.5% - 1.0% ] 0.92% | 105,890 | 13.3% |
[ 0.5% - 1.0% ] 0.99% | 78,308 | 27.2% |
[ 1.0% - 1.5% ] 1.05% | 17,671 | 14.0% |
[ 1.0% - 1.5% ] 1.15% | 90,145 | 4.4% |
[ 1.0% - 1.5% ] 1.20% | 87,490 | 8.8% |
[ 1.0% - 1.5% ] 1.28% | 38,149 | 24.8% |
[ 1.0% - 1.5% ] 1.32% | 36,257 | 10.1% |
[ 1.0% - 1.5% ] 1.41% | 15,789 | 30.1% |
[ 1.5% - 2.0% ] 1.50% | 35,234 | 3.6% |
[ 1.5% - 2.0% ] 1.54% | 2,209 | 34.0% |
[ 1.5% - 2.0% ] 1.63% | 1,592 | 34.1% |
[ 1.5% - 2.0% ] 1.67% | 4,305 | 16.9% |
[ 1.5% - 2.0% ] 1.76% | 7,257 | 31.7% |
[ 1.5% - 2.0% ] 1.82% | 29,517 | 8.5% |
[ 1.5% - 2.0% ] 1.89% | 10,661 | 26.5% |
[ 1.5% - 2.0% ] 1.99% | 2,668 | 16.4% |
[ 2.0% - 2.5% ] 2.08% | 528 | 30.5% |
[ 2.0% - 2.5% ] 2.16% | 3,511 | 15.7% |
[ 2.0% - 2.5% ] 2.25% | 5,824 | 27.0% |
[ 2.0% - 2.5% ] 2.28% | 2,191 | 22.4% |
[ 2.0% - 2.5% ] 2.37% | 12,555 | 34.5% |
[ 2.0% - 2.5% ] 2.46% | 5,478 | 28.4% |
[ 2.0% - 2.5% ] 2.50% | 40 | 25.0% |
[ 2.5% - 3.0% ] 2.58% | 3,842 | 25.4% |
[ 2.5% - 3.0% ] 2.74% | 14,578 | 9.2% |
[ 2.5% - 3.0% ] 2.76% | 5,807 | 20.3% |
[ 2.5% - 3.0% ] 2.83% | 2,051 | 13.2% |
[ 2.5% - 3.0% ] 2.92% | 10,274 | 4.2% |
[ 2.5% - 3.0% ] 2.97% | 1,381 | 26.0% |
[ 3.0% - 3.5% ] 3.26% | 215 | 16.8% |
[ 3.5% - 4.0% ] 3.54% | 396 | 65.6% |
[ 3.5% - 4.0% ] 3.61% | 416 | 21.0% |
[ 3.5% - 4.0% ] 3.75% | 774 | 27.2% |
[ 3.5% - 4.0% ] 3.89% | 180 | 66.2% |
[ 4.0% - 4.5% ] 4.12% | 97 | 44.0% |
[ 4.0% - 4.5% ] 4.32% | 301 | 63.4% |
[ 4.0% - 4.5% ] 4.33% | 300 | 13.6% |
[ 4.0% - 4.5% ] 4.43% | 158 | 45.7% |
[ 4.0% - 4.5% ] 4.50% | 867 | 33.1% |
[ 4.5% - 5.0% ] 4.62% | 1,537 | 36.7% |
[ 4.5% - 5.0% ] 4.73% | 1,840 | 29.3% |
[ 5.0% - 5.5% ] 5.16% | 581 | 28.7% |
[ 5.5% - 6.0% ] 5.52% | 326 | 27.6% |
[ 5.5% - 6.0% ] 5.81% | 155 | 62.5% |
[ 6.0% - 6.5% ] 6.15% | 130 | 36.1% |
[ 6.0% - 6.5% ] 6.25% | 32 | 37.5% |
[ 6.5% - 7.0% ] 6.51% | 614 | 31.2% |
[ 6.5% - 7.0% ] 6.88% | 800 | 49.0% |
[ 7.0% - 7.5% ] 7.23% | 83 | 28.2% |
[ 7.5% - 8.0% ] 7.80% | 1,307 | 37.5% |
[ 9.5% - 10.0% ] 9.73% | 565 | 51.8% |
[ 12.0% - 12.5% ] 12.33% | 73 | 44.7% |
[ 13.5% - 14.0% ] 13.73% | 102 | 23.5% |