Immigrants from Australia Wage/Income Gap
COMPARE
Immigrants from Australia
Select to Compare
Wage/Income Gap
Immigrants from Australia Wage/Income Gap
28.2%
WAGE/INCOME GAP
0.3/ 100
METRIC RATING
292nd/ 347
METRIC RANK
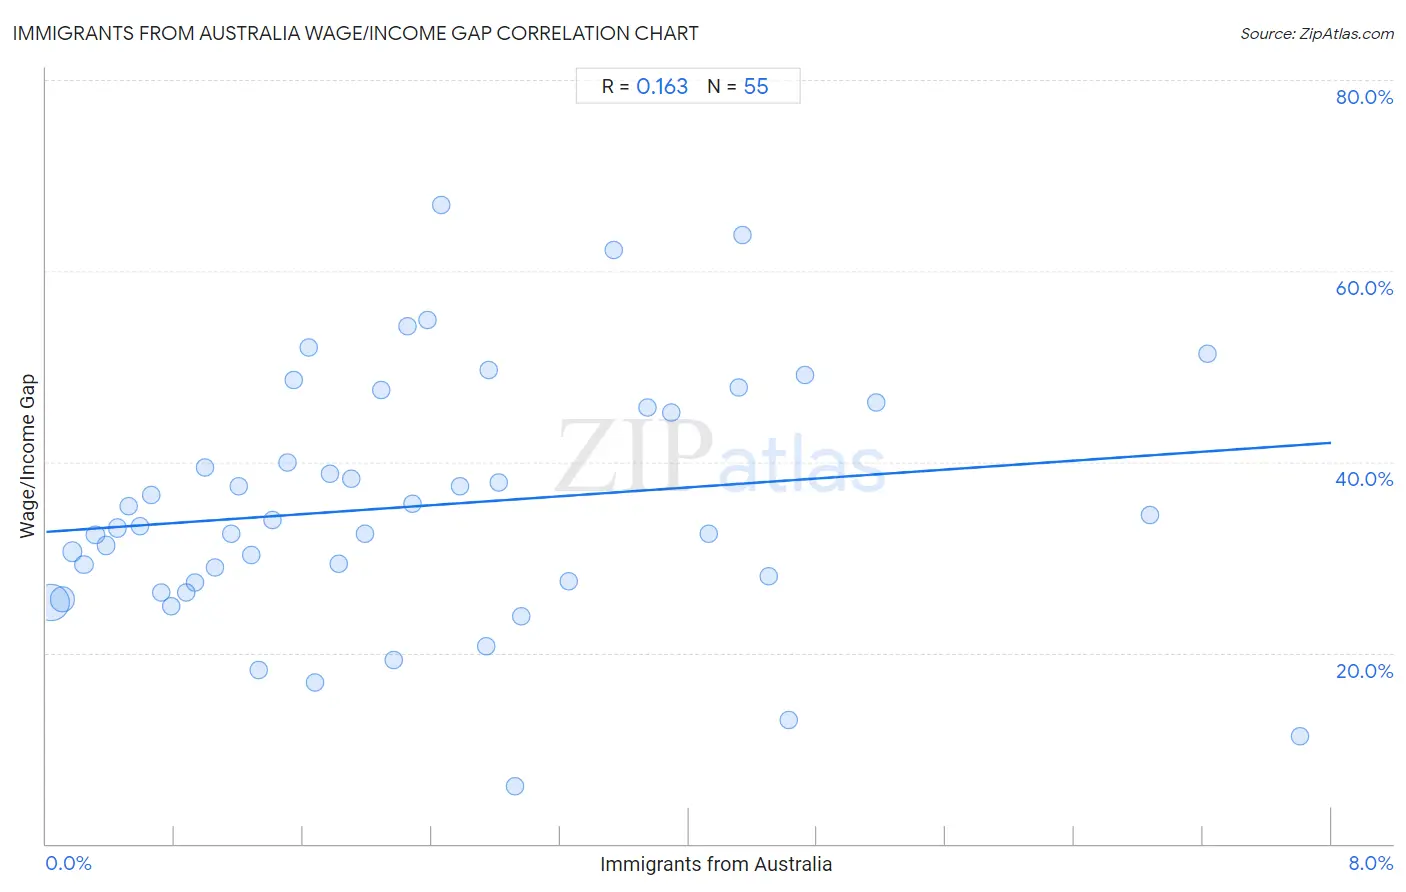
Immigrants from Australia Wage/Income Gap Correlation Chart
The statistical analysis conducted on geographies consisting of 227,127,530 people shows a poor positive correlation between the proportion of Immigrants from Australia and wage/income gap percentage in the United States with a correlation coefficient (R) of 0.163 and weighted average of 28.2%. On average, for every 1% (one percent) increase in Immigrants from Australia within a typical geography, there is an increase of 1.2% in wage/income gap percentage.
It is essential to understand that the correlation between the percentage of Immigrants from Australia and wage/income gap percentage does not imply a direct cause-and-effect relationship. It remains uncertain whether the presence of Immigrants from Australia influences an upward or downward trend in the level of wage/income gap percentage within an area, or if Immigrants from Australia simply ended up residing in those areas with higher or lower levels of wage/income gap percentage due to other factors.
Demographics Similar to Immigrants from Australia by Wage/Income Gap
In terms of wage/income gap, the demographic groups most similar to Immigrants from Australia are Czechoslovakian (28.2%, a difference of 0.060%), Immigrants from Israel (28.2%, a difference of 0.11%), Australian (28.2%, a difference of 0.12%), Greek (28.2%, a difference of 0.13%), and Canadian (28.1%, a difference of 0.22%).
| Demographics | Rating | Rank | Wage/Income Gap |
| Italians | 0.4 /100 | #285 | Tragic 28.1% |
| Immigrants from Austria | 0.4 /100 | #286 | Tragic 28.1% |
| Okinawans | 0.4 /100 | #287 | Tragic 28.1% |
| Choctaw | 0.4 /100 | #288 | Tragic 28.1% |
| Canadians | 0.3 /100 | #289 | Tragic 28.1% |
| Australians | 0.3 /100 | #290 | Tragic 28.2% |
| Czechoslovakians | 0.3 /100 | #291 | Tragic 28.2% |
| Immigrants from Australia | 0.3 /100 | #292 | Tragic 28.2% |
| Immigrants from Israel | 0.3 /100 | #293 | Tragic 28.2% |
| Greeks | 0.3 /100 | #294 | Tragic 28.2% |
| Slovenes | 0.3 /100 | #295 | Tragic 28.3% |
| Northern Europeans | 0.3 /100 | #296 | Tragic 28.3% |
| Immigrants from North America | 0.2 /100 | #297 | Tragic 28.4% |
| Austrians | 0.2 /100 | #298 | Tragic 28.4% |
| Immigrants from North Macedonia | 0.2 /100 | #299 | Tragic 28.4% |
Immigrants from Australia Wage/Income Gap Correlation Summary
| Measurement | Immigrants from Australia Data | Wage/Income Gap Data |
| Minimum | 0.030% | 6.0% |
| Maximum | 7.8% | 66.9% |
| Range | 7.8% | 60.9% |
| Mean | 2.3% | 35.4% |
| Median | 1.9% | 33.2% |
| Interquartile 25% (IQ1) | 0.92% | 27.4% |
| Interquartile 75% (IQ3) | 3.3% | 45.7% |
| Interquartile Range (IQR) | 2.3% | 18.3% |
| Standard Deviation (Sample) | 1.8% | 13.0% |
| Standard Deviation (Population) | 1.8% | 12.9% |
Correlation Details
| Immigrants from Australia Percentile | Sample Size | Wage/Income Gap |
[ 0.0% - 0.5% ] 0.030% | 148,063,259 | 25.2% |
[ 0.0% - 0.5% ] 0.099% | 50,285,639 | 25.6% |
[ 0.0% - 0.5% ] 0.16% | 12,170,419 | 30.6% |
[ 0.0% - 0.5% ] 0.24% | 6,401,403 | 29.2% |
[ 0.0% - 0.5% ] 0.31% | 2,824,701 | 32.4% |
[ 0.0% - 0.5% ] 0.37% | 2,566,391 | 31.2% |
[ 0.0% - 0.5% ] 0.44% | 1,330,103 | 33.1% |
[ 0.5% - 1.0% ] 0.51% | 1,080,291 | 35.4% |
[ 0.5% - 1.0% ] 0.58% | 795,614 | 33.2% |
[ 0.5% - 1.0% ] 0.66% | 358,598 | 36.5% |
[ 0.5% - 1.0% ] 0.72% | 232,362 | 26.3% |
[ 0.5% - 1.0% ] 0.78% | 278,488 | 24.9% |
[ 0.5% - 1.0% ] 0.87% | 99,023 | 26.3% |
[ 0.5% - 1.0% ] 0.92% | 104,198 | 27.4% |
[ 0.5% - 1.0% ] 0.99% | 78,309 | 39.4% |
[ 1.0% - 1.5% ] 1.05% | 17,287 | 29.0% |
[ 1.0% - 1.5% ] 1.15% | 87,878 | 32.5% |
[ 1.0% - 1.5% ] 1.20% | 85,646 | 37.5% |
[ 1.0% - 1.5% ] 1.28% | 38,149 | 30.2% |
[ 1.0% - 1.5% ] 1.32% | 43,009 | 18.2% |
[ 1.0% - 1.5% ] 1.41% | 16,077 | 33.9% |
[ 1.5% - 2.0% ] 1.50% | 37,173 | 39.9% |
[ 1.5% - 2.0% ] 1.54% | 2,209 | 48.5% |
[ 1.5% - 2.0% ] 1.63% | 7,851 | 51.9% |
[ 1.5% - 2.0% ] 1.68% | 5,670 | 16.9% |
[ 1.5% - 2.0% ] 1.76% | 6,743 | 38.7% |
[ 1.5% - 2.0% ] 1.82% | 28,861 | 29.3% |
[ 1.5% - 2.0% ] 1.90% | 8,546 | 38.2% |
[ 1.5% - 2.0% ] 1.99% | 2,668 | 32.5% |
[ 2.0% - 2.5% ] 2.08% | 528 | 47.5% |
[ 2.0% - 2.5% ] 2.16% | 3,511 | 19.2% |
[ 2.0% - 2.5% ] 2.25% | 5,824 | 54.2% |
[ 2.0% - 2.5% ] 2.28% | 2,191 | 35.6% |
[ 2.0% - 2.5% ] 2.37% | 11,330 | 54.9% |
[ 2.0% - 2.5% ] 2.46% | 1,342 | 66.9% |
[ 2.5% - 3.0% ] 2.58% | 3,455 | 37.5% |
[ 2.5% - 3.0% ] 2.74% | 14,578 | 20.7% |
[ 2.5% - 3.0% ] 2.76% | 4,316 | 49.6% |
[ 2.5% - 3.0% ] 2.82% | 1,028 | 37.9% |
[ 2.5% - 3.0% ] 2.92% | 10,274 | 6.0% |
[ 2.5% - 3.0% ] 2.96% | 4,662 | 23.8% |
[ 3.0% - 3.5% ] 3.26% | 215 | 27.5% |
[ 3.5% - 4.0% ] 3.54% | 396 | 62.1% |
[ 3.5% - 4.0% ] 3.75% | 774 | 45.7% |
[ 3.5% - 4.0% ] 3.89% | 180 | 45.2% |
[ 4.0% - 4.5% ] 4.12% | 97 | 32.5% |
[ 4.0% - 4.5% ] 4.31% | 464 | 47.7% |
[ 4.0% - 4.5% ] 4.33% | 300 | 63.8% |
[ 4.0% - 4.5% ] 4.50% | 867 | 28.0% |
[ 4.5% - 5.0% ] 4.62% | 1,537 | 12.9% |
[ 4.5% - 5.0% ] 4.72% | 635 | 49.2% |
[ 5.0% - 5.5% ] 5.17% | 271 | 46.2% |
[ 6.5% - 7.0% ] 6.88% | 800 | 34.4% |
[ 7.0% - 7.5% ] 7.23% | 83 | 51.4% |
[ 7.5% - 8.0% ] 7.80% | 1,307 | 11.2% |