Eastern European 4 or more Vehicles in Household
COMPARE
Eastern European
Select to Compare
4 or more Vehicles in Household
Eastern European 4 or more Vehicles in Household
5.9%
4+ VEHICLES AVAILABLE
6.8/ 100
METRIC RATING
229th/ 347
METRIC RANK
Eastern European 4 or more Vehicles in Household Correlation Chart
The statistical analysis conducted on geographies consisting of 459,039,876 people shows a strong positive correlation between the proportion of Eastern Europeans and percentage of households with 4 or more vehicles available in the United States with a correlation coefficient (R) of 0.797 and weighted average of 5.9%. On average, for every 1% (one percent) increase in Eastern Europeans within a typical geography, there is an increase of 0.92% in percentage of households with 4 or more vehicles available.
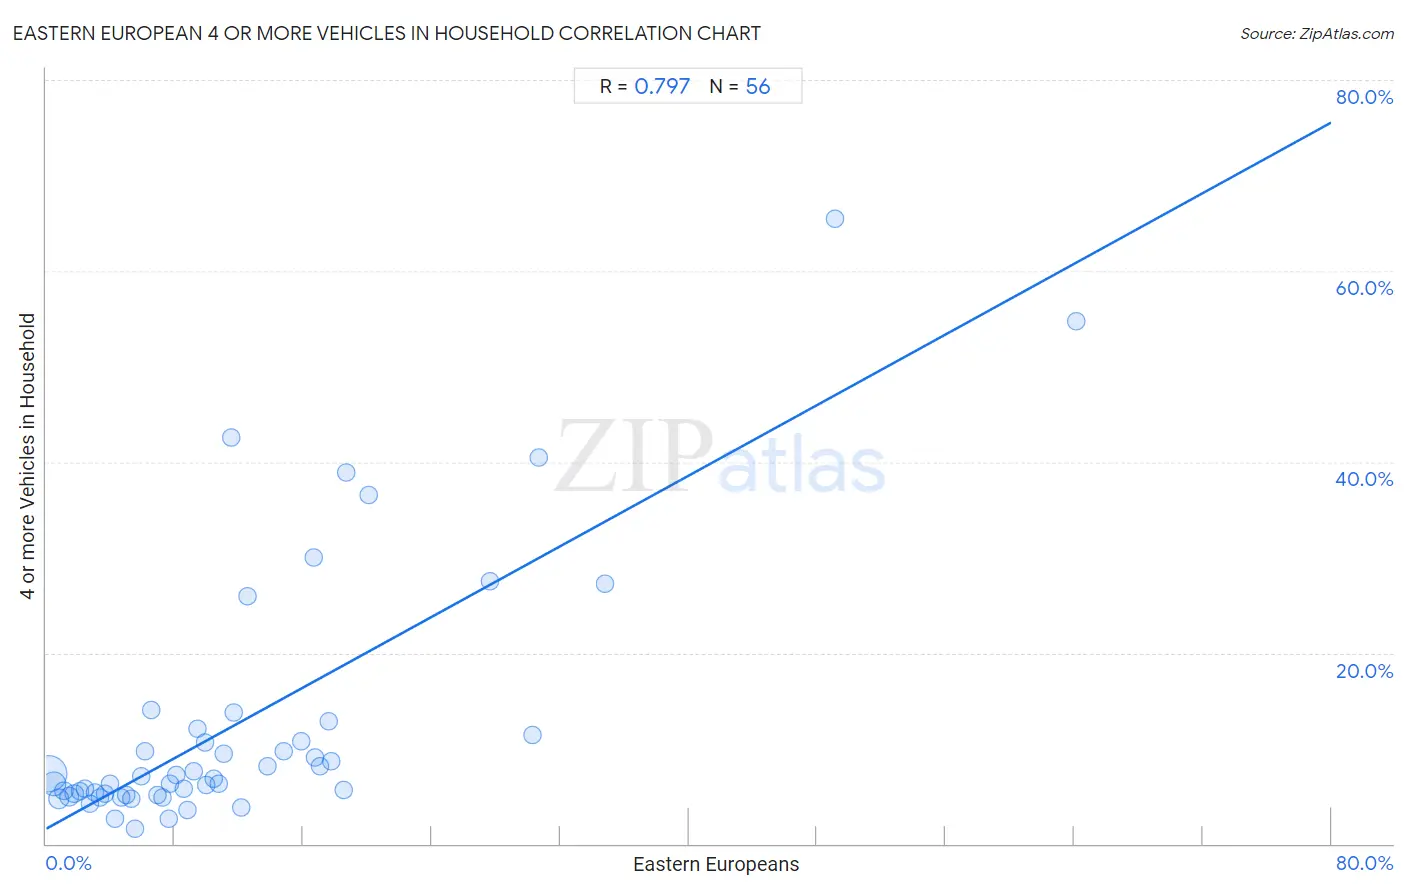
It is essential to understand that the correlation between the percentage of Eastern Europeans and percentage of households with 4 or more vehicles available does not imply a direct cause-and-effect relationship. It remains uncertain whether the presence of Eastern Europeans influences an upward or downward trend in the level of percentage of households with 4 or more vehicles available within an area, or if Eastern Europeans simply ended up residing in those areas with higher or lower levels of percentage of households with 4 or more vehicles available due to other factors.
Demographics Similar to Eastern Europeans by 4 or more Vehicles in Household
In terms of 4 or more vehicles in household, the demographic groups most similar to Eastern Europeans are Immigrants from Malaysia (5.9%, a difference of 0.070%), Immigrants from Switzerland (5.9%, a difference of 0.18%), Immigrants from Uganda (5.9%, a difference of 0.28%), Immigrants from Argentina (5.9%, a difference of 0.37%), and Immigrants from Western Asia (5.9%, a difference of 0.38%).
| Demographics | Rating | Rank | 4 or more Vehicles in Household |
| Cajuns | 9.2 /100 | #222 | Tragic 6.0% |
| Immigrants from Kenya | 9.2 /100 | #223 | Tragic 6.0% |
| Cubans | 9.2 /100 | #224 | Tragic 6.0% |
| Indonesians | 8.9 /100 | #225 | Tragic 6.0% |
| Immigrants from Singapore | 7.9 /100 | #226 | Tragic 5.9% |
| Immigrants from Western Asia | 7.8 /100 | #227 | Tragic 5.9% |
| Immigrants from Uganda | 7.5 /100 | #228 | Tragic 5.9% |
| Eastern Europeans | 6.8 /100 | #229 | Tragic 5.9% |
| Immigrants from Malaysia | 6.7 /100 | #230 | Tragic 5.9% |
| Immigrants from Switzerland | 6.4 /100 | #231 | Tragic 5.9% |
| Immigrants from Argentina | 6.0 /100 | #232 | Tragic 5.9% |
| Sierra Leoneans | 6.0 /100 | #233 | Tragic 5.9% |
| Africans | 4.6 /100 | #234 | Tragic 5.8% |
| Immigrants from Hungary | 4.6 /100 | #235 | Tragic 5.8% |
| Immigrants from Eritrea | 4.5 /100 | #236 | Tragic 5.8% |
Eastern European 4 or more Vehicles in Household Correlation Summary
| Measurement | Eastern European Data | 4 or more Vehicles in Household Data |
| Minimum | 0.14% | 1.6% |
| Maximum | 64.1% | 65.5% |
| Range | 64.0% | 63.9% |
| Mean | 11.9% | 12.6% |
| Median | 9.0% | 7.0% |
| Interquartile 25% (IQ1) | 4.5% | 5.2% |
| Interquartile 75% (IQ3) | 16.3% | 11.7% |
| Interquartile Range (IQR) | 11.8% | 6.5% |
| Standard Deviation (Sample) | 11.8% | 13.7% |
| Standard Deviation (Population) | 11.7% | 13.6% |
Correlation Details
| Eastern European Percentile | Sample Size | 4 or more Vehicles in Household |
[ 0.0% - 0.5% ] 0.14% | 291,721,130 | 7.3% |
[ 0.0% - 0.5% ] 0.45% | 95,344,425 | 6.3% |
[ 0.5% - 1.0% ] 0.79% | 37,356,028 | 4.7% |
[ 1.0% - 1.5% ] 1.09% | 14,874,927 | 5.6% |
[ 1.0% - 1.5% ] 1.43% | 6,722,770 | 4.9% |
[ 1.5% - 2.0% ] 1.75% | 3,873,717 | 5.2% |
[ 2.0% - 2.5% ] 2.07% | 2,334,229 | 5.6% |
[ 2.0% - 2.5% ] 2.40% | 1,903,757 | 5.8% |
[ 2.5% - 3.0% ] 2.72% | 1,121,768 | 4.2% |
[ 3.0% - 3.5% ] 3.04% | 835,902 | 5.4% |
[ 3.0% - 3.5% ] 3.35% | 487,356 | 4.8% |
[ 3.5% - 4.0% ] 3.67% | 592,512 | 5.3% |
[ 3.5% - 4.0% ] 4.00% | 283,262 | 6.3% |
[ 4.0% - 4.5% ] 4.31% | 476,252 | 2.6% |
[ 4.5% - 5.0% ] 4.67% | 242,196 | 4.8% |
[ 4.5% - 5.0% ] 4.98% | 149,561 | 5.0% |
[ 5.0% - 5.5% ] 5.29% | 143,263 | 4.7% |
[ 5.5% - 6.0% ] 5.50% | 203,516 | 1.6% |
[ 5.5% - 6.0% ] 5.92% | 126,711 | 7.1% |
[ 6.0% - 6.5% ] 6.18% | 26,468 | 9.6% |
[ 6.5% - 7.0% ] 6.52% | 1,734 | 14.0% |
[ 6.5% - 7.0% ] 6.89% | 33,451 | 5.1% |
[ 7.0% - 7.5% ] 7.24% | 28,498 | 4.9% |
[ 7.5% - 8.0% ] 7.60% | 10,589 | 2.6% |
[ 7.5% - 8.0% ] 7.74% | 33,910 | 6.3% |
[ 8.0% - 8.5% ] 8.06% | 25,839 | 7.2% |
[ 8.5% - 9.0% ] 8.57% | 31,102 | 5.7% |
[ 8.5% - 9.0% ] 8.78% | 3,838 | 3.5% |
[ 9.0% - 9.5% ] 9.17% | 14,348 | 7.6% |
[ 9.0% - 9.5% ] 9.41% | 12,512 | 12.0% |
[ 9.5% - 10.0% ] 9.88% | 1,225 | 10.6% |
[ 9.5% - 10.0% ] 9.98% | 4,018 | 6.1% |
[ 10.0% - 10.5% ] 10.41% | 797 | 6.8% |
[ 10.5% - 11.0% ] 10.75% | 3,071 | 6.3% |
[ 11.0% - 11.5% ] 11.04% | 3,967 | 9.4% |
[ 11.5% - 12.0% ] 11.54% | 78 | 42.5% |
[ 11.5% - 12.0% ] 11.67% | 3,273 | 13.7% |
[ 12.0% - 12.5% ] 12.17% | 345 | 3.7% |
[ 12.5% - 13.0% ] 12.57% | 1,472 | 25.9% |
[ 13.5% - 14.0% ] 13.79% | 87 | 8.1% |
[ 14.5% - 15.0% ] 14.81% | 1,350 | 9.7% |
[ 15.5% - 16.0% ] 15.88% | 825 | 10.8% |
[ 16.5% - 17.0% ] 16.67% | 12 | 30.0% |
[ 16.5% - 17.0% ] 16.69% | 599 | 9.1% |
[ 17.0% - 17.5% ] 17.07% | 123 | 8.2% |
[ 17.5% - 18.0% ] 17.61% | 352 | 12.8% |
[ 17.5% - 18.0% ] 17.71% | 96 | 8.7% |
[ 18.5% - 19.0% ] 18.55% | 318 | 5.6% |
[ 18.5% - 19.0% ] 18.68% | 91 | 38.9% |
[ 20.0% - 20.5% ] 20.04% | 484 | 36.6% |
[ 27.5% - 28.0% ] 27.63% | 76 | 27.5% |
[ 30.0% - 30.5% ] 30.26% | 998 | 11.4% |
[ 30.5% - 31.0% ] 30.70% | 316 | 40.5% |
[ 34.5% - 35.0% ] 34.78% | 46 | 27.3% |
[ 49.0% - 49.5% ] 49.14% | 116 | 65.5% |
[ 64.0% - 64.5% ] 64.12% | 170 | 54.7% |