Eastern European College, Under 1 year
COMPARE
Eastern European
Select to Compare
College, Under 1 year
Eastern European College, Under 1 year
71.8%
COLLEGE, UNDER 1 YEAR
100.0/ 100
METRIC RATING
17th/ 347
METRIC RANK
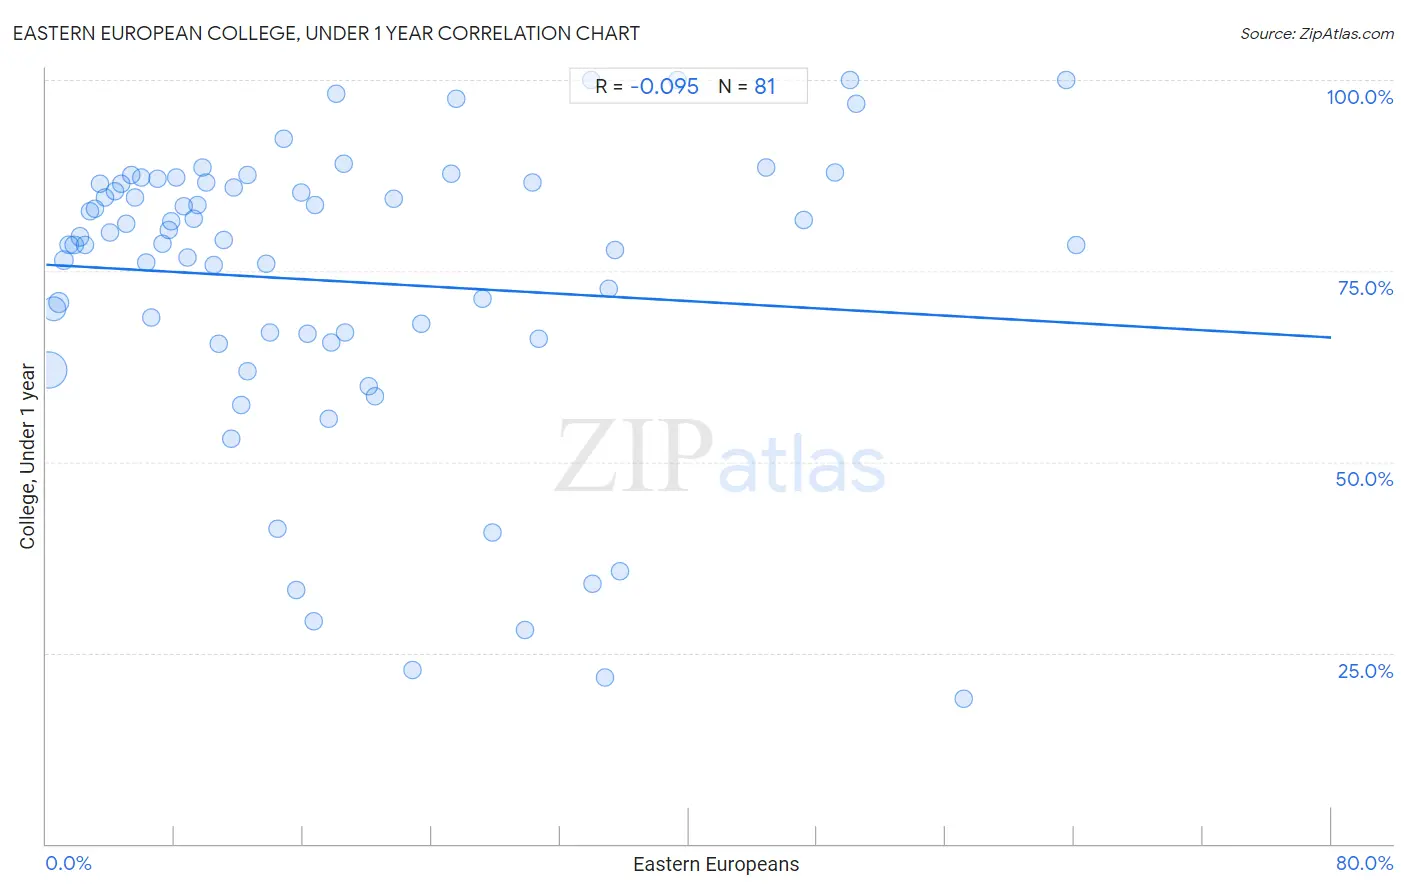
Eastern European College, Under 1 year Correlation Chart
The statistical analysis conducted on geographies consisting of 461,244,527 people shows a slight negative correlation between the proportion of Eastern Europeans and percentage of population with at least college, under 1 year education in the United States with a correlation coefficient (R) of -0.095 and weighted average of 71.8%. On average, for every 1% (one percent) increase in Eastern Europeans within a typical geography, there is a decrease of 0.12% in percentage of population with at least college, under 1 year education.
It is essential to understand that the correlation between the percentage of Eastern Europeans and percentage of population with at least college, under 1 year education does not imply a direct cause-and-effect relationship. It remains uncertain whether the presence of Eastern Europeans influences an upward or downward trend in the level of percentage of population with at least college, under 1 year education within an area, or if Eastern Europeans simply ended up residing in those areas with higher or lower levels of percentage of population with at least college, under 1 year education due to other factors.
Demographics Similar to Eastern Europeans by College, Under 1 year
In terms of college, under 1 year, the demographic groups most similar to Eastern Europeans are Immigrants from Switzerland (71.7%, a difference of 0.13%), Immigrants from Japan (71.9%, a difference of 0.14%), Cambodian (71.9%, a difference of 0.16%), Burmese (71.9%, a difference of 0.16%), and Latvian (71.6%, a difference of 0.24%).
| Demographics | Rating | Rank | College, Under 1 year |
| Immigrants from Israel | 100.0 /100 | #10 | Exceptional 72.3% |
| Immigrants from South Central Asia | 100.0 /100 | #11 | Exceptional 72.1% |
| Immigrants from Sweden | 100.0 /100 | #12 | Exceptional 72.1% |
| Cypriots | 100.0 /100 | #13 | Exceptional 72.0% |
| Cambodians | 100.0 /100 | #14 | Exceptional 71.9% |
| Burmese | 100.0 /100 | #15 | Exceptional 71.9% |
| Immigrants from Japan | 100.0 /100 | #16 | Exceptional 71.9% |
| Eastern Europeans | 100.0 /100 | #17 | Exceptional 71.8% |
| Immigrants from Switzerland | 100.0 /100 | #18 | Exceptional 71.7% |
| Latvians | 100.0 /100 | #19 | Exceptional 71.6% |
| Immigrants from Korea | 100.0 /100 | #20 | Exceptional 71.6% |
| Immigrants from Belgium | 100.0 /100 | #21 | Exceptional 71.5% |
| Immigrants from Eastern Asia | 100.0 /100 | #22 | Exceptional 71.3% |
| Immigrants from Northern Europe | 100.0 /100 | #23 | Exceptional 71.1% |
| Soviet Union | 100.0 /100 | #24 | Exceptional 71.1% |
Eastern European College, Under 1 year Correlation Summary
| Measurement | Eastern European Data | College, Under 1 year Data |
| Minimum | 0.14% | 19.0% |
| Maximum | 64.1% | 100.0% |
| Range | 64.0% | 81.0% |
| Mean | 18.1% | 73.7% |
| Median | 13.7% | 79.0% |
| Interquartile 25% (IQ1) | 6.4% | 66.5% |
| Interquartile 75% (IQ3) | 26.3% | 86.5% |
| Interquartile Range (IQR) | 20.0% | 20.0% |
| Standard Deviation (Sample) | 15.5% | 19.5% |
| Standard Deviation (Population) | 15.4% | 19.4% |
Correlation Details
| Eastern European Percentile | Sample Size | College, Under 1 year |
[ 0.0% - 0.5% ] 0.14% | 292,357,810 | 62.0% |
[ 0.0% - 0.5% ] 0.45% | 95,806,425 | 70.1% |
[ 0.5% - 1.0% ] 0.79% | 37,713,216 | 70.8% |
[ 1.0% - 1.5% ] 1.09% | 14,959,510 | 76.4% |
[ 1.0% - 1.5% ] 1.43% | 6,847,271 | 78.5% |
[ 1.5% - 2.0% ] 1.75% | 3,932,495 | 78.5% |
[ 2.0% - 2.5% ] 2.07% | 2,422,079 | 79.5% |
[ 2.0% - 2.5% ] 2.40% | 1,934,399 | 78.4% |
[ 2.5% - 3.0% ] 2.72% | 1,153,744 | 82.8% |
[ 3.0% - 3.5% ] 3.03% | 926,861 | 83.2% |
[ 3.0% - 3.5% ] 3.35% | 497,968 | 86.4% |
[ 3.5% - 4.0% ] 3.68% | 646,252 | 84.6% |
[ 3.5% - 4.0% ] 4.00% | 291,372 | 80.1% |
[ 4.0% - 4.5% ] 4.30% | 524,242 | 85.4% |
[ 4.5% - 5.0% ] 4.67% | 256,746 | 86.4% |
[ 4.5% - 5.0% ] 4.98% | 151,610 | 81.2% |
[ 5.0% - 5.5% ] 5.31% | 214,848 | 87.5% |
[ 5.5% - 6.0% ] 5.50% | 206,190 | 84.6% |
[ 5.5% - 6.0% ] 5.92% | 131,867 | 87.3% |
[ 6.0% - 6.5% ] 6.20% | 28,892 | 76.1% |
[ 6.5% - 7.0% ] 6.57% | 3,030 | 68.9% |
[ 6.5% - 7.0% ] 6.89% | 35,124 | 87.0% |
[ 7.0% - 7.5% ] 7.23% | 29,326 | 78.6% |
[ 7.5% - 8.0% ] 7.60% | 10,643 | 80.4% |
[ 7.5% - 8.0% ] 7.75% | 36,160 | 81.5% |
[ 8.0% - 8.5% ] 8.06% | 25,983 | 87.2% |
[ 8.5% - 9.0% ] 8.57% | 31,102 | 83.5% |
[ 8.5% - 9.0% ] 8.78% | 3,838 | 76.8% |
[ 9.0% - 9.5% ] 9.17% | 14,832 | 81.9% |
[ 9.0% - 9.5% ] 9.41% | 12,725 | 83.6% |
[ 9.5% - 10.0% ] 9.77% | 3,533 | 88.6% |
[ 9.5% - 10.0% ] 10.00% | 4,632 | 86.5% |
[ 10.0% - 10.5% ] 10.42% | 950 | 75.8% |
[ 10.5% - 11.0% ] 10.75% | 3,071 | 65.5% |
[ 11.0% - 11.5% ] 11.04% | 4,049 | 79.0% |
[ 11.5% - 12.0% ] 11.54% | 130 | 53.1% |
[ 11.5% - 12.0% ] 11.67% | 3,273 | 85.9% |
[ 12.0% - 12.5% ] 12.17% | 345 | 57.5% |
[ 12.0% - 12.5% ] 12.50% | 40 | 87.5% |
[ 12.5% - 13.0% ] 12.57% | 1,472 | 61.8% |
[ 13.5% - 14.0% ] 13.66% | 366 | 75.9% |
[ 13.5% - 14.0% ] 13.93% | 1,005 | 67.0% |
[ 14.0% - 14.5% ] 14.43% | 97 | 41.2% |
[ 14.5% - 15.0% ] 14.81% | 1,350 | 92.4% |
[ 15.5% - 16.0% ] 15.60% | 218 | 33.2% |
[ 15.5% - 16.0% ] 15.88% | 825 | 85.2% |
[ 16.0% - 16.5% ] 16.24% | 388 | 66.8% |
[ 16.5% - 17.0% ] 16.67% | 24 | 29.2% |
[ 16.5% - 17.0% ] 16.69% | 599 | 83.6% |
[ 17.5% - 18.0% ] 17.61% | 352 | 55.6% |
[ 17.5% - 18.0% ] 17.71% | 96 | 65.6% |
[ 18.0% - 18.5% ] 18.06% | 155 | 98.3% |
[ 18.5% - 19.0% ] 18.55% | 318 | 89.0% |
[ 18.5% - 19.0% ] 18.64% | 2,801 | 67.0% |
[ 20.0% - 20.5% ] 20.04% | 484 | 59.9% |
[ 20.0% - 20.5% ] 20.43% | 93 | 58.6% |
[ 21.5% - 22.0% ] 21.66% | 1,847 | 84.4% |
[ 22.5% - 23.0% ] 22.78% | 79 | 22.8% |
[ 23.0% - 23.5% ] 23.31% | 163 | 68.1% |
[ 25.0% - 25.5% ] 25.20% | 611 | 87.8% |
[ 25.5% - 26.0% ] 25.54% | 372 | 97.6% |
[ 27.0% - 27.5% ] 27.13% | 656 | 71.4% |
[ 27.5% - 28.0% ] 27.81% | 320 | 40.8% |
[ 29.5% - 30.0% ] 29.81% | 671 | 27.9% |
[ 30.0% - 30.5% ] 30.26% | 998 | 86.6% |
[ 30.5% - 31.0% ] 30.70% | 316 | 66.1% |
[ 33.5% - 34.0% ] 33.90% | 59 | 100.0% |
[ 34.0% - 34.5% ] 34.04% | 47 | 34.0% |
[ 34.5% - 35.0% ] 34.78% | 46 | 21.7% |
[ 35.0% - 35.5% ] 35.00% | 20 | 72.7% |
[ 35.0% - 35.5% ] 35.42% | 48 | 77.8% |
[ 35.5% - 36.0% ] 35.71% | 28 | 35.7% |
[ 39.0% - 39.5% ] 39.29% | 56 | 100.0% |
[ 44.5% - 45.0% ] 44.84% | 223 | 88.6% |
[ 47.0% - 47.5% ] 47.13% | 87 | 81.6% |
[ 49.0% - 49.5% ] 49.14% | 116 | 87.9% |
[ 50.0% - 50.5% ] 50.00% | 16 | 100.0% |
[ 50.0% - 50.5% ] 50.41% | 246 | 96.9% |
[ 57.0% - 57.5% ] 57.14% | 21 | 19.0% |
[ 63.5% - 64.0% ] 63.53% | 85 | 100.0% |
[ 64.0% - 64.5% ] 64.12% | 170 | 78.4% |