Eastern European 3 or more Vehicles in Household
COMPARE
Eastern European
Select to Compare
3 or more Vehicles in Household
Eastern European 3 or more Vehicles in Household
18.7%
3+ VEHICLES AVAILABLE
10.6/ 100
METRIC RATING
215th/ 347
METRIC RANK
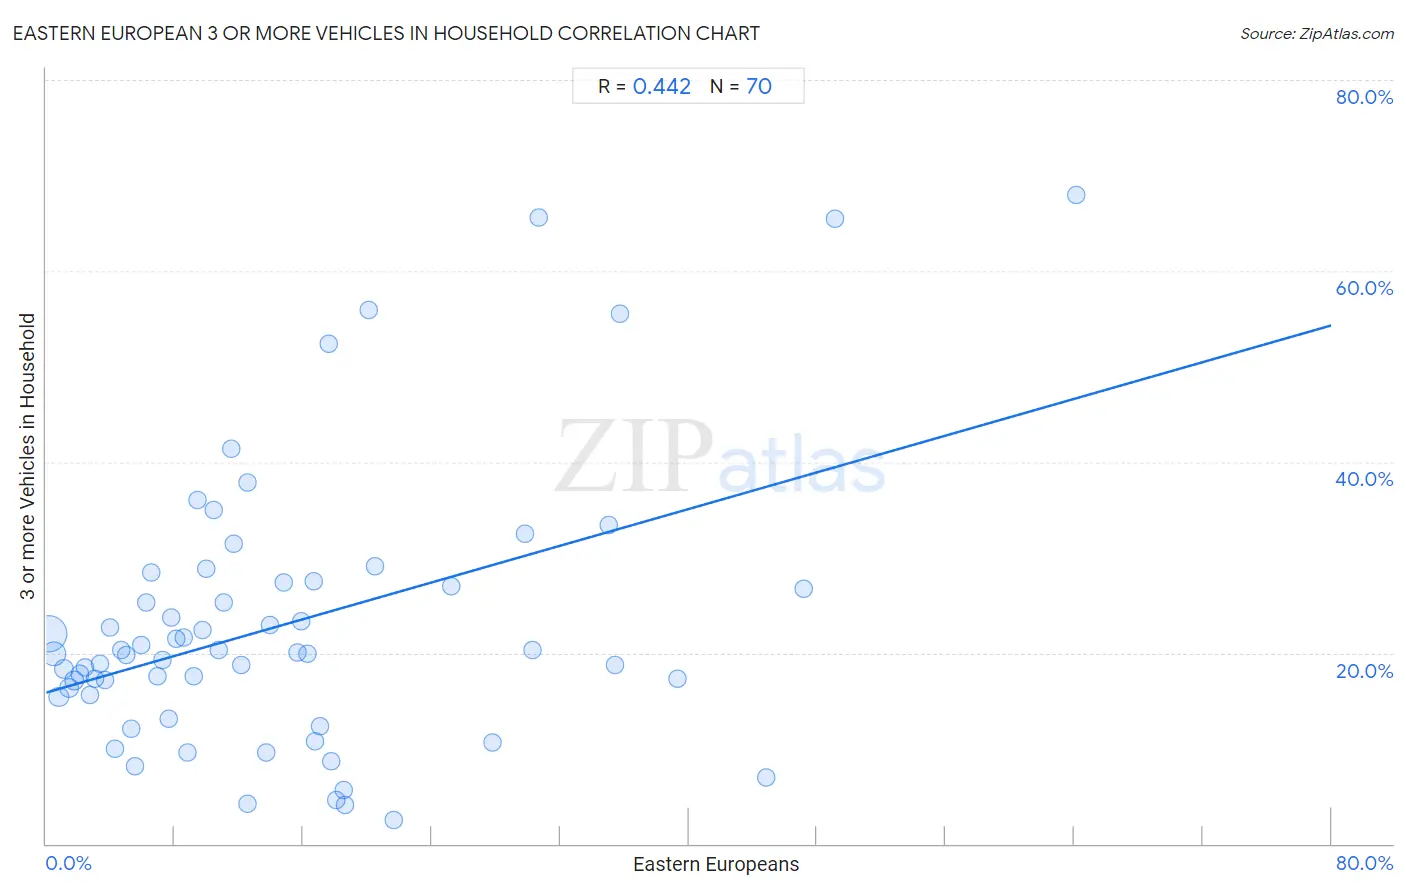
Eastern European 3 or more Vehicles in Household Correlation Chart
The statistical analysis conducted on geographies consisting of 460,782,690 people shows a moderate positive correlation between the proportion of Eastern Europeans and percentage of households with 3 or more vehicles available in the United States with a correlation coefficient (R) of 0.442 and weighted average of 18.7%. On average, for every 1% (one percent) increase in Eastern Europeans within a typical geography, there is an increase of 0.48% in percentage of households with 3 or more vehicles available.
It is essential to understand that the correlation between the percentage of Eastern Europeans and percentage of households with 3 or more vehicles available does not imply a direct cause-and-effect relationship. It remains uncertain whether the presence of Eastern Europeans influences an upward or downward trend in the level of percentage of households with 3 or more vehicles available within an area, or if Eastern Europeans simply ended up residing in those areas with higher or lower levels of percentage of households with 3 or more vehicles available due to other factors.
Demographics Similar to Eastern Europeans by 3 or more Vehicles in Household
In terms of 3 or more vehicles in household, the demographic groups most similar to Eastern Europeans are Immigrants from Sierra Leone (18.7%, a difference of 0.050%), Immigrants from Nigeria (18.7%, a difference of 0.060%), Immigrants from Italy (18.7%, a difference of 0.080%), Immigrants from Cuba (18.8%, a difference of 0.20%), and Panamanian (18.8%, a difference of 0.21%).
| Demographics | Rating | Rank | 3 or more Vehicles in Household |
| Immigrants from Burma/Myanmar | 13.6 /100 | #208 | Poor 18.8% |
| Immigrants from Egypt | 13.5 /100 | #209 | Poor 18.8% |
| Bulgarians | 13.1 /100 | #210 | Poor 18.8% |
| Immigrants from Kenya | 12.4 /100 | #211 | Poor 18.8% |
| Panamanians | 11.6 /100 | #212 | Poor 18.8% |
| Immigrants from Cuba | 11.6 /100 | #213 | Poor 18.8% |
| Immigrants from Sierra Leone | 10.8 /100 | #214 | Poor 18.7% |
| Eastern Europeans | 10.6 /100 | #215 | Poor 18.7% |
| Immigrants from Nigeria | 10.3 /100 | #216 | Poor 18.7% |
| Immigrants from Italy | 10.2 /100 | #217 | Poor 18.7% |
| Immigrants from Portugal | 8.9 /100 | #218 | Tragic 18.6% |
| Immigrants from Armenia | 8.6 /100 | #219 | Tragic 18.6% |
| Nigerians | 7.9 /100 | #220 | Tragic 18.6% |
| Immigrants from Poland | 7.5 /100 | #221 | Tragic 18.6% |
| Belizeans | 7.3 /100 | #222 | Tragic 18.6% |
Eastern European 3 or more Vehicles in Household Correlation Summary
| Measurement | Eastern European Data | 3 or more Vehicles in Household Data |
| Minimum | 0.14% | 2.5% |
| Maximum | 64.1% | 67.9% |
| Range | 64.0% | 65.5% |
| Mean | 14.9% | 23.0% |
| Median | 11.3% | 20.0% |
| Interquartile 25% (IQ1) | 5.5% | 15.6% |
| Interquartile 75% (IQ3) | 18.6% | 27.4% |
| Interquartile Range (IQR) | 13.0% | 11.8% |
| Standard Deviation (Sample) | 13.2% | 14.3% |
| Standard Deviation (Population) | 13.1% | 14.2% |
Correlation Details
| Eastern European Percentile | Sample Size | 3 or more Vehicles in Household |
[ 0.0% - 0.5% ] 0.14% | 292,186,841 | 21.9% |
[ 0.0% - 0.5% ] 0.45% | 95,685,865 | 19.9% |
[ 0.5% - 1.0% ] 0.79% | 37,635,461 | 15.4% |
[ 1.0% - 1.5% ] 1.09% | 14,936,256 | 18.3% |
[ 1.0% - 1.5% ] 1.43% | 6,836,978 | 16.3% |
[ 1.5% - 2.0% ] 1.75% | 3,923,124 | 17.1% |
[ 2.0% - 2.5% ] 2.07% | 2,419,790 | 17.7% |
[ 2.0% - 2.5% ] 2.40% | 1,927,564 | 18.4% |
[ 2.5% - 3.0% ] 2.72% | 1,146,249 | 15.6% |
[ 3.0% - 3.5% ] 3.03% | 925,079 | 17.3% |
[ 3.0% - 3.5% ] 3.35% | 497,968 | 18.9% |
[ 3.5% - 4.0% ] 3.68% | 635,653 | 17.2% |
[ 3.5% - 4.0% ] 4.00% | 285,737 | 22.6% |
[ 4.0% - 4.5% ] 4.30% | 523,613 | 10.0% |
[ 4.5% - 5.0% ] 4.67% | 250,209 | 20.3% |
[ 4.5% - 5.0% ] 4.98% | 151,610 | 19.8% |
[ 5.0% - 5.5% ] 5.31% | 214,187 | 12.0% |
[ 5.5% - 6.0% ] 5.50% | 204,015 | 8.1% |
[ 5.5% - 6.0% ] 5.92% | 131,700 | 20.8% |
[ 6.0% - 6.5% ] 6.20% | 28,632 | 25.3% |
[ 6.5% - 7.0% ] 6.52% | 1,734 | 28.4% |
[ 6.5% - 7.0% ] 6.89% | 34,207 | 17.5% |
[ 7.0% - 7.5% ] 7.23% | 29,326 | 19.2% |
[ 7.5% - 8.0% ] 7.60% | 10,643 | 13.0% |
[ 7.5% - 8.0% ] 7.75% | 36,160 | 23.6% |
[ 8.0% - 8.5% ] 8.06% | 25,983 | 21.5% |
[ 8.5% - 9.0% ] 8.57% | 31,102 | 21.7% |
[ 8.5% - 9.0% ] 8.78% | 3,838 | 9.6% |
[ 9.0% - 9.5% ] 9.17% | 14,777 | 17.6% |
[ 9.0% - 9.5% ] 9.41% | 12,725 | 36.0% |
[ 9.5% - 10.0% ] 9.77% | 3,533 | 22.4% |
[ 9.5% - 10.0% ] 10.00% | 4,632 | 28.8% |
[ 10.0% - 10.5% ] 10.41% | 797 | 34.9% |
[ 10.5% - 11.0% ] 10.75% | 3,071 | 20.3% |
[ 11.0% - 11.5% ] 11.04% | 3,967 | 25.3% |
[ 11.5% - 12.0% ] 11.54% | 130 | 41.3% |
[ 11.5% - 12.0% ] 11.67% | 3,273 | 31.5% |
[ 12.0% - 12.5% ] 12.17% | 345 | 18.7% |
[ 12.0% - 12.5% ] 12.50% | 40 | 4.2% |
[ 12.5% - 13.0% ] 12.57% | 1,472 | 37.9% |
[ 13.5% - 14.0% ] 13.66% | 366 | 9.6% |
[ 13.5% - 14.0% ] 13.97% | 759 | 22.9% |
[ 14.5% - 15.0% ] 14.81% | 1,350 | 27.4% |
[ 15.5% - 16.0% ] 15.62% | 160 | 20.0% |
[ 15.5% - 16.0% ] 15.88% | 825 | 23.3% |
[ 16.0% - 16.5% ] 16.24% | 388 | 19.9% |
[ 16.5% - 17.0% ] 16.67% | 24 | 27.5% |
[ 16.5% - 17.0% ] 16.69% | 599 | 10.7% |
[ 17.0% - 17.5% ] 17.07% | 123 | 12.2% |
[ 17.5% - 18.0% ] 17.61% | 352 | 52.3% |
[ 17.5% - 18.0% ] 17.71% | 96 | 8.7% |
[ 18.0% - 18.5% ] 18.06% | 155 | 4.6% |
[ 18.5% - 19.0% ] 18.55% | 318 | 5.6% |
[ 18.5% - 19.0% ] 18.64% | 2,801 | 4.1% |
[ 20.0% - 20.5% ] 20.04% | 484 | 55.9% |
[ 20.0% - 20.5% ] 20.43% | 93 | 29.0% |
[ 21.5% - 22.0% ] 21.66% | 1,847 | 2.5% |
[ 25.0% - 25.5% ] 25.20% | 611 | 27.0% |
[ 27.5% - 28.0% ] 27.81% | 320 | 10.6% |
[ 29.5% - 30.0% ] 29.81% | 671 | 32.5% |
[ 30.0% - 30.5% ] 30.26% | 998 | 20.3% |
[ 30.5% - 31.0% ] 30.70% | 316 | 65.6% |
[ 35.0% - 35.5% ] 35.00% | 20 | 33.3% |
[ 35.0% - 35.5% ] 35.42% | 48 | 18.8% |
[ 35.5% - 36.0% ] 35.71% | 28 | 55.6% |
[ 39.0% - 39.5% ] 39.29% | 56 | 17.2% |
[ 44.5% - 45.0% ] 44.84% | 223 | 6.9% |
[ 47.0% - 47.5% ] 47.13% | 87 | 26.7% |
[ 49.0% - 49.5% ] 49.14% | 116 | 65.5% |
[ 64.0% - 64.5% ] 64.12% | 170 | 67.9% |