Cuban vs Immigrants from Sudan Married-Couple Family Poverty
COMPARE
Cuban
Immigrants from Sudan
Married-Couple Family Poverty
Married-Couple Family Poverty Comparison
Cubans
Immigrants from Sudan
6.8%
MARRIED-COUPLE FAMILY POVERTY
0.0/ 100
METRIC RATING
304th/ 347
METRIC RANK
5.7%
MARRIED-COUPLE FAMILY POVERTY
3.5/ 100
METRIC RATING
235th/ 347
METRIC RANK
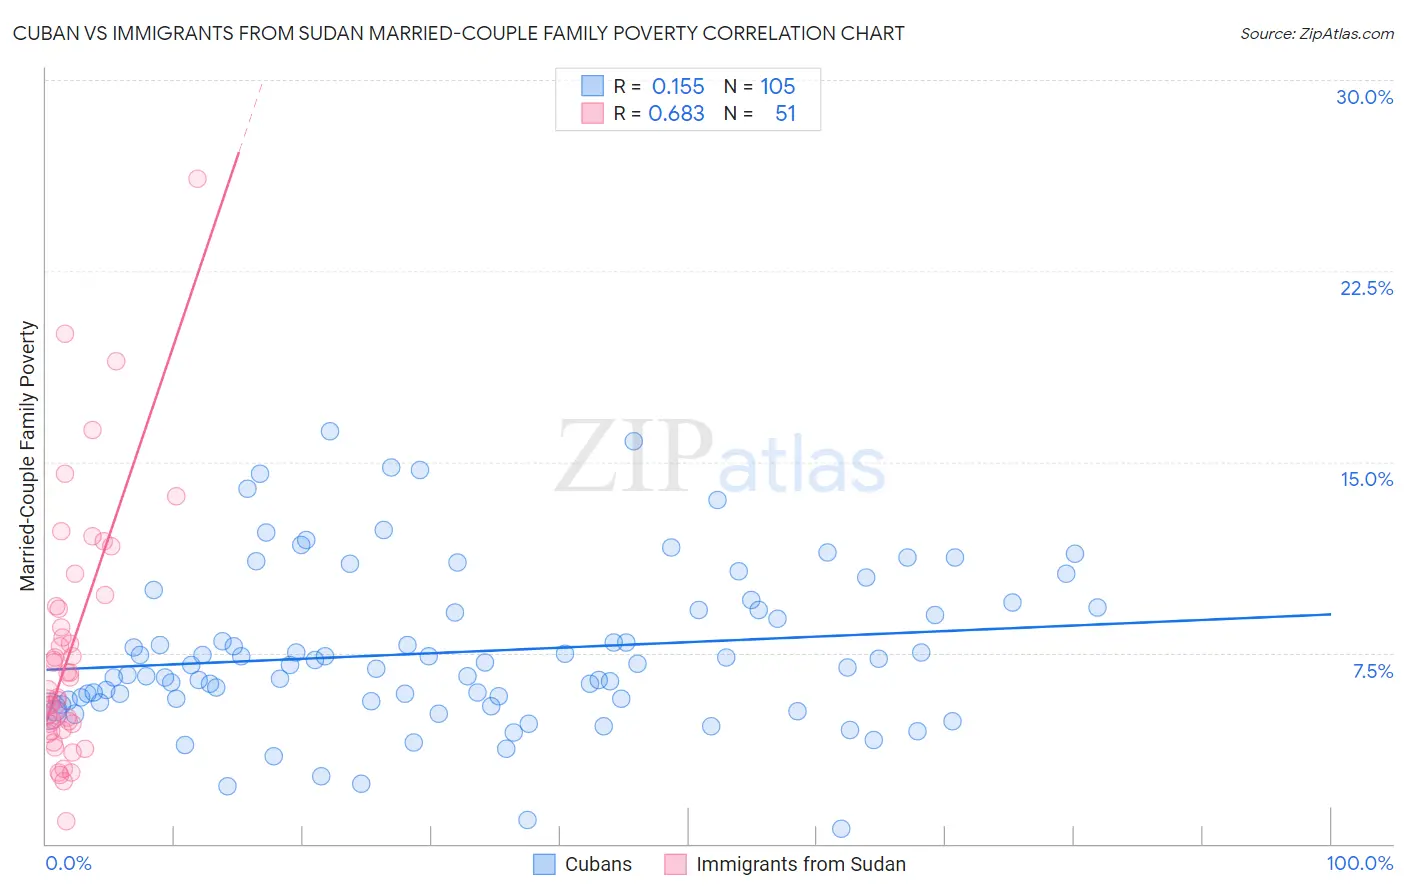
Cuban vs Immigrants from Sudan Married-Couple Family Poverty Correlation Chart
The statistical analysis conducted on geographies consisting of 444,866,425 people shows a poor positive correlation between the proportion of Cubans and poverty level among married-couple families in the United States with a correlation coefficient (R) of 0.155 and weighted average of 6.8%. Similarly, the statistical analysis conducted on geographies consisting of 118,776,869 people shows a significant positive correlation between the proportion of Immigrants from Sudan and poverty level among married-couple families in the United States with a correlation coefficient (R) of 0.683 and weighted average of 5.7%, a difference of 18.8%.
Married-Couple Family Poverty Correlation Summary
| Measurement | Cuban | Immigrants from Sudan |
| Minimum | 0.61% | 0.91% |
| Maximum | 16.2% | 26.1% |
| Range | 15.6% | 25.2% |
| Mean | 7.5% | 7.6% |
| Median | 7.0% | 6.0% |
| Interquartile 25% (IQ1) | 5.6% | 4.5% |
| Interquartile 75% (IQ3) | 9.2% | 9.3% |
| Interquartile Range (IQR) | 3.6% | 4.9% |
| Standard Deviation (Sample) | 3.1% | 4.9% |
| Standard Deviation (Population) | 3.1% | 4.9% |
Similar Demographics by Married-Couple Family Poverty
Demographics Similar to Cubans by Married-Couple Family Poverty
In terms of married-couple family poverty, the demographic groups most similar to Cubans are Haitian (6.8%, a difference of 0.10%), Immigrants from El Salvador (6.8%, a difference of 0.44%), Immigrants from Ecuador (6.7%, a difference of 0.72%), Central American (6.7%, a difference of 0.86%), and Immigrants from Belize (6.7%, a difference of 1.5%).
| Demographics | Rating | Rank | Married-Couple Family Poverty |
| Kiowa | 0.0 /100 | #297 | Tragic 6.6% |
| Immigrants | Guyana | 0.0 /100 | #298 | Tragic 6.7% |
| Nicaraguans | 0.0 /100 | #299 | Tragic 6.7% |
| Immigrants | Belize | 0.0 /100 | #300 | Tragic 6.7% |
| Central Americans | 0.0 /100 | #301 | Tragic 6.7% |
| Immigrants | Ecuador | 0.0 /100 | #302 | Tragic 6.7% |
| Immigrants | El Salvador | 0.0 /100 | #303 | Tragic 6.8% |
| Cubans | 0.0 /100 | #304 | Tragic 6.8% |
| Haitians | 0.0 /100 | #305 | Tragic 6.8% |
| Immigrants | Haiti | 0.0 /100 | #306 | Tragic 7.0% |
| Guatemalans | 0.0 /100 | #307 | Tragic 7.0% |
| Spanish American Indians | 0.0 /100 | #308 | Tragic 7.1% |
| Hopi | 0.0 /100 | #309 | Tragic 7.1% |
| Immigrants | Nicaragua | 0.0 /100 | #310 | Tragic 7.1% |
| Immigrants | Dominica | 0.0 /100 | #311 | Tragic 7.1% |
Demographics Similar to Immigrants from Sudan by Married-Couple Family Poverty
In terms of married-couple family poverty, the demographic groups most similar to Immigrants from Sudan are Ghanaian (5.7%, a difference of 0.16%), Immigrants from Colombia (5.7%, a difference of 0.19%), Immigrants from Uruguay (5.7%, a difference of 0.19%), Immigrants from South America (5.7%, a difference of 0.32%), and Immigrants from Laos (5.7%, a difference of 0.63%).
| Demographics | Rating | Rank | Married-Couple Family Poverty |
| Arabs | 5.4 /100 | #228 | Tragic 5.7% |
| Sub-Saharan Africans | 4.9 /100 | #229 | Tragic 5.7% |
| Moroccans | 4.9 /100 | #230 | Tragic 5.7% |
| Immigrants | Iraq | 4.4 /100 | #231 | Tragic 5.7% |
| Immigrants | Laos | 4.4 /100 | #232 | Tragic 5.7% |
| Immigrants | Colombia | 3.7 /100 | #233 | Tragic 5.7% |
| Immigrants | Uruguay | 3.7 /100 | #234 | Tragic 5.7% |
| Immigrants | Sudan | 3.5 /100 | #235 | Tragic 5.7% |
| Ghanaians | 3.3 /100 | #236 | Tragic 5.7% |
| Immigrants | South America | 3.1 /100 | #237 | Tragic 5.7% |
| Cherokee | 2.7 /100 | #238 | Tragic 5.8% |
| Venezuelans | 2.7 /100 | #239 | Tragic 5.8% |
| Fijians | 2.5 /100 | #240 | Tragic 5.8% |
| Immigrants | Panama | 2.5 /100 | #241 | Tragic 5.8% |
| Immigrants | Western Africa | 2.4 /100 | #242 | Tragic 5.8% |