Cuban vs Lumbee Married-Couple Family Poverty
COMPARE
Cuban
Lumbee
Married-Couple Family Poverty
Married-Couple Family Poverty Comparison
Cubans
Lumbee
6.8%
MARRIED-COUPLE FAMILY POVERTY
0.0/ 100
METRIC RATING
304th/ 347
METRIC RANK
8.3%
MARRIED-COUPLE FAMILY POVERTY
0.0/ 100
METRIC RATING
333rd/ 347
METRIC RANK
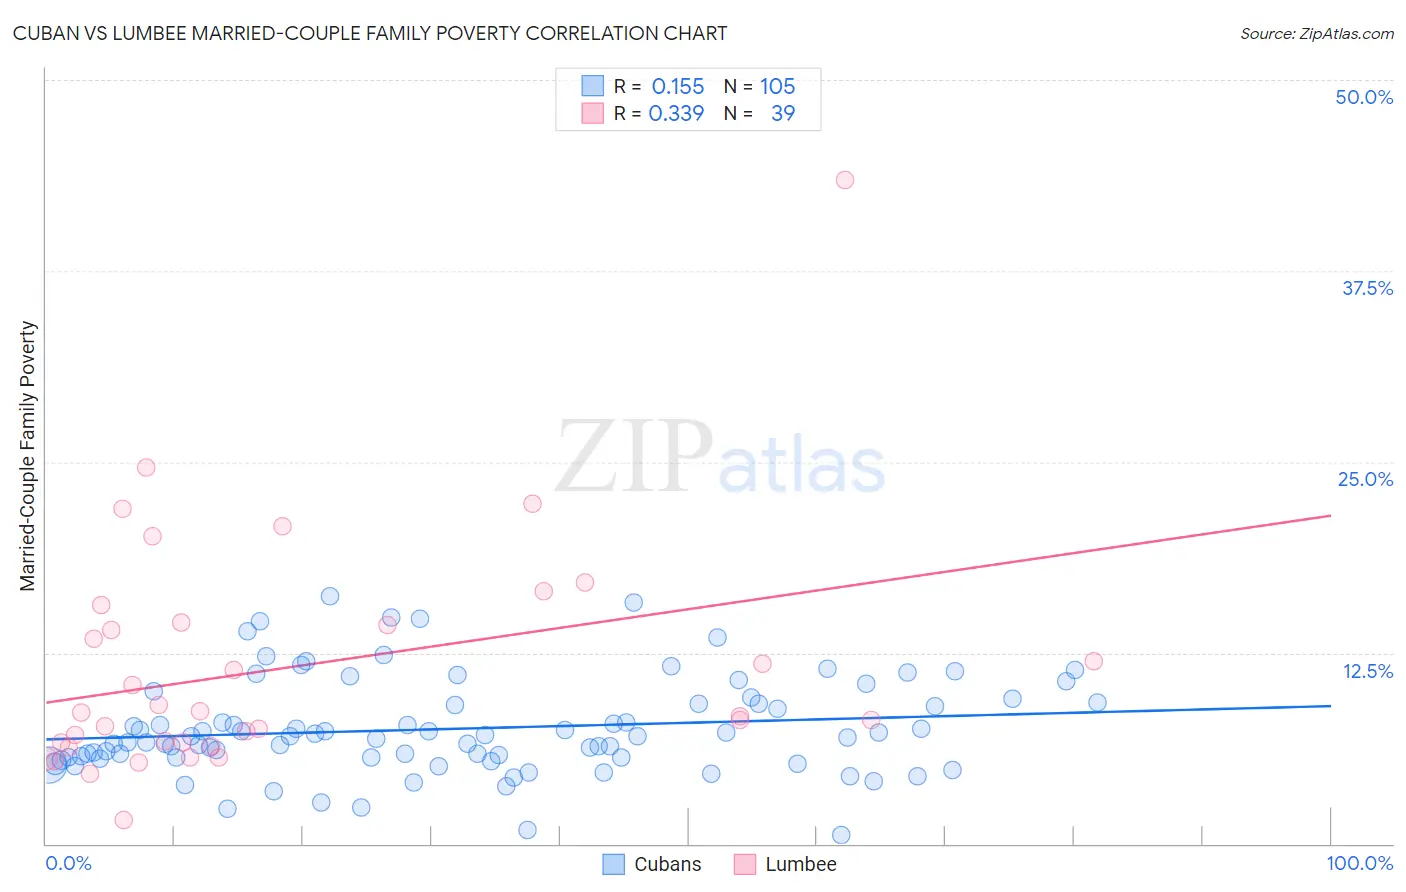
Cuban vs Lumbee Married-Couple Family Poverty Correlation Chart
The statistical analysis conducted on geographies consisting of 444,866,425 people shows a poor positive correlation between the proportion of Cubans and poverty level among married-couple families in the United States with a correlation coefficient (R) of 0.155 and weighted average of 6.8%. Similarly, the statistical analysis conducted on geographies consisting of 92,019,006 people shows a mild positive correlation between the proportion of Lumbee and poverty level among married-couple families in the United States with a correlation coefficient (R) of 0.339 and weighted average of 8.3%, a difference of 22.7%.
Married-Couple Family Poverty Correlation Summary
| Measurement | Cuban | Lumbee |
| Minimum | 0.61% | 1.5% |
| Maximum | 16.2% | 43.5% |
| Range | 15.6% | 41.9% |
| Mean | 7.5% | 11.6% |
| Median | 7.0% | 8.6% |
| Interquartile 25% (IQ1) | 5.6% | 6.6% |
| Interquartile 75% (IQ3) | 9.2% | 14.5% |
| Interquartile Range (IQR) | 3.6% | 7.9% |
| Standard Deviation (Sample) | 3.1% | 7.7% |
| Standard Deviation (Population) | 3.1% | 7.6% |
Similar Demographics by Married-Couple Family Poverty
Demographics Similar to Cubans by Married-Couple Family Poverty
In terms of married-couple family poverty, the demographic groups most similar to Cubans are Haitian (6.8%, a difference of 0.10%), Immigrants from El Salvador (6.8%, a difference of 0.44%), Immigrants from Ecuador (6.7%, a difference of 0.72%), Central American (6.7%, a difference of 0.86%), and Immigrants from Belize (6.7%, a difference of 1.5%).
| Demographics | Rating | Rank | Married-Couple Family Poverty |
| Kiowa | 0.0 /100 | #297 | Tragic 6.6% |
| Immigrants | Guyana | 0.0 /100 | #298 | Tragic 6.7% |
| Nicaraguans | 0.0 /100 | #299 | Tragic 6.7% |
| Immigrants | Belize | 0.0 /100 | #300 | Tragic 6.7% |
| Central Americans | 0.0 /100 | #301 | Tragic 6.7% |
| Immigrants | Ecuador | 0.0 /100 | #302 | Tragic 6.7% |
| Immigrants | El Salvador | 0.0 /100 | #303 | Tragic 6.8% |
| Cubans | 0.0 /100 | #304 | Tragic 6.8% |
| Haitians | 0.0 /100 | #305 | Tragic 6.8% |
| Immigrants | Haiti | 0.0 /100 | #306 | Tragic 7.0% |
| Guatemalans | 0.0 /100 | #307 | Tragic 7.0% |
| Spanish American Indians | 0.0 /100 | #308 | Tragic 7.1% |
| Hopi | 0.0 /100 | #309 | Tragic 7.1% |
| Immigrants | Nicaragua | 0.0 /100 | #310 | Tragic 7.1% |
| Immigrants | Dominica | 0.0 /100 | #311 | Tragic 7.1% |
Demographics Similar to Lumbee by Married-Couple Family Poverty
In terms of married-couple family poverty, the demographic groups most similar to Lumbee are Dominican (8.3%, a difference of 0.47%), Central American Indian (8.3%, a difference of 0.53%), Paiute (8.3%, a difference of 0.59%), Immigrants from Dominican Republic (8.4%, a difference of 0.68%), and Native/Alaskan (8.2%, a difference of 1.9%).
| Demographics | Rating | Rank | Married-Couple Family Poverty |
| Immigrants | Bangladesh | 0.0 /100 | #326 | Tragic 7.5% |
| Hispanics or Latinos | 0.0 /100 | #327 | Tragic 7.5% |
| Immigrants | Mexico | 0.0 /100 | #328 | Tragic 7.6% |
| Natives/Alaskans | 0.0 /100 | #329 | Tragic 8.2% |
| Paiute | 0.0 /100 | #330 | Tragic 8.3% |
| Central American Indians | 0.0 /100 | #331 | Tragic 8.3% |
| Dominicans | 0.0 /100 | #332 | Tragic 8.3% |
| Lumbee | 0.0 /100 | #333 | Tragic 8.3% |
| Immigrants | Dominican Republic | 0.0 /100 | #334 | Tragic 8.4% |
| Sioux | 0.0 /100 | #335 | Tragic 8.7% |
| Apache | 0.0 /100 | #336 | Tragic 9.0% |
| Yakama | 0.0 /100 | #337 | Tragic 9.0% |
| Cheyenne | 0.0 /100 | #338 | Tragic 9.4% |
| Crow | 0.0 /100 | #339 | Tragic 9.6% |
| Yuman | 0.0 /100 | #340 | Tragic 9.7% |