Cuban Wage/Income Gap
COMPARE
Cuban
Select to Compare
Wage/Income Gap
Cuban Wage/Income Gap
23.3%
WAGE/INCOME GAP
99.7/ 100
METRIC RATING
84th/ 347
METRIC RANK
Cuban Wage/Income Gap Correlation Chart
The statistical analysis conducted on geographies consisting of 448,898,454 people shows a poor negative correlation between the proportion of Cubans and wage/income gap percentage in the United States with a correlation coefficient (R) of -0.143 and weighted average of 23.3%. On average, for every 1% (one percent) increase in Cubans within a typical geography, there is a decrease of 0.047% in wage/income gap percentage.
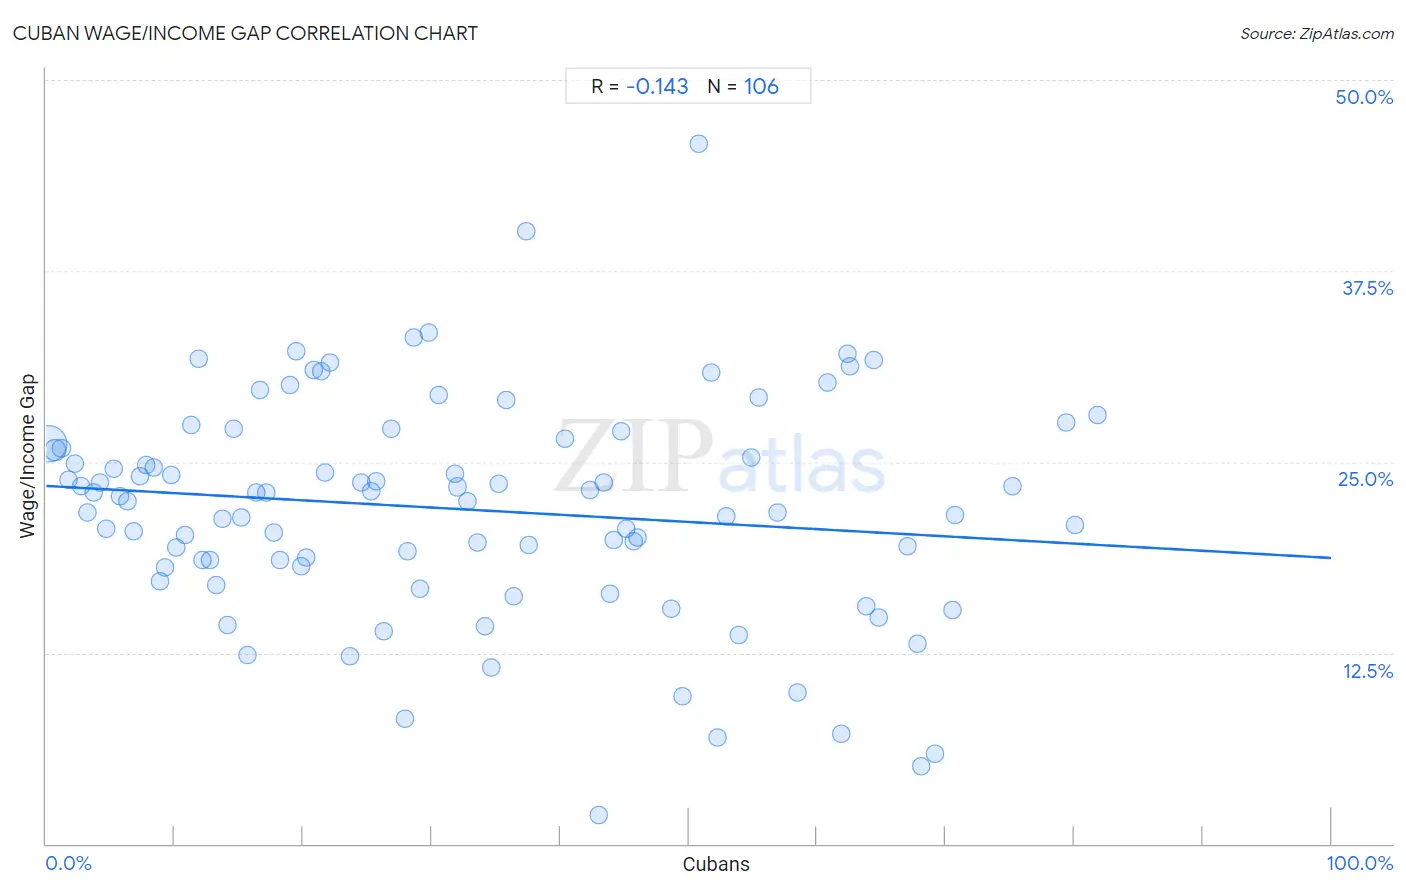
It is essential to understand that the correlation between the percentage of Cubans and wage/income gap percentage does not imply a direct cause-and-effect relationship. It remains uncertain whether the presence of Cubans influences an upward or downward trend in the level of wage/income gap percentage within an area, or if Cubans simply ended up residing in those areas with higher or lower levels of wage/income gap percentage due to other factors.
Demographics Similar to Cubans by Wage/Income Gap
In terms of wage/income gap, the demographic groups most similar to Cubans are Immigrants from Cambodia (23.3%, a difference of 0.050%), Cheyenne (23.3%, a difference of 0.26%), Yuman (23.3%, a difference of 0.31%), Immigrants from Africa (23.2%, a difference of 0.37%), and Immigrants from Panama (23.4%, a difference of 0.63%).
| Demographics | Rating | Rank | Wage/Income Gap |
| Africans | 99.9 /100 | #77 | Exceptional 22.9% |
| Nigerians | 99.9 /100 | #78 | Exceptional 23.0% |
| Immigrants from Nicaragua | 99.9 /100 | #79 | Exceptional 23.0% |
| Salvadorans | 99.9 /100 | #80 | Exceptional 23.0% |
| Bermudans | 99.8 /100 | #81 | Exceptional 23.1% |
| Central Americans | 99.8 /100 | #82 | Exceptional 23.1% |
| Immigrants from Africa | 99.8 /100 | #83 | Exceptional 23.2% |
| Cubans | 99.7 /100 | #84 | Exceptional 23.3% |
| Immigrants from Cambodia | 99.7 /100 | #85 | Exceptional 23.3% |
| Cheyenne | 99.7 /100 | #86 | Exceptional 23.3% |
| Yuman | 99.7 /100 | #87 | Exceptional 23.3% |
| Immigrants from Panama | 99.6 /100 | #88 | Exceptional 23.4% |
| Marshallese | 99.6 /100 | #89 | Exceptional 23.4% |
| Nicaraguans | 99.6 /100 | #90 | Exceptional 23.4% |
| Arapaho | 99.6 /100 | #91 | Exceptional 23.5% |
Cuban Wage/Income Gap Correlation Summary
| Measurement | Cuban Data | Wage/Income Gap Data |
| Minimum | 0.21% | 1.9% |
| Maximum | 81.9% | 45.8% |
| Range | 81.6% | 43.9% |
| Mean | 32.2% | 21.9% |
| Median | 28.4% | 22.6% |
| Interquartile 25% (IQ1) | 13.2% | 18.2% |
| Interquartile 75% (IQ3) | 49.5% | 26.2% |
| Interquartile Range (IQR) | 36.3% | 8.0% |
| Standard Deviation (Sample) | 22.3% | 7.3% |
| Standard Deviation (Population) | 22.2% | 7.3% |
Correlation Details
| Cuban Percentile | Sample Size | Wage/Income Gap |
[ 0.0% - 0.5% ] 0.21% | 333,446,004 | 26.2% |
[ 0.5% - 1.0% ] 0.69% | 60,525,502 | 25.8% |
[ 1.0% - 1.5% ] 1.21% | 16,838,645 | 25.9% |
[ 1.5% - 2.0% ] 1.70% | 9,821,041 | 23.8% |
[ 2.0% - 2.5% ] 2.24% | 5,651,395 | 24.9% |
[ 2.5% - 3.0% ] 2.73% | 4,776,695 | 23.4% |
[ 3.0% - 3.5% ] 3.24% | 2,345,893 | 21.7% |
[ 3.5% - 4.0% ] 3.73% | 1,872,837 | 23.0% |
[ 4.0% - 4.5% ] 4.22% | 1,147,875 | 23.6% |
[ 4.5% - 5.0% ] 4.71% | 836,705 | 20.6% |
[ 5.0% - 5.5% ] 5.27% | 851,170 | 24.6% |
[ 5.5% - 6.0% ] 5.70% | 729,437 | 22.8% |
[ 6.0% - 6.5% ] 6.28% | 529,061 | 22.4% |
[ 6.5% - 7.0% ] 6.78% | 348,872 | 20.5% |
[ 7.0% - 7.5% ] 7.31% | 457,870 | 24.1% |
[ 7.5% - 8.0% ] 7.75% | 859,446 | 24.8% |
[ 8.0% - 8.5% ] 8.34% | 346,527 | 24.6% |
[ 8.5% - 9.0% ] 8.86% | 332,988 | 17.2% |
[ 9.0% - 9.5% ] 9.27% | 250,273 | 18.1% |
[ 9.5% - 10.0% ] 9.71% | 127,628 | 24.2% |
[ 10.0% - 10.5% ] 10.11% | 282,270 | 19.4% |
[ 10.5% - 11.0% ] 10.76% | 169,546 | 20.2% |
[ 11.0% - 11.5% ] 11.25% | 198,376 | 27.4% |
[ 11.5% - 12.0% ] 11.83% | 84,658 | 31.7% |
[ 12.0% - 12.5% ] 12.16% | 189,386 | 18.5% |
[ 12.5% - 13.0% ] 12.79% | 139,706 | 18.5% |
[ 13.0% - 13.5% ] 13.25% | 253,483 | 16.9% |
[ 13.5% - 14.0% ] 13.75% | 142,462 | 21.2% |
[ 14.0% - 14.5% ] 14.07% | 30,868 | 14.3% |
[ 14.5% - 15.0% ] 14.62% | 100,449 | 27.1% |
[ 15.0% - 15.5% ] 15.14% | 354,114 | 21.3% |
[ 15.5% - 16.0% ] 15.67% | 7,385 | 12.4% |
[ 16.0% - 16.5% ] 16.37% | 56,271 | 23.0% |
[ 16.5% - 17.0% ] 16.65% | 17,817 | 29.7% |
[ 17.0% - 17.5% ] 17.13% | 148,118 | 23.0% |
[ 17.5% - 18.0% ] 17.73% | 84,824 | 20.4% |
[ 18.0% - 18.5% ] 18.15% | 180,995 | 18.6% |
[ 18.5% - 19.0% ] 18.94% | 75,635 | 30.0% |
[ 19.0% - 19.5% ] 19.48% | 13,265 | 32.2% |
[ 19.5% - 20.0% ] 19.81% | 96,744 | 18.2% |
[ 20.0% - 20.5% ] 20.27% | 79,996 | 18.7% |
[ 20.5% - 21.0% ] 20.86% | 124,371 | 31.0% |
[ 21.0% - 21.5% ] 21.40% | 53,076 | 31.0% |
[ 21.5% - 22.0% ] 21.70% | 40,853 | 24.3% |
[ 22.0% - 22.5% ] 22.05% | 77,008 | 31.5% |
[ 23.5% - 24.0% ] 23.67% | 50,571 | 12.3% |
[ 24.5% - 25.0% ] 24.55% | 10,609 | 23.6% |
[ 25.0% - 25.5% ] 25.25% | 123,956 | 23.1% |
[ 25.5% - 26.0% ] 25.70% | 126,156 | 23.7% |
[ 26.0% - 26.5% ] 26.23% | 33,851 | 13.9% |
[ 26.5% - 27.0% ] 26.84% | 56,068 | 27.2% |
[ 27.5% - 28.0% ] 27.92% | 15,184 | 8.2% |
[ 28.0% - 28.5% ] 28.15% | 96,294 | 19.2% |
[ 28.5% - 29.0% ] 28.65% | 81,384 | 33.2% |
[ 29.0% - 29.5% ] 29.11% | 35,969 | 16.7% |
[ 29.5% - 30.0% ] 29.72% | 44,956 | 33.5% |
[ 30.5% - 31.0% ] 30.58% | 70,408 | 29.4% |
[ 31.5% - 32.0% ] 31.84% | 112,692 | 24.3% |
[ 32.0% - 32.5% ] 32.04% | 497,852 | 23.4% |
[ 32.5% - 33.0% ] 32.78% | 149,749 | 22.5% |
[ 33.5% - 34.0% ] 33.61% | 80,738 | 19.8% |
[ 34.0% - 34.5% ] 34.13% | 46,844 | 14.2% |
[ 34.5% - 35.0% ] 34.64% | 78,402 | 11.6% |
[ 35.0% - 35.5% ] 35.19% | 147,444 | 23.6% |
[ 35.5% - 36.0% ] 35.76% | 17,902 | 29.0% |
[ 36.0% - 36.5% ] 36.36% | 23,799 | 16.2% |
[ 37.0% - 37.5% ] 37.36% | 4,106 | 40.1% |
[ 37.5% - 38.0% ] 37.56% | 26,994 | 19.5% |
[ 40.0% - 40.5% ] 40.39% | 40,278 | 26.5% |
[ 42.0% - 42.5% ] 42.36% | 88,933 | 23.2% |
[ 42.5% - 43.0% ] 42.99% | 29,240 | 1.9% |
[ 43.0% - 43.5% ] 43.35% | 76,412 | 23.7% |
[ 43.5% - 44.0% ] 43.83% | 105,481 | 16.4% |
[ 44.0% - 44.5% ] 44.15% | 56,791 | 19.9% |
[ 44.5% - 45.0% ] 44.76% | 45,669 | 27.0% |
[ 45.0% - 45.5% ] 45.18% | 35,705 | 20.6% |
[ 45.5% - 46.0% ] 45.68% | 68,602 | 19.8% |
[ 46.0% - 46.5% ] 46.05% | 33,026 | 20.1% |
[ 48.5% - 49.0% ] 48.64% | 81,858 | 15.4% |
[ 49.5% - 50.0% ] 49.52% | 519 | 9.6% |
[ 50.5% - 51.0% ] 50.74% | 3,400 | 45.8% |
[ 51.5% - 52.0% ] 51.73% | 34,335 | 30.8% |
[ 52.0% - 52.5% ] 52.27% | 13,163 | 6.9% |
[ 52.5% - 53.0% ] 52.97% | 29,530 | 21.4% |
[ 53.5% - 54.0% ] 53.91% | 42,710 | 13.7% |
[ 54.5% - 55.0% ] 54.83% | 34,057 | 25.3% |
[ 55.0% - 55.5% ] 55.44% | 19,399 | 29.2% |
[ 56.5% - 57.0% ] 56.95% | 52,661 | 21.7% |
[ 58.0% - 58.5% ] 58.48% | 43,702 | 9.9% |
[ 60.5% - 61.0% ] 60.80% | 52,101 | 30.2% |
[ 61.5% - 62.0% ] 61.83% | 30,621 | 7.2% |
[ 62.0% - 62.5% ] 62.37% | 13,877 | 32.1% |
[ 62.5% - 63.0% ] 62.57% | 55,241 | 31.3% |
[ 63.5% - 64.0% ] 63.81% | 52,851 | 15.6% |
[ 64.0% - 64.5% ] 64.40% | 53,765 | 31.6% |
[ 64.5% - 65.0% ] 64.80% | 24,597 | 14.8% |
[ 67.0% - 67.5% ] 67.07% | 45,620 | 19.5% |
[ 67.5% - 68.0% ] 67.76% | 104,796 | 13.1% |
[ 68.0% - 68.5% ] 68.14% | 10,725 | 5.1% |
[ 69.0% - 69.5% ] 69.21% | 20,850 | 5.9% |
[ 70.0% - 70.5% ] 70.48% | 53,065 | 15.3% |
[ 70.5% - 71.0% ] 70.69% | 22,815 | 21.5% |
[ 75.0% - 75.5% ] 75.16% | 249,592 | 23.4% |
[ 79.0% - 79.5% ] 79.36% | 42,081 | 27.6% |
[ 80.0% - 80.5% ] 80.06% | 71,088 | 20.9% |
[ 81.5% - 82.0% ] 81.85% | 29,830 | 28.1% |