Bermudan Wage/Income Gap

COMPARE

Bermudan
Race
Ancestry
AfghanAfricanAlaska NativeAlaskan AthabascanAlbanianAleutAlsatianAmericanApacheArabArapahoArgentineanArmenianAssyrian/Chaldean/SyriacAustralianAustrianBahamianBangladeshiBarbadianBasqueBelgianBelizeanBermudanBhutaneseBlackfeetBolivianBrazilianBritishBritish West IndianBulgarianBurmeseCajunCambodianCanadianCape VerdeanCarpatho RusynCelticCentral AmericanCentral American IndianCherokeeCheyenneChickasawChileanChineseChippewaChoctawColombianColvilleComancheCosta RicanCreeCreekCroatianCrowCubanCypriotCzechCzechoslovakianDanishDelawareDominicanDutchDutch West IndianEastern EuropeanEcuadorianEgyptianEnglishEstonianEthiopianEuropeanFijianFilipinoFinnishFrenchFrench American IndianFrench CanadianGermanGerman RussianGhanaianGreekGuamanian/ChamorroGuatemalanGuyaneseHaitianHmongHonduranHopiHoumaHungarianIcelanderIndian (Asian)IndonesianInupiatIranianIraqiIrishIroquoisIsraeliItalianJamaicanJapaneseJordanianKenyanKiowaKoreanLaotianLatvianLebaneseLiberianLithuanianLumbeeLuxembourgerMacedonianMalaysianMalteseMarshalleseMenomineeMexicanMexican American IndianMongolianMoroccanNative HawaiianNavajoNepaleseNew ZealanderNicaraguanNigerianNorthern EuropeanNorwegianOkinawanOsageOttawaPaiutePakistaniPalestinianPanamanianParaguayanPennsylvania GermanPeruvianPimaPolishPortuguesePotawatomiPuebloPuerto RicanPuget Sound SalishRomanianRussianSalvadoranSamoanScandinavianScotch-IrishScottishSeminoleSenegaleseSerbianShoshoneSierra LeoneanSiouxSlavicSlovakSloveneSomaliSouth AfricanSouth AmericanSouth American IndianSoviet UnionSpaniardSpanishSpanish AmericanSpanish American IndianSri LankanSubsaharan AfricanSudaneseSwedishSwissSyrianTaiwaneseThaiTlingit-HaidaTohono O'OdhamTonganTrinidadian and TobagonianTsimshianTurkishU.S. Virgin IslanderUgandanUkrainianUruguayanUteVenezuelanVietnameseWelshWest IndianYakamaYaquiYugoslavianYumanYup'ikZimbabwean
Immigration
NonimmigrantsImmigrantsAfghanistanAfricaAlbaniaArgentinaArmeniaAsiaAustraliaAustriaBahamasBangladeshBarbadosBelarusBelgiumBelizeBoliviaBosnia and HerzegovinaBrazilBulgariaBurma/MyanmarCabo VerdeCambodiaCameroonCanadaCaribbeanCentral AmericaChileChinaColombiaCongoCosta RicaCroatiaCubaCzechoslovakiaDenmarkDominicaDominican RepublicEastern AfricaEastern AsiaEastern EuropeEcuadorEgyptEl SalvadorEnglandEritreaEthiopiaEuropeFijiFranceGermanyGhanaGreeceGrenadaGuatemalaGuyanaHaitiHondurasHong KongHungaryIndiaIndonesiaIranIraqIrelandIsraelItalyJamaicaJapanJordanKazakhstanKenyaKoreaKuwaitLaosLatin AmericaLatviaLebanonLiberiaLithuaniaMalaysiaMexicoMicronesiaMiddle AfricaMoldovaMoroccoNepalNetherlandsNicaraguaNigeriaNorth AmericaNorth MacedoniaNorthern AfricaNorthern EuropeNorwayOceaniaPakistanPanamaPeruPhilippinesPolandPortugalRomaniaRussiaSaudi ArabiaScotlandSenegalSerbiaSierra LeoneSingaporeSomaliaSouth AfricaSouth AmericaSouth Central AsiaSouth Eastern AsiaSouthern EuropeSpainSri LankaSt. Vincent and the GrenadinesSudanSwedenSwitzerlandSyriaTaiwanThailandTrinidad and TobagoTurkeyUgandaUkraineUruguayUzbekistanVenezuelaVietnamWest IndiesWestern AfricaWestern AsiaWestern EuropeYemenZaireZimbabweAzores
Select to Compare
Race
Ancestry
AfghanAfricanAlaska NativeAlaskan AthabascanAlbanianAleutAlsatianAmericanApacheArabArapahoArgentineanArmenianAssyrian/Chaldean/SyriacAustralianAustrianBahamianBangladeshiBarbadianBasqueBelgianBelizeanBhutaneseBlackfeetBolivianBrazilianBritishBritish West IndianBulgarianBurmeseCajunCambodianCanadianCape VerdeanCarpatho RusynCelticCentral AmericanCentral American IndianCherokeeCheyenneChickasawChileanChineseChippewaChoctawColombianColvilleComancheCosta RicanCreeCreekCroatianCrowCubanCypriotCzechCzechoslovakianDanishDelawareDominicanDutchDutch West IndianEastern EuropeanEcuadorianEgyptianEnglishEstonianEthiopianEuropeanFijianFilipinoFinnishFrenchFrench American IndianFrench CanadianGermanGerman RussianGhanaianGreekGuamanian/ChamorroGuatemalanGuyaneseHaitianHmongHonduranHopiHoumaHungarianIcelanderIndian (Asian)IndonesianInupiatIranianIraqiIrishIroquoisIsraeliItalianJamaicanJapaneseJordanianKenyanKiowaKoreanLaotianLatvianLebaneseLiberianLithuanianLumbeeLuxembourgerMacedonianMalaysianMalteseMarshalleseMenomineeMexicanMexican American IndianMongolianMoroccanNative HawaiianNavajoNepaleseNew ZealanderNicaraguanNigerianNorthern EuropeanNorwegianOkinawanOsageOttawaPaiutePakistaniPalestinianPanamanianParaguayanPennsylvania GermanPeruvianPimaPolishPortuguesePotawatomiPuebloPuerto RicanPuget Sound SalishRomanianRussianSalvadoranSamoanScandinavianScotch-IrishScottishSeminoleSenegaleseSerbianShoshoneSierra LeoneanSiouxSlavicSlovakSloveneSomaliSouth AfricanSouth AmericanSouth American IndianSoviet UnionSpaniardSpanishSpanish AmericanSpanish American IndianSri LankanSubsaharan AfricanSudaneseSwedishSwissSyrianTaiwaneseThaiTlingit-HaidaTohono O'OdhamTonganTrinidadian and TobagonianTsimshianTurkishU.S. Virgin IslanderUgandanUkrainianUruguayanUteVenezuelanVietnameseWelshWest IndianYakamaYaquiYugoslavianYumanYup'ikZimbabwean
Immigration
NonimmigrantsImmigrantsAfghanistanAfricaAlbaniaArgentinaArmeniaAsiaAustraliaAustriaBahamasBangladeshBarbadosBelarusBelgiumBelizeBoliviaBosnia and HerzegovinaBrazilBulgariaBurma/MyanmarCabo VerdeCambodiaCameroonCanadaCaribbeanCentral AmericaChileChinaColombiaCongoCosta RicaCroatiaCubaCzechoslovakiaDenmarkDominicaDominican RepublicEastern AfricaEastern AsiaEastern EuropeEcuadorEgyptEl SalvadorEnglandEritreaEthiopiaEuropeFijiFranceGermanyGhanaGreeceGrenadaGuatemalaGuyanaHaitiHondurasHong KongHungaryIndiaIndonesiaIranIraqIrelandIsraelItalyJamaicaJapanJordanKazakhstanKenyaKoreaKuwaitLaosLatin AmericaLatviaLebanonLiberiaLithuaniaMalaysiaMexicoMicronesiaMiddle AfricaMoldovaMoroccoNepalNetherlandsNicaraguaNigeriaNorth AmericaNorth MacedoniaNorthern AfricaNorthern EuropeNorwayOceaniaPakistanPanamaPeruPhilippinesPolandPortugalRomaniaRussiaSaudi ArabiaScotlandSenegalSerbiaSierra LeoneSingaporeSomaliaSouth AfricaSouth AmericaSouth Central AsiaSouth Eastern AsiaSouthern EuropeSpainSri LankaSt. Vincent and the GrenadinesSudanSwedenSwitzerlandSyriaTaiwanThailandTrinidad and TobagoTurkeyUgandaUkraineUruguayUzbekistanVenezuelaVietnamWest IndiesWestern AfricaWestern AsiaWestern EuropeYemenZaireZimbabweAzores
Wage/Income Gap
Income
Poverty
Unemployment
Labor Participation
Family Structure
Vehicle Availability
Education Level
Disability

Bermudan Wage/Income Gap
Exceptional

23.1%
WAGE/INCOME GAP
99.8/ 100
METRIC RATING
81st/ 347
METRIC RANK

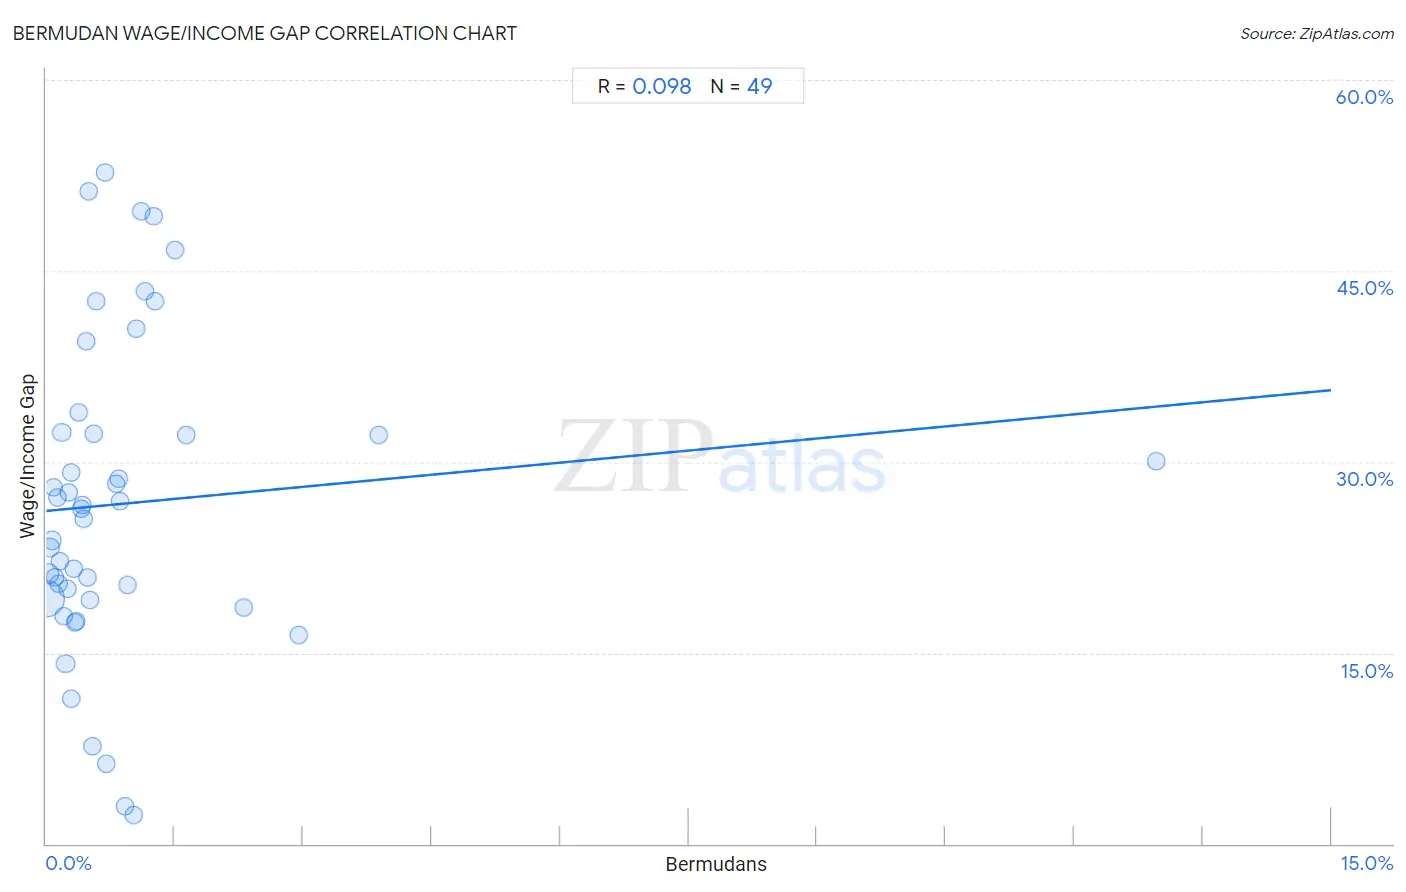
Bermudan Wage/Income Gap Correlation Chart

The statistical analysis conducted on geographies consisting of 55,726,543 people shows a slight positive correlation between the proportion of Bermudans and wage/income gap percentage in the United States with a correlation coefficient (R) of 0.098 and weighted average of 23.1%. On average, for every 1% (one percent) increase in Bermudans within a typical geography, there is an increase of 0.63% in wage/income gap percentage.
Bermudan Wage/Income Gap
It is essential to understand that the correlation between the percentage of Bermudans and wage/income gap percentage does not imply a direct cause-and-effect relationship. It remains uncertain whether the presence of Bermudans influences an upward or downward trend in the level of wage/income gap percentage within an area, or if Bermudans simply ended up residing in those areas with higher or lower levels of wage/income gap percentage due to other factors.

Demographics Similar to Bermudans by Wage/Income Gap

In terms of wage/income gap, the demographic groups most similar to Bermudans are Central American (23.1%, a difference of 0.0%), Immigrants from Africa (23.2%, a difference of 0.29%), Salvadoran (23.0%, a difference of 0.47%), Immigrants from Nicaragua (23.0%, a difference of 0.54%), and Nigerian (23.0%, a difference of 0.62%).
DemographicsRating | RankWage/Income Gap
Immigrants from Burma/Myanmar
99.9
/100
|
#74
Exceptional
22.8%
Fijians
99.9
/100
|
#75
Exceptional
22.9%
Ecuadorians
99.9
/100
|
#76
Exceptional
22.9%
Africans
99.9
/100
|
#77
Exceptional
22.9%
Nigerians
99.9
/100
|
#78
Exceptional
23.0%
Immigrants from Nicaragua
99.9
/100
|
#79
Exceptional
23.0%
Salvadorans
99.9
/100
|
#80
Exceptional
23.0%
Bermudans
99.8
/100
|
#81
Exceptional
23.1%
Central Americans
99.8
/100
|
#82
Exceptional
23.1%
Immigrants from Africa
99.8
/100
|
#83
Exceptional
23.2%
Cubans
99.7
/100
|
#84
Exceptional
23.3%
Immigrants from Cambodia
99.7
/100
|
#85
Exceptional
23.3%
Cheyenne
99.7
/100
|
#86
Exceptional
23.3%
Yuman
99.7
/100
|
#87
Exceptional
23.3%
Immigrants from Panama
99.6
/100
|
#88
Exceptional
23.4%

Bermudan Wage/Income Gap Correlation Summary

MeasurementBermudan DataWage/Income Gap Data
Minimum0.0057%2.2%
Maximum13.0%52.7%
Range13.0%50.5%
Mean0.95%26.7%
Median0.48%26.3%
Interquartile 25% (IQ1)0.24%19.2%
Interquartile 75% (IQ3)0.98%32.3%
Interquartile Range (IQR)0.74%13.1%
Standard Deviation (Sample)1.9%12.3%
Standard Deviation (Population)1.9%12.1%

Correlation Details

Bermudan PercentileSample SizeWage/Income Gap
[
0.0%
-
0.5%
]
0.0057%
42,083,12219.2%
[
0.0%
-
0.5%
]
0.027%
5,755,74521.2%
[
0.0%
-
0.5%
]
0.046%
2,608,68123.3%
[
0.0%
-
0.5%
]
0.067%
1,350,23023.8%
[
0.0%
-
0.5%
]
0.087%
886,56228.0%
[
0.0%
-
0.5%
]
0.11%
582,21120.9%
[
0.0%
-
0.5%
]
0.13%
180,20127.2%
[
0.0%
-
0.5%
]
0.15%
364,44620.5%
[
0.0%
-
0.5%
]
0.16%
196,46922.2%
[
0.0%
-
0.5%
]
0.18%
329,04132.3%
[
0.0%
-
0.5%
]
0.20%
212,77217.8%
[
0.0%
-
0.5%
]
0.23%
122,99314.1%
[
0.0%
-
0.5%
]
0.25%
59,22320.0%
[
0.0%
-
0.5%
]
0.26%
198,95927.6%
[
0.0%
-
0.5%
]
0.29%
82,84729.2%
[
0.0%
-
0.5%
]
0.30%
99,45911.4%
[
0.0%
-
0.5%
]
0.32%
29,91021.6%
[
0.0%
-
0.5%
]
0.34%
40,37317.4%
[
0.0%
-
0.5%
]
0.35%
73,99517.5%
[
0.0%
-
0.5%
]
0.38%
17,67133.9%
[
0.0%
-
0.5%
]
0.40%
23,33526.3%
[
0.0%
-
0.5%
]
0.42%
72,98926.6%
[
0.0%
-
0.5%
]
0.44%
3,21225.6%
[
0.0%
-
0.5%
]
0.46%
45,26939.5%
[
0.0%
-
0.5%
]
0.48%
33,52320.9%
[
0.0%
-
0.5%
]
0.49%
2,03951.2%
[
0.5%
-
1.0%
]
0.51%
7,64819.1%
[
0.5%
-
1.0%
]
0.54%
48,3617.7%
[
0.5%
-
1.0%
]
0.55%
62,89132.2%
[
0.5%
-
1.0%
]
0.59%
3,40642.6%
[
0.5%
-
1.0%
]
0.68%
2,05052.7%
[
0.5%
-
1.0%
]
0.70%
5,1156.2%
[
0.5%
-
1.0%
]
0.82%
10,60228.3%
[
0.5%
-
1.0%
]
0.85%
51,93828.7%
[
0.5%
-
1.0%
]
0.86%
3,00626.9%
[
0.5%
-
1.0%
]
0.92%
5,3382.9%
[
0.5%
-
1.0%
]
0.95%
4,22120.3%
[
1.0%
-
1.5%
]
1.01%
24,5512.2%
[
1.0%
-
1.5%
]
1.05%
1,81840.4%
[
1.0%
-
1.5%
]
1.12%
89649.7%
[
1.0%
-
1.5%
]
1.16%
9,76743.4%
[
1.0%
-
1.5%
]
1.25%
8,00249.3%
[
1.0%
-
1.5%
]
1.27%
8,32642.7%
[
1.0%
-
1.5%
]
1.50%
46846.6%
[
1.5%
-
2.0%
]
1.64%
2,69032.1%
[
2.0%
-
2.5%
]
2.31%
3,77018.6%
[
2.5%
-
3.0%
]
2.94%
37416.4%
[
3.5%
-
4.0%
]
3.89%
5,48032.1%
[
12.5%
-
13.0%
]
12.96%
54830.1%