Bermudan vs Brazilian Married-Couple Family Poverty
COMPARE
Bermudan
Brazilian
Married-Couple Family Poverty
Married-Couple Family Poverty Comparison
Bermudans
Brazilians
5.2%
MARRIED-COUPLE FAMILY POVERTY
52.9/ 100
METRIC RATING
171st/ 347
METRIC RANK
5.0%
MARRIED-COUPLE FAMILY POVERTY
78.3/ 100
METRIC RATING
150th/ 347
METRIC RANK
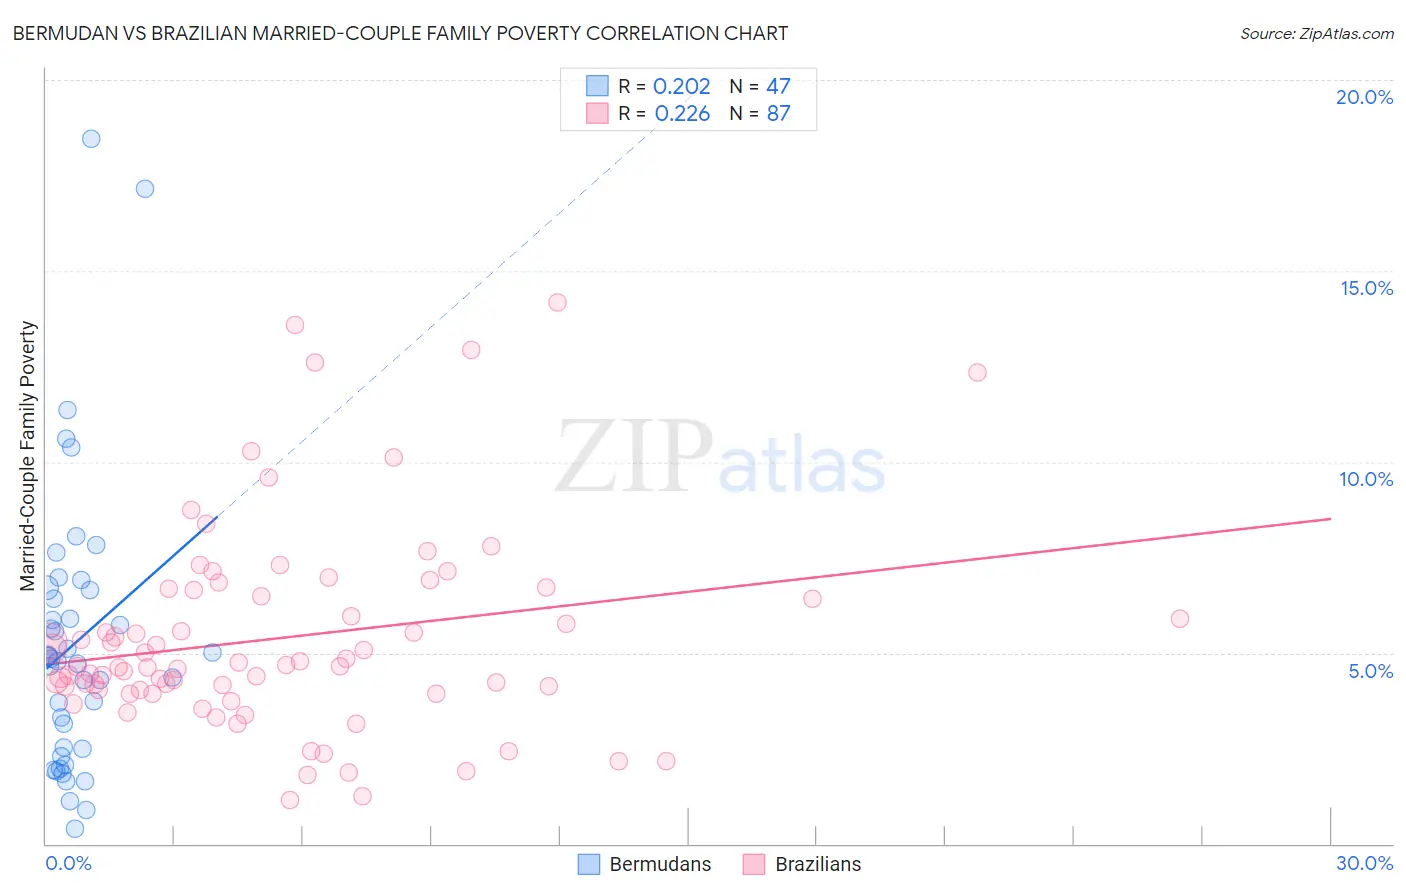
Bermudan vs Brazilian Married-Couple Family Poverty Correlation Chart
The statistical analysis conducted on geographies consisting of 55,613,061 people shows a weak positive correlation between the proportion of Bermudans and poverty level among married-couple families in the United States with a correlation coefficient (R) of 0.202 and weighted average of 5.2%. Similarly, the statistical analysis conducted on geographies consisting of 321,555,687 people shows a weak positive correlation between the proportion of Brazilians and poverty level among married-couple families in the United States with a correlation coefficient (R) of 0.226 and weighted average of 5.0%, a difference of 3.5%.
Married-Couple Family Poverty Correlation Summary
| Measurement | Bermudan | Brazilian |
| Minimum | 0.39% | 1.1% |
| Maximum | 18.5% | 14.2% |
| Range | 18.1% | 13.0% |
| Mean | 5.3% | 5.4% |
| Median | 4.9% | 4.6% |
| Interquartile 25% (IQ1) | 2.5% | 4.0% |
| Interquartile 75% (IQ3) | 6.6% | 6.6% |
| Interquartile Range (IQR) | 4.1% | 2.6% |
| Standard Deviation (Sample) | 3.7% | 2.7% |
| Standard Deviation (Population) | 3.6% | 2.7% |
Similar Demographics by Married-Couple Family Poverty
Demographics Similar to Bermudans by Married-Couple Family Poverty
In terms of married-couple family poverty, the demographic groups most similar to Bermudans are Immigrants from Argentina (5.2%, a difference of 0.18%), Immigrants from Northern Africa (5.2%, a difference of 0.18%), Ottawa (5.2%, a difference of 0.19%), Alsatian (5.2%, a difference of 0.20%), and Immigrants from Uganda (5.2%, a difference of 0.23%).
| Demographics | Rating | Rank | Married-Couple Family Poverty |
| Hawaiians | 62.3 /100 | #164 | Good 5.1% |
| Immigrants | Malaysia | 62.2 /100 | #165 | Good 5.1% |
| Paraguayans | 61.5 /100 | #166 | Good 5.1% |
| Costa Ricans | 61.5 /100 | #167 | Good 5.1% |
| Immigrants | Uganda | 54.9 /100 | #168 | Average 5.2% |
| Ottawa | 54.5 /100 | #169 | Average 5.2% |
| Immigrants | Argentina | 54.4 /100 | #170 | Average 5.2% |
| Bermudans | 52.9 /100 | #171 | Average 5.2% |
| Immigrants | Northern Africa | 51.3 /100 | #172 | Average 5.2% |
| Alsatians | 51.2 /100 | #173 | Average 5.2% |
| Immigrants | Eastern Africa | 50.0 /100 | #174 | Average 5.2% |
| Marshallese | 47.9 /100 | #175 | Average 5.2% |
| Menominee | 47.8 /100 | #176 | Average 5.2% |
| Immigrants | Kazakhstan | 45.1 /100 | #177 | Average 5.2% |
| Immigrants | Ukraine | 44.9 /100 | #178 | Average 5.2% |
Demographics Similar to Brazilians by Married-Couple Family Poverty
In terms of married-couple family poverty, the demographic groups most similar to Brazilians are Immigrants from Oceania (5.0%, a difference of 0.050%), Syrian (5.0%, a difference of 0.080%), Immigrants from Russia (5.0%, a difference of 0.080%), Immigrants from Cameroon (5.0%, a difference of 0.17%), and Albanian (5.0%, a difference of 0.19%).
| Demographics | Rating | Rank | Married-Couple Family Poverty |
| Immigrants | Egypt | 83.4 /100 | #143 | Excellent 5.0% |
| Hmong | 83.2 /100 | #144 | Excellent 5.0% |
| Immigrants | Spain | 79.9 /100 | #145 | Good 5.0% |
| Mongolians | 79.8 /100 | #146 | Good 5.0% |
| Syrians | 78.7 /100 | #147 | Good 5.0% |
| Immigrants | Russia | 78.7 /100 | #148 | Good 5.0% |
| Immigrants | Oceania | 78.6 /100 | #149 | Good 5.0% |
| Brazilians | 78.3 /100 | #150 | Good 5.0% |
| Immigrants | Cameroon | 77.3 /100 | #151 | Good 5.0% |
| Albanians | 77.2 /100 | #152 | Good 5.0% |
| Immigrants | Kuwait | 76.3 /100 | #153 | Good 5.0% |
| Delaware | 73.7 /100 | #154 | Good 5.1% |
| Immigrants | Ethiopia | 72.4 /100 | #155 | Good 5.1% |
| Sri Lankans | 72.2 /100 | #156 | Good 5.1% |
| Argentineans | 70.7 /100 | #157 | Good 5.1% |