Bahamian Unemployment Among Women with Children Ages 6 to 17 years
COMPARE
Bahamian
Select to Compare
Unemployment Among Women with Children Ages 6 to 17 years
Bahamian Unemployment Among Women with Children Ages 6 to 17 years
10.4%
UNEMPLOYMENT | WOMEN W/ CHILDREN 6 TO 17
0.0/ 100
METRIC RATING
315th/ 347
METRIC RANK
Bahamian Unemployment Among Women with Children Ages 6 to 17 years Correlation Chart
The statistical analysis conducted on geographies consisting of 97,201,604 people shows a poor positive correlation between the proportion of Bahamians and unemployment rate among women with children between the ages 6 and 17 in the United States with a correlation coefficient (R) of 0.104 and weighted average of 10.4%. On average, for every 1% (one percent) increase in Bahamians within a typical geography, there is an increase of 0.73% in unemployment rate among women with children between the ages 6 and 17.
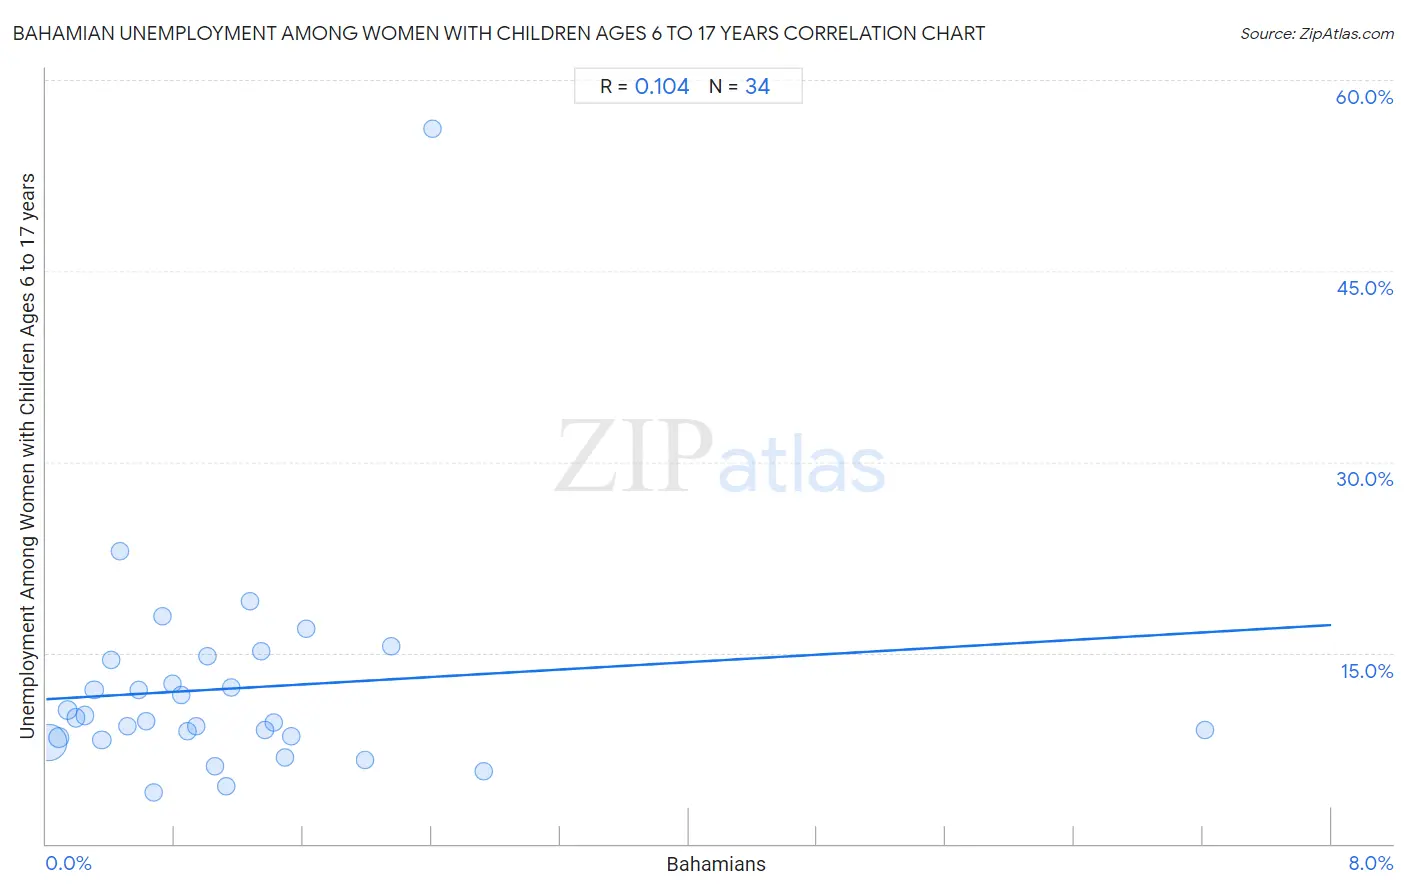
It is essential to understand that the correlation between the percentage of Bahamians and unemployment rate among women with children between the ages 6 and 17 does not imply a direct cause-and-effect relationship. It remains uncertain whether the presence of Bahamians influences an upward or downward trend in the level of unemployment rate among women with children between the ages 6 and 17 within an area, or if Bahamians simply ended up residing in those areas with higher or lower levels of unemployment rate among women with children between the ages 6 and 17 due to other factors.
Demographics Similar to Bahamians by Unemployment Among Women with Children Ages 6 to 17 years
In terms of unemployment among women with children ages 6 to 17 years, the demographic groups most similar to Bahamians are Immigrants from Cabo Verde (10.4%, a difference of 0.030%), American (10.4%, a difference of 0.080%), African (10.4%, a difference of 0.26%), Immigrants from Dominica (10.5%, a difference of 0.75%), and Bermudan (10.5%, a difference of 0.87%).
| Demographics | Rating | Rank | Unemployment Among Women with Children Ages 6 to 17 years |
| Dutch West Indians | 0.0 /100 | #308 | Tragic 10.2% |
| French Canadians | 0.0 /100 | #309 | Tragic 10.3% |
| Alaska Natives | 0.0 /100 | #310 | Tragic 10.3% |
| Immigrants from Liberia | 0.0 /100 | #311 | Tragic 10.3% |
| Africans | 0.0 /100 | #312 | Tragic 10.4% |
| Americans | 0.0 /100 | #313 | Tragic 10.4% |
| Immigrants from Cabo Verde | 0.0 /100 | #314 | Tragic 10.4% |
| Bahamians | 0.0 /100 | #315 | Tragic 10.4% |
| Immigrants from Dominica | 0.0 /100 | #316 | Tragic 10.5% |
| Bermudans | 0.0 /100 | #317 | Tragic 10.5% |
| Delaware | 0.0 /100 | #318 | Tragic 10.5% |
| Immigrants from Uganda | 0.0 /100 | #319 | Tragic 10.7% |
| Apache | 0.0 /100 | #320 | Tragic 10.7% |
| Tohono O'odham | 0.0 /100 | #321 | Tragic 10.7% |
| Cree | 0.0 /100 | #322 | Tragic 10.8% |
Bahamian Unemployment Among Women with Children Ages 6 to 17 years Correlation Summary
| Measurement | Bahamian Data | Unemployment Among Women with Children Ages 6 to 17 years Data |
| Minimum | 0.016% | 4.0% |
| Maximum | 7.2% | 56.2% |
| Range | 7.2% | 52.2% |
| Mean | 1.2% | 12.2% |
| Median | 0.91% | 9.7% |
| Interquartile 25% (IQ1) | 0.46% | 8.3% |
| Interquartile 75% (IQ3) | 1.4% | 14.5% |
| Interquartile Range (IQR) | 0.96% | 6.2% |
| Standard Deviation (Sample) | 1.3% | 8.9% |
| Standard Deviation (Population) | 1.2% | 8.7% |
Correlation Details
| Bahamian Percentile | Sample Size | Unemployment Among Women with Children Ages 6 to 17 years |
[ 0.0% - 0.5% ] 0.016% | 73,464,893 | 8.0% |
[ 0.0% - 0.5% ] 0.077% | 9,389,018 | 8.3% |
[ 0.0% - 0.5% ] 0.13% | 4,310,207 | 10.5% |
[ 0.0% - 0.5% ] 0.19% | 2,808,664 | 9.9% |
[ 0.0% - 0.5% ] 0.24% | 1,111,231 | 10.1% |
[ 0.0% - 0.5% ] 0.30% | 1,081,003 | 12.0% |
[ 0.0% - 0.5% ] 0.35% | 518,252 | 8.1% |
[ 0.0% - 0.5% ] 0.40% | 519,649 | 14.5% |
[ 0.0% - 0.5% ] 0.46% | 366,312 | 23.0% |
[ 0.5% - 1.0% ] 0.51% | 583,660 | 9.3% |
[ 0.5% - 1.0% ] 0.58% | 402,406 | 12.0% |
[ 0.5% - 1.0% ] 0.63% | 404,812 | 9.6% |
[ 0.5% - 1.0% ] 0.67% | 473,534 | 4.0% |
[ 0.5% - 1.0% ] 0.73% | 208,314 | 17.9% |
[ 0.5% - 1.0% ] 0.78% | 152,675 | 12.6% |
[ 0.5% - 1.0% ] 0.84% | 111,479 | 11.7% |
[ 0.5% - 1.0% ] 0.88% | 90,192 | 8.8% |
[ 0.5% - 1.0% ] 0.94% | 157,776 | 9.2% |
[ 1.0% - 1.5% ] 1.00% | 276,741 | 14.7% |
[ 1.0% - 1.5% ] 1.05% | 60,798 | 6.1% |
[ 1.0% - 1.5% ] 1.12% | 42,249 | 4.5% |
[ 1.0% - 1.5% ] 1.15% | 60,436 | 12.2% |
[ 1.0% - 1.5% ] 1.27% | 103,278 | 19.1% |
[ 1.0% - 1.5% ] 1.34% | 37,668 | 15.1% |
[ 1.0% - 1.5% ] 1.36% | 19,138 | 8.9% |
[ 1.0% - 1.5% ] 1.42% | 13,261 | 9.5% |
[ 1.0% - 1.5% ] 1.48% | 109,694 | 6.8% |
[ 1.5% - 2.0% ] 1.52% | 163,618 | 8.5% |
[ 1.5% - 2.0% ] 1.62% | 31,034 | 16.9% |
[ 1.5% - 2.0% ] 1.98% | 14,126 | 6.6% |
[ 2.0% - 2.5% ] 2.15% | 37,274 | 15.5% |
[ 2.0% - 2.5% ] 2.40% | 16,449 | 56.2% |
[ 2.5% - 3.0% ] 2.73% | 47,065 | 5.7% |
[ 7.0% - 7.5% ] 7.21% | 14,698 | 8.9% |