Bahamian vs Vietnamese Married-Couple Family Poverty
COMPARE
Bahamian
Vietnamese
Married-Couple Family Poverty
Married-Couple Family Poverty Comparison
Bahamians
Vietnamese
6.6%
MARRIED-COUPLE FAMILY POVERTY
0.0/ 100
METRIC RATING
294th/ 347
METRIC RANK
7.4%
MARRIED-COUPLE FAMILY POVERTY
0.0/ 100
METRIC RATING
323rd/ 347
METRIC RANK
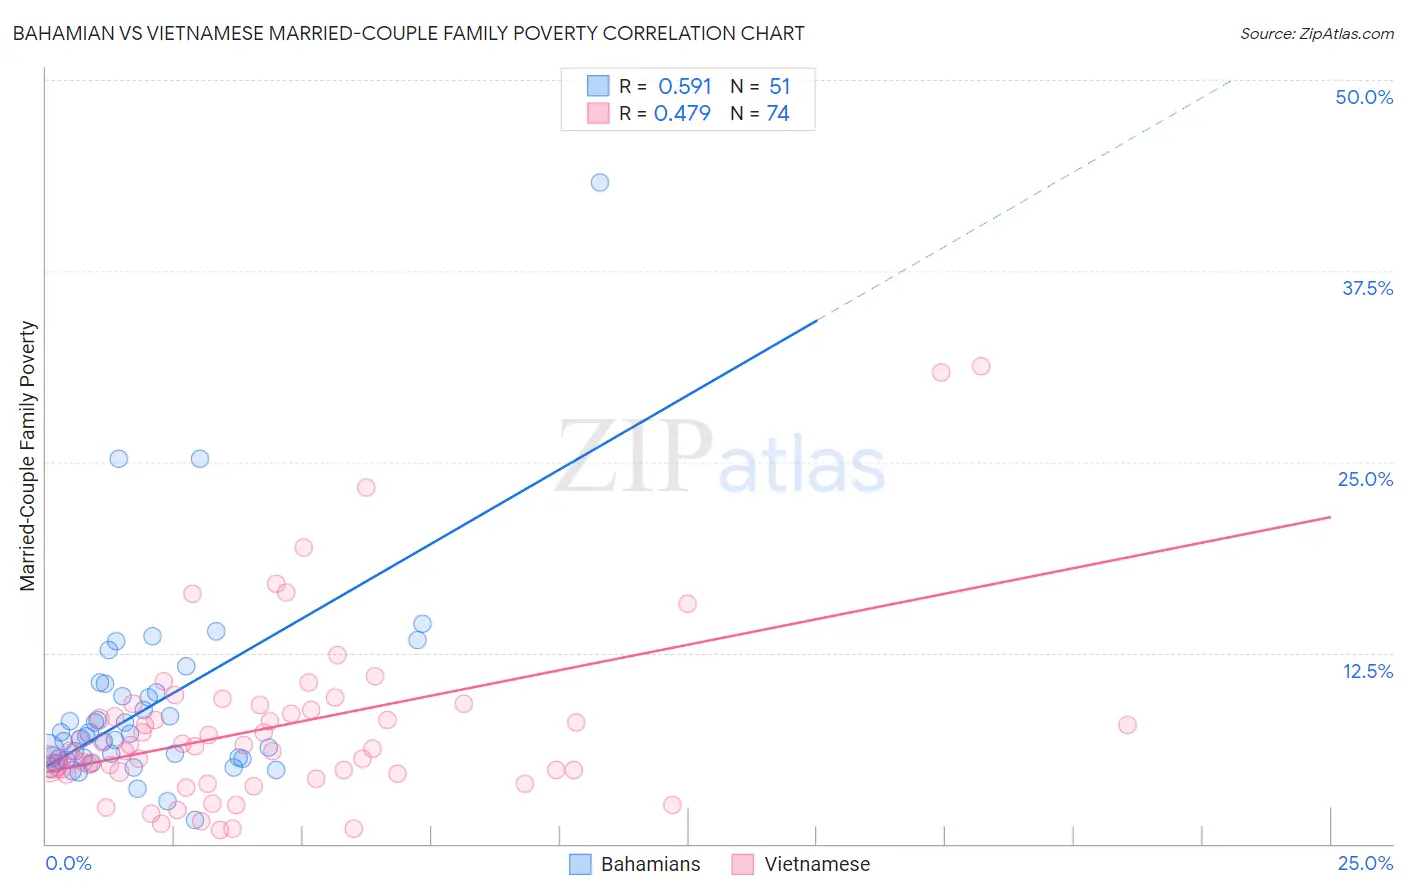
Bahamian vs Vietnamese Married-Couple Family Poverty Correlation Chart
The statistical analysis conducted on geographies consisting of 112,412,919 people shows a substantial positive correlation between the proportion of Bahamians and poverty level among married-couple families in the United States with a correlation coefficient (R) of 0.591 and weighted average of 6.6%. Similarly, the statistical analysis conducted on geographies consisting of 170,138,931 people shows a moderate positive correlation between the proportion of Vietnamese and poverty level among married-couple families in the United States with a correlation coefficient (R) of 0.479 and weighted average of 7.4%, a difference of 12.1%.
Married-Couple Family Poverty Correlation Summary
| Measurement | Bahamian | Vietnamese |
| Minimum | 1.6% | 0.87% |
| Maximum | 43.3% | 31.2% |
| Range | 41.8% | 30.4% |
| Mean | 8.9% | 7.6% |
| Median | 6.8% | 6.3% |
| Interquartile 25% (IQ1) | 5.5% | 4.7% |
| Interquartile 75% (IQ3) | 9.9% | 8.8% |
| Interquartile Range (IQR) | 4.4% | 4.1% |
| Standard Deviation (Sample) | 6.7% | 5.8% |
| Standard Deviation (Population) | 6.6% | 5.7% |
Similar Demographics by Married-Couple Family Poverty
Demographics Similar to Bahamians by Married-Couple Family Poverty
In terms of married-couple family poverty, the demographic groups most similar to Bahamians are Immigrants from Uzbekistan (6.6%, a difference of 0.29%), U.S. Virgin Islander (6.6%, a difference of 0.39%), Kiowa (6.6%, a difference of 0.40%), Immigrants from Guyana (6.7%, a difference of 0.47%), and Arapaho (6.6%, a difference of 0.85%).
| Demographics | Rating | Rank | Married-Couple Family Poverty |
| Ecuadorians | 0.0 /100 | #287 | Tragic 6.5% |
| Salvadorans | 0.0 /100 | #288 | Tragic 6.5% |
| Nepalese | 0.0 /100 | #289 | Tragic 6.5% |
| Immigrants | Barbados | 0.0 /100 | #290 | Tragic 6.5% |
| Belizeans | 0.0 /100 | #291 | Tragic 6.5% |
| Immigrants | Lebanon | 0.0 /100 | #292 | Tragic 6.6% |
| Arapaho | 0.0 /100 | #293 | Tragic 6.6% |
| Bahamians | 0.0 /100 | #294 | Tragic 6.6% |
| Immigrants | Uzbekistan | 0.0 /100 | #295 | Tragic 6.6% |
| U.S. Virgin Islanders | 0.0 /100 | #296 | Tragic 6.6% |
| Kiowa | 0.0 /100 | #297 | Tragic 6.6% |
| Immigrants | Guyana | 0.0 /100 | #298 | Tragic 6.7% |
| Nicaraguans | 0.0 /100 | #299 | Tragic 6.7% |
| Immigrants | Belize | 0.0 /100 | #300 | Tragic 6.7% |
| Central Americans | 0.0 /100 | #301 | Tragic 6.7% |
Demographics Similar to Vietnamese by Married-Couple Family Poverty
In terms of married-couple family poverty, the demographic groups most similar to Vietnamese are Immigrants from Central America (7.4%, a difference of 0.090%), Immigrants from Cuba (7.5%, a difference of 0.63%), Immigrants from Bangladesh (7.5%, a difference of 0.82%), Hispanic or Latino (7.5%, a difference of 0.82%), and Immigrants from Honduras (7.3%, a difference of 1.1%).
| Demographics | Rating | Rank | Married-Couple Family Poverty |
| Hondurans | 0.0 /100 | #316 | Tragic 7.2% |
| Mexicans | 0.0 /100 | #317 | Tragic 7.2% |
| Immigrants | Guatemala | 0.0 /100 | #318 | Tragic 7.2% |
| Immigrants | Latin America | 0.0 /100 | #319 | Tragic 7.2% |
| Immigrants | Grenada | 0.0 /100 | #320 | Tragic 7.3% |
| Immigrants | Caribbean | 0.0 /100 | #321 | Tragic 7.3% |
| Immigrants | Honduras | 0.0 /100 | #322 | Tragic 7.3% |
| Vietnamese | 0.0 /100 | #323 | Tragic 7.4% |
| Immigrants | Central America | 0.0 /100 | #324 | Tragic 7.4% |
| Immigrants | Cuba | 0.0 /100 | #325 | Tragic 7.5% |
| Immigrants | Bangladesh | 0.0 /100 | #326 | Tragic 7.5% |
| Hispanics or Latinos | 0.0 /100 | #327 | Tragic 7.5% |
| Immigrants | Mexico | 0.0 /100 | #328 | Tragic 7.6% |
| Natives/Alaskans | 0.0 /100 | #329 | Tragic 8.2% |
| Paiute | 0.0 /100 | #330 | Tragic 8.3% |