Bahamian vs Immigrants from Latvia Married-Couple Family Poverty
COMPARE
Bahamian
Immigrants from Latvia
Married-Couple Family Poverty
Married-Couple Family Poverty Comparison
Bahamians
Immigrants from Latvia
6.6%
MARRIED-COUPLE FAMILY POVERTY
0.0/ 100
METRIC RATING
294th/ 347
METRIC RANK
4.5%
MARRIED-COUPLE FAMILY POVERTY
99.1/ 100
METRIC RATING
77th/ 347
METRIC RANK
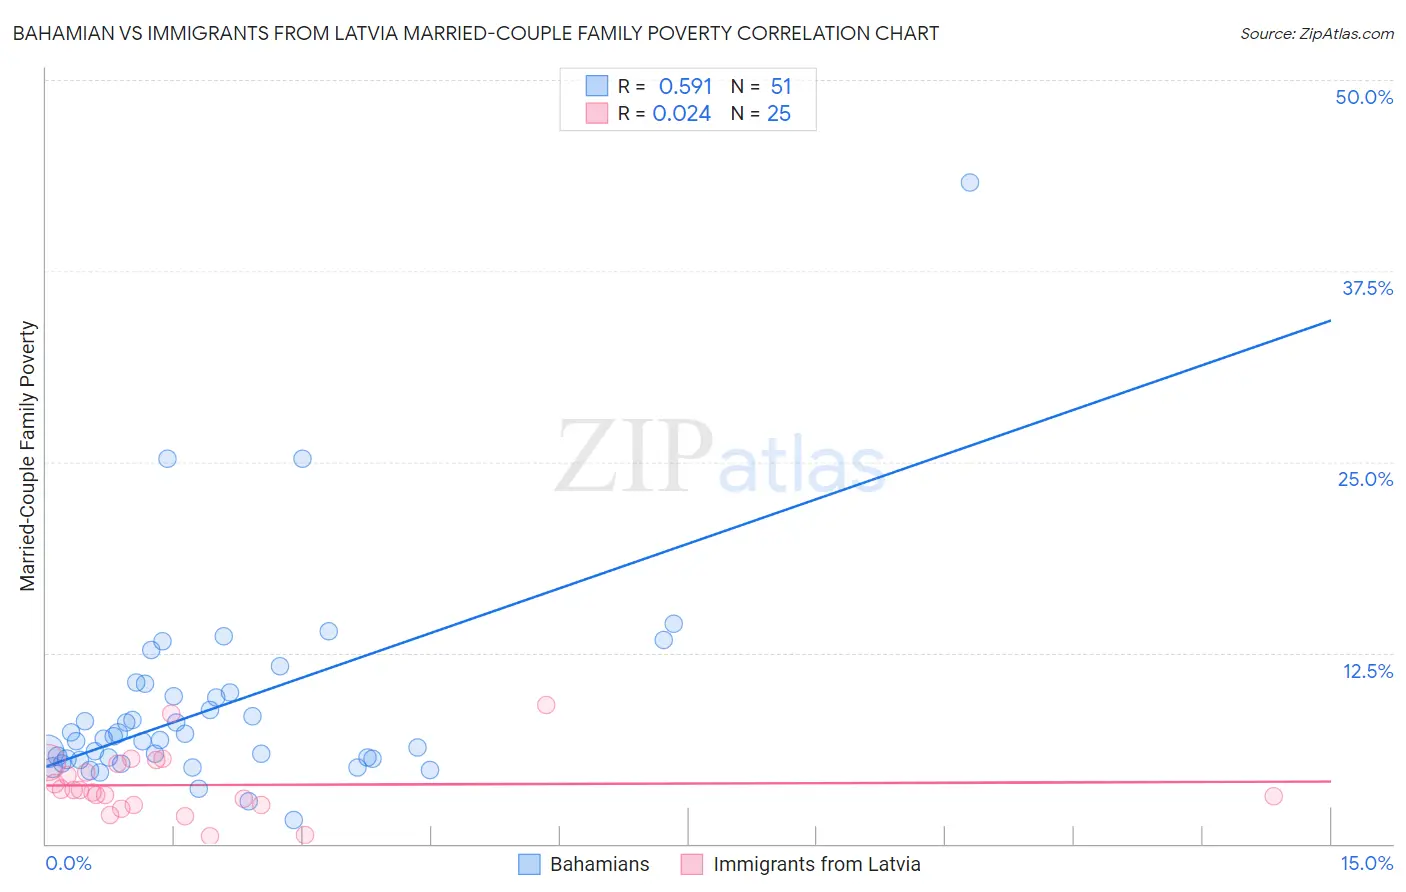
Bahamian vs Immigrants from Latvia Married-Couple Family Poverty Correlation Chart
The statistical analysis conducted on geographies consisting of 112,412,919 people shows a substantial positive correlation between the proportion of Bahamians and poverty level among married-couple families in the United States with a correlation coefficient (R) of 0.591 and weighted average of 6.6%. Similarly, the statistical analysis conducted on geographies consisting of 113,402,178 people shows no correlation between the proportion of Immigrants from Latvia and poverty level among married-couple families in the United States with a correlation coefficient (R) of 0.024 and weighted average of 4.5%, a difference of 46.9%.
Married-Couple Family Poverty Correlation Summary
| Measurement | Bahamian | Immigrants from Latvia |
| Minimum | 1.6% | 0.50% |
| Maximum | 43.3% | 9.1% |
| Range | 41.8% | 8.6% |
| Mean | 8.9% | 3.8% |
| Median | 6.8% | 3.5% |
| Interquartile 25% (IQ1) | 5.5% | 2.5% |
| Interquartile 75% (IQ3) | 9.9% | 5.3% |
| Interquartile Range (IQR) | 4.4% | 2.8% |
| Standard Deviation (Sample) | 6.7% | 2.1% |
| Standard Deviation (Population) | 6.6% | 2.0% |
Similar Demographics by Married-Couple Family Poverty
Demographics Similar to Bahamians by Married-Couple Family Poverty
In terms of married-couple family poverty, the demographic groups most similar to Bahamians are Immigrants from Uzbekistan (6.6%, a difference of 0.29%), U.S. Virgin Islander (6.6%, a difference of 0.39%), Kiowa (6.6%, a difference of 0.40%), Immigrants from Guyana (6.7%, a difference of 0.47%), and Arapaho (6.6%, a difference of 0.85%).
| Demographics | Rating | Rank | Married-Couple Family Poverty |
| Ecuadorians | 0.0 /100 | #287 | Tragic 6.5% |
| Salvadorans | 0.0 /100 | #288 | Tragic 6.5% |
| Nepalese | 0.0 /100 | #289 | Tragic 6.5% |
| Immigrants | Barbados | 0.0 /100 | #290 | Tragic 6.5% |
| Belizeans | 0.0 /100 | #291 | Tragic 6.5% |
| Immigrants | Lebanon | 0.0 /100 | #292 | Tragic 6.6% |
| Arapaho | 0.0 /100 | #293 | Tragic 6.6% |
| Bahamians | 0.0 /100 | #294 | Tragic 6.6% |
| Immigrants | Uzbekistan | 0.0 /100 | #295 | Tragic 6.6% |
| U.S. Virgin Islanders | 0.0 /100 | #296 | Tragic 6.6% |
| Kiowa | 0.0 /100 | #297 | Tragic 6.6% |
| Immigrants | Guyana | 0.0 /100 | #298 | Tragic 6.7% |
| Nicaraguans | 0.0 /100 | #299 | Tragic 6.7% |
| Immigrants | Belize | 0.0 /100 | #300 | Tragic 6.7% |
| Central Americans | 0.0 /100 | #301 | Tragic 6.7% |
Demographics Similar to Immigrants from Latvia by Married-Couple Family Poverty
In terms of married-couple family poverty, the demographic groups most similar to Immigrants from Latvia are Scotch-Irish (4.5%, a difference of 0.080%), Immigrants from South Africa (4.5%, a difference of 0.17%), Cambodian (4.5%, a difference of 0.28%), Immigrants from Iran (4.5%, a difference of 0.31%), and Icelander (4.5%, a difference of 0.38%).
| Demographics | Rating | Rank | Married-Couple Family Poverty |
| Immigrants | Korea | 99.4 /100 | #70 | Exceptional 4.5% |
| Immigrants | North America | 99.3 /100 | #71 | Exceptional 4.5% |
| Immigrants | England | 99.3 /100 | #72 | Exceptional 4.5% |
| Ukrainians | 99.2 /100 | #73 | Exceptional 4.5% |
| Immigrants | Austria | 99.2 /100 | #74 | Exceptional 4.5% |
| Cambodians | 99.2 /100 | #75 | Exceptional 4.5% |
| Immigrants | South Africa | 99.1 /100 | #76 | Exceptional 4.5% |
| Immigrants | Latvia | 99.1 /100 | #77 | Exceptional 4.5% |
| Scotch-Irish | 99.1 /100 | #78 | Exceptional 4.5% |
| Immigrants | Iran | 99.0 /100 | #79 | Exceptional 4.5% |
| Icelanders | 99.0 /100 | #80 | Exceptional 4.5% |
| Immigrants | Greece | 98.9 /100 | #81 | Exceptional 4.5% |
| Canadians | 98.8 /100 | #82 | Exceptional 4.5% |
| Immigrants | Denmark | 98.8 /100 | #83 | Exceptional 4.6% |
| Immigrants | Croatia | 98.7 /100 | #84 | Exceptional 4.6% |