Zip Codes with the Highest Percentage of Population with a Degree in Visual and Performing Arts in Oklahoma City, OK

RELATED REPORTS & OPTIONS

Visual and Performing Arts
Population
Families and Households
Female Fertility
Female Fertility (Unmarried)
Race (Community Size)
Race (Percentage)
Ancestry (Community Size)
AfricanAlaska NativeAlbanianAmericanApacheArabArapahoArgentineanArmenianAustralianAustrianBahamianBangladeshiBarbadianBasqueBelgianBhutaneseBlackfeetBolivianBrazilianBritishBritish West IndianBulgarianBurmeseCajunCambodianCanadianCelticCentral AmericanCentral American IndianCherokeeCheyenneChickasawChileanChippewaChoctawColombianComancheCreeCreekCroatianCubanCzechCzechoslovakianDanishDelawareDominicanDutchDutch West IndianEastern EuropeanEcuadorianEgyptianEnglishEstonianEthiopianEuropeanFijianFilipinoFinnishFrenchFrench American IndianFrench CanadianGermanGerman RussianGhanaianGreekGuamanian / ChamorroGuatemalanGuyaneseHaitianHonduranHopiHungarianIcelanderIndian (Asian)IndonesianInupiatIranianIraqiIrishIroquoisIsraeliItalianJamaicanJapaneseJordanianKenyanKiowaKoreanLaotianLatvianLebaneseLiberianLithuanianLuxembourgerMalaysianMexicanMexican American IndianMongolianMoroccanNative HawaiianNavajoNew ZealanderNicaraguanNigerianNorthern EuropeanNorwegianOkinawanOsagePakistaniPalestinianPanamanianPennsylvania GermanPeruvianPimaPolishPortuguesePotawatomiPuebloPuerto RicanRomanianRussianSalvadoranSamoanScandinavianScotch-IrishScottishSeminoleSerbianSiouxSlavicSlovakSloveneSouth AfricanSouth AmericanSouth American IndianSpaniardSpanishSpanish American IndianSri LankanSubsaharan AfricanSudaneseSwedishSwissSyrianThaiTlingit-HaidaTonganTrinidadian and TobagonianTurkishU.S. Virgin IslanderUkrainianUruguayanVenezuelanVietnameseWelshWest IndianYugoslavianZimbabwean
Ancestry (Percentage)
AfricanAlaska NativeAlbanianAmericanApacheArabArapahoArgentineanArmenianAustralianAustrianBahamianBangladeshiBarbadianBasqueBelgianBhutaneseBlackfeetBolivianBrazilianBritishBritish West IndianBulgarianBurmeseCajunCambodianCanadianCelticCentral AmericanCentral American IndianCherokeeCheyenneChickasawChileanChippewaChoctawColombianComancheCreeCreekCroatianCubanCzechCzechoslovakianDanishDelawareDominicanDutchDutch West IndianEastern EuropeanEcuadorianEgyptianEnglishEstonianEthiopianEuropeanFijianFilipinoFinnishFrenchFrench American IndianFrench CanadianGermanGerman RussianGhanaianGreekGuamanian / ChamorroGuatemalanGuyaneseHaitianHonduranHopiHungarianIcelanderIndian (Asian)IndonesianInupiatIranianIraqiIrishIroquoisIsraeliItalianJamaicanJapaneseJordanianKenyanKiowaKoreanLaotianLatvianLebaneseLiberianLithuanianLuxembourgerMalaysianMexicanMexican American IndianMongolianMoroccanNative HawaiianNavajoNew ZealanderNicaraguanNigerianNorthern EuropeanNorwegianOkinawanOsagePakistaniPalestinianPanamanianPennsylvania GermanPeruvianPimaPolishPortuguesePotawatomiPuebloPuerto RicanRomanianRussianSalvadoranSamoanScandinavianScotch-IrishScottishSeminoleSerbianSiouxSlavicSlovakSloveneSouth AfricanSouth AmericanSouth American IndianSpaniardSpanishSpanish American IndianSri LankanSubsaharan AfricanSudaneseSwedishSwissSyrianThaiTlingit-HaidaTonganTrinidadian and TobagonianTurkishU.S. Virgin IslanderUkrainianUruguayanVenezuelanVietnameseWelshWest IndianYugoslavianZimbabwean
Immigrant Origin (Total)
AfricaArgentinaAsiaAustraliaAustriaBahamasBangladeshBosnia and HerzegovinaBrazilBulgariaBurma / MyanmarCambodiaCameroonCanadaCaribbeanCentral AmericaChileChinaColombiaCubaDominican RepublicEastern AfricaEastern AsiaEastern EuropeEcuadorEgyptEl SalvadorEnglandEritreaEthiopiaEuropeFranceGermanyGhanaGreeceGuatemalaHondurasHong KongIndiaIndonesiaIranIraqIrelandItalyJamaicaJapanJordanKazakhstanKenyaKoreaKuwaitLaosLatin AmericaLebanonLiberiaMalaysiaMexicoMiddle AfricaMoroccoNepalNetherlandsNicaraguaNigeriaNorthern AfricaNorthern EuropeNorwayOceaniaPakistanPanamaPeruPhilippinesPolandPortugalRussiaSaudi ArabiaScotlandSingaporeSouth AfricaSouth AmericaSouth Central AsiaSouth Eastern AsiaSouthern EuropeSpainSudanSyriaTaiwanThailandTrinidad and TobagoTurkeyUkraineVenezuelaVietnamWestern AfricaWestern AsiaWestern EuropeZaireZimbabwe
Immigrant Origin (Percentage)
AfricaArgentinaAsiaAustraliaAustriaBahamasBangladeshBosnia and HerzegovinaBrazilBulgariaBurma / MyanmarCambodiaCameroonCanadaCaribbeanCentral AmericaChileChinaColombiaCubaDominican RepublicEastern AfricaEastern AsiaEastern EuropeEcuadorEgyptEl SalvadorEnglandEritreaEthiopiaEuropeFranceGermanyGhanaGreeceGuatemalaHondurasHong KongIndiaIndonesiaIranIraqIrelandItalyJamaicaJapanJordanKazakhstanKenyaKoreaKuwaitLaosLatin AmericaLebanonLiberiaMalaysiaMexicoMiddle AfricaMoroccoNepalNetherlandsNicaraguaNigeriaNorthern AfricaNorthern EuropeNorwayOceaniaPakistanPanamaPeruPhilippinesPolandPortugalRussiaSaudi ArabiaScotlandSingaporeSouth AfricaSouth AmericaSouth Central AsiaSouth Eastern AsiaSouthern EuropeSpainSudanSyriaTaiwanThailandTrinidad and TobagoTurkeyUkraineVenezuelaVietnamWestern AfricaWestern AsiaWestern EuropeZaireZimbabwe
Income
Income (Families)
Income (Households)
Poverty
Poverty (Families)
Unemployment
Employment Occupations
Employment Industries
Employer Class
Commute Time
Commute Means
School Enrollment
Education by Degree Field
Occupancy
Finances
Physical Characteristics
Oklahoma City
Compare Zip Codes
Comparison Subject

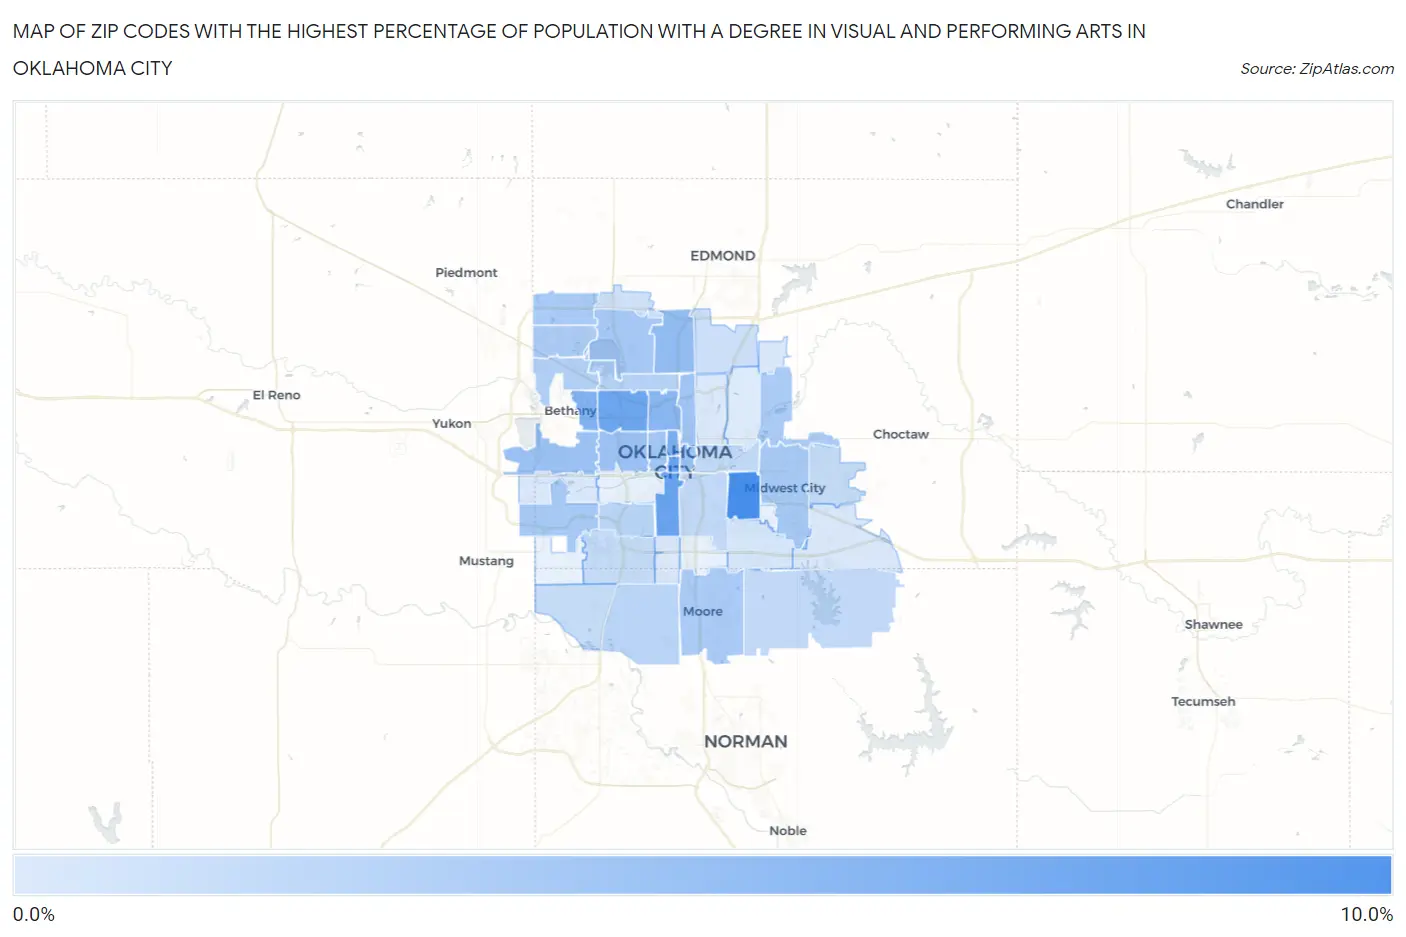
Map of Zip Codes with the Highest Percentage of Population with a Degree in Visual and Performing Arts in Oklahoma City

0.0%
10.0%
Zip Codes with the Highest Percentage of Population with a Degree in Visual and Performing Arts in Oklahoma City Map

Zip Codes with the Highest Percentage of Population with a Degree in Visual and Performing Arts in Oklahoma City, OK

Zip Code % Graduates vs State vs National
1.731159.0%2.9%(+6.13)#274.3%(+4.77)#2,251
2.731027.0%2.9%(+4.14)#444.3%(+2.78)#3,627
3.731097.0%2.9%(+4.08)#454.3%(+2.72)#3,683
4.731126.6%2.9%(+3.75)#494.3%(+2.39)#4,070
5.731036.2%2.9%(+3.31)#544.3%(+1.95)#4,591
6.731225.6%2.9%(+2.72)#624.3%(+1.36)#5,478
7.731185.1%2.9%(+2.20)#784.3%(+0.839)#6,434
8.731144.5%2.9%(+1.63)#954.3%(+0.274)#7,744
9.731274.1%2.9%(+1.20)#1064.3%(-0.157)#8,954
10.731074.0%2.9%(+1.14)#1104.3%(-0.218)#9,139
11.731044.0%2.9%(+1.12)#1114.3%(-0.238)#9,213
12.731053.7%2.9%(+0.835)#1214.3%(-0.523)#10,059
13.731063.6%2.9%(+0.741)#1234.3%(-0.616)#10,387
14.731203.5%2.9%(+0.611)#1324.3%(-0.747)#10,860
15.731103.5%2.9%(+0.557)#1344.3%(-0.800)#11,070
16.731793.4%2.9%(+0.520)#1364.3%(-0.837)#11,195
17.731603.3%2.9%(+0.408)#1434.3%(-0.950)#11,610
18.731423.3%2.9%(+0.380)#1464.3%(-0.977)#11,711
19.731413.2%2.9%(+0.303)#1504.3%(-1.05)#11,999
20.731623.1%2.9%(+0.173)#1554.3%(-1.18)#12,467
21.731322.8%2.9%(-0.131)#1674.3%(-1.49)#13,632
22.731162.6%2.9%(-0.249)#1754.3%(-1.61)#14,104
23.731702.4%2.9%(-0.499)#1914.3%(-1.86)#15,016
24.731192.3%2.9%(-0.549)#1944.3%(-1.91)#15,183
25.731652.0%2.9%(-0.868)#2104.3%(-2.23)#16,360
26.731292.0%2.9%(-0.871)#2124.3%(-2.23)#16,375
27.731171.9%2.9%(-0.962)#2234.3%(-2.32)#16,682
28.731301.7%2.9%(-1.15)#2334.3%(-2.50)#17,327
29.731591.7%2.9%(-1.20)#2374.3%(-2.56)#17,519
30.731731.7%2.9%(-1.23)#2414.3%(-2.59)#17,618
31.731311.4%2.9%(-1.52)#2624.3%(-2.87)#18,530
32.731341.2%2.9%(-1.66)#2714.3%(-3.02)#18,980
33.731350.76%2.9%(-2.13)#3154.3%(-3.49)#20,233
34.731510.75%2.9%(-2.15)#3164.3%(-3.50)#20,267
35.731500.73%2.9%(-2.17)#3174.3%(-3.53)#20,305
36.731390.52%2.9%(-2.38)#3264.3%(-3.73)#20,738
37.731110.51%2.9%(-2.38)#3274.3%(-3.74)#20,752
38.731280.50%2.9%(-2.39)#3294.3%(-3.75)#20,773
39.731210.43%2.9%(-2.46)#3344.3%(-3.82)#20,901

Common Questions

What are the Top 10 Zip Codes with the Highest Percentage of Population with a Degree in Visual and Performing Arts in Oklahoma City, OK?
Top 10 Zip Codes with the Highest Percentage of Population with a Degree in Visual and Performing Arts in Oklahoma City, OK are:
#1
9.0%
#2
7.0%
#3
7.0%
#4
6.6%
#5
6.2%
#6
5.6%
#7
5.1%
#8
4.5%
#9
4.1%
#10
4.0%
What zip code has the Highest Percentage of Population with a Degree in Visual and Performing Arts in Oklahoma City, OK?
73115 has the Highest Percentage of Population with a Degree in Visual and Performing Arts in Oklahoma City, OK with 9.0%.
What is the Percentage of Population with a Degree in Visual and Performing Arts in Oklahoma City, OK?
Percentage of Population with a Degree in Visual and Performing Arts in Oklahoma City is 3.0%.
What is the Percentage of Population with a Degree in Visual and Performing Arts in Oklahoma?
Percentage of Population with a Degree in Visual and Performing Arts in Oklahoma is 2.9%.
What is the Percentage of Population with a Degree in Visual and Performing Arts in the United States?
Percentage of Population with a Degree in Visual and Performing Arts in the United States is 4.3%.