Carlisle, OK Map & Demographics
Carlisle Map
Carlisle Overview
$25,317
PER CAPITA INCOME
$32,589
AVG FAMILY INCOME
$32,708
AVG HOUSEHOLD INCOME
0.50
INEQUALITY / GINI INDEX
567
TOTAL POPULATION
347
MALE POPULATION
220
FEMALE POPULATION
157.73
MALES / 100 FEMALES
63.40
FEMALES / 100 MALES
57.7
MEDIAN AGE
3.2
AVG FAMILY SIZE
2.9
AVG HOUSEHOLD SIZE
120
LABOR FORCE [ PEOPLE ]
28.2%
PERCENT IN LABOR FORCE
Income in Carlisle
Income Overview in Carlisle
Per Capita Income in Carlisle is $25,317, while median incomes of families and households are $32,589 and $32,708 respectively.
| Characteristic | Number | Measure |
| Per Capita Income | 567 | $25,317 |
| Median Family Income | 133 | $32,589 |
| Mean Family Income | 133 | $66,535 |
| Median Household Income | 197 | $32,708 |
| Mean Household Income | 197 | $55,781 |
| Income Deficit | 133 | $0 |
| Wage / Income Gap (%) | 567 | 0.00% |
| Wage / Income Gap ($) | 567 | 100.00¢ per $1 |
| Gini / Inequality Index | 567 | 0.50 |
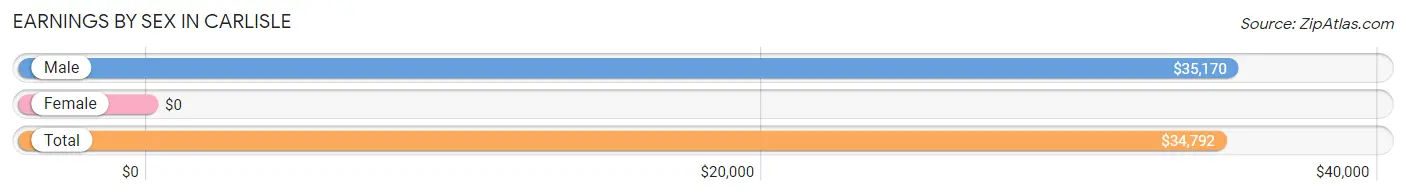
Earnings by Sex in Carlisle
| Sex | Number | Average Earnings |
| Male | 83 (69.2%) | $35,170 |
| Female | 37 (30.8%) | $0 |
| Total | 120 (100.0%) | $34,792 |
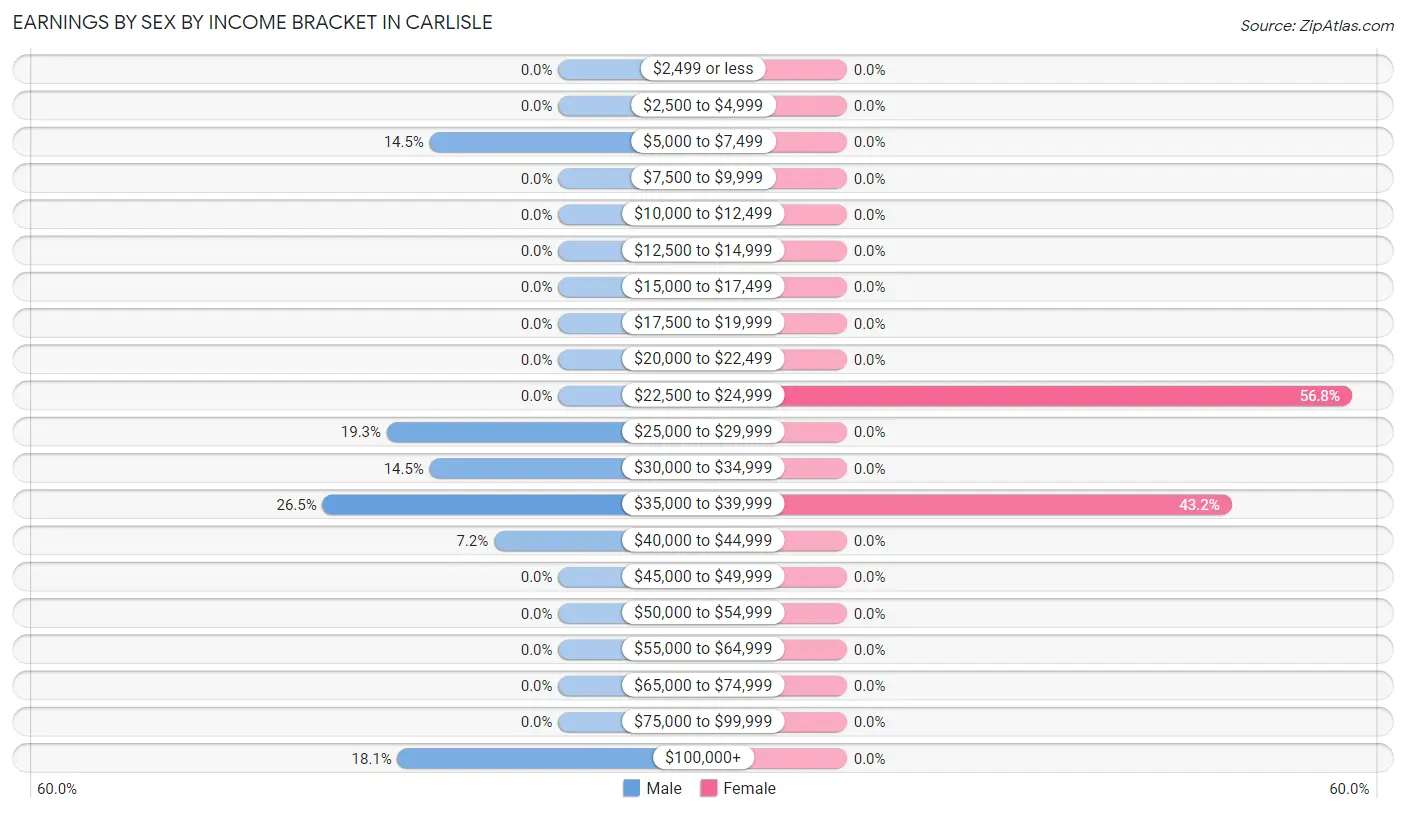
Earnings by Sex by Income Bracket in Carlisle
The most common earnings brackets in Carlisle are $35,000 to $39,999 for men (22 | 26.5%) and $22,500 to $24,999 for women (21 | 56.8%).
| Income | Male | Female |
| $2,499 or less | 0 (0.0%) | 0 (0.0%) |
| $2,500 to $4,999 | 0 (0.0%) | 0 (0.0%) |
| $5,000 to $7,499 | 12 (14.5%) | 0 (0.0%) |
| $7,500 to $9,999 | 0 (0.0%) | 0 (0.0%) |
| $10,000 to $12,499 | 0 (0.0%) | 0 (0.0%) |
| $12,500 to $14,999 | 0 (0.0%) | 0 (0.0%) |
| $15,000 to $17,499 | 0 (0.0%) | 0 (0.0%) |
| $17,500 to $19,999 | 0 (0.0%) | 0 (0.0%) |
| $20,000 to $22,499 | 0 (0.0%) | 0 (0.0%) |
| $22,500 to $24,999 | 0 (0.0%) | 21 (56.8%) |
| $25,000 to $29,999 | 16 (19.3%) | 0 (0.0%) |
| $30,000 to $34,999 | 12 (14.5%) | 0 (0.0%) |
| $35,000 to $39,999 | 22 (26.5%) | 16 (43.2%) |
| $40,000 to $44,999 | 6 (7.2%) | 0 (0.0%) |
| $45,000 to $49,999 | 0 (0.0%) | 0 (0.0%) |
| $50,000 to $54,999 | 0 (0.0%) | 0 (0.0%) |
| $55,000 to $64,999 | 0 (0.0%) | 0 (0.0%) |
| $65,000 to $74,999 | 0 (0.0%) | 0 (0.0%) |
| $75,000 to $99,999 | 0 (0.0%) | 0 (0.0%) |
| $100,000+ | 15 (18.1%) | 0 (0.0%) |
| Total | 83 (100.0%) | 37 (100.0%) |
Earnings by Sex by Educational Attainment in Carlisle
| Educational Attainment | Male Income | Female Income |
| Less than High School | - | - |
| High School Diploma | - | - |
| College or Associate's Degree | - | - |
| Bachelor's Degree | - | - |
| Graduate Degree | - | - |
| Total | $35,170 | $0 |
Family Income in Carlisle
Family Income Brackets in Carlisle
According to the Carlisle family income data, there are 46 families falling into the $25,000 to $34,999 income range, which is the most common income bracket and makes up 34.6% of all families.
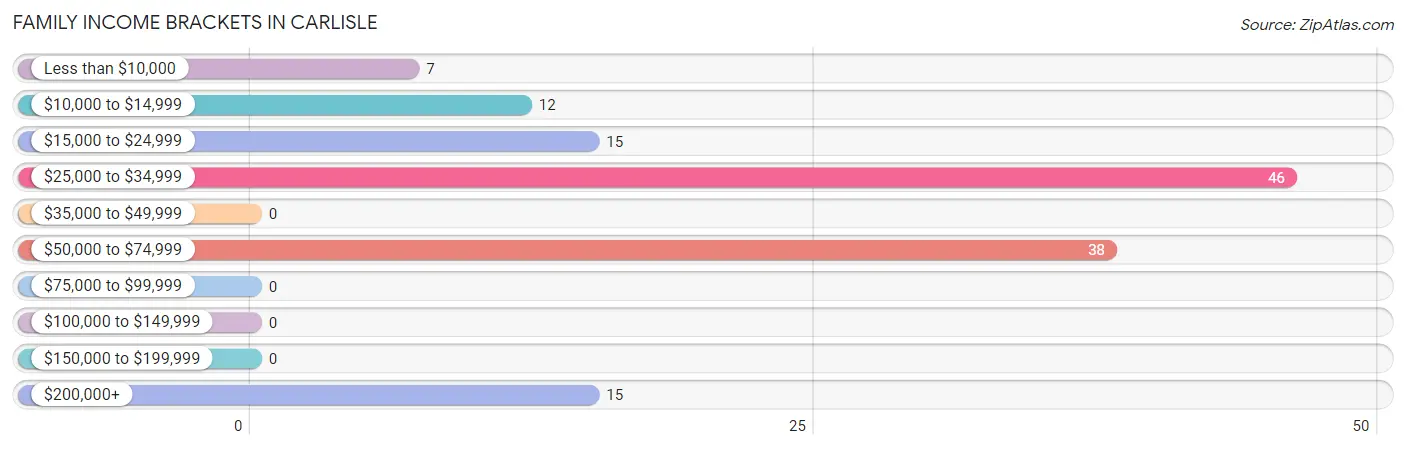
| Income Bracket | # Families | % Families |
| Less than $10,000 | 7 | 5.3% |
| $10,000 to $14,999 | 12 | 9.0% |
| $15,000 to $24,999 | 15 | 11.3% |
| $25,000 to $34,999 | 46 | 34.6% |
| $35,000 to $49,999 | 0 | 0.0% |
| $50,000 to $74,999 | 38 | 28.6% |
| $75,000 to $99,999 | 0 | 0.0% |
| $100,000 to $149,999 | 0 | 0.0% |
| $150,000 to $199,999 | 0 | 0.0% |
| $200,000+ | 15 | 11.3% |
Family Income by Famaliy Size in Carlisle
2-person families (65 | 48.9%) account for the highest median family income in Carlisle with $32,589 per family, while 2-person families (65 | 48.9%) have the highest median income of $16,294 per family member.
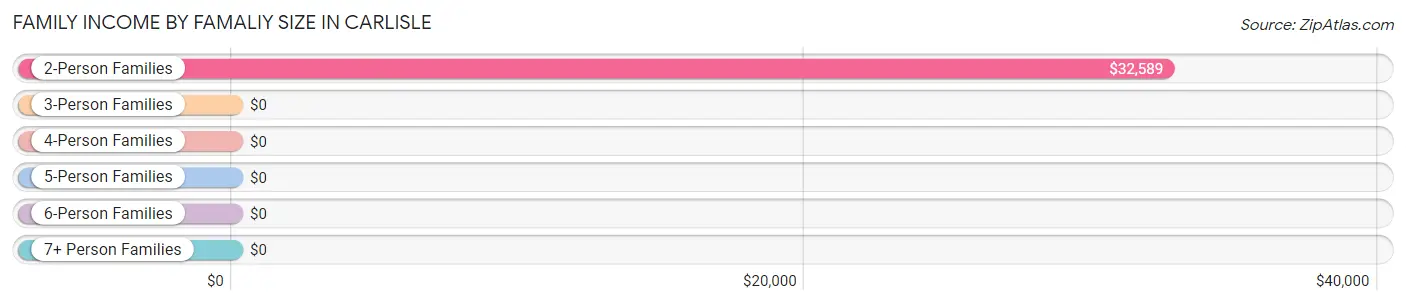
| Income Bracket | # Families | Median Income |
| 2-Person Families | 65 (48.9%) | $32,589 |
| 3-Person Families | 28 (21.0%) | $0 |
| 4-Person Families | 0 (0.0%) | $0 |
| 5-Person Families | 18 (13.5%) | $0 |
| 6-Person Families | 22 (16.5%) | $0 |
| 7+ Person Families | 0 (0.0%) | $0 |
| Total | 133 (100.0%) | $32,589 |
Family Income by Number of Earners in Carlisle
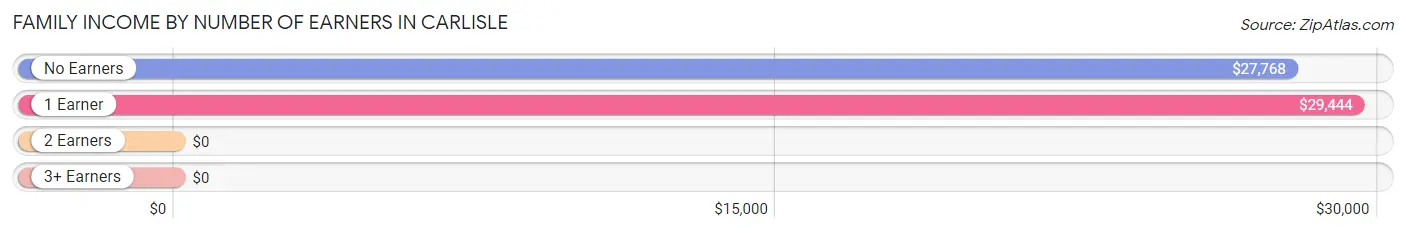
| Number of Earners | # Families | Median Income |
| No Earners | 53 (39.9%) | $27,768 |
| 1 Earner | 46 (34.6%) | $29,444 |
| 2 Earners | 34 (25.6%) | $0 |
| 3+ Earners | 0 (0.0%) | $0 |
| Total | 133 (100.0%) | $32,589 |
Household Income in Carlisle
Household Income Brackets in Carlisle
With 52 households falling in the category, the $50,000 to $74,999 income range is the most frequent in Carlisle, accounting for 26.4% of all households.
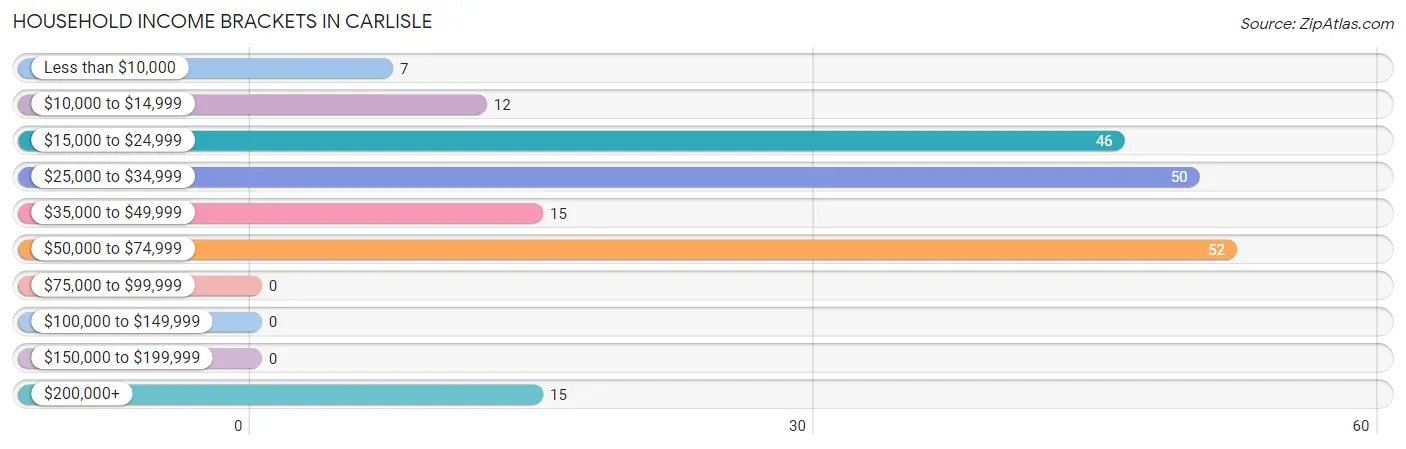
| Income Bracket | # Households | % Households |
| Less than $10,000 | 7 | 3.6% |
| $10,000 to $14,999 | 12 | 6.1% |
| $15,000 to $24,999 | 46 | 23.4% |
| $25,000 to $34,999 | 50 | 25.4% |
| $35,000 to $49,999 | 15 | 7.6% |
| $50,000 to $74,999 | 52 | 26.4% |
| $75,000 to $99,999 | 0 | 0.0% |
| $100,000 to $149,999 | 0 | 0.0% |
| $150,000 to $199,999 | 0 | 0.0% |
| $200,000+ | 15 | 7.6% |
Household Income by Householder Age in Carlisle
The median household income in Carlisle is $32,708, with the highest median household income of $40,583 found in the 45 to 64 years age bracket for the primary householder. A total of 75 households (38.1%) fall into this category.
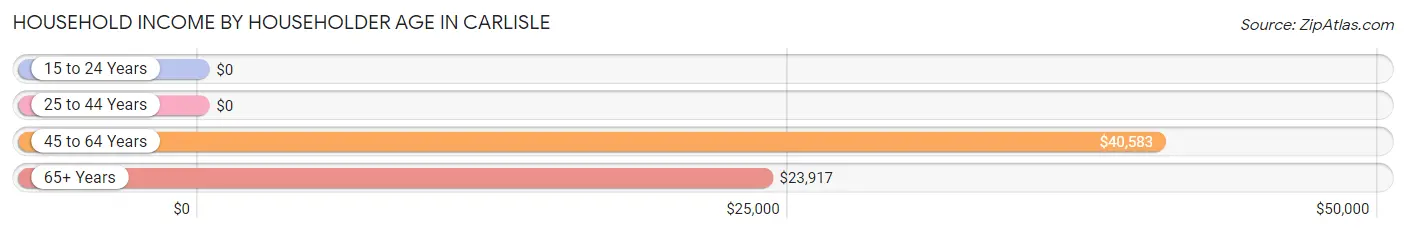
| Income Bracket | # Households | Median Income |
| 15 to 24 Years | 0 (0.0%) | $0 |
| 25 to 44 Years | 37 (18.8%) | $0 |
| 45 to 64 Years | 75 (38.1%) | $40,583 |
| 65+ Years | 85 (43.1%) | $23,917 |
| Total | 197 (100.0%) | $32,708 |
Poverty in Carlisle
Income Below Poverty by Sex and Age in Carlisle
With 25.7% poverty level for males and 40.0% for females among the residents of Carlisle, 5 year old males and 12 to 14 year old females are the most vulnerable to poverty, with 15 males (100.0%) and 33 females (100.0%) in their respective age groups living below the poverty level.
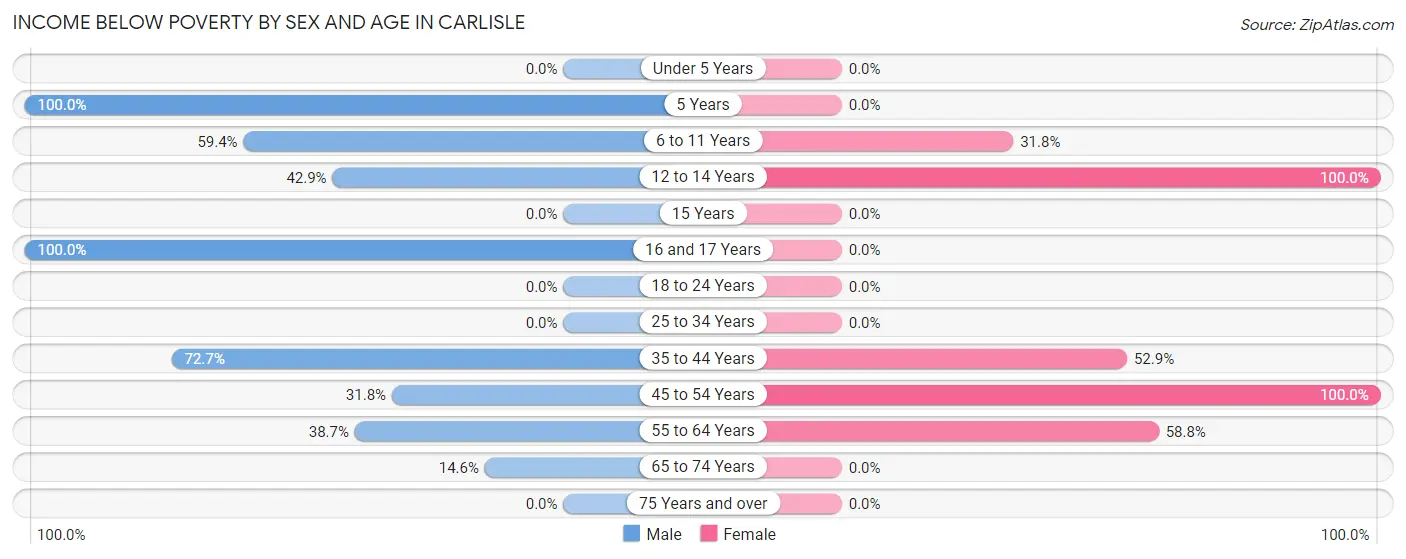
| Age Bracket | Male | Female |
| Under 5 Years | 0 (0.0%) | 0 (0.0%) |
| 5 Years | 15 (100.0%) | 0 (0.0%) |
| 6 to 11 Years | 19 (59.4%) | 7 (31.8%) |
| 12 to 14 Years | 9 (42.9%) | 33 (100.0%) |
| 15 Years | 0 (0.0%) | 0 (0.0%) |
| 16 and 17 Years | 4 (100.0%) | 0 (0.0%) |
| 18 to 24 Years | 0 (0.0%) | 0 (0.0%) |
| 25 to 34 Years | 0 (0.0%) | 0 (0.0%) |
| 35 to 44 Years | 16 (72.7%) | 18 (52.9%) |
| 45 to 54 Years | 7 (31.8%) | 10 (100.0%) |
| 55 to 64 Years | 12 (38.7%) | 20 (58.8%) |
| 65 to 74 Years | 7 (14.6%) | 0 (0.0%) |
| 75 Years and over | 0 (0.0%) | 0 (0.0%) |
| Total | 89 (25.7%) | 88 (40.0%) |
Income Above Poverty by Sex and Age in Carlisle
According to the poverty statistics in Carlisle, males aged under 5 years and females aged 25 to 34 years are the age groups that are most secure financially, with 100.0% of males and 100.0% of females in these age groups living above the poverty line.
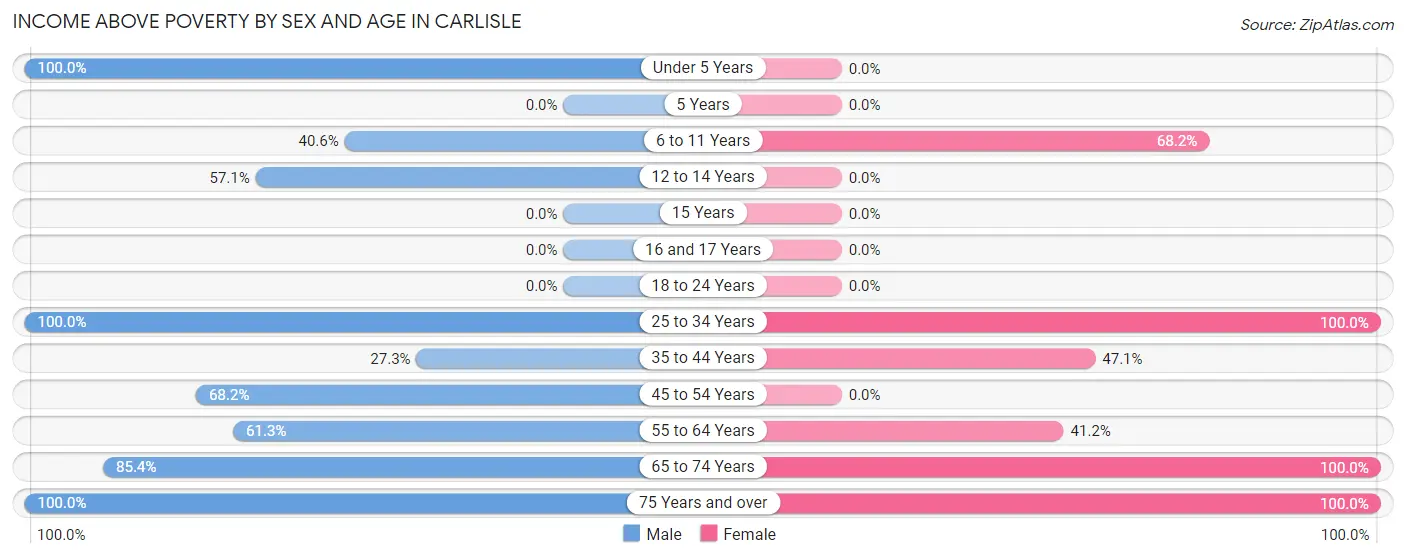
| Age Bracket | Male | Female |
| Under 5 Years | 18 (100.0%) | 0 (0.0%) |
| 5 Years | 0 (0.0%) | 0 (0.0%) |
| 6 to 11 Years | 13 (40.6%) | 15 (68.2%) |
| 12 to 14 Years | 12 (57.1%) | 0 (0.0%) |
| 15 Years | 0 (0.0%) | 0 (0.0%) |
| 16 and 17 Years | 0 (0.0%) | 0 (0.0%) |
| 18 to 24 Years | 0 (0.0%) | 0 (0.0%) |
| 25 to 34 Years | 19 (100.0%) | 21 (100.0%) |
| 35 to 44 Years | 6 (27.3%) | 16 (47.1%) |
| 45 to 54 Years | 15 (68.2%) | 0 (0.0%) |
| 55 to 64 Years | 19 (61.3%) | 14 (41.2%) |
| 65 to 74 Years | 41 (85.4%) | 36 (100.0%) |
| 75 Years and over | 115 (100.0%) | 30 (100.0%) |
| Total | 258 (74.4%) | 132 (60.0%) |
Income Below Poverty Among Married-Couple Families in Carlisle
The poverty statistics for married-couple families in Carlisle show that 27.2% or 34 of the total 125 families live below the poverty line. Families with 3 or 4 children have the highest poverty rate of 62.5%, comprising of 25 families. On the other hand, families with no children have the lowest poverty rate of 0.0%, which includes 0 families.
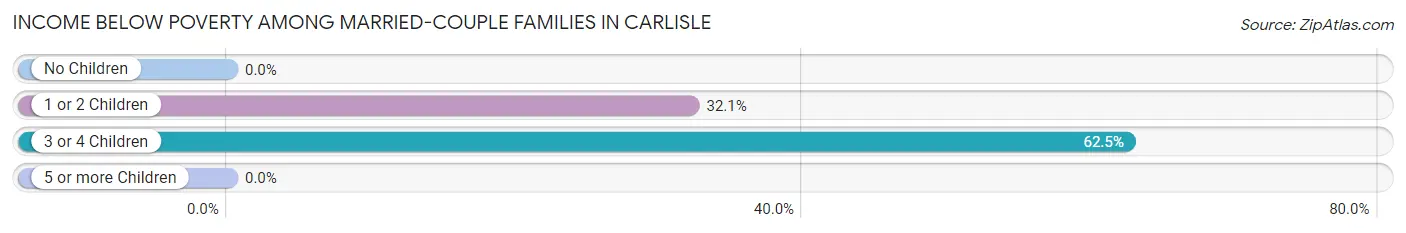
| Children | Above Poverty | Below Poverty |
| No Children | 57 (100.0%) | 0 (0.0%) |
| 1 or 2 Children | 19 (67.9%) | 9 (32.1%) |
| 3 or 4 Children | 15 (37.5%) | 25 (62.5%) |
| 5 or more Children | 0 (0.0%) | 0 (0.0%) |
| Total | 91 (72.8%) | 34 (27.2%) |
Income Below Poverty Among Single-Parent Households in Carlisle
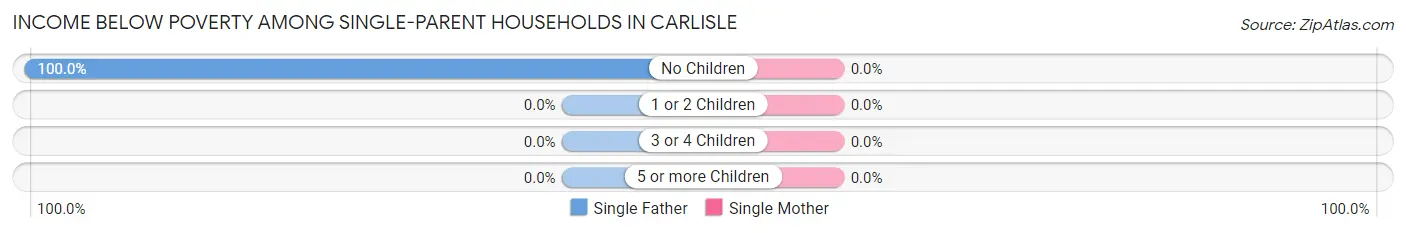
| Children | Single Father | Single Mother |
| No Children | 3 (100.0%) | 0 (0.0%) |
| 1 or 2 Children | 0 (0.0%) | 0 (0.0%) |
| 3 or 4 Children | 0 (0.0%) | 0 (0.0%) |
| 5 or more Children | 0 (0.0%) | 0 (0.0%) |
| Total | 3 (100.0%) | 0 (0.0%) |
Income Below Poverty Among Married-Couple vs Single-Parent Households in Carlisle
The poverty data for Carlisle shows that 34 of the married-couple family households (27.2%) and 3 of the single-parent households (37.5%) are living below the poverty level. Within the married-couple family households, those with 3 or 4 children have the highest poverty rate, with 25 households (62.5%) falling below the poverty line. Among the single-parent households, those with no children have the highest poverty rate, with 3 household (37.5%) living below poverty.
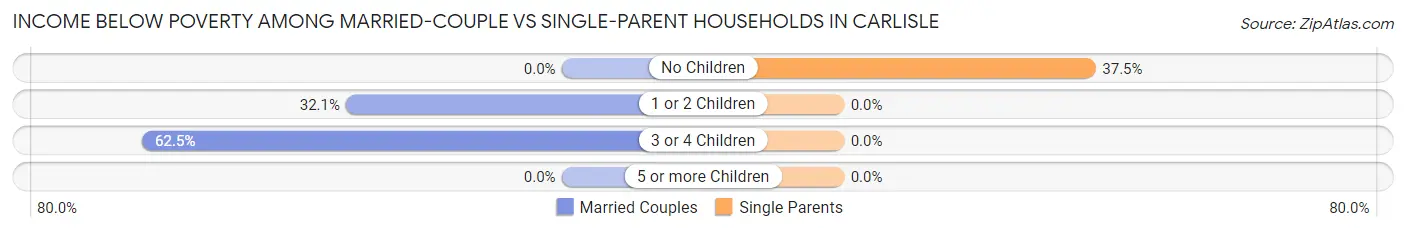
| Children | Married-Couple Families | Single-Parent Households |
| No Children | 0 (0.0%) | 3 (37.5%) |
| 1 or 2 Children | 9 (32.1%) | 0 (0.0%) |
| 3 or 4 Children | 25 (62.5%) | 0 (0.0%) |
| 5 or more Children | 0 (0.0%) | 0 (0.0%) |
| Total | 34 (27.2%) | 3 (37.5%) |
Race in Carlisle
The most populous races in Carlisle are White / Caucasian (322 | 56.8%), Native / Alaskan (149 | 26.3%), and Two or more Races (96 | 16.9%).
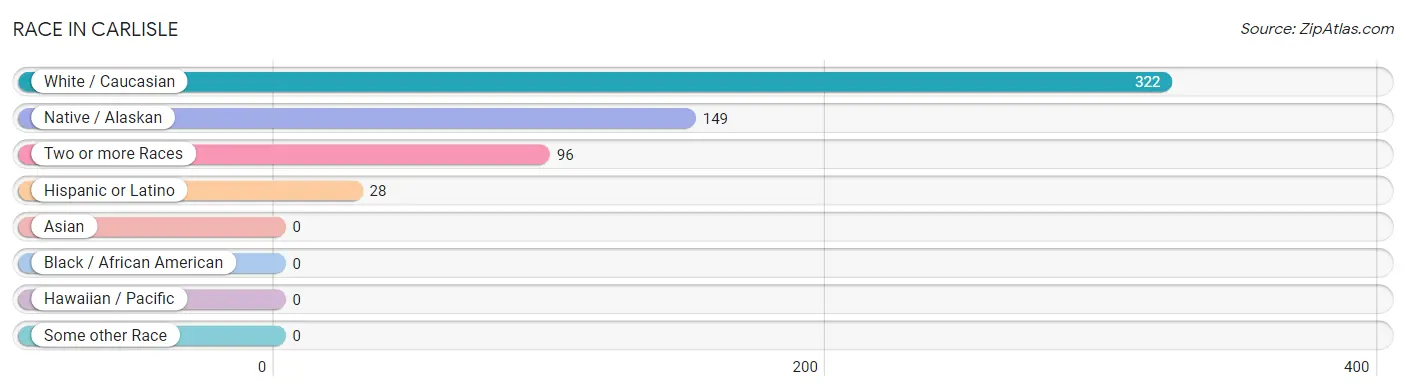
| Race | # Population | % Population |
| Asian | 0 | 0.0% |
| Black / African American | 0 | 0.0% |
| Hawaiian / Pacific | 0 | 0.0% |
| Hispanic or Latino | 28 | 4.9% |
| Native / Alaskan | 149 | 26.3% |
| White / Caucasian | 322 | 56.8% |
| Two or more Races | 96 | 16.9% |
| Some other Race | 0 | 0.0% |
| Total | 567 | 100.0% |
Ancestry in Carlisle
The most populous ancestries reported in Carlisle are Cherokee (225 | 39.7%), German (70 | 12.3%), American (57 | 10.1%), European (30 | 5.3%), and Mexican (28 | 4.9%), together accounting for 72.3% of all Carlisle residents.
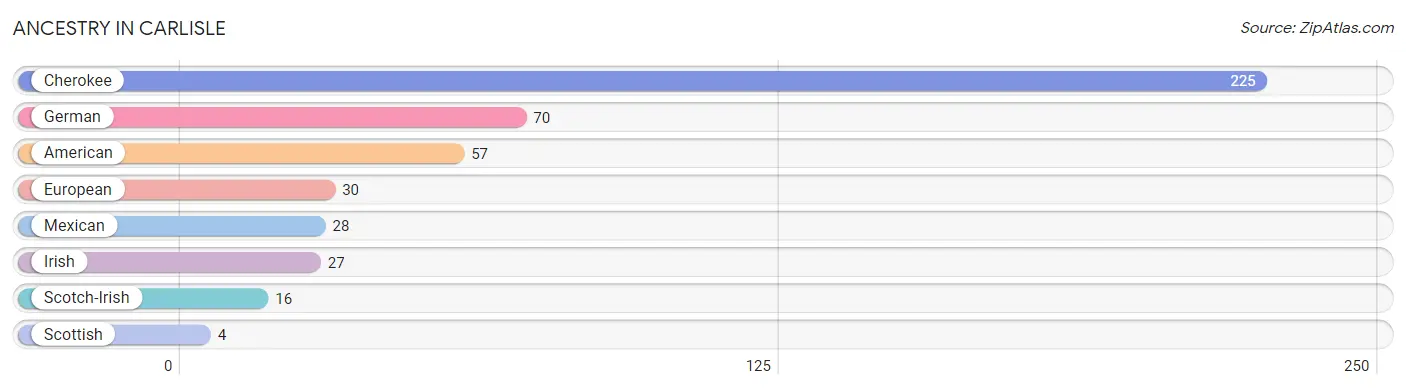
| Ancestry | # Population | % Population |
| American | 57 | 10.1% |
| Cherokee | 225 | 39.7% |
| European | 30 | 5.3% |
| German | 70 | 12.3% |
| Irish | 27 | 4.8% |
| Mexican | 28 | 4.9% |
| Scotch-Irish | 16 | 2.8% |
| Scottish | 4 | 0.7% | View All 8 Rows |
Immigrants in Carlisle

| Immigration Origin | # Population | % Population | View All 0 Rows |
Sex and Age in Carlisle
Sex and Age in Carlisle
The most populous age groups in Carlisle are 85 Years and over (73 | 21.0%) for men and 10 to 14 Years (48 | 21.8%) for women.
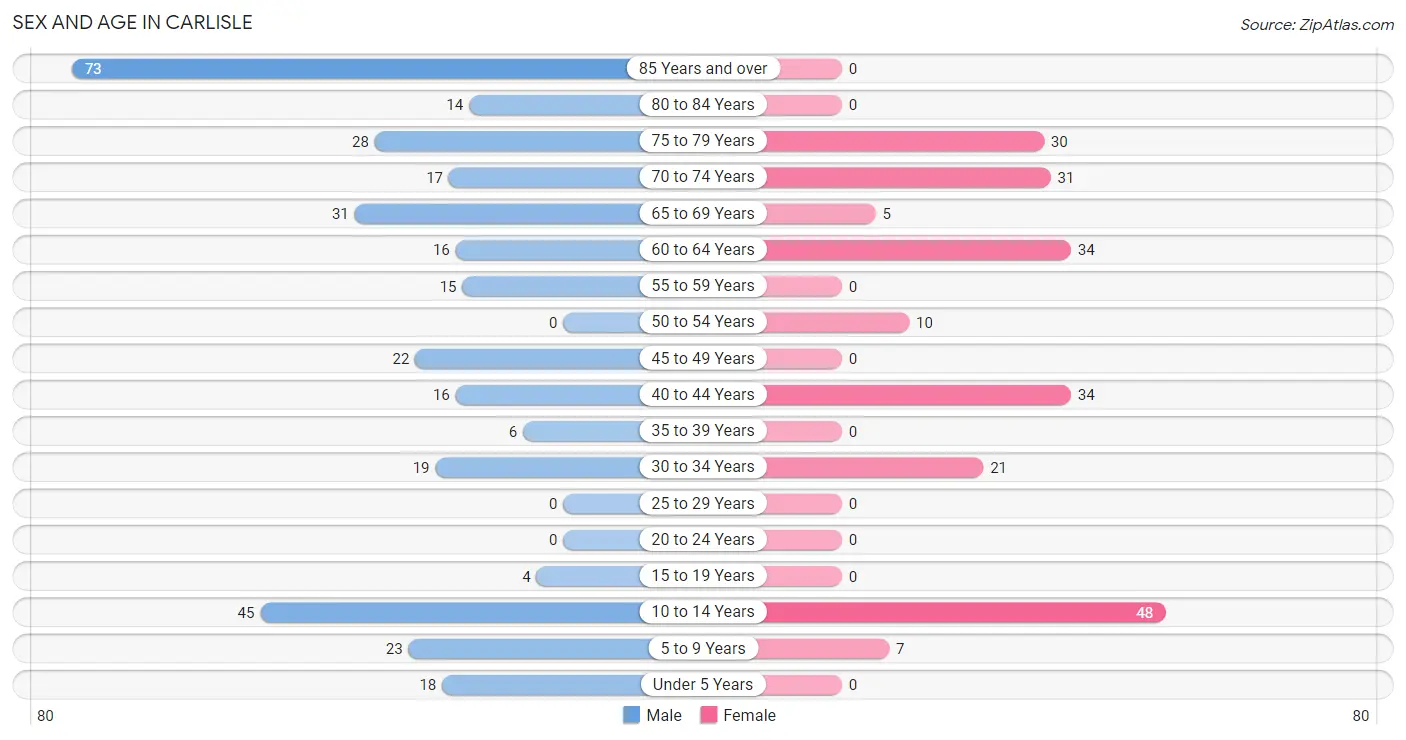
| Age Bracket | Male | Female |
| Under 5 Years | 18 (5.2%) | 0 (0.0%) |
| 5 to 9 Years | 23 (6.6%) | 7 (3.2%) |
| 10 to 14 Years | 45 (13.0%) | 48 (21.8%) |
| 15 to 19 Years | 4 (1.1%) | 0 (0.0%) |
| 20 to 24 Years | 0 (0.0%) | 0 (0.0%) |
| 25 to 29 Years | 0 (0.0%) | 0 (0.0%) |
| 30 to 34 Years | 19 (5.5%) | 21 (9.6%) |
| 35 to 39 Years | 6 (1.7%) | 0 (0.0%) |
| 40 to 44 Years | 16 (4.6%) | 34 (15.4%) |
| 45 to 49 Years | 22 (6.3%) | 0 (0.0%) |
| 50 to 54 Years | 0 (0.0%) | 10 (4.5%) |
| 55 to 59 Years | 15 (4.3%) | 0 (0.0%) |
| 60 to 64 Years | 16 (4.6%) | 34 (15.4%) |
| 65 to 69 Years | 31 (8.9%) | 5 (2.3%) |
| 70 to 74 Years | 17 (4.9%) | 31 (14.1%) |
| 75 to 79 Years | 28 (8.1%) | 30 (13.6%) |
| 80 to 84 Years | 14 (4.0%) | 0 (0.0%) |
| 85 Years and over | 73 (21.0%) | 0 (0.0%) |
| Total | 347 (100.0%) | 220 (100.0%) |
Families and Households in Carlisle
Median Family Size in Carlisle
The median family size in Carlisle is 3.23 persons per family, with married-couple families (125 | 94.0%) accounting for the largest median family size of 3.3 persons per family. On the other hand, single male/father families (3 | 2.3%) represent the smallest median family size with 2.00 persons per family.
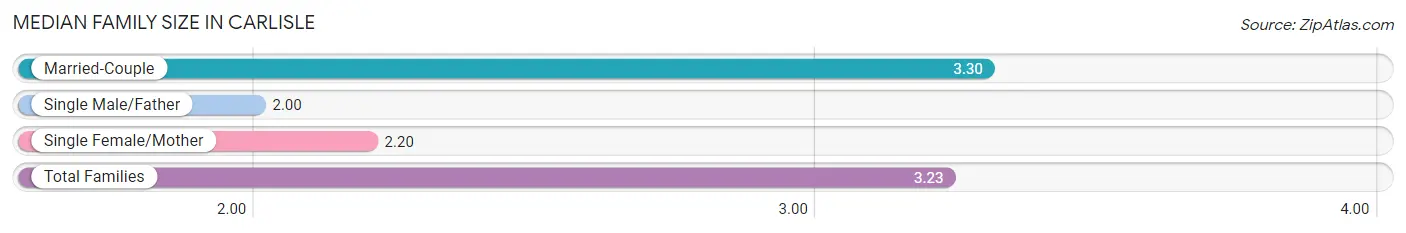
| Family Type | # Families | Family Size |
| Married-Couple | 125 (94.0%) | 3.30 |
| Single Male/Father | 3 (2.3%) | 2.00 |
| Single Female/Mother | 5 (3.8%) | 2.20 |
| Total Families | 133 (100.0%) | 3.23 |
Median Household Size in Carlisle
The median household size in Carlisle is 2.88 persons per household, with single male/father households (3 | 1.5%) accounting for the largest median household size of 3.33 persons per household. non-family households (64 | 32.5%) represent the smallest median household size with 2.09 persons per household.
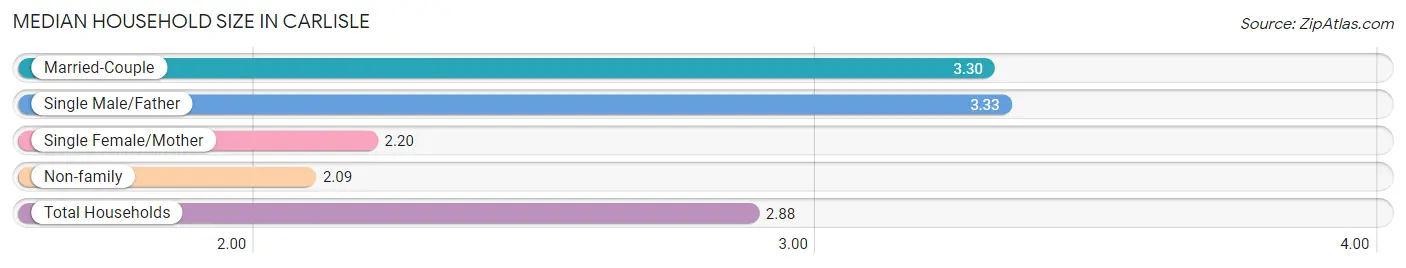
| Household Type | # Households | Household Size |
| Married-Couple | 125 (63.4%) | 3.30 |
| Single Male/Father | 3 (1.5%) | 3.33 |
| Single Female/Mother | 5 (2.5%) | 2.20 |
| Non-family | 64 (32.5%) | 2.09 |
| Total Households | 197 (100.0%) | 2.88 |
Household Size by Marriage Status in Carlisle
Out of a total of 197 households in Carlisle, 133 (67.5%) are family households, while 64 (32.5%) are nonfamily households. The most numerous type of family households are 2-person households, comprising 62, and the most common type of nonfamily households are 1-person households, comprising 53.
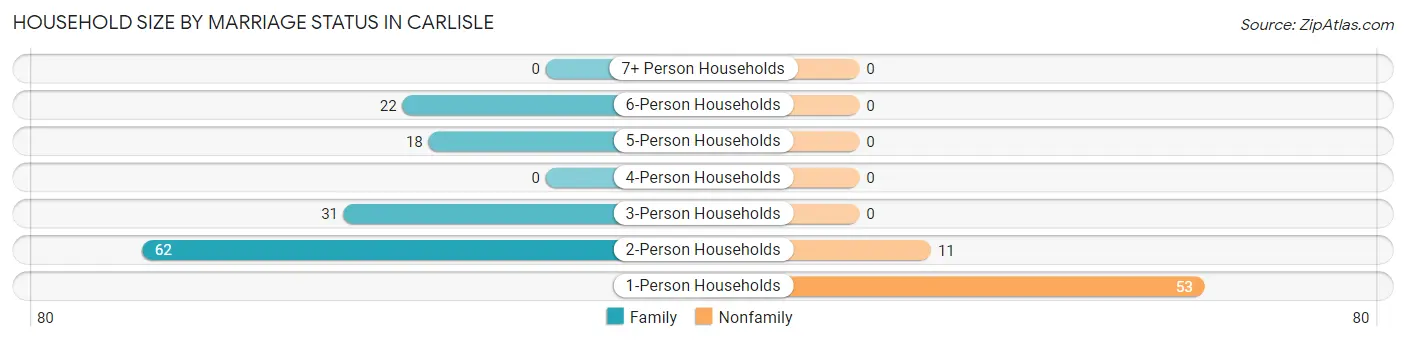
| Household Size | Family Households | Nonfamily Households |
| 1-Person Households | - | 53 (26.9%) |
| 2-Person Households | 62 (31.5%) | 11 (5.6%) |
| 3-Person Households | 31 (15.7%) | 0 (0.0%) |
| 4-Person Households | 0 (0.0%) | 0 (0.0%) |
| 5-Person Households | 18 (9.1%) | 0 (0.0%) |
| 6-Person Households | 22 (11.2%) | 0 (0.0%) |
| 7+ Person Households | 0 (0.0%) | 0 (0.0%) |
| Total | 133 (67.5%) | 64 (32.5%) |
Female Fertility in Carlisle
Fertility by Age in Carlisle
Average fertility rate in Carlisle is 362.0 births per 1,000 women. Women in the age bracket of 20 to 34 years have the highest fertility rate with 1,000.0 births per 1,000 women. Women in the age bracket of 20 to 34 years acount for 100.0% of all women with births.
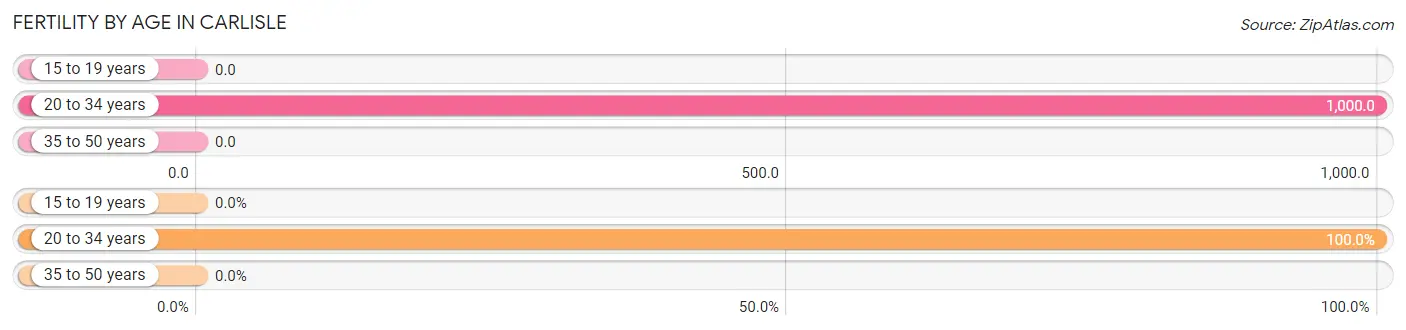
| Age Bracket | Women with Births | Births / 1,000 Women |
| 15 to 19 years | 0 (0.0%) | 0.0 |
| 20 to 34 years | 21 (100.0%) | 1,000.0 |
| 35 to 50 years | 0 (0.0%) | 0.0 |
| Total | 21 (100.0%) | 362.0 |
Fertility by Age by Marriage Status in Carlisle
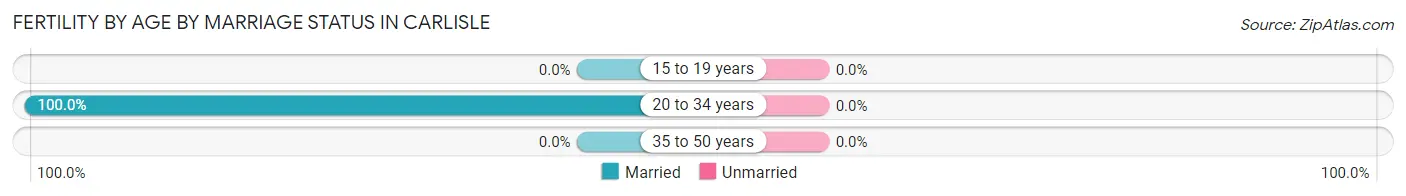
| Age Bracket | Married | Unmarried |
| 15 to 19 years | 0 (0.0%) | 0 (0.0%) |
| 20 to 34 years | 21 (100.0%) | 0 (0.0%) |
| 35 to 50 years | 0 (0.0%) | 0 (0.0%) |
| Total | 21 (100.0%) | 0 (0.0%) |
Fertility by Education in Carlisle
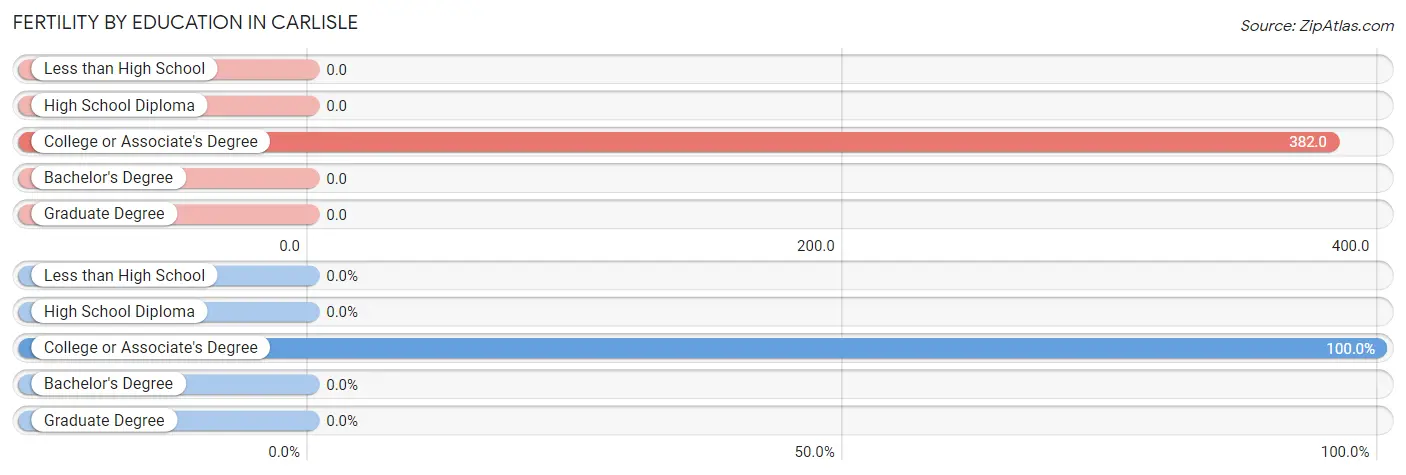
| Educational Attainment | Women with Births | Births / 1,000 Women |
| Less than High School | 0 (0.0%) | 0.0 |
| High School Diploma | 0 (0.0%) | 0.0 |
| College or Associate's Degree | 21 (100.0%) | 382.0 |
| Bachelor's Degree | 0 (0.0%) | 0.0 |
| Graduate Degree | 0 (0.0%) | 0.0 |
| Total | 21 (100.0%) | 362.0 |
Fertility by Education by Marriage Status in Carlisle
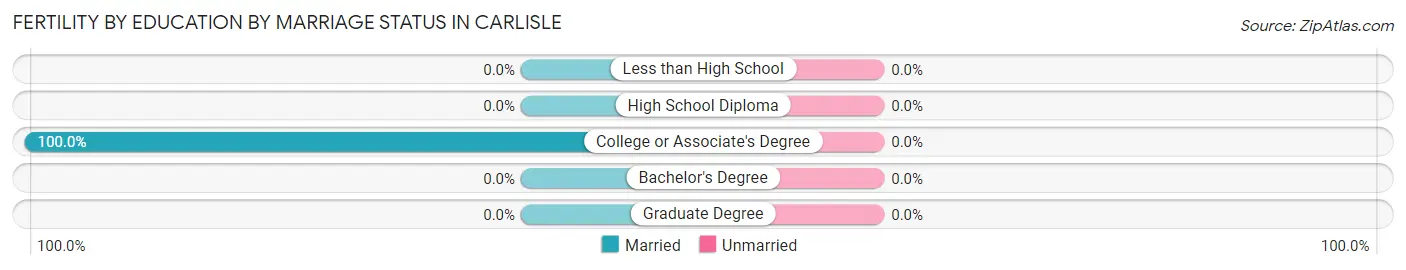
| Educational Attainment | Married | Unmarried |
| Less than High School | 0 (0.0%) | 0 (0.0%) |
| High School Diploma | 0 (0.0%) | 0 (0.0%) |
| College or Associate's Degree | 21 (100.0%) | 0 (0.0%) |
| Bachelor's Degree | 0 (0.0%) | 0 (0.0%) |
| Graduate Degree | 0 (0.0%) | 0 (0.0%) |
| Total | 21 (100.0%) | 0 (0.0%) |
Employment Characteristics in Carlisle
Employment by Class of Employer in Carlisle
Among the 120 employed individuals in Carlisle, private company employees (65 | 54.2%), federal government employees (21 | 17.5%), and state government employees (19 | 15.8%) make up the most common classes of employment.
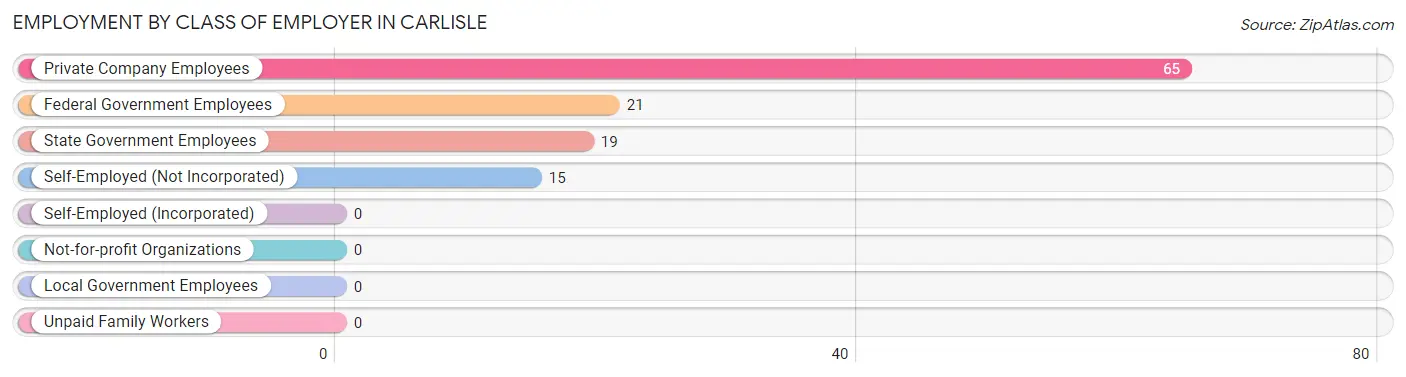
| Employer Class | # Employees | % Employees |
| Private Company Employees | 65 | 54.2% |
| Self-Employed (Incorporated) | 0 | 0.0% |
| Self-Employed (Not Incorporated) | 15 | 12.5% |
| Not-for-profit Organizations | 0 | 0.0% |
| Local Government Employees | 0 | 0.0% |
| State Government Employees | 19 | 15.8% |
| Federal Government Employees | 21 | 17.5% |
| Unpaid Family Workers | 0 | 0.0% |
| Total | 120 | 100.0% |
Employment Status by Age in Carlisle
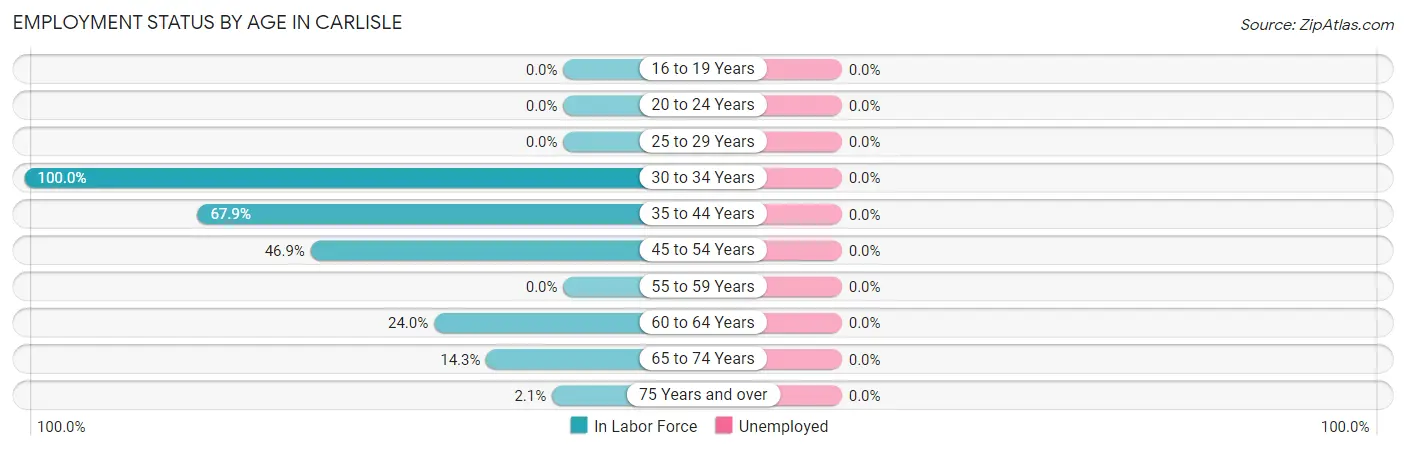
| Age Bracket | In Labor Force | Unemployed |
| 16 to 19 Years | 0 (0.0%) | 0 (0.0%) |
| 20 to 24 Years | 0 (0.0%) | 0 (0.0%) |
| 25 to 29 Years | 0 (0.0%) | 0 (0.0%) |
| 30 to 34 Years | 40 (100.0%) | 0 (0.0%) |
| 35 to 44 Years | 38 (67.9%) | 0 (0.0%) |
| 45 to 54 Years | 15 (46.9%) | 0 (0.0%) |
| 55 to 59 Years | 0 (0.0%) | 0 (0.0%) |
| 60 to 64 Years | 12 (24.0%) | 0 (0.0%) |
| 65 to 74 Years | 12 (14.3%) | 0 (0.0%) |
| 75 Years and over | 3 (2.1%) | 0 (0.0%) |
| Total | 120 (28.2%) | 0 (0.0%) |
Employment Status by Educational Attainment in Carlisle
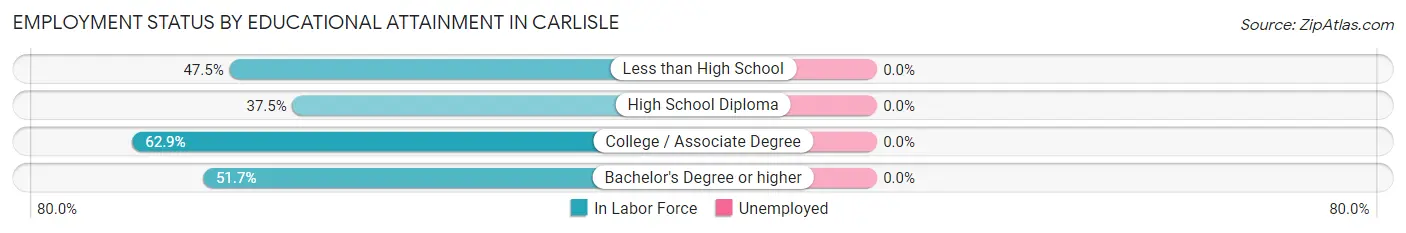
| Educational Attainment | In Labor Force | Unemployed |
| Less than High School | 28 (47.5%) | 0 (0.0%) |
| High School Diploma | 6 (37.5%) | 0 (0.0%) |
| College / Associate Degree | 56 (62.9%) | 0 (0.0%) |
| Bachelor's Degree or higher | 15 (51.7%) | 0 (0.0%) |
| Total | 105 (54.4%) | 0 (0.0%) |
Employment Occupations by Sex in Carlisle
Management, Business, Science and Arts Occupations
The most common Management, Business, Science and Arts occupations in Carlisle are , and Management (12 | 10.0%).
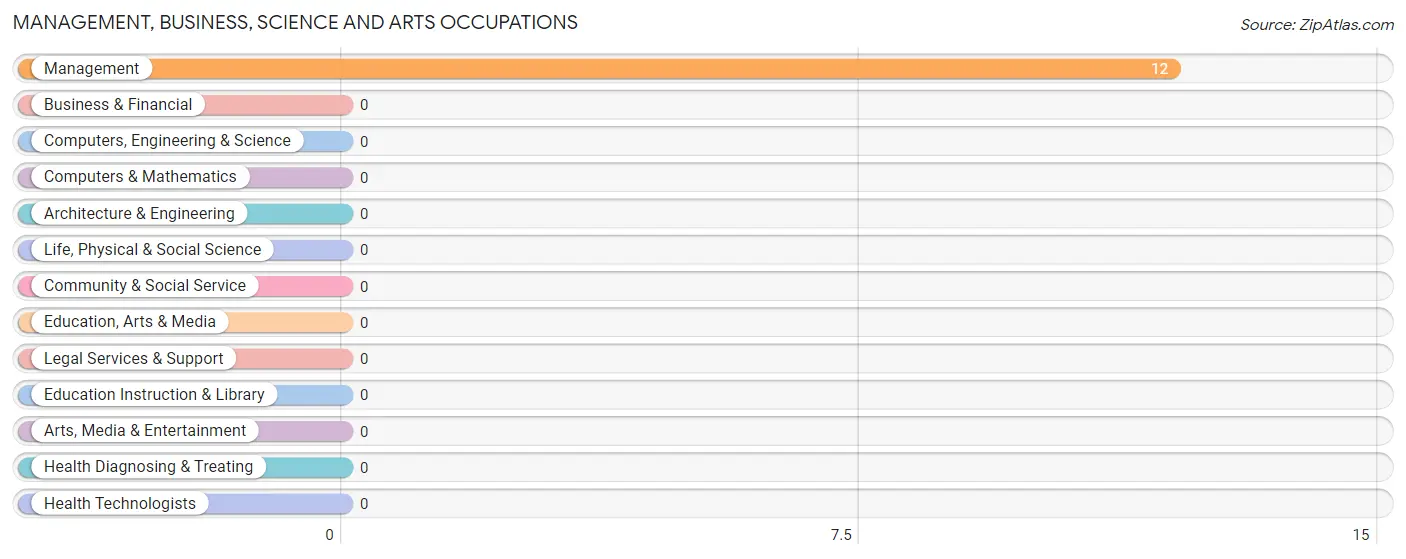
Management, Business, Science and Arts Occupations by Sex
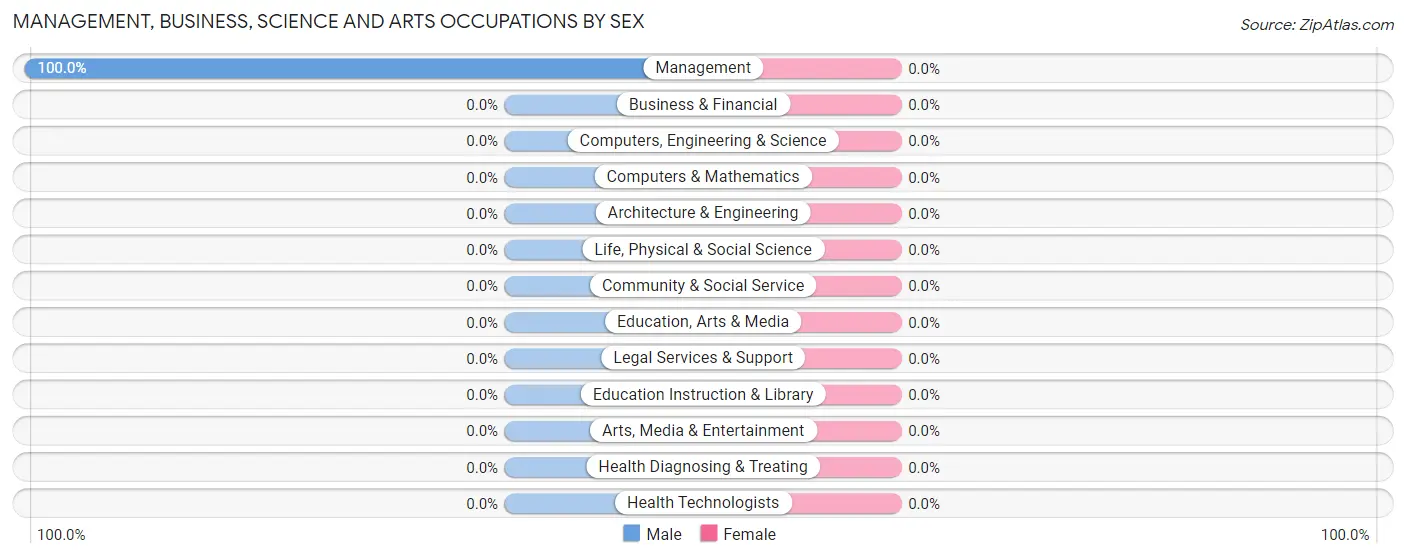
| Occupation | Male | Female |
| Management | 12 (100.0%) | 0 (0.0%) |
| Business & Financial | 0 (0.0%) | 0 (0.0%) |
| Computers, Engineering & Science | 0 (0.0%) | 0 (0.0%) |
| Computers & Mathematics | 0 (0.0%) | 0 (0.0%) |
| Architecture & Engineering | 0 (0.0%) | 0 (0.0%) |
| Life, Physical & Social Science | 0 (0.0%) | 0 (0.0%) |
| Community & Social Service | 0 (0.0%) | 0 (0.0%) |
| Education, Arts & Media | 0 (0.0%) | 0 (0.0%) |
| Legal Services & Support | 0 (0.0%) | 0 (0.0%) |
| Education Instruction & Library | 0 (0.0%) | 0 (0.0%) |
| Arts, Media & Entertainment | 0 (0.0%) | 0 (0.0%) |
| Health Diagnosing & Treating | 0 (0.0%) | 0 (0.0%) |
| Health Technologists | 0 (0.0%) | 0 (0.0%) |
| Total (Category) | 12 (100.0%) | 0 (0.0%) |
| Total (Overall) | 83 (69.2%) | 37 (30.8%) |
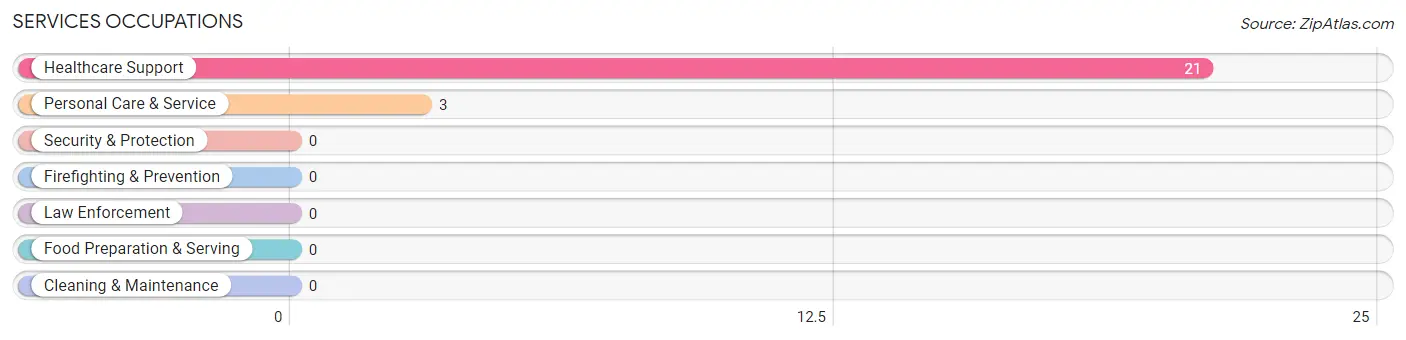
Services Occupations
The most common Services occupations in Carlisle are Healthcare Support (21 | 17.5%), and Personal Care & Service (3 | 2.5%).
Services Occupations by Sex
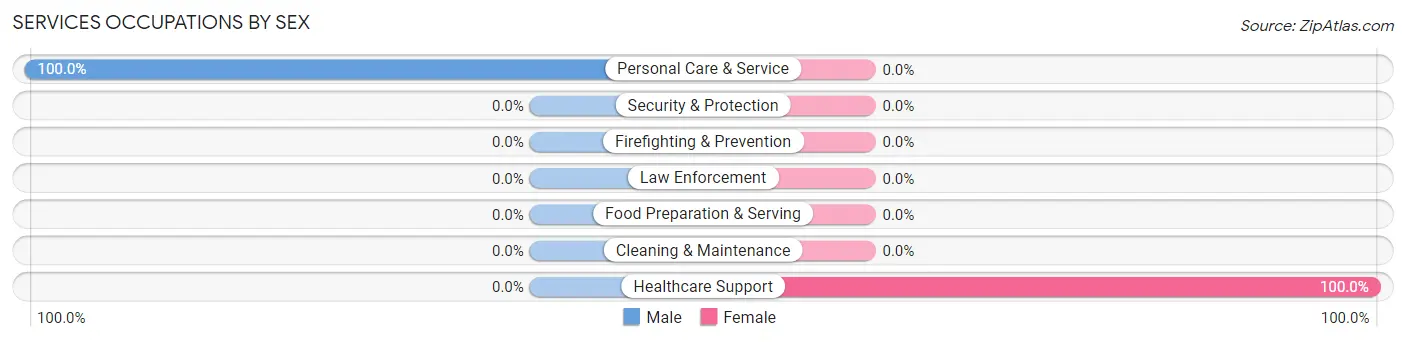
| Occupation | Male | Female |
| Healthcare Support | 0 (0.0%) | 21 (100.0%) |
| Security & Protection | 0 (0.0%) | 0 (0.0%) |
| Firefighting & Prevention | 0 (0.0%) | 0 (0.0%) |
| Law Enforcement | 0 (0.0%) | 0 (0.0%) |
| Food Preparation & Serving | 0 (0.0%) | 0 (0.0%) |
| Cleaning & Maintenance | 0 (0.0%) | 0 (0.0%) |
| Personal Care & Service | 3 (100.0%) | 0 (0.0%) |
| Total (Category) | 3 (12.5%) | 21 (87.5%) |
| Total (Overall) | 83 (69.2%) | 37 (30.8%) |
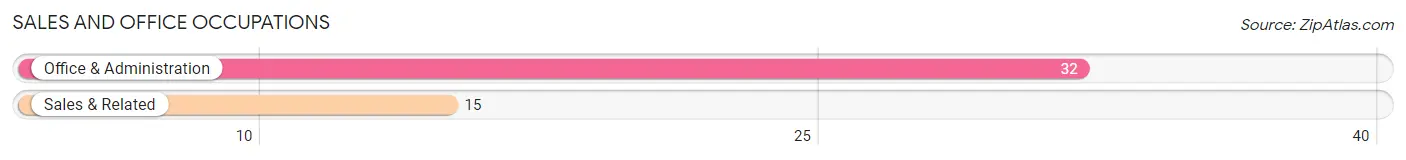
Sales and Office Occupations
The most common Sales and Office occupations in Carlisle are Office & Administration (32 | 26.7%), and Sales & Related (15 | 12.5%).
Sales and Office Occupations by Sex
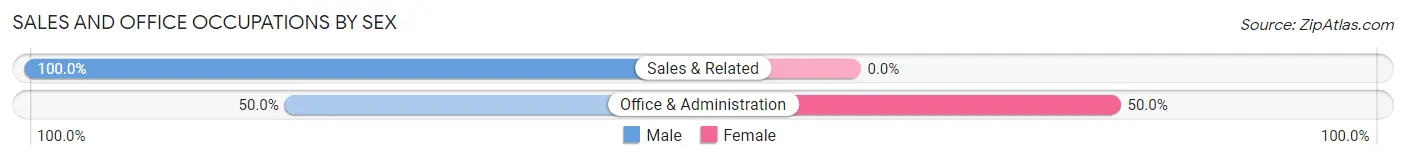
| Occupation | Male | Female |
| Sales & Related | 15 (100.0%) | 0 (0.0%) |
| Office & Administration | 16 (50.0%) | 16 (50.0%) |
| Total (Category) | 31 (66.0%) | 16 (34.0%) |
| Total (Overall) | 83 (69.2%) | 37 (30.8%) |
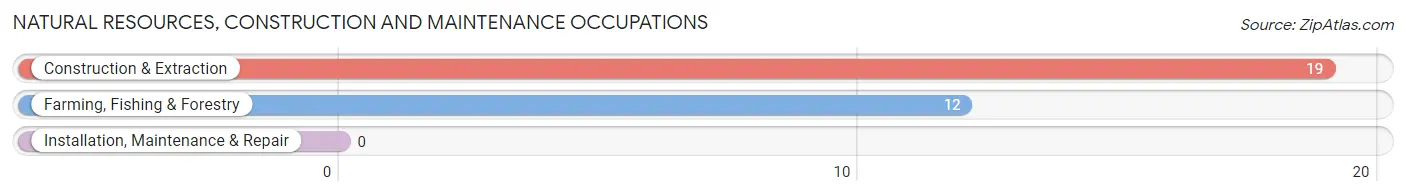
Natural Resources, Construction and Maintenance Occupations
The most common Natural Resources, Construction and Maintenance occupations in Carlisle are Construction & Extraction (19 | 15.8%), and Farming, Fishing & Forestry (12 | 10.0%).
Natural Resources, Construction and Maintenance Occupations by Sex
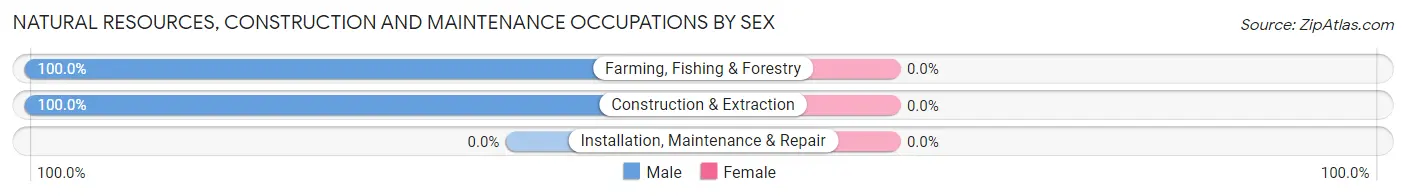
| Occupation | Male | Female |
| Farming, Fishing & Forestry | 12 (100.0%) | 0 (0.0%) |
| Construction & Extraction | 19 (100.0%) | 0 (0.0%) |
| Installation, Maintenance & Repair | 0 (0.0%) | 0 (0.0%) |
| Total (Category) | 31 (100.0%) | 0 (0.0%) |
| Total (Overall) | 83 (69.2%) | 37 (30.8%) |
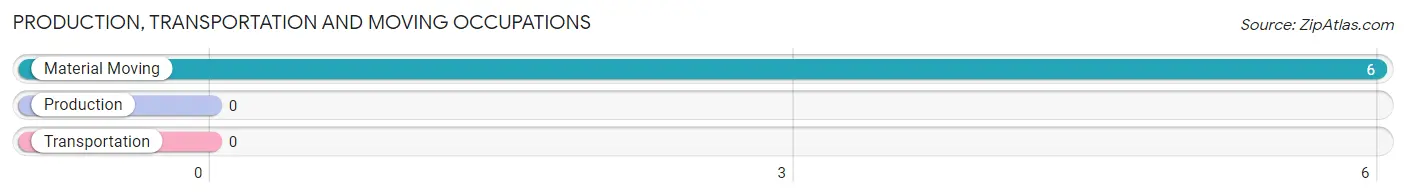
Production, Transportation and Moving Occupations
The most common Production, Transportation and Moving occupations in Carlisle are , and Material Moving (6 | 5.0%).
Production, Transportation and Moving Occupations by Sex
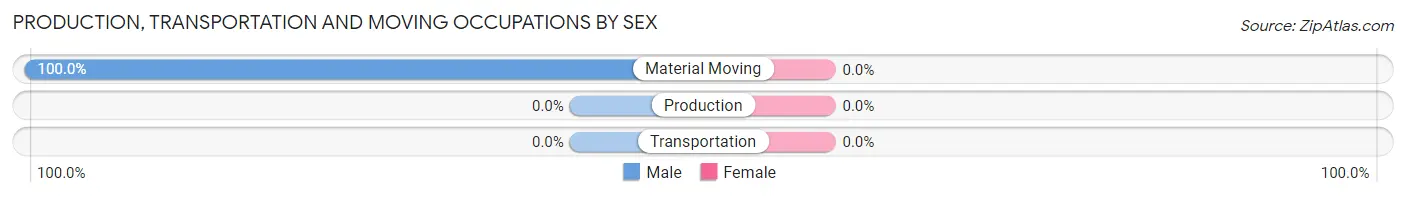
| Occupation | Male | Female |
| Production | 0 (0.0%) | 0 (0.0%) |
| Transportation | 0 (0.0%) | 0 (0.0%) |
| Material Moving | 6 (100.0%) | 0 (0.0%) |
| Total (Category) | 6 (100.0%) | 0 (0.0%) |
| Total (Overall) | 83 (69.2%) | 37 (30.8%) |
Employment Industries by Sex in Carlisle
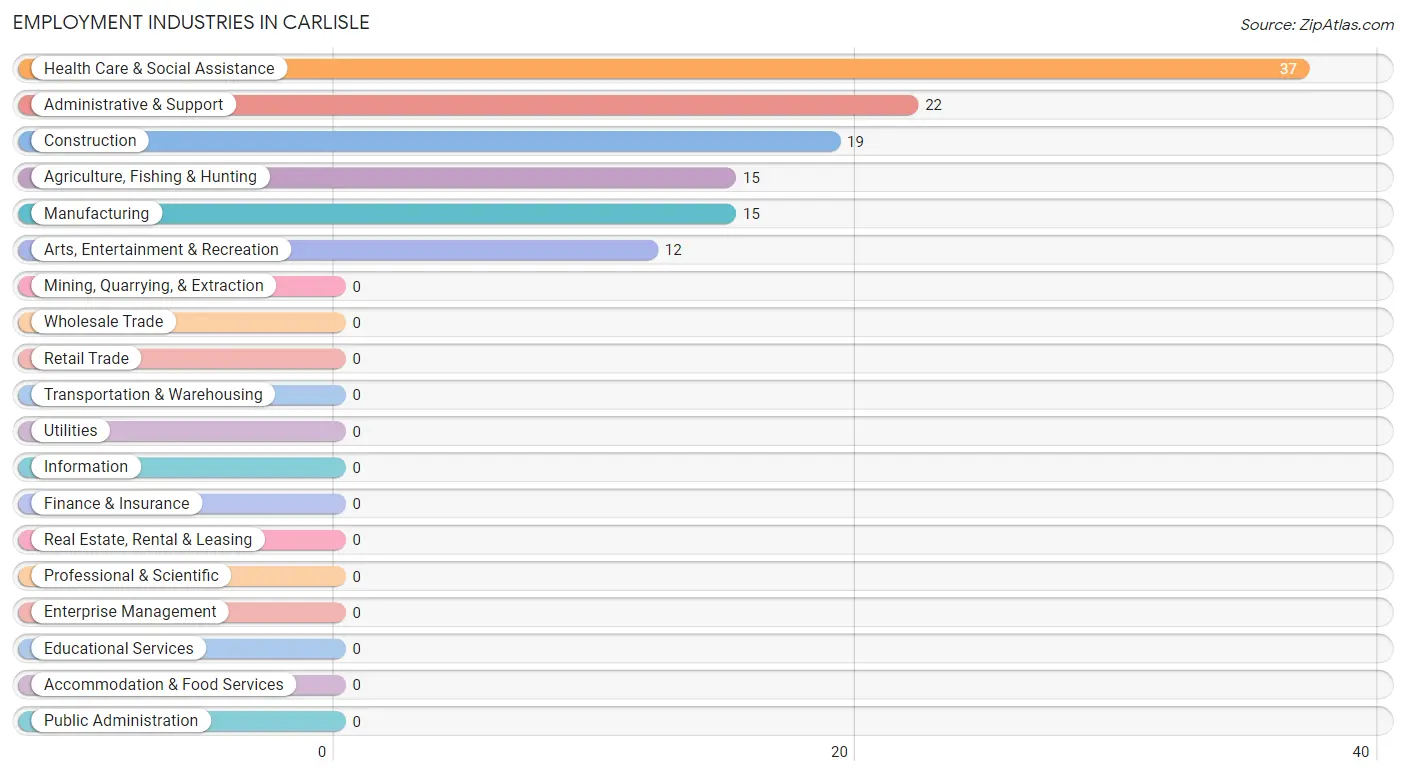
Employment Industries in Carlisle
The major employment industries in Carlisle include Health Care & Social Assistance (37 | 30.8%), Administrative & Support (22 | 18.3%), Construction (19 | 15.8%), Agriculture, Fishing & Hunting (15 | 12.5%), and Manufacturing (15 | 12.5%).
Employment Industries by Sex in Carlisle
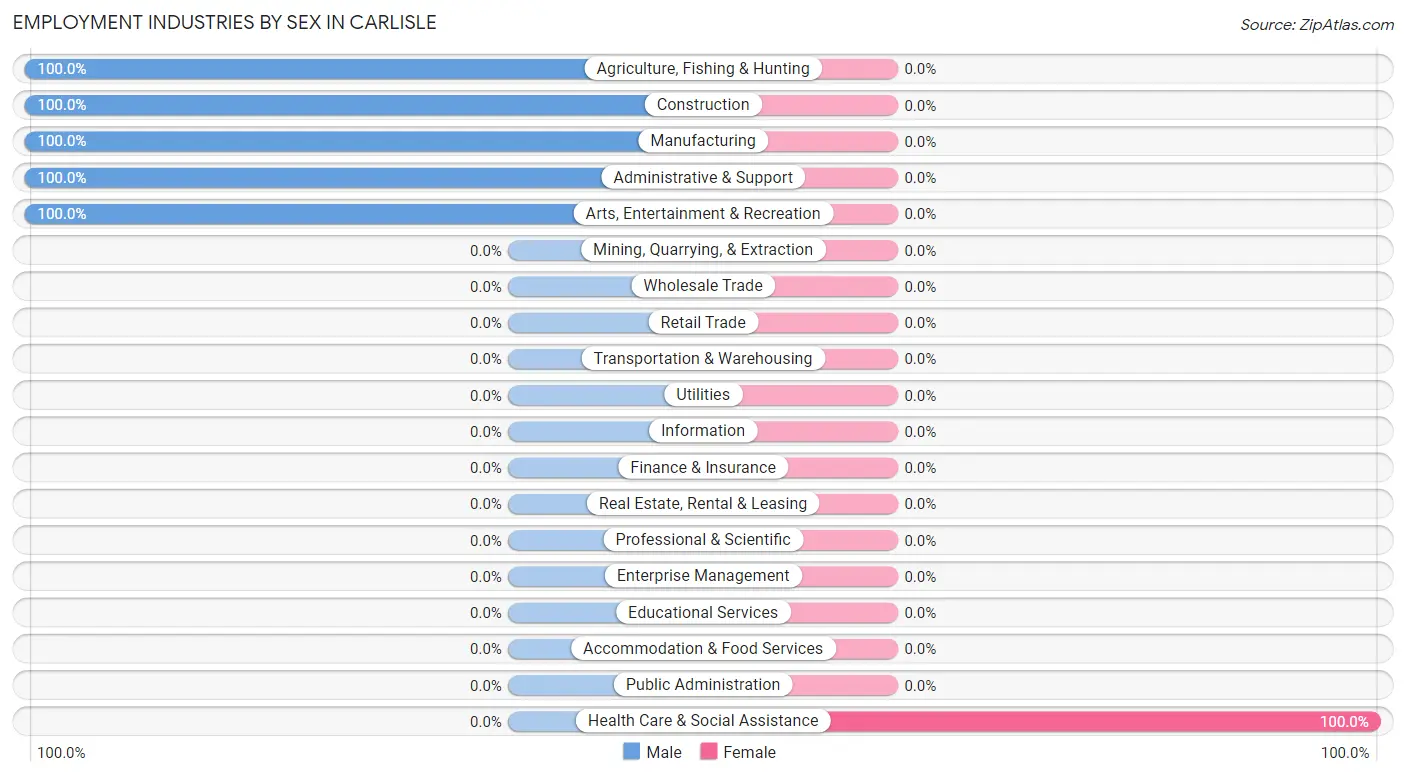
| Industry | Male | Female |
| Agriculture, Fishing & Hunting | 15 (100.0%) | 0 (0.0%) |
| Mining, Quarrying, & Extraction | 0 (0.0%) | 0 (0.0%) |
| Construction | 19 (100.0%) | 0 (0.0%) |
| Manufacturing | 15 (100.0%) | 0 (0.0%) |
| Wholesale Trade | 0 (0.0%) | 0 (0.0%) |
| Retail Trade | 0 (0.0%) | 0 (0.0%) |
| Transportation & Warehousing | 0 (0.0%) | 0 (0.0%) |
| Utilities | 0 (0.0%) | 0 (0.0%) |
| Information | 0 (0.0%) | 0 (0.0%) |
| Finance & Insurance | 0 (0.0%) | 0 (0.0%) |
| Real Estate, Rental & Leasing | 0 (0.0%) | 0 (0.0%) |
| Professional & Scientific | 0 (0.0%) | 0 (0.0%) |
| Enterprise Management | 0 (0.0%) | 0 (0.0%) |
| Administrative & Support | 22 (100.0%) | 0 (0.0%) |
| Educational Services | 0 (0.0%) | 0 (0.0%) |
| Health Care & Social Assistance | 0 (0.0%) | 37 (100.0%) |
| Arts, Entertainment & Recreation | 12 (100.0%) | 0 (0.0%) |
| Accommodation & Food Services | 0 (0.0%) | 0 (0.0%) |
| Public Administration | 0 (0.0%) | 0 (0.0%) |
| Total | 83 (69.2%) | 37 (30.8%) |
Education in Carlisle
School Enrollment in Carlisle
The most common levels of schooling among the 146 students in Carlisle are middle school (82 | 56.2%), high school (20 | 13.7%), and elementary school (19 | 13.0%).
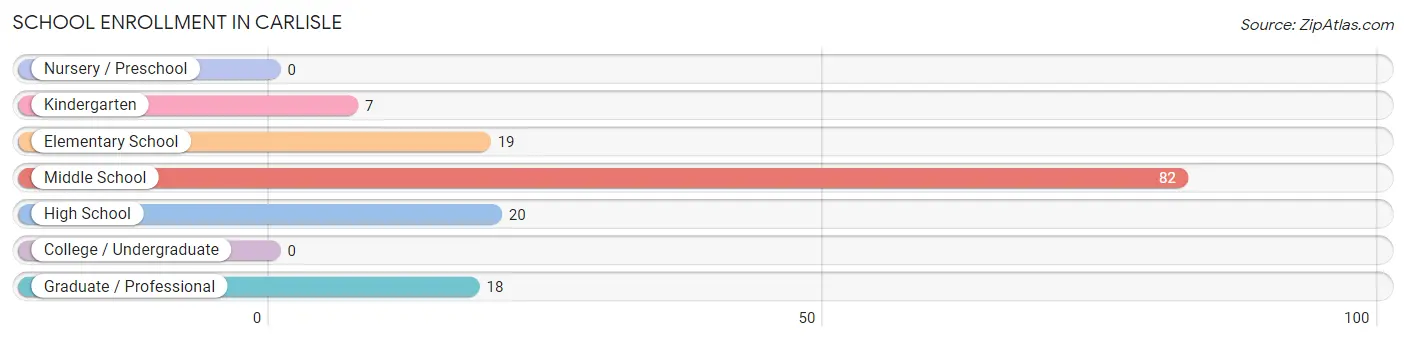
| School Level | # Students | % Students |
| Nursery / Preschool | 0 | 0.0% |
| Kindergarten | 7 | 4.8% |
| Elementary School | 19 | 13.0% |
| Middle School | 82 | 56.2% |
| High School | 20 | 13.7% |
| College / Undergraduate | 0 | 0.0% |
| Graduate / Professional | 18 | 12.3% |
| Total | 146 | 100.0% |
School Enrollment by Age by Funding Source in Carlisle
Out of a total of 146 students who are enrolled in schools in Carlisle, 18 (12.3%) attend a private institution, while the remaining 128 (87.7%) are enrolled in public schools. The age group of 35 years and over has the highest likelihood of being enrolled in private schools, with 18 (52.9% in the age bracket) enrolled. Conversely, the age group of 5 to 9 year old has the lowest likelihood of being enrolled in a private school, with 15 (100.0% in the age bracket) attending a public institution.
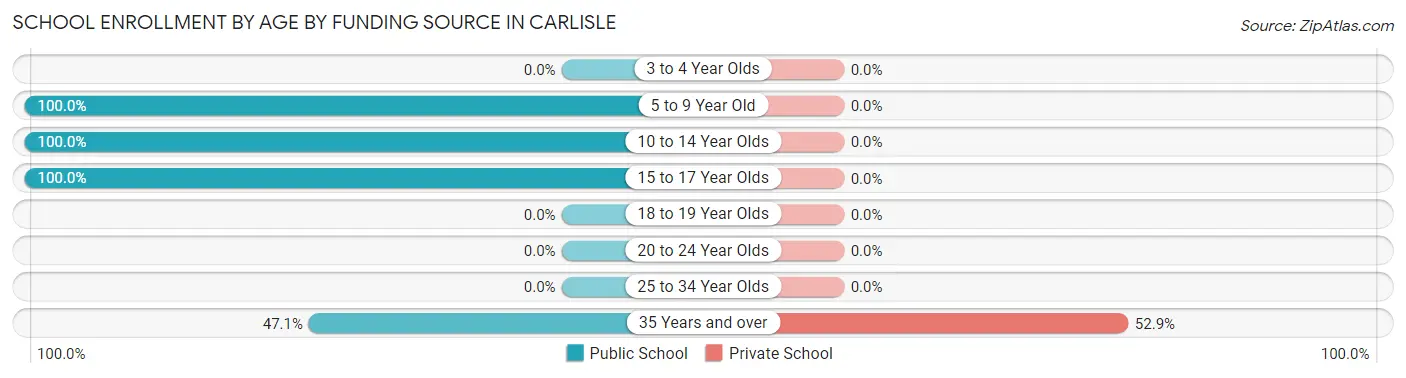
| Age Bracket | Public School | Private School |
| 3 to 4 Year Olds | 0 (0.0%) | 0 (0.0%) |
| 5 to 9 Year Old | 15 (100.0%) | 0 (0.0%) |
| 10 to 14 Year Olds | 93 (100.0%) | 0 (0.0%) |
| 15 to 17 Year Olds | 4 (100.0%) | 0 (0.0%) |
| 18 to 19 Year Olds | 0 (0.0%) | 0 (0.0%) |
| 20 to 24 Year Olds | 0 (0.0%) | 0 (0.0%) |
| 25 to 34 Year Olds | 0 (0.0%) | 0 (0.0%) |
| 35 Years and over | 16 (47.1%) | 18 (52.9%) |
| Total | 128 (87.7%) | 18 (12.3%) |
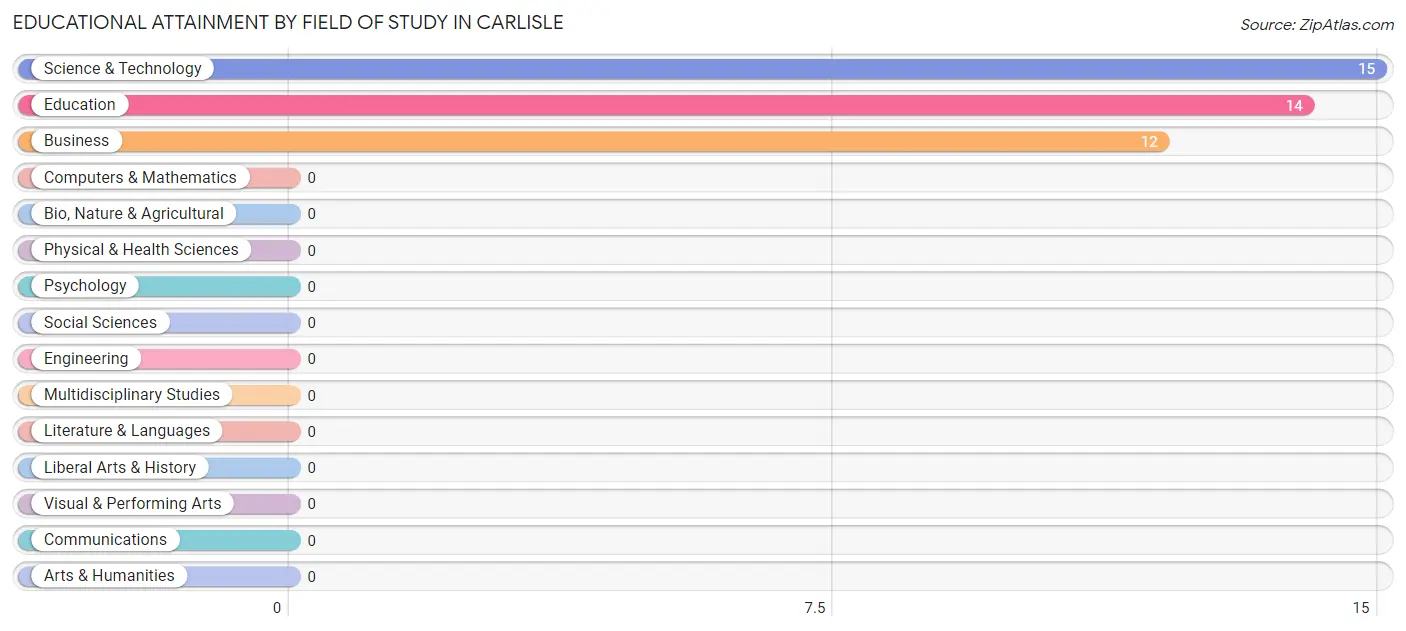
Educational Attainment by Field of Study in Carlisle
Science & technology (15 | 36.6%), education (14 | 34.2%), and business (12 | 29.3%) are the most common fields of study among 41 individuals in Carlisle who have obtained a bachelor's degree or higher.
| Field of Study | # Graduates | % Graduates |
| Computers & Mathematics | 0 | 0.0% |
| Bio, Nature & Agricultural | 0 | 0.0% |
| Physical & Health Sciences | 0 | 0.0% |
| Psychology | 0 | 0.0% |
| Social Sciences | 0 | 0.0% |
| Engineering | 0 | 0.0% |
| Multidisciplinary Studies | 0 | 0.0% |
| Science & Technology | 15 | 36.6% |
| Business | 12 | 29.3% |
| Education | 14 | 34.2% |
| Literature & Languages | 0 | 0.0% |
| Liberal Arts & History | 0 | 0.0% |
| Visual & Performing Arts | 0 | 0.0% |
| Communications | 0 | 0.0% |
| Arts & Humanities | 0 | 0.0% |
| Total | 41 | 100.0% |
Transportation & Commute in Carlisle
Vehicle Availability by Sex in Carlisle
The most prevalent vehicle ownership categories in Carlisle are males with 2 vehicles (49, accounting for 59.0%) and females with 2 vehicles (16, making up 132.4%).
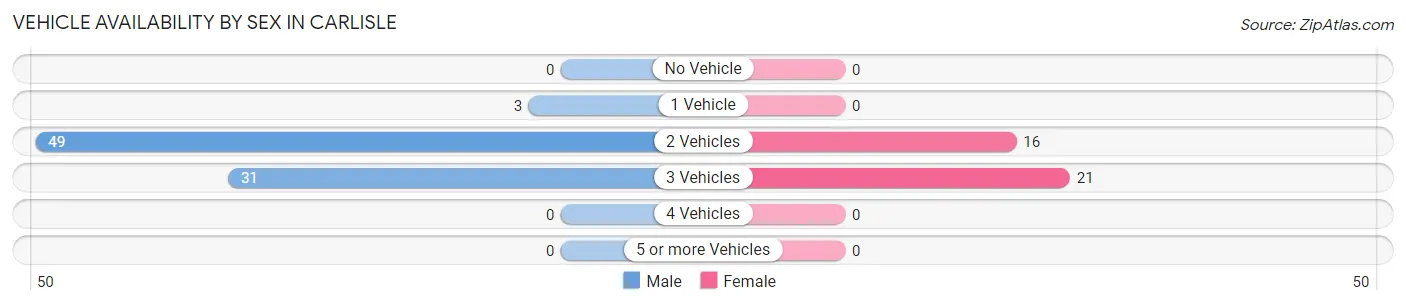
| Vehicles Available | Male | Female |
| No Vehicle | 0 (0.0%) | 0 (0.0%) |
| 1 Vehicle | 3 (3.6%) | 0 (0.0%) |
| 2 Vehicles | 49 (59.0%) | 16 (43.2%) |
| 3 Vehicles | 31 (37.3%) | 21 (56.8%) |
| 4 Vehicles | 0 (0.0%) | 0 (0.0%) |
| 5 or more Vehicles | 0 (0.0%) | 0 (0.0%) |
| Total | 83 (100.0%) | 37 (100.0%) |
Commute Time in Carlisle
The most frequently occuring commute durations in Carlisle are 15 to 19 minutes (27 commuters, 22.5%), 30 to 34 minutes (22 commuters, 18.3%), and 60 to 89 minutes (21 commuters, 17.5%).
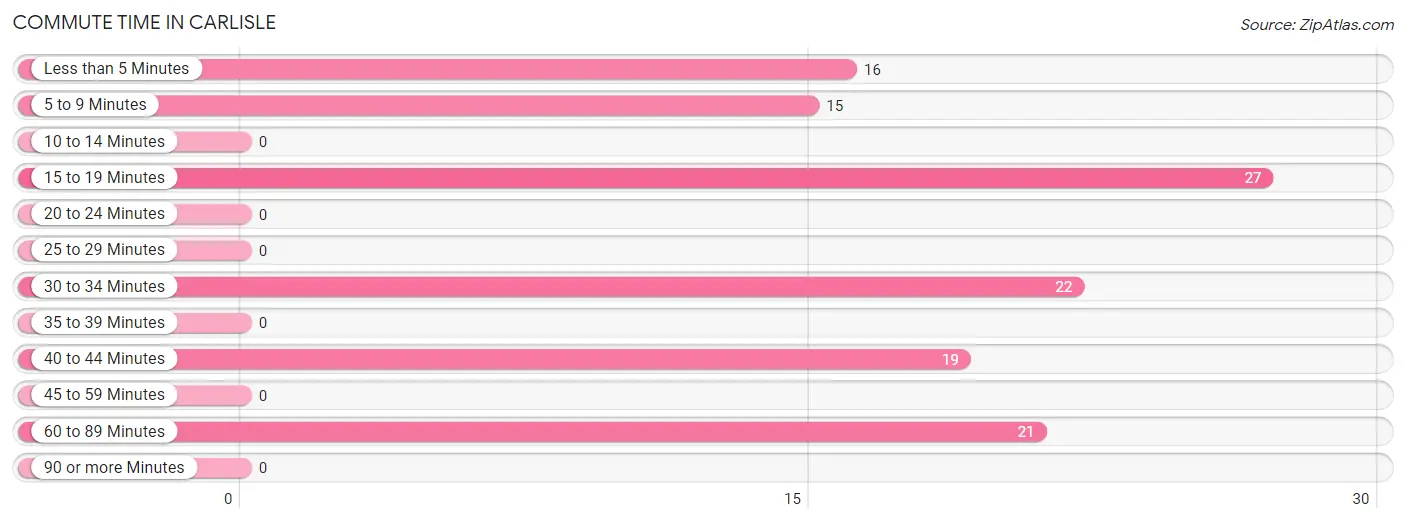
| Commute Time | # Commuters | % Commuters |
| Less than 5 Minutes | 16 | 13.3% |
| 5 to 9 Minutes | 15 | 12.5% |
| 10 to 14 Minutes | 0 | 0.0% |
| 15 to 19 Minutes | 27 | 22.5% |
| 20 to 24 Minutes | 0 | 0.0% |
| 25 to 29 Minutes | 0 | 0.0% |
| 30 to 34 Minutes | 22 | 18.3% |
| 35 to 39 Minutes | 0 | 0.0% |
| 40 to 44 Minutes | 19 | 15.8% |
| 45 to 59 Minutes | 0 | 0.0% |
| 60 to 89 Minutes | 21 | 17.5% |
| 90 or more Minutes | 0 | 0.0% |
Commute Time by Sex in Carlisle
The most common commute times in Carlisle are 15 to 19 minutes (27 commuters, 32.5%) for males and 60 to 89 minutes (21 commuters, 56.8%) for females.
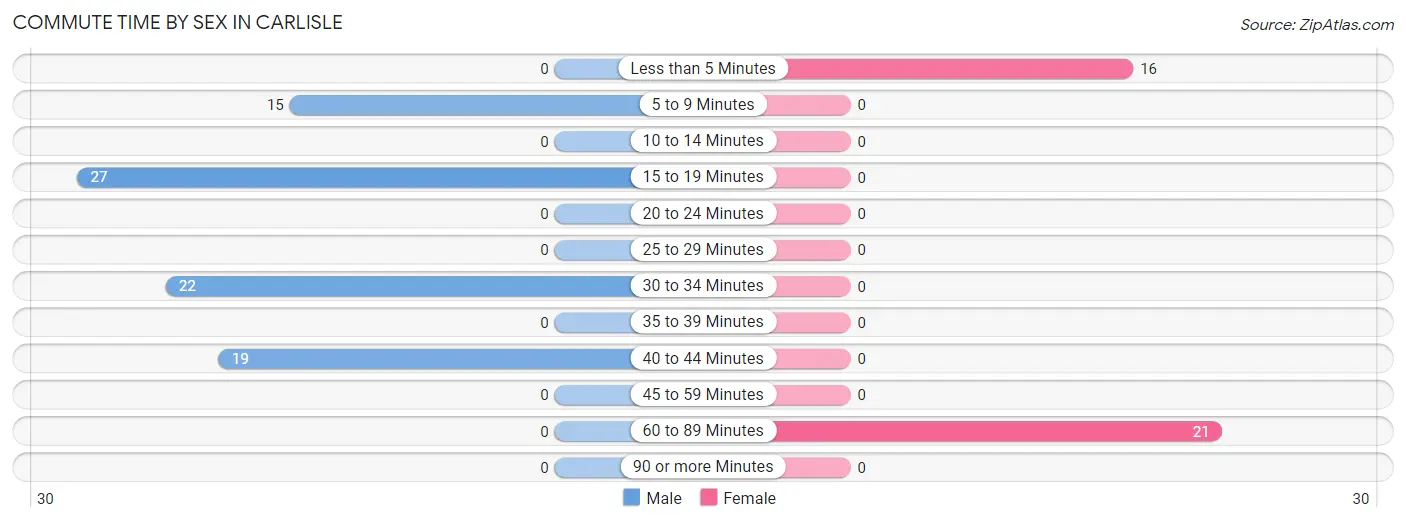
| Commute Time | Male | Female |
| Less than 5 Minutes | 0 (0.0%) | 16 (43.2%) |
| 5 to 9 Minutes | 15 (18.1%) | 0 (0.0%) |
| 10 to 14 Minutes | 0 (0.0%) | 0 (0.0%) |
| 15 to 19 Minutes | 27 (32.5%) | 0 (0.0%) |
| 20 to 24 Minutes | 0 (0.0%) | 0 (0.0%) |
| 25 to 29 Minutes | 0 (0.0%) | 0 (0.0%) |
| 30 to 34 Minutes | 22 (26.5%) | 0 (0.0%) |
| 35 to 39 Minutes | 0 (0.0%) | 0 (0.0%) |
| 40 to 44 Minutes | 19 (22.9%) | 0 (0.0%) |
| 45 to 59 Minutes | 0 (0.0%) | 0 (0.0%) |
| 60 to 89 Minutes | 0 (0.0%) | 21 (56.8%) |
| 90 or more Minutes | 0 (0.0%) | 0 (0.0%) |
Time of Departure to Work by Sex in Carlisle
The most frequent times of departure to work in Carlisle are 6:00 AM to 6:29 AM (38, 45.8%) for males and 6:00 AM to 6:29 AM (21, 56.8%) for females.
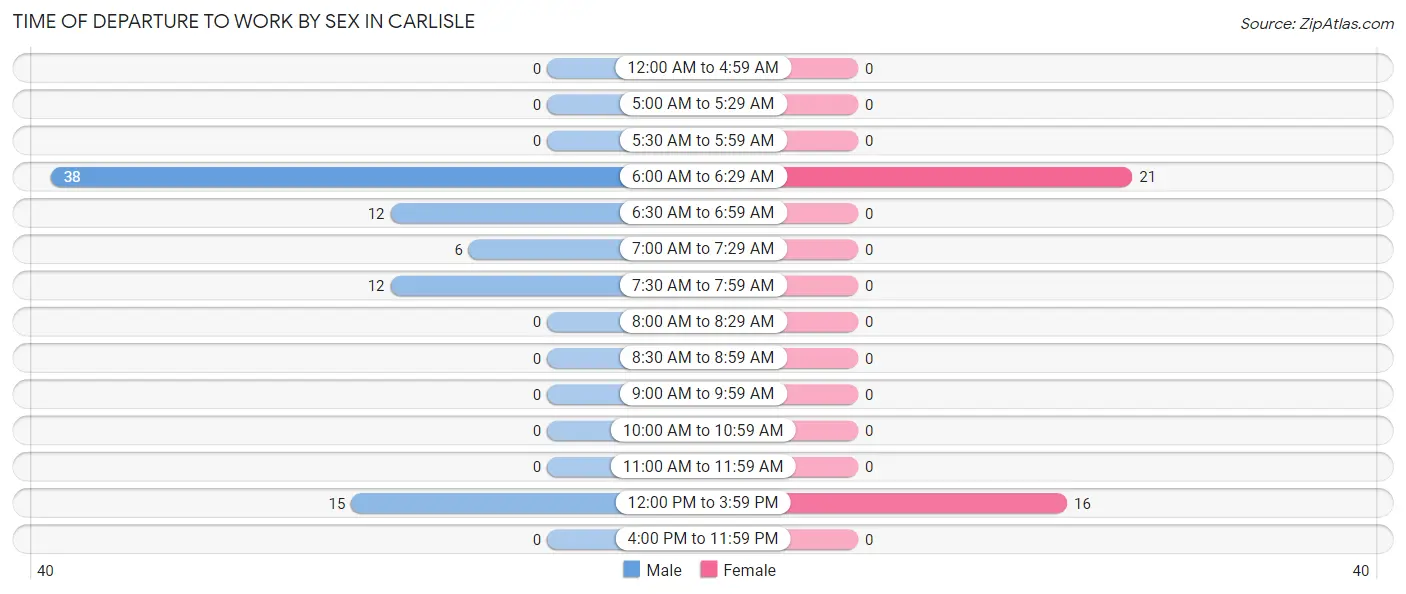
| Time of Departure | Male | Female |
| 12:00 AM to 4:59 AM | 0 (0.0%) | 0 (0.0%) |
| 5:00 AM to 5:29 AM | 0 (0.0%) | 0 (0.0%) |
| 5:30 AM to 5:59 AM | 0 (0.0%) | 0 (0.0%) |
| 6:00 AM to 6:29 AM | 38 (45.8%) | 21 (56.8%) |
| 6:30 AM to 6:59 AM | 12 (14.5%) | 0 (0.0%) |
| 7:00 AM to 7:29 AM | 6 (7.2%) | 0 (0.0%) |
| 7:30 AM to 7:59 AM | 12 (14.5%) | 0 (0.0%) |
| 8:00 AM to 8:29 AM | 0 (0.0%) | 0 (0.0%) |
| 8:30 AM to 8:59 AM | 0 (0.0%) | 0 (0.0%) |
| 9:00 AM to 9:59 AM | 0 (0.0%) | 0 (0.0%) |
| 10:00 AM to 10:59 AM | 0 (0.0%) | 0 (0.0%) |
| 11:00 AM to 11:59 AM | 0 (0.0%) | 0 (0.0%) |
| 12:00 PM to 3:59 PM | 15 (18.1%) | 16 (43.2%) |
| 4:00 PM to 11:59 PM | 0 (0.0%) | 0 (0.0%) |
| Total | 83 (100.0%) | 37 (100.0%) |
Housing Occupancy in Carlisle
Occupancy by Ownership in Carlisle
Of the total 197 dwellings in Carlisle, owner-occupied units account for 176 (89.3%), while renter-occupied units make up 21 (10.7%).
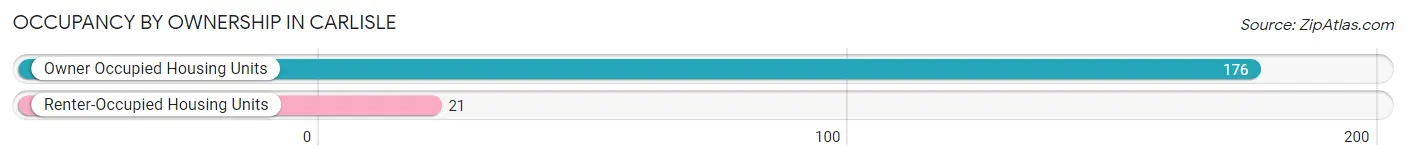
| Occupancy | # Housing Units | % Housing Units |
| Owner Occupied Housing Units | 176 | 89.3% |
| Renter-Occupied Housing Units | 21 | 10.7% |
| Total Occupied Housing Units | 197 | 100.0% |
Occupancy by Household Size in Carlisle
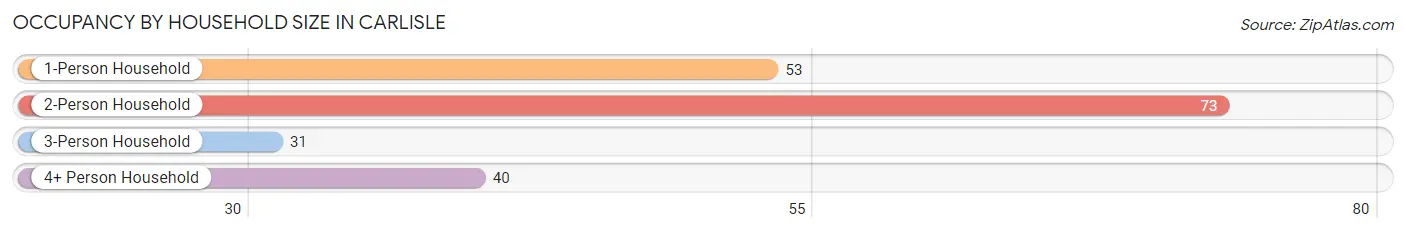
| Household Size | # Housing Units | % Housing Units |
| 1-Person Household | 53 | 26.9% |
| 2-Person Household | 73 | 37.1% |
| 3-Person Household | 31 | 15.7% |
| 4+ Person Household | 40 | 20.3% |
| Total Housing Units | 197 | 100.0% |
Occupancy by Ownership by Household Size in Carlisle
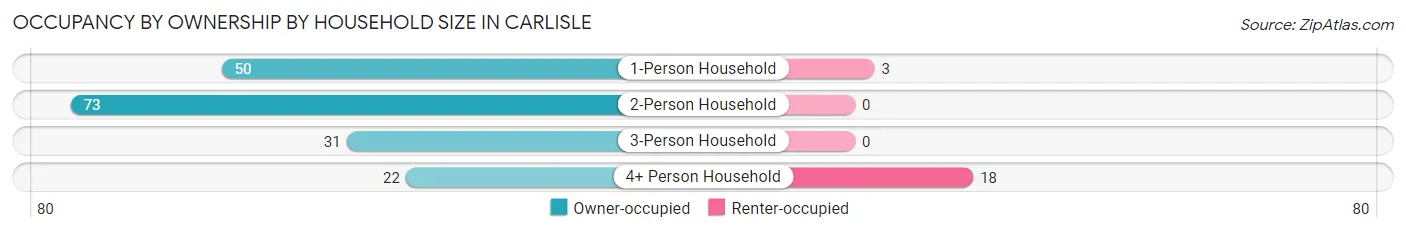
| Household Size | Owner-occupied | Renter-occupied |
| 1-Person Household | 50 (94.3%) | 3 (5.7%) |
| 2-Person Household | 73 (100.0%) | 0 (0.0%) |
| 3-Person Household | 31 (100.0%) | 0 (0.0%) |
| 4+ Person Household | 22 (55.0%) | 18 (45.0%) |
| Total Housing Units | 176 (89.3%) | 21 (10.7%) |
Occupancy by Educational Attainment in Carlisle
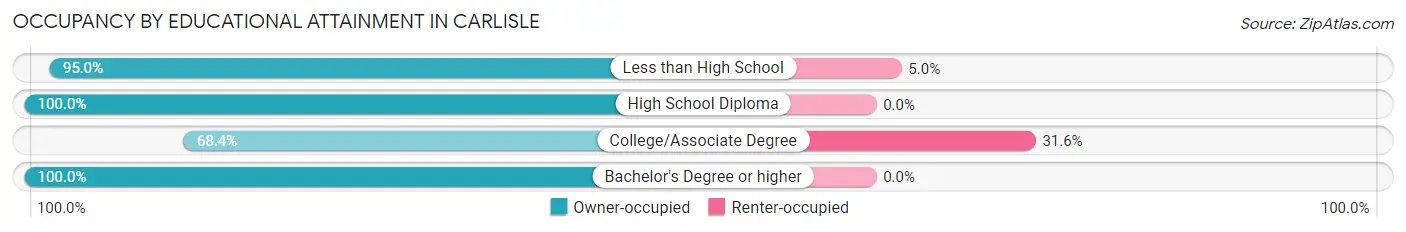
| Household Size | Owner-occupied | Renter-occupied |
| Less than High School | 57 (95.0%) | 3 (5.0%) |
| High School Diploma | 51 (100.0%) | 0 (0.0%) |
| College/Associate Degree | 39 (68.4%) | 18 (31.6%) |
| Bachelor's Degree or higher | 29 (100.0%) | 0 (0.0%) |
Occupancy by Age of Householder in Carlisle
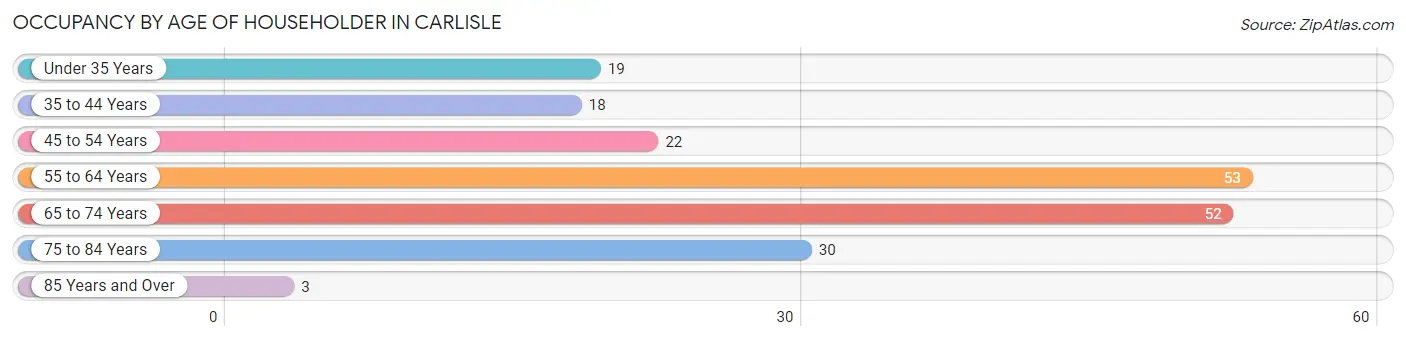
| Age Bracket | # Households | % Households |
| Under 35 Years | 19 | 9.6% |
| 35 to 44 Years | 18 | 9.1% |
| 45 to 54 Years | 22 | 11.2% |
| 55 to 64 Years | 53 | 26.9% |
| 65 to 74 Years | 52 | 26.4% |
| 75 to 84 Years | 30 | 15.2% |
| 85 Years and Over | 3 | 1.5% |
| Total | 197 | 100.0% |
Housing Finances in Carlisle
Median Income by Occupancy in Carlisle
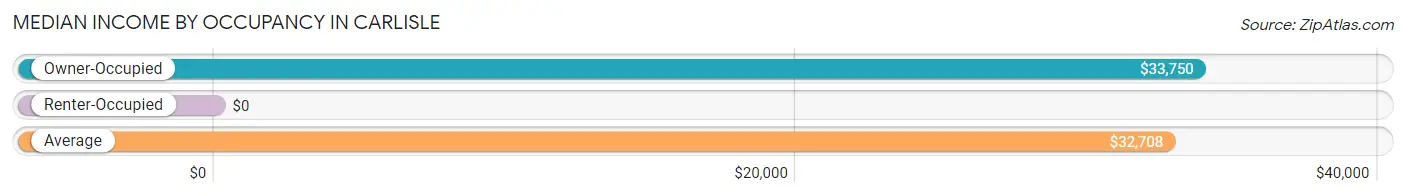
| Occupancy Type | # Households | Median Income |
| Owner-Occupied | 176 (89.3%) | $33,750 |
| Renter-Occupied | 21 (10.7%) | $0 |
| Average | 197 (100.0%) | $32,708 |
Occupancy by Householder Income Bracket in Carlisle
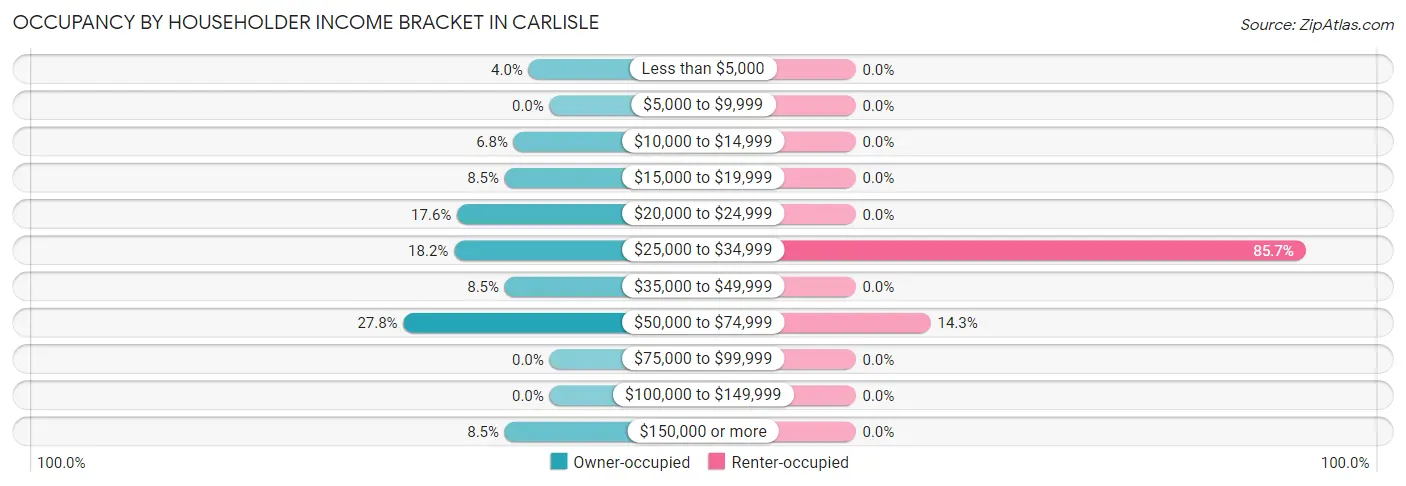
| Income Bracket | Owner-occupied | Renter-occupied |
| Less than $5,000 | 7 (4.0%) | 0 (0.0%) |
| $5,000 to $9,999 | 0 (0.0%) | 0 (0.0%) |
| $10,000 to $14,999 | 12 (6.8%) | 0 (0.0%) |
| $15,000 to $19,999 | 15 (8.5%) | 0 (0.0%) |
| $20,000 to $24,999 | 31 (17.6%) | 0 (0.0%) |
| $25,000 to $34,999 | 32 (18.2%) | 18 (85.7%) |
| $35,000 to $49,999 | 15 (8.5%) | 0 (0.0%) |
| $50,000 to $74,999 | 49 (27.8%) | 3 (14.3%) |
| $75,000 to $99,999 | 0 (0.0%) | 0 (0.0%) |
| $100,000 to $149,999 | 0 (0.0%) | 0 (0.0%) |
| $150,000 or more | 15 (8.5%) | 0 (0.0%) |
| Total | 176 (100.0%) | 21 (100.0%) |
Monthly Housing Cost Tiers in Carlisle
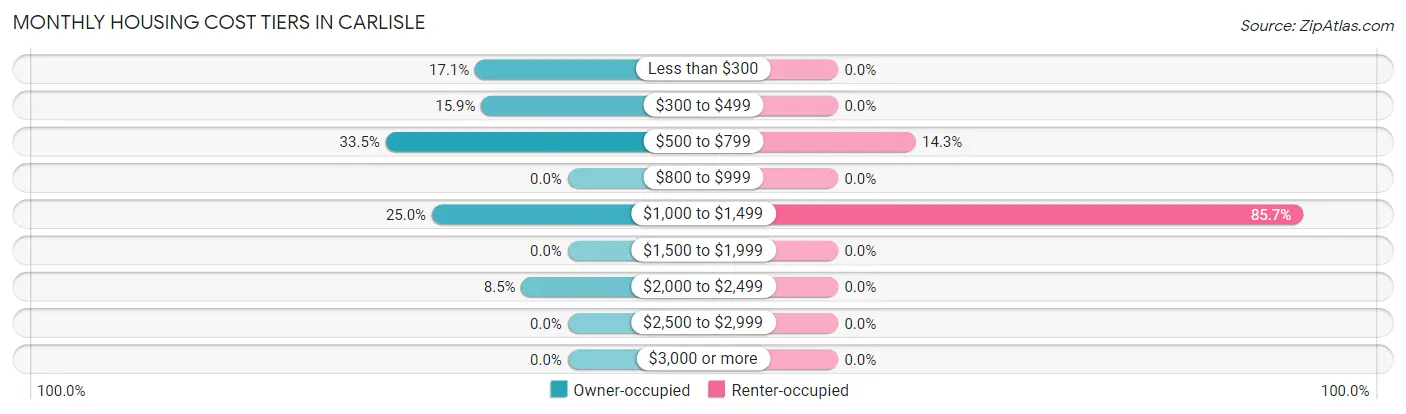
| Monthly Cost | Owner-occupied | Renter-occupied |
| Less than $300 | 30 (17.1%) | 0 (0.0%) |
| $300 to $499 | 28 (15.9%) | 0 (0.0%) |
| $500 to $799 | 59 (33.5%) | 3 (14.3%) |
| $800 to $999 | 0 (0.0%) | 0 (0.0%) |
| $1,000 to $1,499 | 44 (25.0%) | 18 (85.7%) |
| $1,500 to $1,999 | 0 (0.0%) | 0 (0.0%) |
| $2,000 to $2,499 | 15 (8.5%) | 0 (0.0%) |
| $2,500 to $2,999 | 0 (0.0%) | 0 (0.0%) |
| $3,000 or more | 0 (0.0%) | 0 (0.0%) |
| Total | 176 (100.0%) | 21 (100.0%) |
Physical Housing Characteristics in Carlisle
Housing Structures in Carlisle
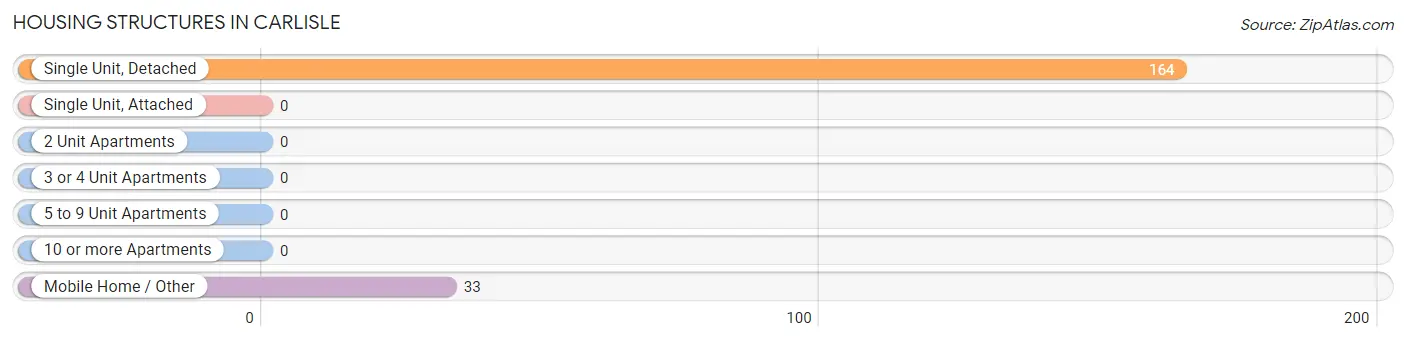
| Structure Type | # Housing Units | % Housing Units |
| Single Unit, Detached | 164 | 83.3% |
| Single Unit, Attached | 0 | 0.0% |
| 2 Unit Apartments | 0 | 0.0% |
| 3 or 4 Unit Apartments | 0 | 0.0% |
| 5 to 9 Unit Apartments | 0 | 0.0% |
| 10 or more Apartments | 0 | 0.0% |
| Mobile Home / Other | 33 | 16.8% |
| Total | 197 | 100.0% |
Housing Structures by Occupancy in Carlisle
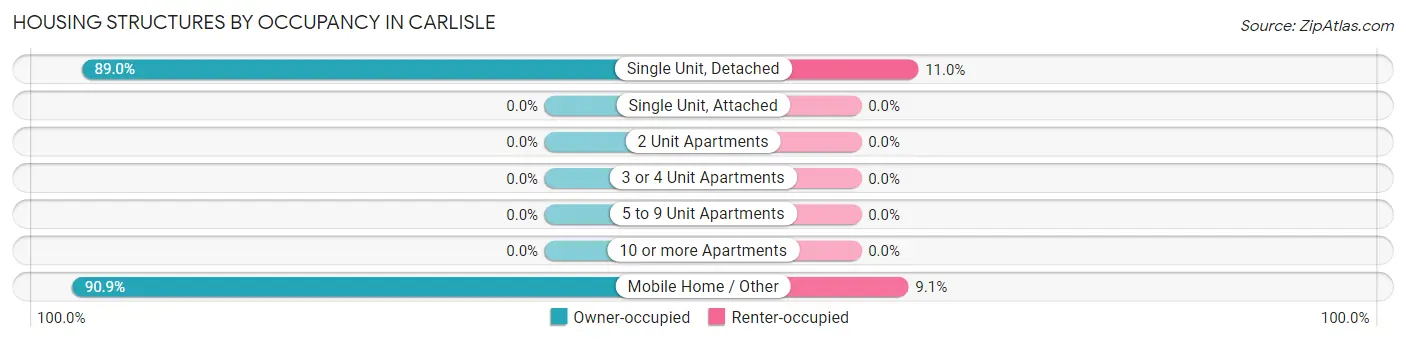
| Structure Type | Owner-occupied | Renter-occupied |
| Single Unit, Detached | 146 (89.0%) | 18 (11.0%) |
| Single Unit, Attached | 0 (0.0%) | 0 (0.0%) |
| 2 Unit Apartments | 0 (0.0%) | 0 (0.0%) |
| 3 or 4 Unit Apartments | 0 (0.0%) | 0 (0.0%) |
| 5 to 9 Unit Apartments | 0 (0.0%) | 0 (0.0%) |
| 10 or more Apartments | 0 (0.0%) | 0 (0.0%) |
| Mobile Home / Other | 30 (90.9%) | 3 (9.1%) |
| Total | 176 (89.3%) | 21 (10.7%) |
Housing Structures by Number of Rooms in Carlisle
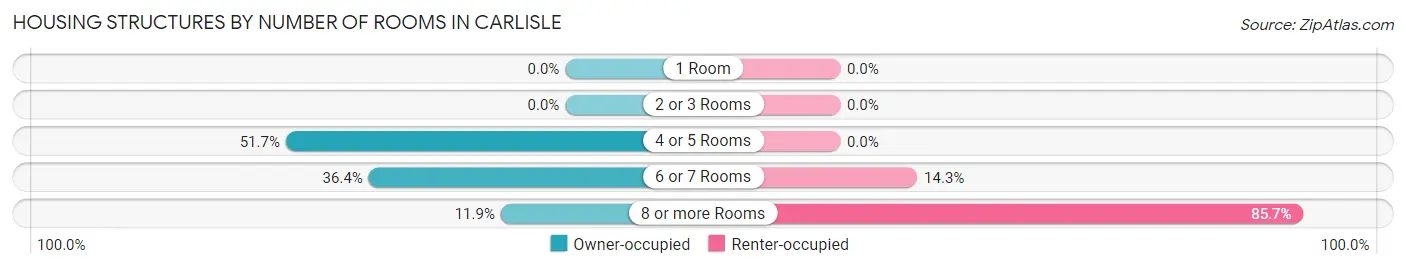
| Number of Rooms | Owner-occupied | Renter-occupied |
| 1 Room | 0 (0.0%) | 0 (0.0%) |
| 2 or 3 Rooms | 0 (0.0%) | 0 (0.0%) |
| 4 or 5 Rooms | 91 (51.7%) | 0 (0.0%) |
| 6 or 7 Rooms | 64 (36.4%) | 3 (14.3%) |
| 8 or more Rooms | 21 (11.9%) | 18 (85.7%) |
| Total | 176 (100.0%) | 21 (100.0%) |
Housing Structure by Heating Type in Carlisle
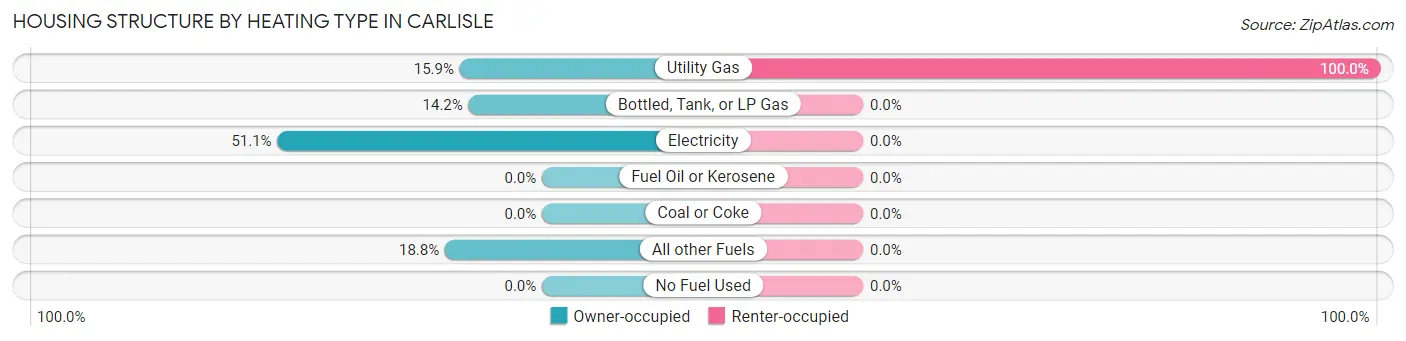
| Heating Type | Owner-occupied | Renter-occupied |
| Utility Gas | 28 (15.9%) | 21 (100.0%) |
| Bottled, Tank, or LP Gas | 25 (14.2%) | 0 (0.0%) |
| Electricity | 90 (51.1%) | 0 (0.0%) |
| Fuel Oil or Kerosene | 0 (0.0%) | 0 (0.0%) |
| Coal or Coke | 0 (0.0%) | 0 (0.0%) |
| All other Fuels | 33 (18.8%) | 0 (0.0%) |
| No Fuel Used | 0 (0.0%) | 0 (0.0%) |
| Total | 176 (100.0%) | 21 (100.0%) |
Household Vehicle Usage in Carlisle
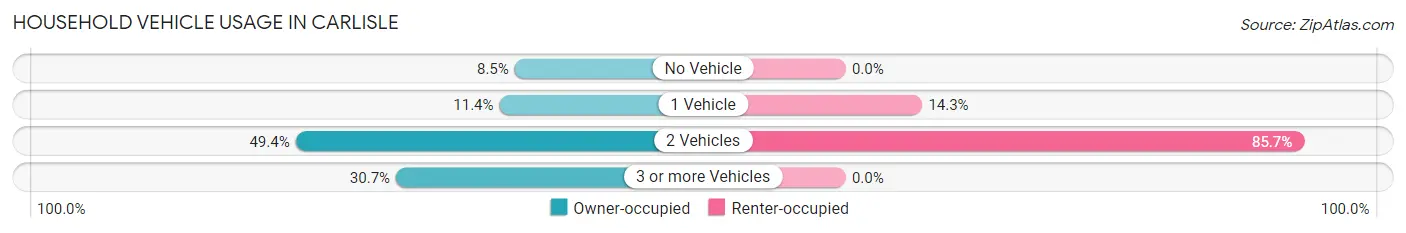
| Vehicles per Household | Owner-occupied | Renter-occupied |
| No Vehicle | 15 (8.5%) | 0 (0.0%) |
| 1 Vehicle | 20 (11.4%) | 3 (14.3%) |
| 2 Vehicles | 87 (49.4%) | 18 (85.7%) |
| 3 or more Vehicles | 54 (30.7%) | 0 (0.0%) |
| Total | 176 (100.0%) | 21 (100.0%) |
Real Estate & Mortgages in Carlisle
Real Estate and Mortgage Overview in Carlisle
| Characteristic | Without Mortgage | With Mortgage |
| Housing Units | 117 | 59 |
| Median Property Value | $183,600 | $186,600 |
| Median Household Income | $27,589 | $15 |
| Monthly Housing Costs | $502 | $0 |
| Real Estate Taxes | $440 | $14 |
Property Value by Mortgage Status in Carlisle
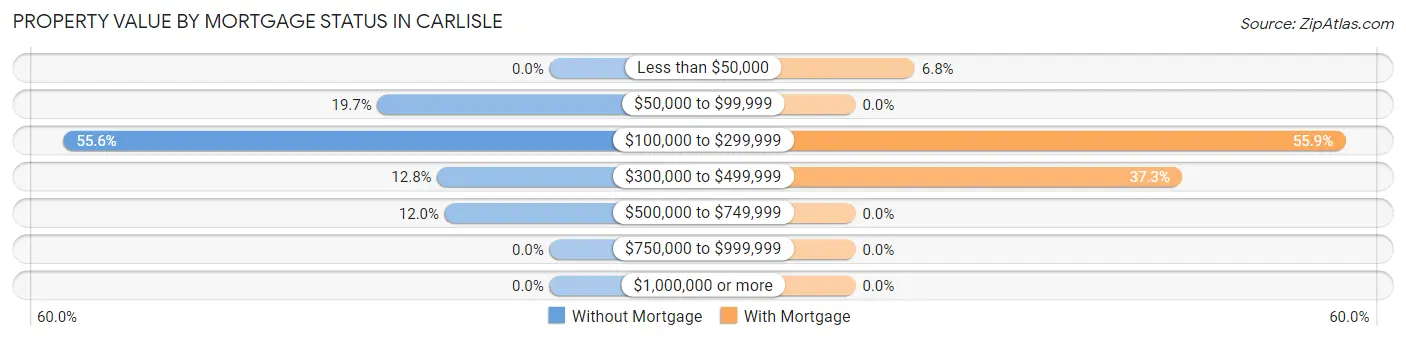
| Property Value | Without Mortgage | With Mortgage |
| Less than $50,000 | 0 (0.0%) | 4 (6.8%) |
| $50,000 to $99,999 | 23 (19.7%) | 0 (0.0%) |
| $100,000 to $299,999 | 65 (55.6%) | 33 (55.9%) |
| $300,000 to $499,999 | 15 (12.8%) | 22 (37.3%) |
| $500,000 to $749,999 | 14 (12.0%) | 0 (0.0%) |
| $750,000 to $999,999 | 0 (0.0%) | 0 (0.0%) |
| $1,000,000 or more | 0 (0.0%) | 0 (0.0%) |
| Total | 117 (100.0%) | 59 (100.0%) |
Household Income by Mortgage Status in Carlisle
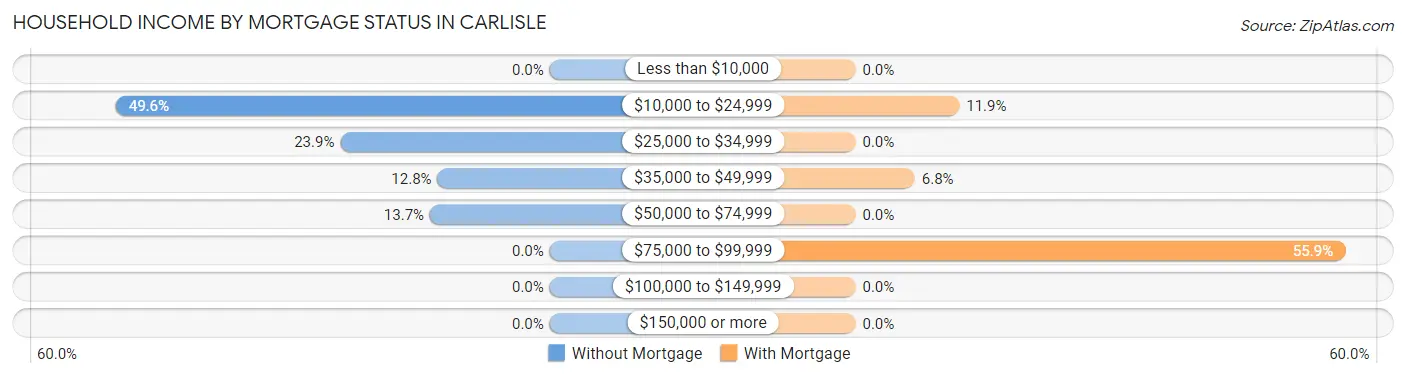
| Household Income | Without Mortgage | With Mortgage |
| Less than $10,000 | 0 (0.0%) | 0 (0.0%) |
| $10,000 to $24,999 | 58 (49.6%) | 7 (11.9%) |
| $25,000 to $34,999 | 28 (23.9%) | 0 (0.0%) |
| $35,000 to $49,999 | 15 (12.8%) | 4 (6.8%) |
| $50,000 to $74,999 | 16 (13.7%) | 0 (0.0%) |
| $75,000 to $99,999 | 0 (0.0%) | 33 (55.9%) |
| $100,000 to $149,999 | 0 (0.0%) | 0 (0.0%) |
| $150,000 or more | 0 (0.0%) | 0 (0.0%) |
| Total | 117 (100.0%) | 59 (100.0%) |
Property Value to Household Income Ratio in Carlisle
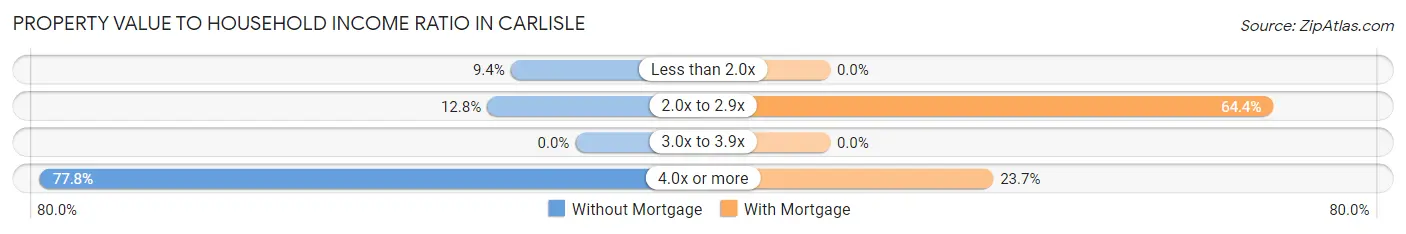
| Value-to-Income Ratio | Without Mortgage | With Mortgage |
| Less than 2.0x | 11 (9.4%) | 0 (0.0%) |
| 2.0x to 2.9x | 15 (12.8%) | 38 (64.4%) |
| 3.0x to 3.9x | 0 (0.0%) | 0 (0.0%) |
| 4.0x or more | 91 (77.8%) | 14 (23.7%) |
| Total | 117 (100.0%) | 59 (100.0%) |
Real Estate Taxes by Mortgage Status in Carlisle
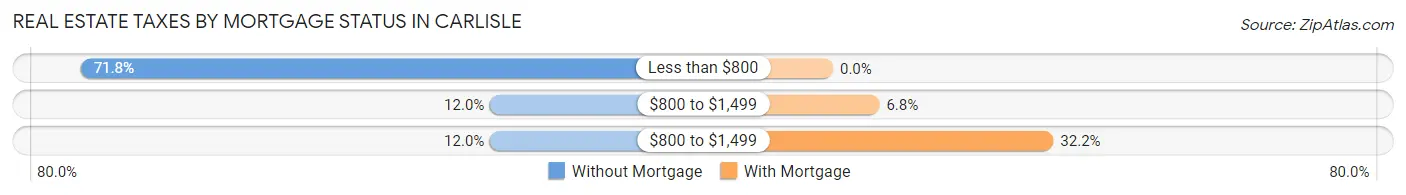
| Property Taxes | Without Mortgage | With Mortgage |
| Less than $800 | 84 (71.8%) | 0 (0.0%) |
| $800 to $1,499 | 14 (12.0%) | 4 (6.8%) |
| $800 to $1,499 | 14 (12.0%) | 19 (32.2%) |
| Total | 117 (100.0%) | 59 (100.0%) |
Health & Disability in Carlisle
Health Insurance Coverage by Age in Carlisle
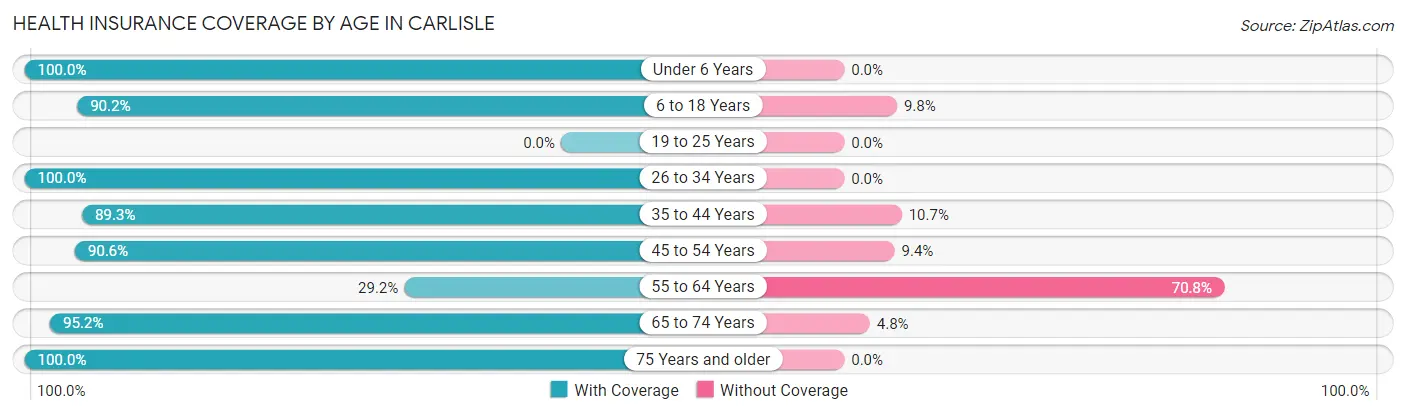
| Age Bracket | With Coverage | Without Coverage |
| Under 6 Years | 33 (100.0%) | 0 (0.0%) |
| 6 to 18 Years | 101 (90.2%) | 11 (9.8%) |
| 19 to 25 Years | 0 (0.0%) | 0 (0.0%) |
| 26 to 34 Years | 40 (100.0%) | 0 (0.0%) |
| 35 to 44 Years | 50 (89.3%) | 6 (10.7%) |
| 45 to 54 Years | 29 (90.6%) | 3 (9.4%) |
| 55 to 64 Years | 19 (29.2%) | 46 (70.8%) |
| 65 to 74 Years | 80 (95.2%) | 4 (4.8%) |
| 75 Years and older | 145 (100.0%) | 0 (0.0%) |
| Total | 497 (87.6%) | 70 (12.3%) |
Health Insurance Coverage by Citizenship Status in Carlisle
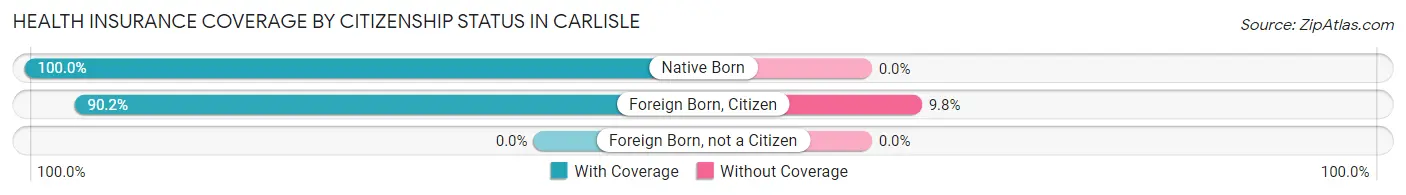
| Citizenship Status | With Coverage | Without Coverage |
| Native Born | 33 (100.0%) | 0 (0.0%) |
| Foreign Born, Citizen | 101 (90.2%) | 11 (9.8%) |
| Foreign Born, not a Citizen | 0 (0.0%) | 0 (0.0%) |
Health Insurance Coverage by Household Income in Carlisle
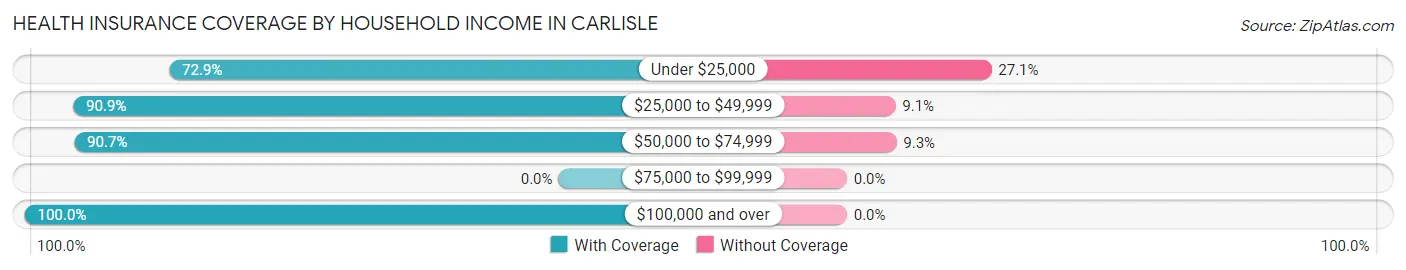
| Household Income | With Coverage | Without Coverage |
| Under $25,000 | 105 (72.9%) | 39 (27.1%) |
| $25,000 to $49,999 | 140 (90.9%) | 14 (9.1%) |
| $50,000 to $74,999 | 166 (90.7%) | 17 (9.3%) |
| $75,000 to $99,999 | 0 (0.0%) | 0 (0.0%) |
| $100,000 and over | 86 (100.0%) | 0 (0.0%) |
Public vs Private Health Insurance Coverage by Age in Carlisle
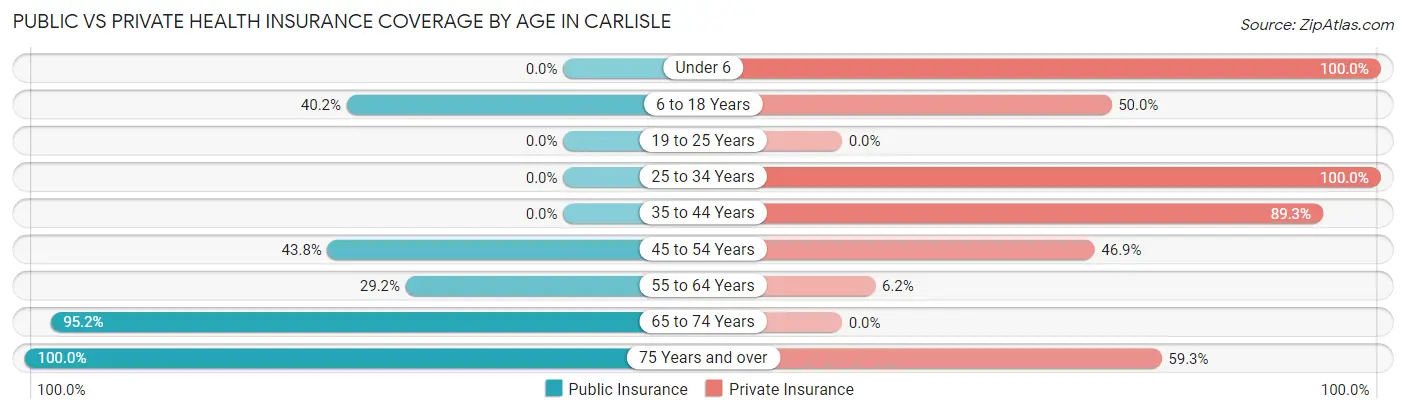
| Age Bracket | Public Insurance | Private Insurance |
| Under 6 | 0 (0.0%) | 33 (100.0%) |
| 6 to 18 Years | 45 (40.2%) | 56 (50.0%) |
| 19 to 25 Years | 0 (0.0%) | 0 (0.0%) |
| 25 to 34 Years | 0 (0.0%) | 40 (100.0%) |
| 35 to 44 Years | 0 (0.0%) | 50 (89.3%) |
| 45 to 54 Years | 14 (43.8%) | 15 (46.9%) |
| 55 to 64 Years | 19 (29.2%) | 4 (6.1%) |
| 65 to 74 Years | 80 (95.2%) | 0 (0.0%) |
| 75 Years and over | 145 (100.0%) | 86 (59.3%) |
| Total | 303 (53.4%) | 284 (50.1%) |
Disability Status by Sex by Age in Carlisle
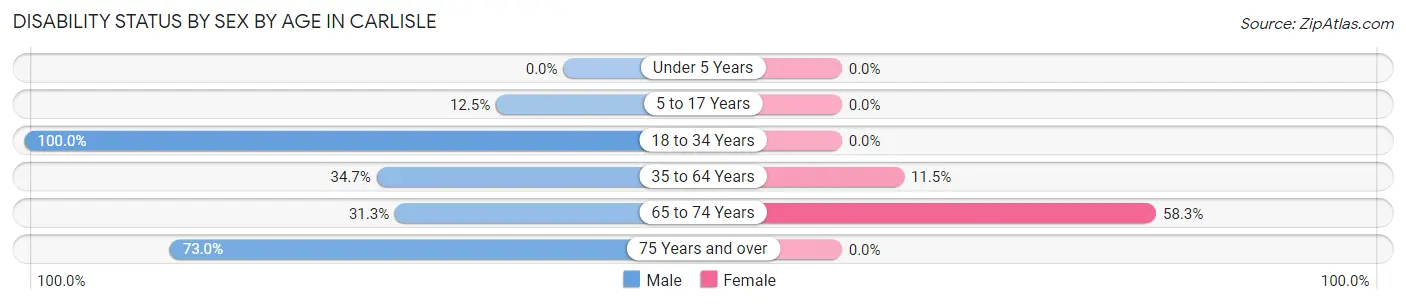
| Age Bracket | Male | Female |
| Under 5 Years | 0 (0.0%) | 0 (0.0%) |
| 5 to 17 Years | 9 (12.5%) | 0 (0.0%) |
| 18 to 34 Years | 19 (100.0%) | 0 (0.0%) |
| 35 to 64 Years | 26 (34.7%) | 9 (11.5%) |
| 65 to 74 Years | 15 (31.2%) | 21 (58.3%) |
| 75 Years and over | 84 (73.0%) | 0 (0.0%) |
Disability Class by Sex by Age in Carlisle
Disability Class: Hearing Difficulty
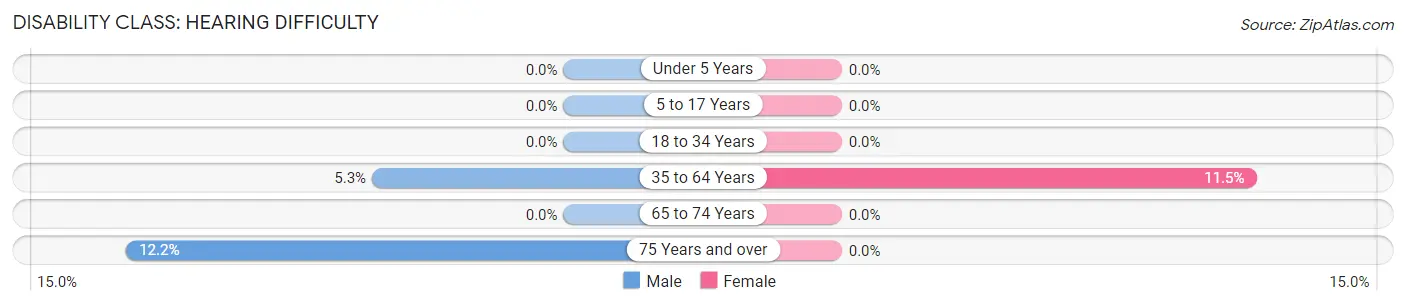
| Age Bracket | Male | Female |
| Under 5 Years | 0 (0.0%) | 0 (0.0%) |
| 5 to 17 Years | 0 (0.0%) | 0 (0.0%) |
| 18 to 34 Years | 0 (0.0%) | 0 (0.0%) |
| 35 to 64 Years | 4 (5.3%) | 9 (11.5%) |
| 65 to 74 Years | 0 (0.0%) | 0 (0.0%) |
| 75 Years and over | 14 (12.2%) | 0 (0.0%) |
Disability Class: Vision Difficulty
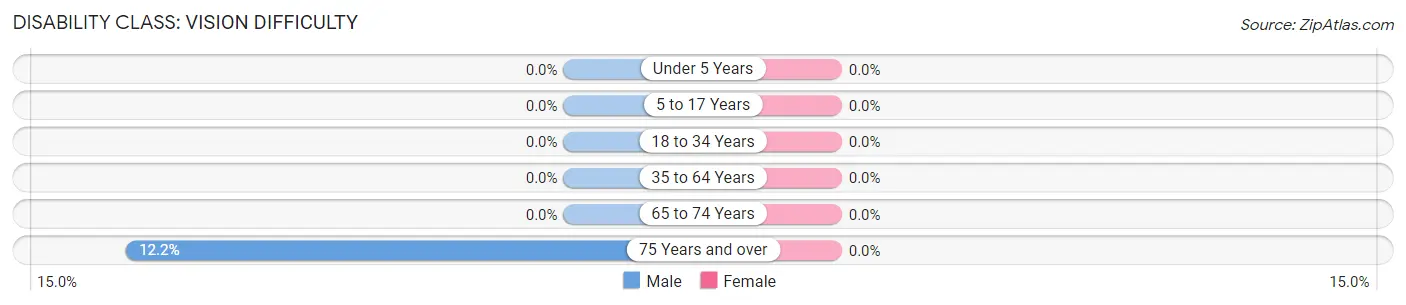
| Age Bracket | Male | Female |
| Under 5 Years | 0 (0.0%) | 0 (0.0%) |
| 5 to 17 Years | 0 (0.0%) | 0 (0.0%) |
| 18 to 34 Years | 0 (0.0%) | 0 (0.0%) |
| 35 to 64 Years | 0 (0.0%) | 0 (0.0%) |
| 65 to 74 Years | 0 (0.0%) | 0 (0.0%) |
| 75 Years and over | 14 (12.2%) | 0 (0.0%) |
Disability Class: Cognitive Difficulty
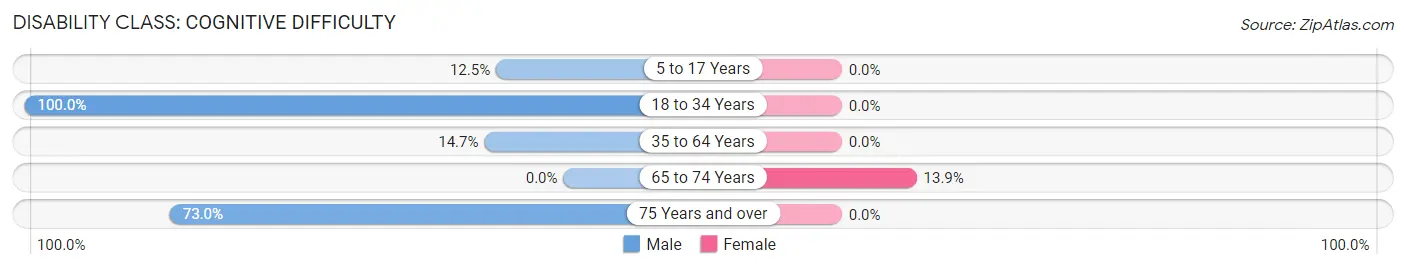
| Age Bracket | Male | Female |
| 5 to 17 Years | 9 (12.5%) | 0 (0.0%) |
| 18 to 34 Years | 19 (100.0%) | 0 (0.0%) |
| 35 to 64 Years | 11 (14.7%) | 0 (0.0%) |
| 65 to 74 Years | 0 (0.0%) | 5 (13.9%) |
| 75 Years and over | 84 (73.0%) | 0 (0.0%) |
Disability Class: Ambulatory Difficulty
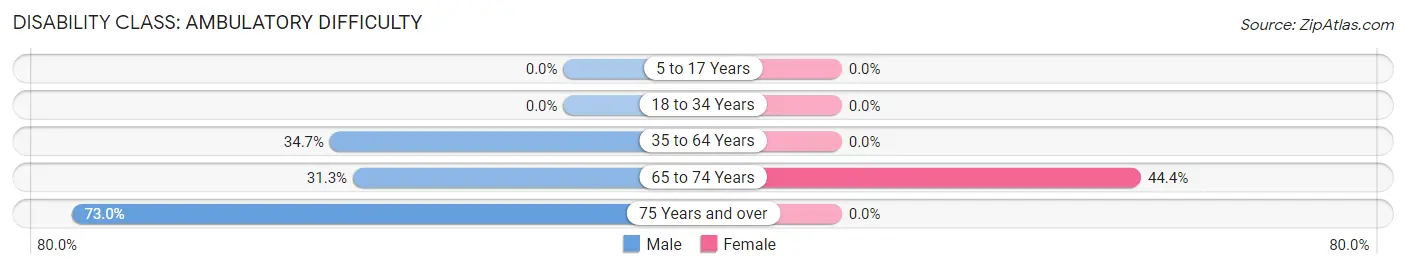
| Age Bracket | Male | Female |
| 5 to 17 Years | 0 (0.0%) | 0 (0.0%) |
| 18 to 34 Years | 0 (0.0%) | 0 (0.0%) |
| 35 to 64 Years | 26 (34.7%) | 0 (0.0%) |
| 65 to 74 Years | 15 (31.2%) | 16 (44.4%) |
| 75 Years and over | 84 (73.0%) | 0 (0.0%) |
Disability Class: Self-Care Difficulty
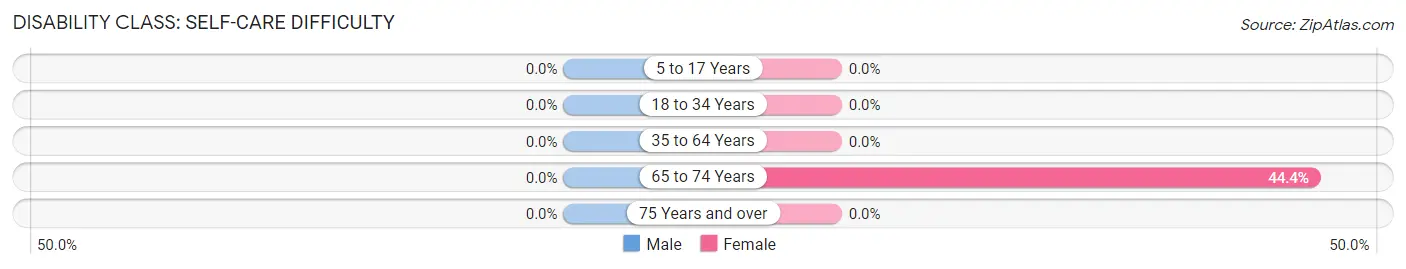
| Age Bracket | Male | Female |
| 5 to 17 Years | 0 (0.0%) | 0 (0.0%) |
| 18 to 34 Years | 0 (0.0%) | 0 (0.0%) |
| 35 to 64 Years | 0 (0.0%) | 0 (0.0%) |
| 65 to 74 Years | 0 (0.0%) | 16 (44.4%) |
| 75 Years and over | 0 (0.0%) | 0 (0.0%) |
Technology Access in Carlisle
Computing Device Access in Carlisle
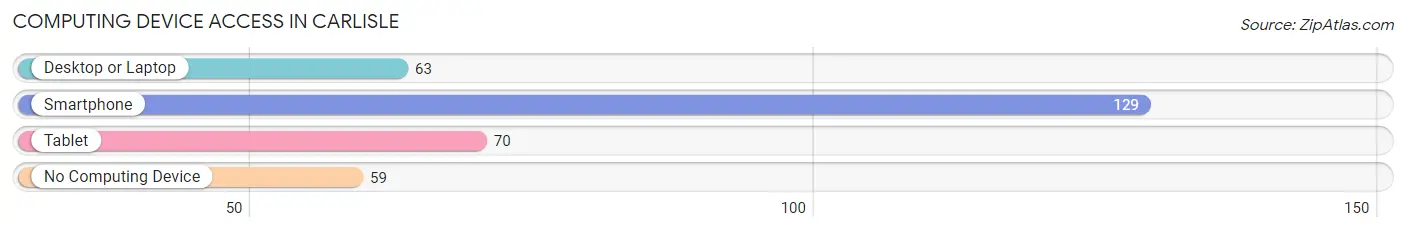
| Device Type | # Households | % Households |
| Desktop or Laptop | 63 | 32.0% |
| Smartphone | 129 | 65.5% |
| Tablet | 70 | 35.5% |
| No Computing Device | 59 | 29.9% |
| Total | 197 | 100.0% |
Internet Access in Carlisle
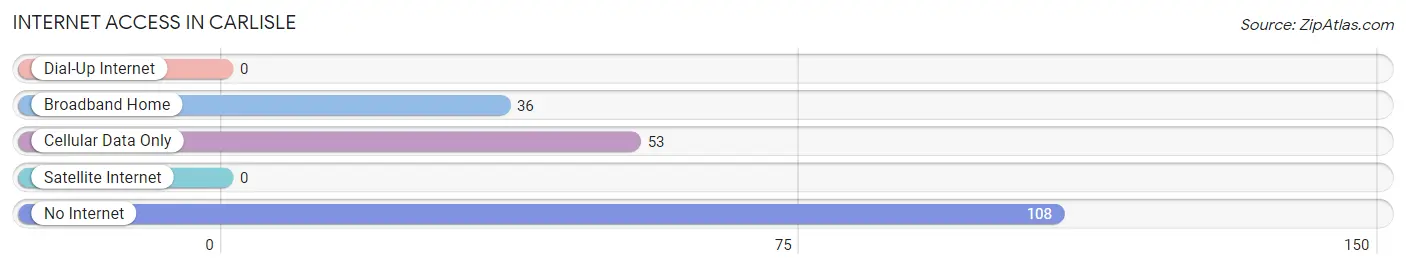
| Internet Type | # Households | % Households |
| Dial-Up Internet | 0 | 0.0% |
| Broadband Home | 36 | 18.3% |
| Cellular Data Only | 53 | 26.9% |
| Satellite Internet | 0 | 0.0% |
| No Internet | 108 | 54.8% |
| Total | 197 | 100.0% |
Carlisle Summary
Carlisle, Oklahoma is a small town located in the southeastern corner of the state, in the foothills of the Ouachita Mountains. It is situated in the county of Pittsburg, and is part of the McAlester-Stigler Micropolitan Statistical Area. The town was founded in 1891 and was named after the nearby Carlisle Indian School.
History
The area around Carlisle was originally inhabited by the Choctaw and Chickasaw tribes. The town was founded in 1891 by the Choctaw Nation, and was named after the nearby Carlisle Indian School. The school was established in 1879 by the US government to educate Native American children. The town was incorporated in 1901, and the first post office was established in 1902.
In the early 1900s, Carlisle was a thriving agricultural community, with cotton, corn, and wheat being the main crops. The town also had a number of businesses, including a bank, a hotel, a general store, and a blacksmith shop.
In the 1920s, the town began to decline as the railroad bypassed it and the Great Depression hit. The population dropped from a peak of over 500 in the 1910s to just over 200 in the 1930s.
In the 1940s, the town began to recover as the economy improved and the population grew to over 400. The town was also home to a number of businesses, including a cotton gin, a lumber mill, and a canning factory.
In the 1950s, the town continued to grow, and the population reached over 500. The town was also home to a number of businesses, including a grocery store, a hardware store, and a movie theater.
In the 1960s, the town began to decline again as the economy shifted away from agriculture and the population dropped to just over 300.
In the 1970s, the town began to recover as the economy improved and the population grew to over 400. The town was also home to a number of businesses, including a feed store, a furniture store, and a restaurant.
In the 1980s, the town continued to grow, and the population reached over 500. The town was also home to a number of businesses, including a gas station, a pharmacy, and a beauty salon.
In the 1990s, the town continued to grow, and the population reached over 600. The town was also home to a number of businesses, including a grocery store, a hardware store, and a movie theater.
Geography
Carlisle is located in the southeastern corner of Oklahoma, in the foothills of the Ouachita Mountains. The town is situated in the county of Pittsburg, and is part of the McAlester-Stigler Micropolitan Statistical Area. The town is located at the intersection of US Highway 270 and State Highway 2.
The town is located in a hilly area, with the highest point being the summit of Carlisle Mountain, which is located just south of the town. The town is located in a humid subtropical climate, with hot summers and mild winters.
Economy
The economy of Carlisle is largely based on agriculture, with cotton, corn, and wheat being the main crops. The town is also home to a number of businesses, including a grocery store, a hardware store, and a movie theater.
Demographics
As of the 2010 census, the population of Carlisle was 602. The racial makeup of the town was 94.2% White, 0.7% African American, 0.2% Native American, 0.2% Asian, 0.2% from other races, and 4.7% from two or more races. Hispanic or Latino of any race were 1.2% of the population.
The median income for a household in the town was $30,000, and the median income for a family was $35,000. The per capita income for the town was $14,000. About 17.2% of families and 20.2% of the population were below the poverty line, including 28.3% of those under age 18 and 10.7% of those age 65 or over.
Common Questions
What is Per Capita Income in Carlisle?
Per Capita income in Carlisle is $25,317.
What is the Median Family Income in Carlisle?
Median Family Income in Carlisle is $32,589.
What is the Median Household income in Carlisle?
Median Household Income in Carlisle is $32,708.
What is Inequality or Gini Index in Carlisle?
Inequality or Gini Index in Carlisle is 0.50.
What is the Total Population of Carlisle?
Total Population of Carlisle is 567.
What is the Total Male Population of Carlisle?
Total Male Population of Carlisle is 347.
What is the Total Female Population of Carlisle?
Total Female Population of Carlisle is 220.
What is the Ratio of Males per 100 Females in Carlisle?
There are 157.73 Males per 100 Females in Carlisle.
What is the Ratio of Females per 100 Males in Carlisle?
There are 63.40 Females per 100 Males in Carlisle.
What is the Median Population Age in Carlisle?
Median Population Age in Carlisle is 57.7 Years.
What is the Average Family Size in Carlisle
Average Family Size in Carlisle is 3.2 People.
What is the Average Household Size in Carlisle
Average Household Size in Carlisle is 2.9 People.
How Large is the Labor Force in Carlisle?
There are 120 People in the Labor Forcein in Carlisle.
What is the Percentage of People in the Labor Force in Carlisle?
28.2% of People are in the Labor Force in Carlisle.