Narcissa, OK Map & Demographics
Narcissa Map
Narcissa Overview
$23,732
PER CAPITA INCOME
$64,545
AVG FAMILY INCOME
$63,523
AVG HOUSEHOLD INCOME
5.7%
WAGE / INCOME GAP [ % ]
94.3¢/ $1
WAGE / INCOME GAP [ $ ]
0.23
INEQUALITY / GINI INDEX
111
TOTAL POPULATION
50
MALE POPULATION
61
FEMALE POPULATION
81.97
MALES / 100 FEMALES
122.00
FEMALES / 100 MALES
33.5
MEDIAN AGE
3.5
AVG FAMILY SIZE
3.2
AVG HOUSEHOLD SIZE
30
LABOR FORCE [ PEOPLE ]
44.8%
PERCENT IN LABOR FORCE
Income in Narcissa
Income Overview in Narcissa
Per Capita Income in Narcissa is $23,732, while median incomes of families and households are $64,545 and $63,523 respectively.
| Characteristic | Number | Measure |
| Per Capita Income | 111 | $23,732 |
| Median Family Income | 26 | $64,545 |
| Mean Family Income | 26 | $87,292 |
| Median Household Income | 35 | $63,523 |
| Mean Household Income | 35 | $78,720 |
| Income Deficit | 26 | $0 |
| Wage / Income Gap (%) | 111 | 5.71% |
| Wage / Income Gap ($) | 111 | 94.29¢ per $1 |
| Gini / Inequality Index | 111 | 0.23 |
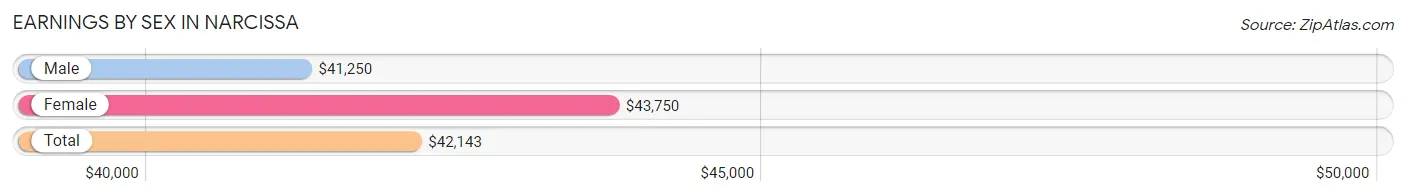
Earnings by Sex in Narcissa
Average Earnings in Narcissa are $42,143, $41,250 for men and $43,750 for women, a difference of 5.7%.
| Sex | Number | Average Earnings |
| Male | 21 (58.3%) | $41,250 |
| Female | 15 (41.7%) | $43,750 |
| Total | 36 (100.0%) | $42,143 |
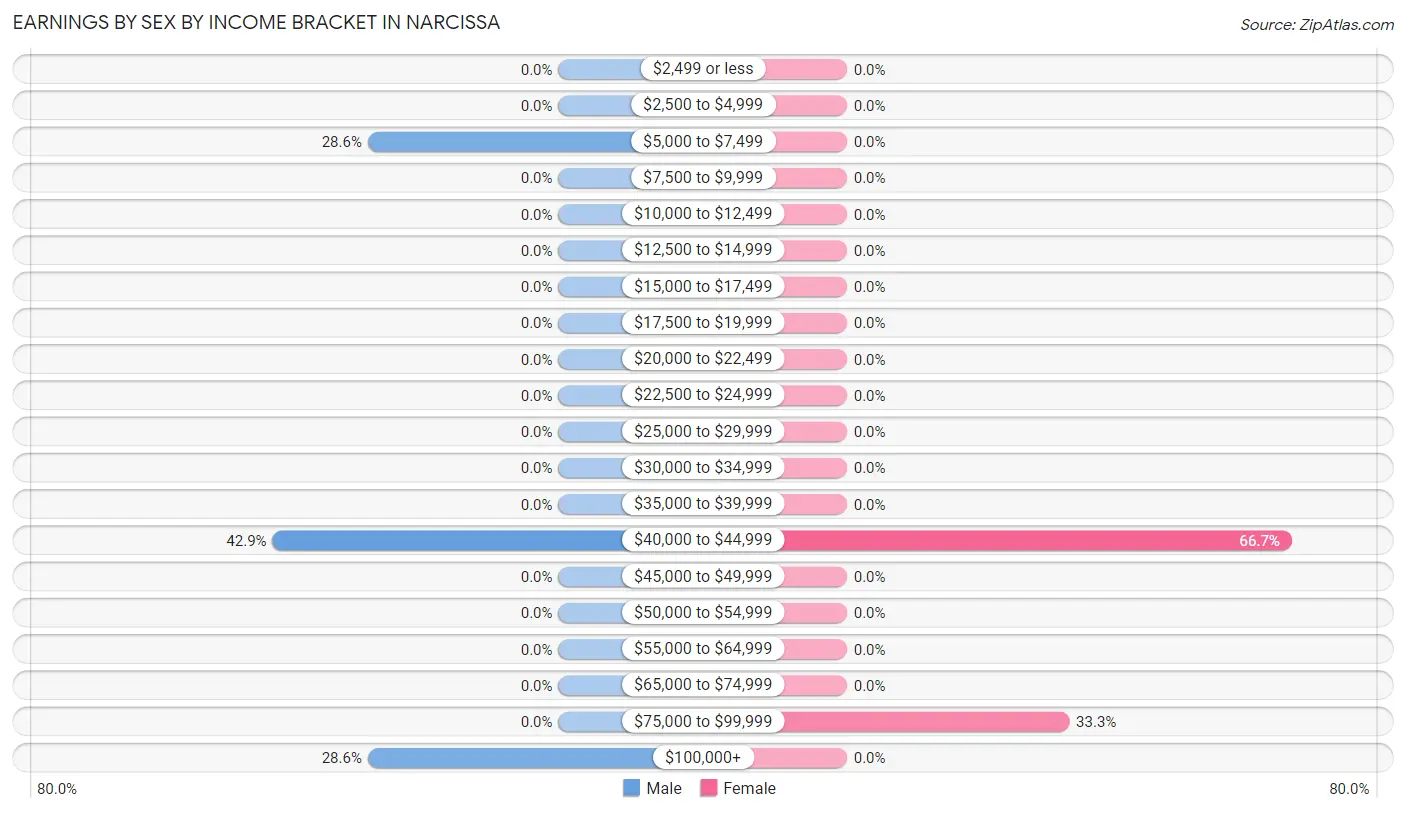
Earnings by Sex by Income Bracket in Narcissa
The most common earnings brackets in Narcissa are $40,000 to $44,999 for men (9 | 42.9%) and $40,000 to $44,999 for women (10 | 66.7%).
| Income | Male | Female |
| $2,499 or less | 0 (0.0%) | 0 (0.0%) |
| $2,500 to $4,999 | 0 (0.0%) | 0 (0.0%) |
| $5,000 to $7,499 | 6 (28.6%) | 0 (0.0%) |
| $7,500 to $9,999 | 0 (0.0%) | 0 (0.0%) |
| $10,000 to $12,499 | 0 (0.0%) | 0 (0.0%) |
| $12,500 to $14,999 | 0 (0.0%) | 0 (0.0%) |
| $15,000 to $17,499 | 0 (0.0%) | 0 (0.0%) |
| $17,500 to $19,999 | 0 (0.0%) | 0 (0.0%) |
| $20,000 to $22,499 | 0 (0.0%) | 0 (0.0%) |
| $22,500 to $24,999 | 0 (0.0%) | 0 (0.0%) |
| $25,000 to $29,999 | 0 (0.0%) | 0 (0.0%) |
| $30,000 to $34,999 | 0 (0.0%) | 0 (0.0%) |
| $35,000 to $39,999 | 0 (0.0%) | 0 (0.0%) |
| $40,000 to $44,999 | 9 (42.9%) | 10 (66.7%) |
| $45,000 to $49,999 | 0 (0.0%) | 0 (0.0%) |
| $50,000 to $54,999 | 0 (0.0%) | 0 (0.0%) |
| $55,000 to $64,999 | 0 (0.0%) | 0 (0.0%) |
| $65,000 to $74,999 | 0 (0.0%) | 0 (0.0%) |
| $75,000 to $99,999 | 0 (0.0%) | 5 (33.3%) |
| $100,000+ | 6 (28.6%) | 0 (0.0%) |
| Total | 21 (100.0%) | 15 (100.0%) |
Earnings by Sex by Educational Attainment in Narcissa
| Educational Attainment | Male Income | Female Income |
| Less than High School | - | - |
| High School Diploma | - | - |
| College or Associate's Degree | - | - |
| Bachelor's Degree | - | - |
| Graduate Degree | - | - |
| Total | - | - |
Family Income in Narcissa
Family Income Brackets in Narcissa
According to the Narcissa family income data, there are 11 families falling into the $50,000 to $74,999 income range, which is the most common income bracket and makes up 42.3% of all families.
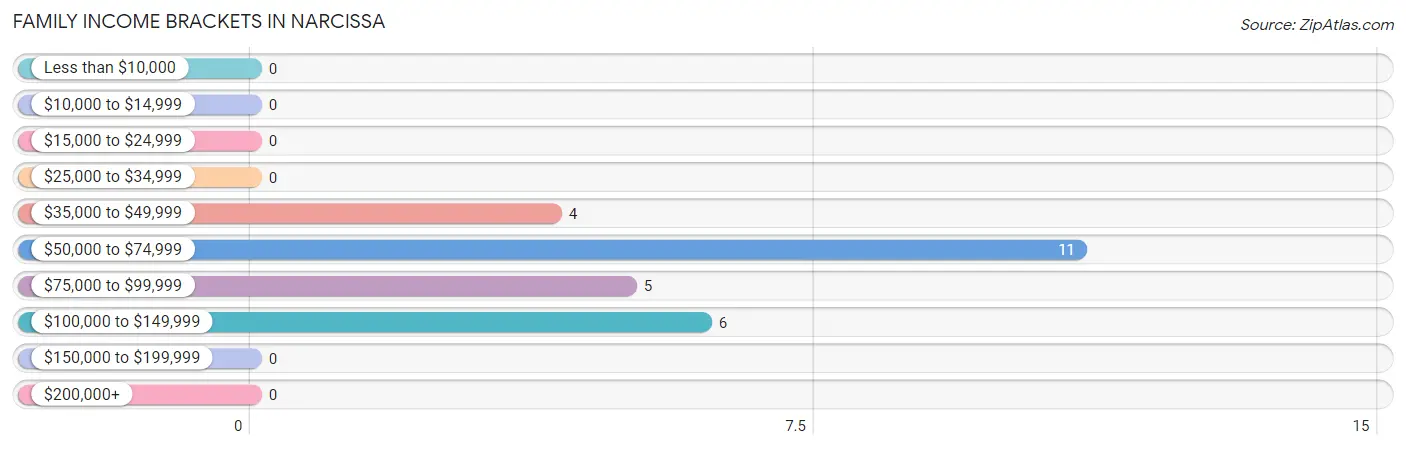
| Income Bracket | # Families | % Families |
| Less than $10,000 | 0 | 0.0% |
| $10,000 to $14,999 | 0 | 0.0% |
| $15,000 to $24,999 | 0 | 0.0% |
| $25,000 to $34,999 | 0 | 0.0% |
| $35,000 to $49,999 | 4 | 15.4% |
| $50,000 to $74,999 | 11 | 42.3% |
| $75,000 to $99,999 | 5 | 19.2% |
| $100,000 to $149,999 | 6 | 23.1% |
| $150,000 to $199,999 | 0 | 0.0% |
| $200,000+ | 0 | 0.0% |
Family Income by Famaliy Size in Narcissa
| Income Bracket | # Families | Median Income |
| 2-Person Families | 11 (42.3%) | $0 |
| 3-Person Families | 4 (15.4%) | $0 |
| 4-Person Families | 0 (0.0%) | $0 |
| 5-Person Families | 11 (42.3%) | $0 |
| 6-Person Families | 0 (0.0%) | $0 |
| 7+ Person Families | 0 (0.0%) | $0 |
| Total | 26 (100.0%) | $64,545 |
Family Income by Number of Earners in Narcissa
| Number of Earners | # Families | Median Income |
| No Earners | 10 (38.5%) | $0 |
| 1 Earner | 5 (19.2%) | $0 |
| 2 Earners | 11 (42.3%) | $0 |
| 3+ Earners | 0 (0.0%) | $0 |
| Total | 26 (100.0%) | $64,545 |
Household Income in Narcissa
Household Income Brackets in Narcissa
With 17 households falling in the category, the $50,000 to $74,999 income range is the most frequent in Narcissa, accounting for 48.6% of all households.
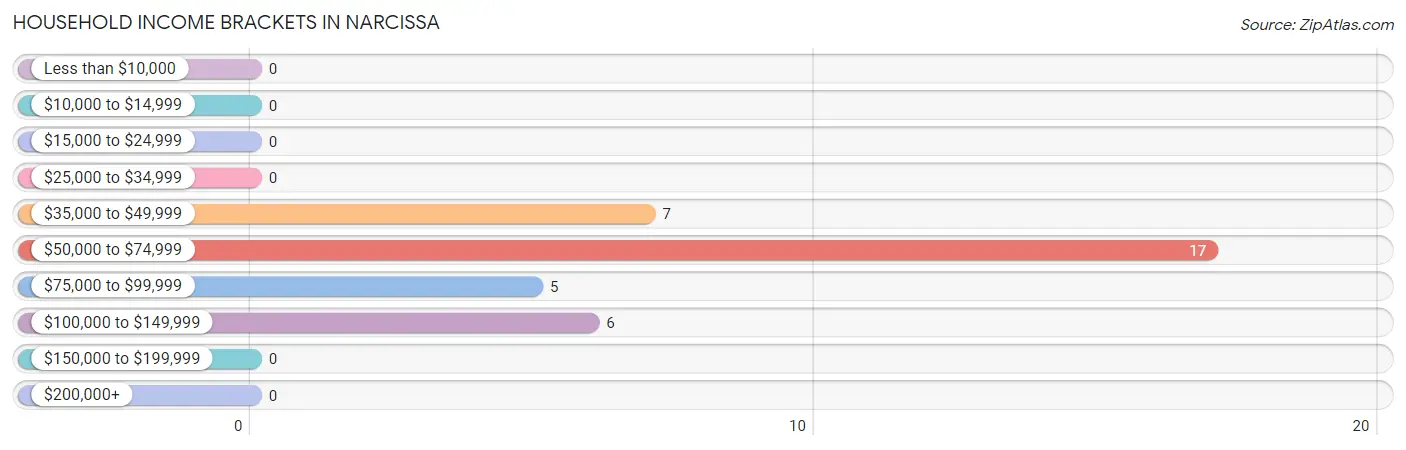
| Income Bracket | # Households | % Households |
| Less than $10,000 | 0 | 0.0% |
| $10,000 to $14,999 | 0 | 0.0% |
| $15,000 to $24,999 | 0 | 0.0% |
| $25,000 to $34,999 | 0 | 0.0% |
| $35,000 to $49,999 | 7 | 20.0% |
| $50,000 to $74,999 | 17 | 48.6% |
| $75,000 to $99,999 | 5 | 14.3% |
| $100,000 to $149,999 | 6 | 17.1% |
| $150,000 to $199,999 | 0 | 0.0% |
| $200,000+ | 0 | 0.0% |
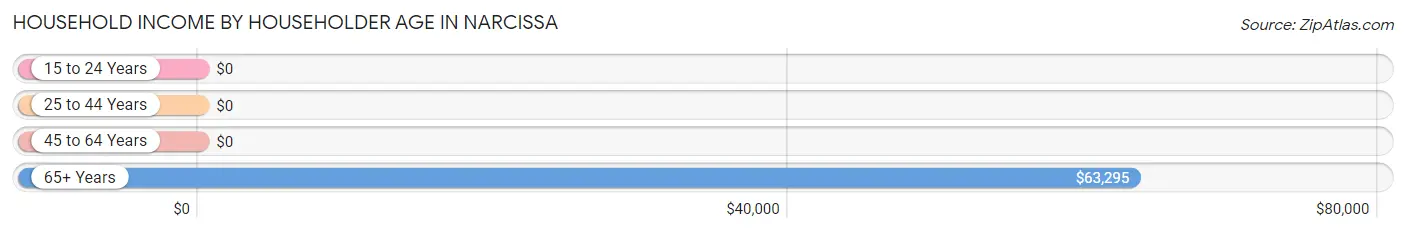
Household Income by Householder Age in Narcissa
The median household income in Narcissa is $63,523, with the highest median household income of $63,295 found in the 65+ years age bracket for the primary householder. A total of 15 households (42.9%) fall into this category. Meanwhile, the 15 to 24 years age bracket for the primary householder has the lowest median household income of $0, with 3 households (8.6%) in this group.
| Income Bracket | # Households | Median Income |
| 15 to 24 Years | 3 (8.6%) | $0 |
| 25 to 44 Years | 11 (31.4%) | $0 |
| 45 to 64 Years | 6 (17.1%) | $0 |
| 65+ Years | 15 (42.9%) | $63,295 |
| Total | 35 (100.0%) | $63,523 |
Poverty in Narcissa
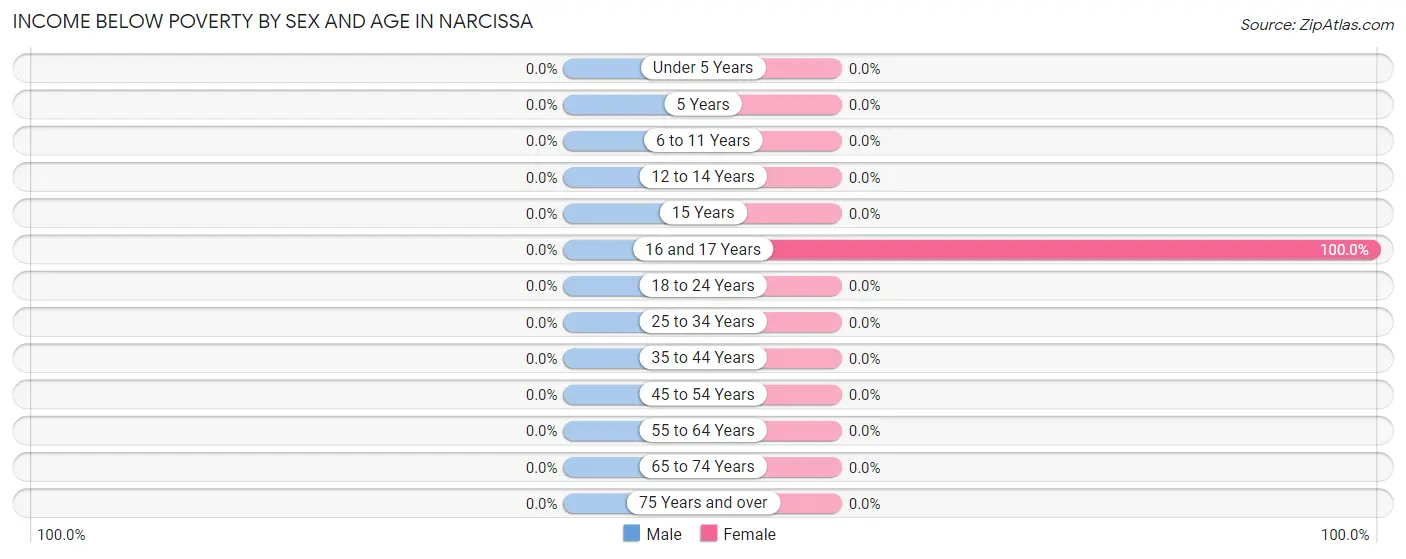
Income Below Poverty by Sex and Age in Narcissa
| Age Bracket | Male | Female |
| Under 5 Years | 0 (0.0%) | 0 (0.0%) |
| 5 Years | 0 (0.0%) | 0 (0.0%) |
| 6 to 11 Years | 0 (0.0%) | 0 (0.0%) |
| 12 to 14 Years | 0 (0.0%) | 0 (0.0%) |
| 15 Years | 0 (0.0%) | 0 (0.0%) |
| 16 and 17 Years | 0 (0.0%) | 6 (100.0%) |
| 18 to 24 Years | 0 (0.0%) | 0 (0.0%) |
| 25 to 34 Years | 0 (0.0%) | 0 (0.0%) |
| 35 to 44 Years | 0 (0.0%) | 0 (0.0%) |
| 45 to 54 Years | 0 (0.0%) | 0 (0.0%) |
| 55 to 64 Years | 0 (0.0%) | 0 (0.0%) |
| 65 to 74 Years | 0 (0.0%) | 0 (0.0%) |
| 75 Years and over | 0 (0.0%) | 0 (0.0%) |
| Total | 0 (0.0%) | 6 (9.8%) |
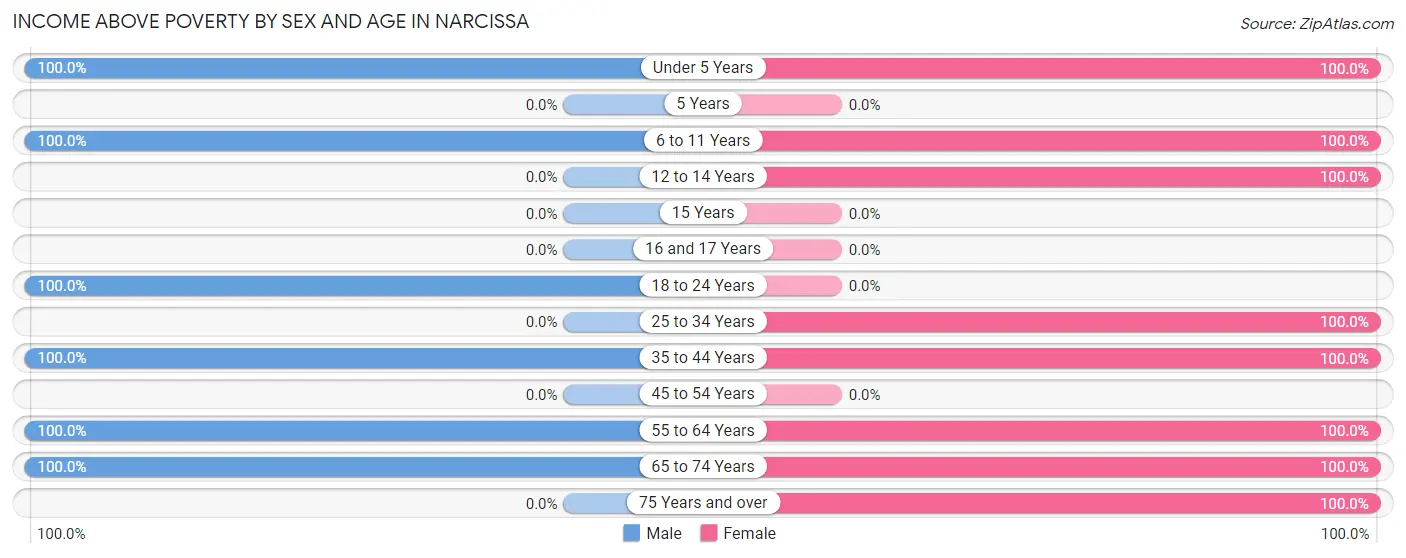
Income Above Poverty by Sex and Age in Narcissa
According to the poverty statistics in Narcissa, males aged under 5 years and females aged under 5 years are the age groups that are most secure financially, with 100.0% of males and 100.0% of females in these age groups living above the poverty line.
| Age Bracket | Male | Female |
| Under 5 Years | 5 (100.0%) | 6 (100.0%) |
| 5 Years | 0 (0.0%) | 0 (0.0%) |
| 6 to 11 Years | 14 (100.0%) | 13 (100.0%) |
| 12 to 14 Years | 0 (0.0%) | 6 (100.0%) |
| 15 Years | 0 (0.0%) | 0 (0.0%) |
| 16 and 17 Years | 0 (0.0%) | 0 (0.0%) |
| 18 to 24 Years | 3 (100.0%) | 0 (0.0%) |
| 25 to 34 Years | 0 (0.0%) | 5 (100.0%) |
| 35 to 44 Years | 12 (100.0%) | 5 (100.0%) |
| 45 to 54 Years | 0 (0.0%) | 0 (0.0%) |
| 55 to 64 Years | 6 (100.0%) | 10 (100.0%) |
| 65 to 74 Years | 10 (100.0%) | 5 (100.0%) |
| 75 Years and over | 0 (0.0%) | 5 (100.0%) |
| Total | 50 (100.0%) | 55 (90.2%) |
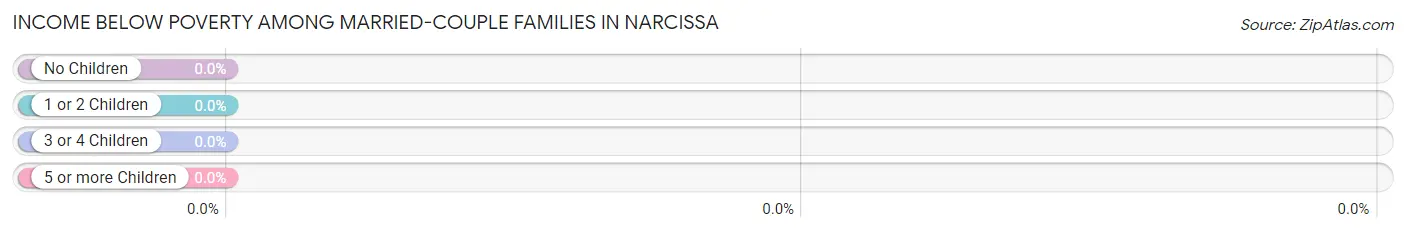
Income Below Poverty Among Married-Couple Families in Narcissa
| Children | Above Poverty | Below Poverty |
| No Children | 6 (100.0%) | 0 (0.0%) |
| 1 or 2 Children | 4 (100.0%) | 0 (0.0%) |
| 3 or 4 Children | 11 (100.0%) | 0 (0.0%) |
| 5 or more Children | 0 (0.0%) | 0 (0.0%) |
| Total | 21 (100.0%) | 0 (0.0%) |
Income Below Poverty Among Single-Parent Households in Narcissa
| Children | Single Father | Single Mother |
| No Children | 0 (0.0%) | 0 (0.0%) |
| 1 or 2 Children | 0 (0.0%) | 0 (0.0%) |
| 3 or 4 Children | 0 (0.0%) | 0 (0.0%) |
| 5 or more Children | 0 (0.0%) | 0 (0.0%) |
| Total | 0 (0.0%) | 0 (0.0%) |
Income Below Poverty Among Married-Couple vs Single-Parent Households in Narcissa
| Children | Married-Couple Families | Single-Parent Households |
| No Children | 0 (0.0%) | 0 (0.0%) |
| 1 or 2 Children | 0 (0.0%) | 0 (0.0%) |
| 3 or 4 Children | 0 (0.0%) | 0 (0.0%) |
| 5 or more Children | 0 (0.0%) | 0 (0.0%) |
| Total | 0 (0.0%) | 0 (0.0%) |
Race in Narcissa
The most populous races in Narcissa are White / Caucasian (90 | 81.1%), and Native / Alaskan (21 | 18.9%).
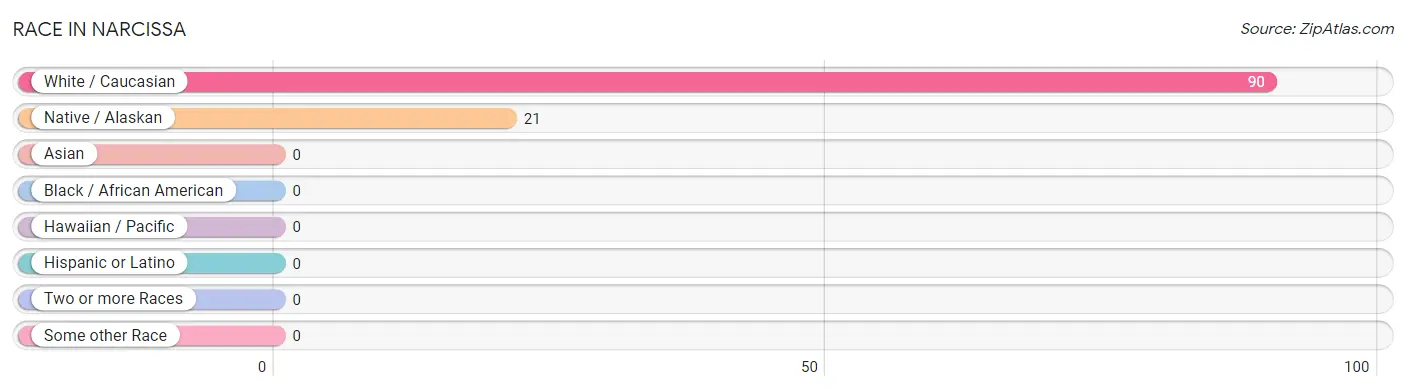
| Race | # Population | % Population |
| Asian | 0 | 0.0% |
| Black / African American | 0 | 0.0% |
| Hawaiian / Pacific | 0 | 0.0% |
| Hispanic or Latino | 0 | 0.0% |
| Native / Alaskan | 21 | 18.9% |
| White / Caucasian | 90 | 81.1% |
| Two or more Races | 0 | 0.0% |
| Some other Race | 0 | 0.0% |
| Total | 111 | 100.0% |
Ancestry in Narcissa
The most populous ancestries reported in Narcissa are Irish (34 | 30.6%), German (33 | 29.7%), English (27 | 24.3%), Cherokee (14 | 12.6%), and Scandinavian (6 | 5.4%), together accounting for 102.7% of all Narcissa residents.
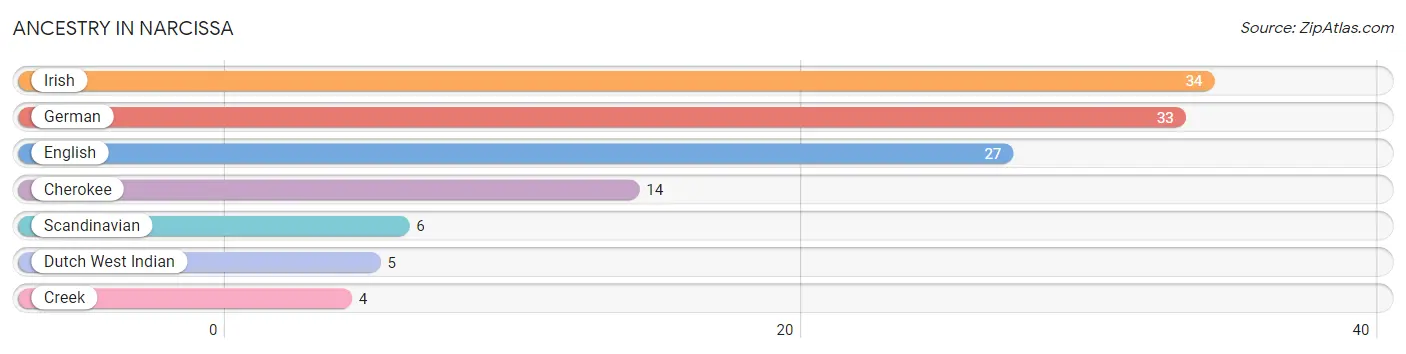
| Ancestry | # Population | % Population |
| Cherokee | 14 | 12.6% |
| Creek | 4 | 3.6% |
| Dutch West Indian | 5 | 4.5% |
| English | 27 | 24.3% |
| German | 33 | 29.7% |
| Irish | 34 | 30.6% |
| Scandinavian | 6 | 5.4% | View All 7 Rows |
Immigrants in Narcissa

| Immigration Origin | # Population | % Population | View All 0 Rows |
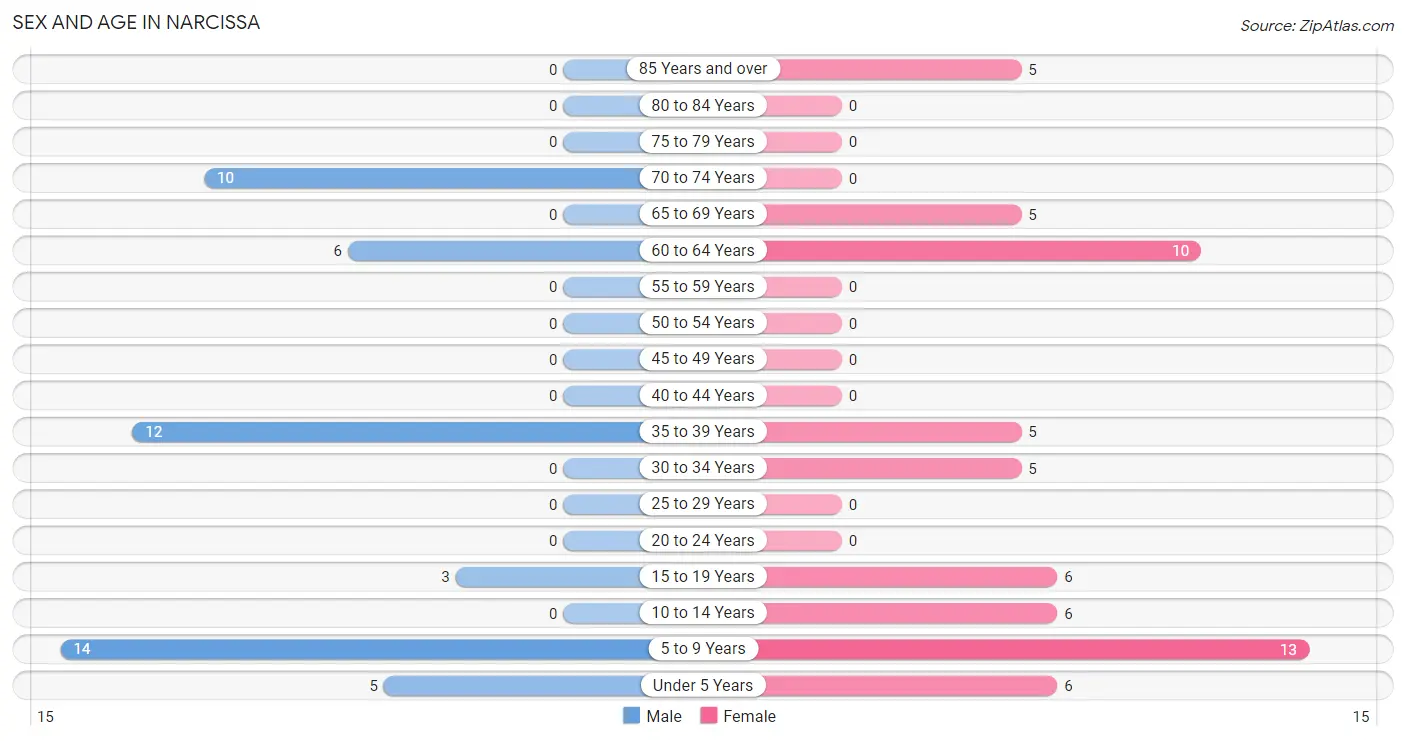
Sex and Age in Narcissa
Sex and Age in Narcissa
The most populous age groups in Narcissa are 5 to 9 Years (14 | 28.0%) for men and 5 to 9 Years (13 | 21.3%) for women.
| Age Bracket | Male | Female |
| Under 5 Years | 5 (10.0%) | 6 (9.8%) |
| 5 to 9 Years | 14 (28.0%) | 13 (21.3%) |
| 10 to 14 Years | 0 (0.0%) | 6 (9.8%) |
| 15 to 19 Years | 3 (6.0%) | 6 (9.8%) |
| 20 to 24 Years | 0 (0.0%) | 0 (0.0%) |
| 25 to 29 Years | 0 (0.0%) | 0 (0.0%) |
| 30 to 34 Years | 0 (0.0%) | 5 (8.2%) |
| 35 to 39 Years | 12 (24.0%) | 5 (8.2%) |
| 40 to 44 Years | 0 (0.0%) | 0 (0.0%) |
| 45 to 49 Years | 0 (0.0%) | 0 (0.0%) |
| 50 to 54 Years | 0 (0.0%) | 0 (0.0%) |
| 55 to 59 Years | 0 (0.0%) | 0 (0.0%) |
| 60 to 64 Years | 6 (12.0%) | 10 (16.4%) |
| 65 to 69 Years | 0 (0.0%) | 5 (8.2%) |
| 70 to 74 Years | 10 (20.0%) | 0 (0.0%) |
| 75 to 79 Years | 0 (0.0%) | 0 (0.0%) |
| 80 to 84 Years | 0 (0.0%) | 0 (0.0%) |
| 85 Years and over | 0 (0.0%) | 5 (8.2%) |
| Total | 50 (100.0%) | 61 (100.0%) |
Families and Households in Narcissa
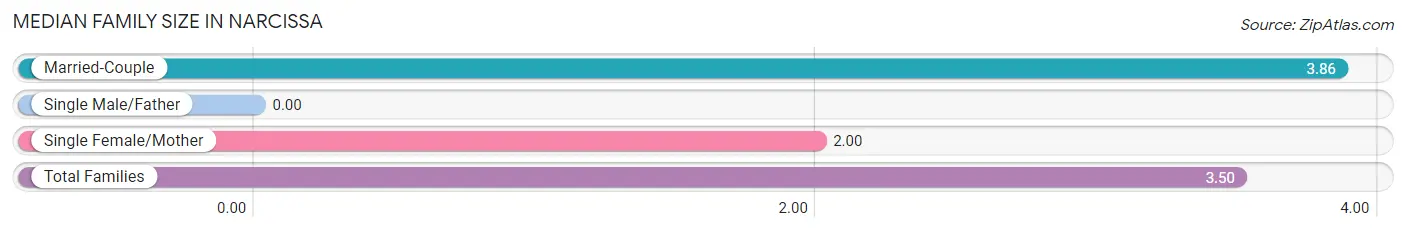
Median Family Size in Narcissa
| Family Type | # Families | Family Size |
| Married-Couple | 21 (80.8%) | 3.86 |
| Single Male/Father | 0 (0.0%) | - |
| Single Female/Mother | 5 (19.2%) | 2.00 |
| Total Families | 26 (100.0%) | 3.50 |
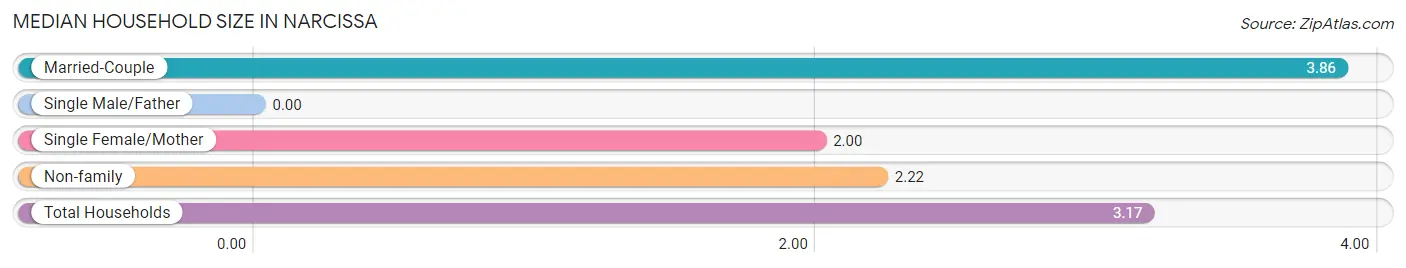
Median Household Size in Narcissa
| Household Type | # Households | Household Size |
| Married-Couple | 21 (60.0%) | 3.86 |
| Single Male/Father | 0 (0.0%) | - |
| Single Female/Mother | 5 (14.3%) | 2.00 |
| Non-family | 9 (25.7%) | 2.22 |
| Total Households | 35 (100.0%) | 3.17 |
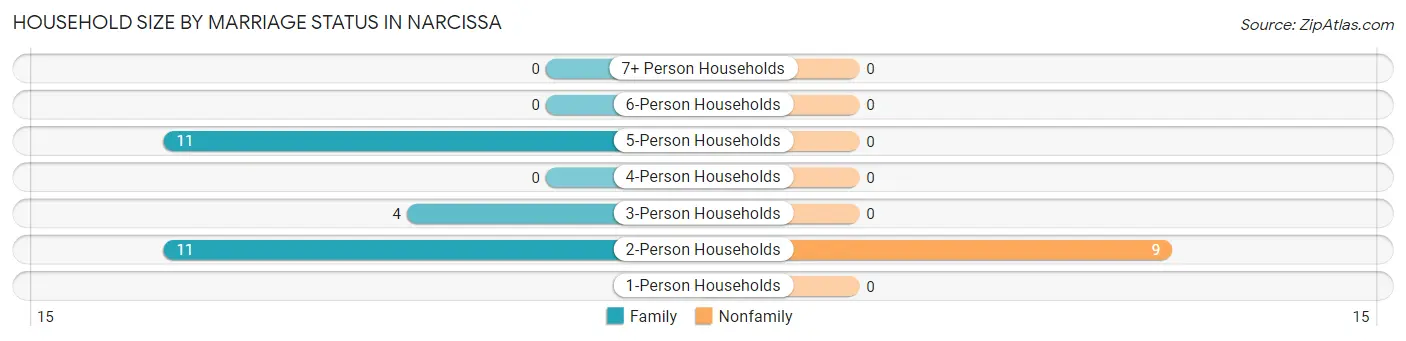
Household Size by Marriage Status in Narcissa
Out of a total of 35 households in Narcissa, 26 (74.3%) are family households, while 9 (25.7%) are nonfamily households. The most numerous type of family households are 2-person households, comprising 11, and the most common type of nonfamily households are 2-person households, comprising 9.
| Household Size | Family Households | Nonfamily Households |
| 1-Person Households | - | 0 (0.0%) |
| 2-Person Households | 11 (31.4%) | 9 (25.7%) |
| 3-Person Households | 4 (11.4%) | 0 (0.0%) |
| 4-Person Households | 0 (0.0%) | 0 (0.0%) |
| 5-Person Households | 11 (31.4%) | 0 (0.0%) |
| 6-Person Households | 0 (0.0%) | 0 (0.0%) |
| 7+ Person Households | 0 (0.0%) | 0 (0.0%) |
| Total | 26 (74.3%) | 9 (25.7%) |
Female Fertility in Narcissa
Fertility by Age in Narcissa
| Age Bracket | Women with Births | Births / 1,000 Women |
| 15 to 19 years | 0 (0.0%) | 0.0 |
| 20 to 34 years | 0 (0.0%) | 0.0 |
| 35 to 50 years | 0 (0.0%) | 0.0 |
| Total | 0 (0.0%) | 0.0 |
Fertility by Age by Marriage Status in Narcissa
| Age Bracket | Married | Unmarried |
| 15 to 19 years | 0 (0.0%) | 0 (0.0%) |
| 20 to 34 years | 0 (0.0%) | 0 (0.0%) |
| 35 to 50 years | 0 (0.0%) | 0 (0.0%) |
| Total | 0 (0.0%) | 0 (0.0%) |
Fertility by Education in Narcissa
| Educational Attainment | Women with Births | Births / 1,000 Women |
| Less than High School | 0 (0.0%) | 0.0 |
| High School Diploma | 0 (0.0%) | 0.0 |
| College or Associate's Degree | 0 (0.0%) | 0.0 |
| Bachelor's Degree | 0 (0.0%) | 0.0 |
| Graduate Degree | 0 (0.0%) | 0.0 |
| Total | 0 (0.0%) | 0.0 |
Fertility by Education by Marriage Status in Narcissa
| Educational Attainment | Married | Unmarried |
| Less than High School | 0 (0.0%) | 0 (0.0%) |
| High School Diploma | 0 (0.0%) | 0 (0.0%) |
| College or Associate's Degree | 0 (0.0%) | 0 (0.0%) |
| Bachelor's Degree | 0 (0.0%) | 0 (0.0%) |
| Graduate Degree | 0 (0.0%) | 0 (0.0%) |
| Total | 0 (0.0%) | 0 (0.0%) |
Employment Characteristics in Narcissa
Employment by Class of Employer in Narcissa
Among the 30 employed individuals in Narcissa, private company employees (24 | 80.0%), and self-employed (incorporated) (6 | 20.0%) make up the most common classes of employment.
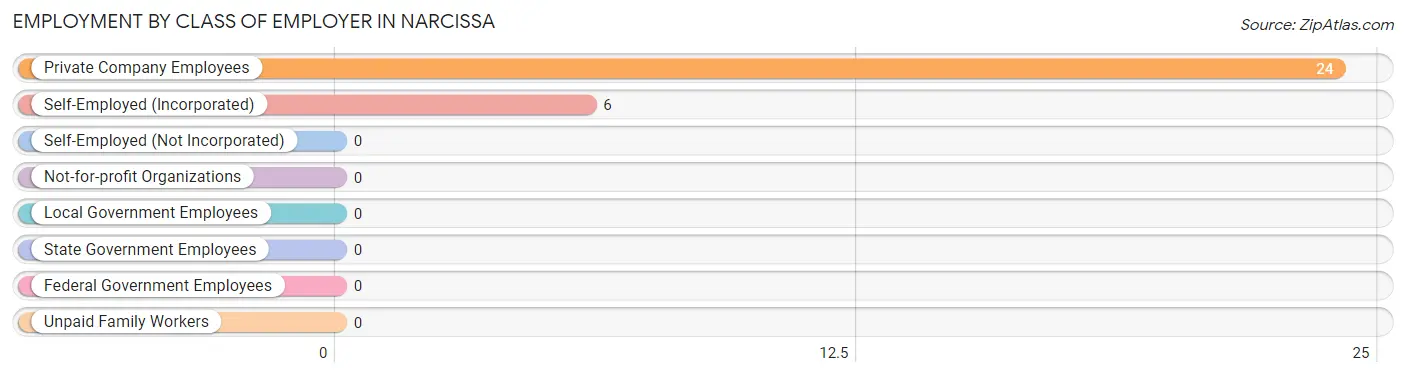
| Employer Class | # Employees | % Employees |
| Private Company Employees | 24 | 80.0% |
| Self-Employed (Incorporated) | 6 | 20.0% |
| Self-Employed (Not Incorporated) | 0 | 0.0% |
| Not-for-profit Organizations | 0 | 0.0% |
| Local Government Employees | 0 | 0.0% |
| State Government Employees | 0 | 0.0% |
| Federal Government Employees | 0 | 0.0% |
| Unpaid Family Workers | 0 | 0.0% |
| Total | 30 | 100.0% |
Employment Status by Age in Narcissa
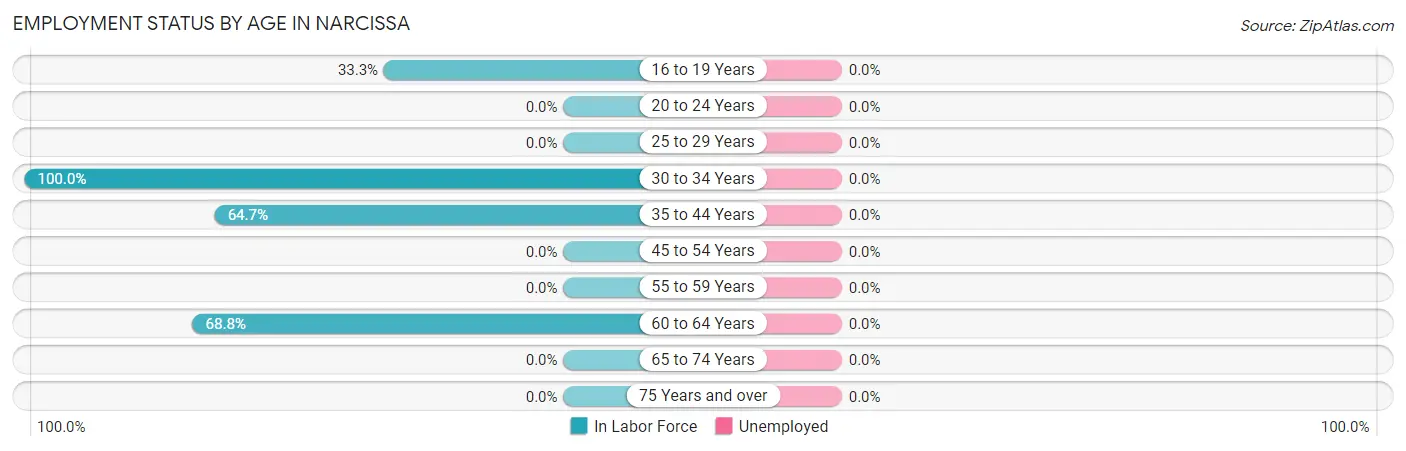
| Age Bracket | In Labor Force | Unemployed |
| 16 to 19 Years | 3 (33.3%) | 0 (0.0%) |
| 20 to 24 Years | 0 (0.0%) | 0 (0.0%) |
| 25 to 29 Years | 0 (0.0%) | 0 (0.0%) |
| 30 to 34 Years | 5 (100.0%) | 0 (0.0%) |
| 35 to 44 Years | 11 (64.7%) | 0 (0.0%) |
| 45 to 54 Years | 0 (0.0%) | 0 (0.0%) |
| 55 to 59 Years | 0 (0.0%) | 0 (0.0%) |
| 60 to 64 Years | 11 (68.8%) | 0 (0.0%) |
| 65 to 74 Years | 0 (0.0%) | 0 (0.0%) |
| 75 Years and over | 0 (0.0%) | 0 (0.0%) |
| Total | 30 (44.8%) | 0 (0.0%) |
Employment Status by Educational Attainment in Narcissa
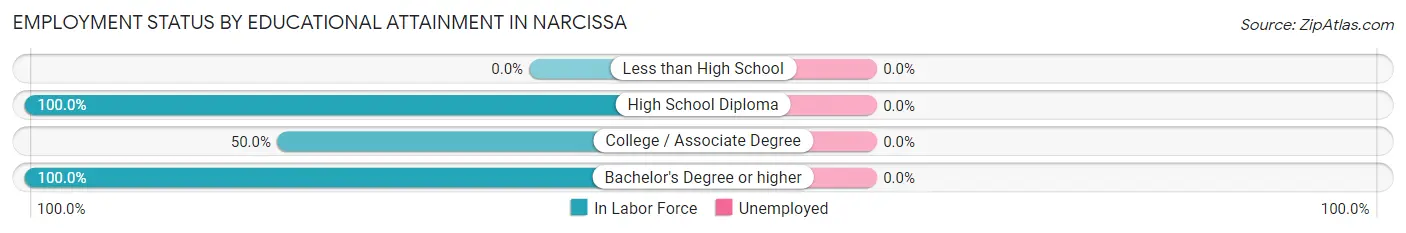
| Educational Attainment | In Labor Force | Unemployed |
| Less than High School | 0 (0.0%) | 0 (0.0%) |
| High School Diploma | 11 (100.0%) | 0 (0.0%) |
| College / Associate Degree | 11 (50.0%) | 0 (0.0%) |
| Bachelor's Degree or higher | 5 (100.0%) | 0 (0.0%) |
| Total | 27 (71.1%) | 0 (0.0%) |
Employment Occupations by Sex in Narcissa
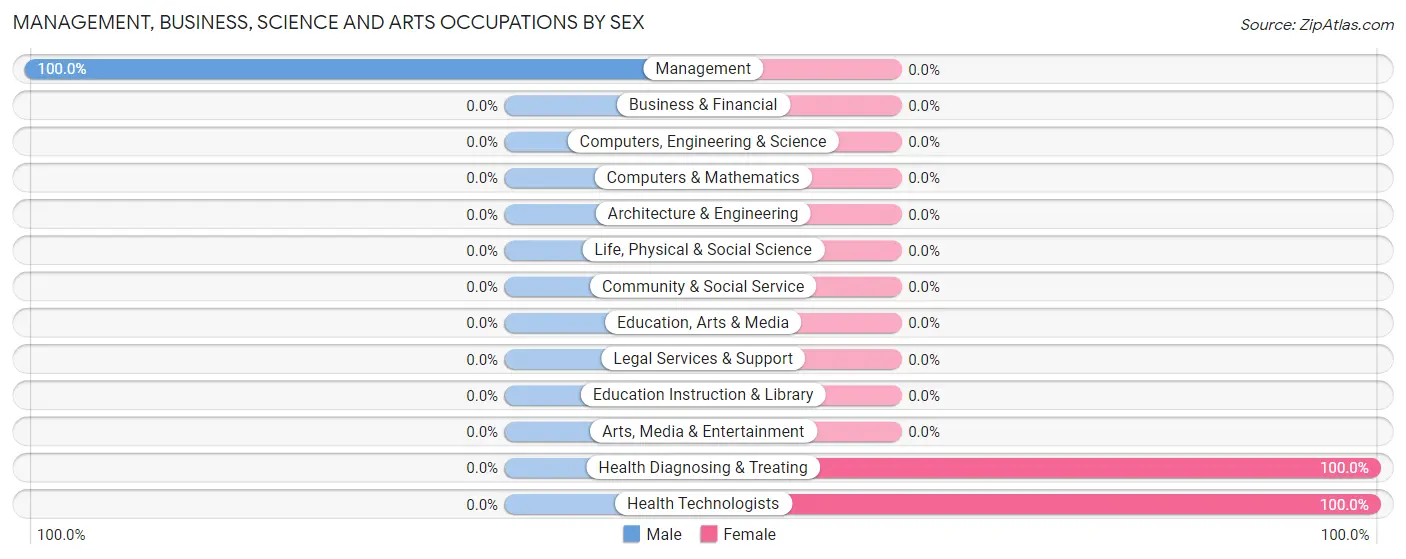
Management, Business, Science and Arts Occupations
The most common Management, Business, Science and Arts occupations in Narcissa are Management (6 | 20.0%), Health Diagnosing & Treating (5 | 16.7%), and Health Technologists (5 | 16.7%).
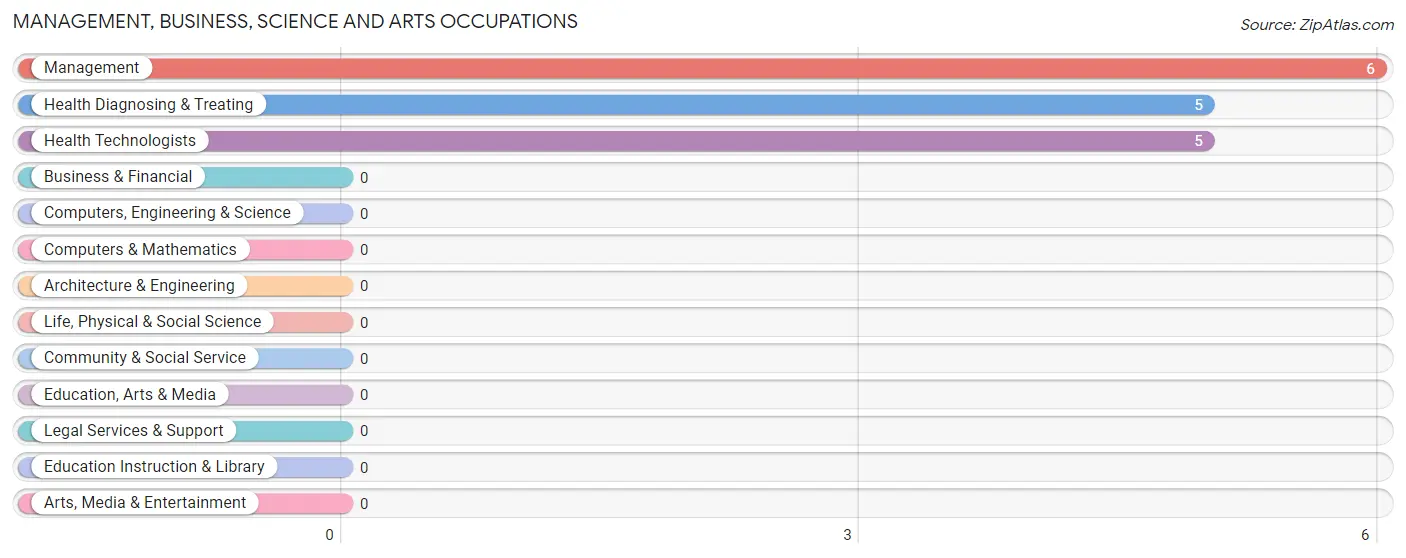
Management, Business, Science and Arts Occupations by Sex
| Occupation | Male | Female |
| Management | 6 (100.0%) | 0 (0.0%) |
| Business & Financial | 0 (0.0%) | 0 (0.0%) |
| Computers, Engineering & Science | 0 (0.0%) | 0 (0.0%) |
| Computers & Mathematics | 0 (0.0%) | 0 (0.0%) |
| Architecture & Engineering | 0 (0.0%) | 0 (0.0%) |
| Life, Physical & Social Science | 0 (0.0%) | 0 (0.0%) |
| Community & Social Service | 0 (0.0%) | 0 (0.0%) |
| Education, Arts & Media | 0 (0.0%) | 0 (0.0%) |
| Legal Services & Support | 0 (0.0%) | 0 (0.0%) |
| Education Instruction & Library | 0 (0.0%) | 0 (0.0%) |
| Arts, Media & Entertainment | 0 (0.0%) | 0 (0.0%) |
| Health Diagnosing & Treating | 0 (0.0%) | 5 (100.0%) |
| Health Technologists | 0 (0.0%) | 5 (100.0%) |
| Total (Category) | 6 (54.5%) | 5 (45.5%) |
| Total (Overall) | 15 (50.0%) | 15 (50.0%) |
Services Occupations
Services Occupations by Sex
| Occupation | Male | Female |
| Healthcare Support | 0 (0.0%) | 0 (0.0%) |
| Security & Protection | 0 (0.0%) | 0 (0.0%) |
| Firefighting & Prevention | 0 (0.0%) | 0 (0.0%) |
| Law Enforcement | 0 (0.0%) | 0 (0.0%) |
| Food Preparation & Serving | 0 (0.0%) | 0 (0.0%) |
| Cleaning & Maintenance | 0 (0.0%) | 0 (0.0%) |
| Personal Care & Service | 0 (0.0%) | 0 (0.0%) |
| Total (Category) | 0 (0.0%) | 0 (0.0%) |
| Total (Overall) | 15 (50.0%) | 15 (50.0%) |
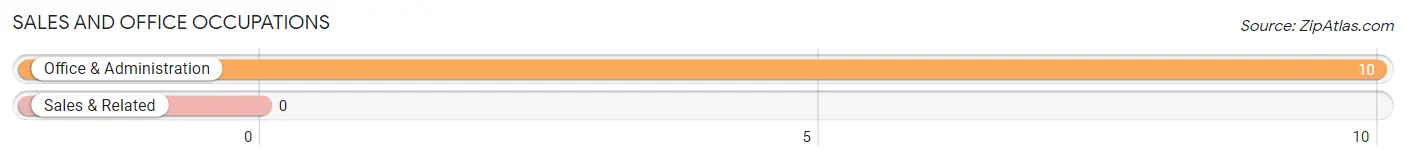
Sales and Office Occupations
The most common Sales and Office occupations in Narcissa are , and Office & Administration (10 | 33.3%).
Sales and Office Occupations by Sex

| Occupation | Male | Female |
| Sales & Related | 0 (0.0%) | 0 (0.0%) |
| Office & Administration | 0 (0.0%) | 10 (100.0%) |
| Total (Category) | 0 (0.0%) | 10 (100.0%) |
| Total (Overall) | 15 (50.0%) | 15 (50.0%) |
Natural Resources, Construction and Maintenance Occupations
Natural Resources, Construction and Maintenance Occupations by Sex
| Occupation | Male | Female |
| Farming, Fishing & Forestry | 0 (0.0%) | 0 (0.0%) |
| Construction & Extraction | 0 (0.0%) | 0 (0.0%) |
| Installation, Maintenance & Repair | 0 (0.0%) | 0 (0.0%) |
| Total (Category) | 0 (0.0%) | 0 (0.0%) |
| Total (Overall) | 15 (50.0%) | 15 (50.0%) |
Production, Transportation and Moving Occupations
The most common Production, Transportation and Moving occupations in Narcissa are , and Production (9 | 30.0%).
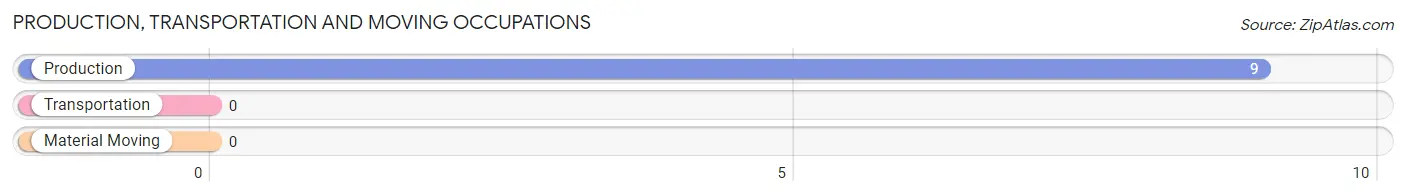
Production, Transportation and Moving Occupations by Sex
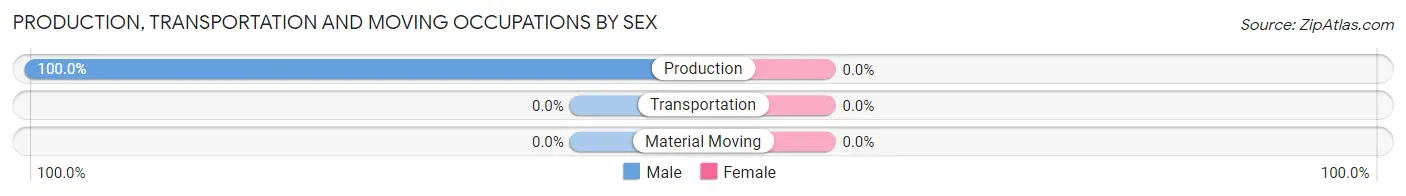
| Occupation | Male | Female |
| Production | 9 (100.0%) | 0 (0.0%) |
| Transportation | 0 (0.0%) | 0 (0.0%) |
| Material Moving | 0 (0.0%) | 0 (0.0%) |
| Total (Category) | 9 (100.0%) | 0 (0.0%) |
| Total (Overall) | 15 (50.0%) | 15 (50.0%) |
Employment Industries by Sex in Narcissa
Employment Industries in Narcissa
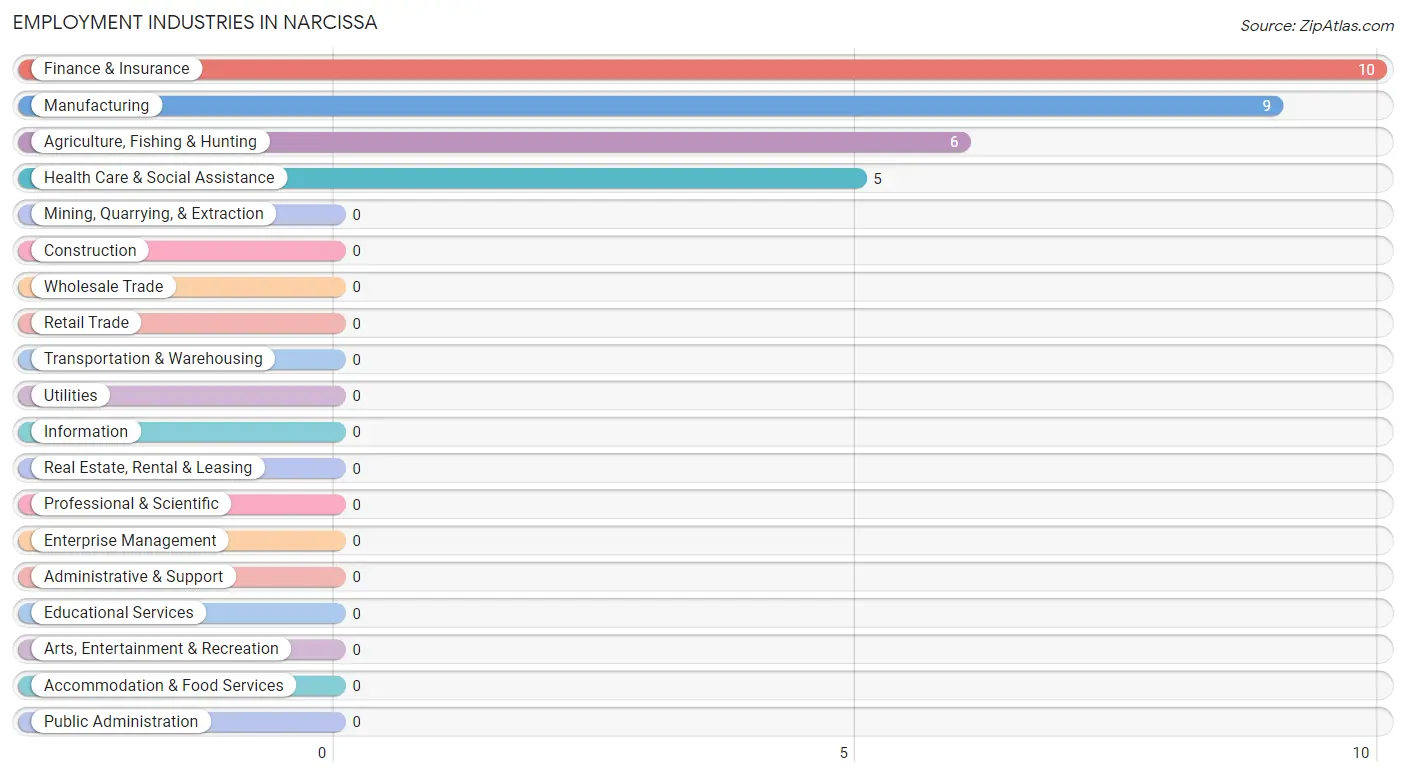
The major employment industries in Narcissa include Finance & Insurance (10 | 33.3%), Manufacturing (9 | 30.0%), Agriculture, Fishing & Hunting (6 | 20.0%), and Health Care & Social Assistance (5 | 16.7%).
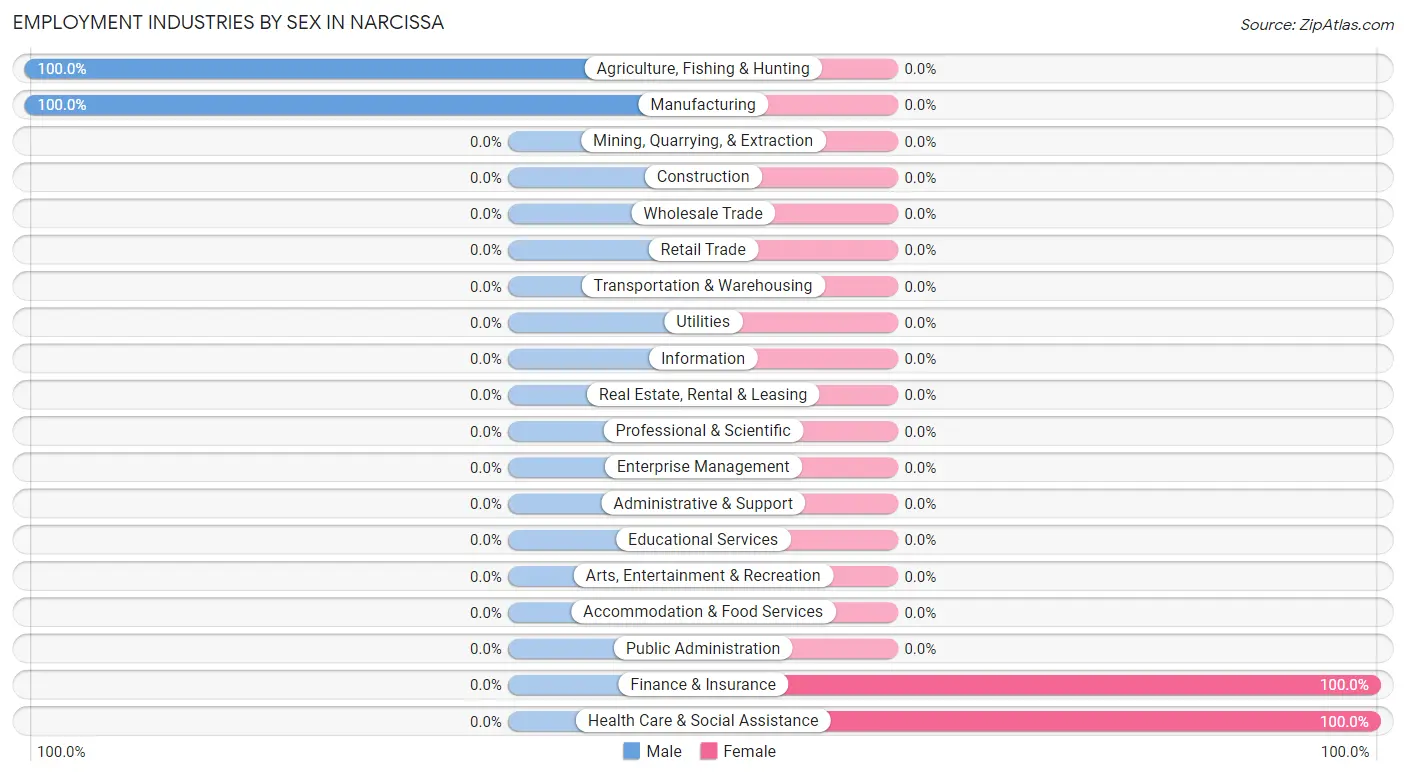
Employment Industries by Sex in Narcissa
The Narcissa industries that see more men than women are Agriculture, Fishing & Hunting (100.0%), and Manufacturing (100.0%), whereas the industries that tend to have a higher number of women are Finance & Insurance (100.0%), and Health Care & Social Assistance (100.0%).
| Industry | Male | Female |
| Agriculture, Fishing & Hunting | 6 (100.0%) | 0 (0.0%) |
| Mining, Quarrying, & Extraction | 0 (0.0%) | 0 (0.0%) |
| Construction | 0 (0.0%) | 0 (0.0%) |
| Manufacturing | 9 (100.0%) | 0 (0.0%) |
| Wholesale Trade | 0 (0.0%) | 0 (0.0%) |
| Retail Trade | 0 (0.0%) | 0 (0.0%) |
| Transportation & Warehousing | 0 (0.0%) | 0 (0.0%) |
| Utilities | 0 (0.0%) | 0 (0.0%) |
| Information | 0 (0.0%) | 0 (0.0%) |
| Finance & Insurance | 0 (0.0%) | 10 (100.0%) |
| Real Estate, Rental & Leasing | 0 (0.0%) | 0 (0.0%) |
| Professional & Scientific | 0 (0.0%) | 0 (0.0%) |
| Enterprise Management | 0 (0.0%) | 0 (0.0%) |
| Administrative & Support | 0 (0.0%) | 0 (0.0%) |
| Educational Services | 0 (0.0%) | 0 (0.0%) |
| Health Care & Social Assistance | 0 (0.0%) | 5 (100.0%) |
| Arts, Entertainment & Recreation | 0 (0.0%) | 0 (0.0%) |
| Accommodation & Food Services | 0 (0.0%) | 0 (0.0%) |
| Public Administration | 0 (0.0%) | 0 (0.0%) |
| Total | 15 (50.0%) | 15 (50.0%) |
Education in Narcissa
School Enrollment in Narcissa
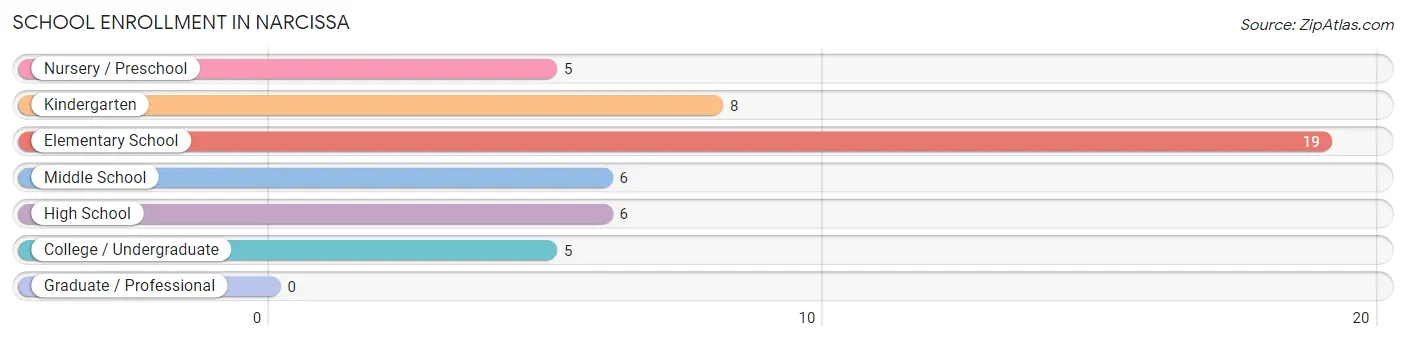
The most common levels of schooling among the 49 students in Narcissa are elementary school (19 | 38.8%), kindergarten (8 | 16.3%), and middle school (6 | 12.2%).
| School Level | # Students | % Students |
| Nursery / Preschool | 5 | 10.2% |
| Kindergarten | 8 | 16.3% |
| Elementary School | 19 | 38.8% |
| Middle School | 6 | 12.2% |
| High School | 6 | 12.2% |
| College / Undergraduate | 5 | 10.2% |
| Graduate / Professional | 0 | 0.0% |
| Total | 49 | 100.0% |
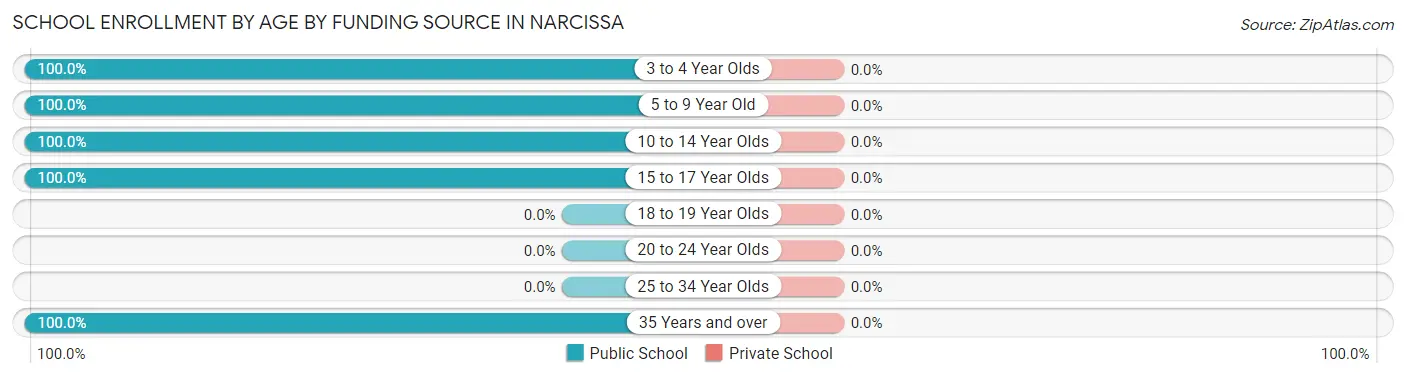
School Enrollment by Age by Funding Source in Narcissa
| Age Bracket | Public School | Private School |
| 3 to 4 Year Olds | 5 (100.0%) | 0 (0.0%) |
| 5 to 9 Year Old | 27 (100.0%) | 0 (0.0%) |
| 10 to 14 Year Olds | 6 (100.0%) | 0 (0.0%) |
| 15 to 17 Year Olds | 6 (100.0%) | 0 (0.0%) |
| 18 to 19 Year Olds | 0 (0.0%) | 0 (0.0%) |
| 20 to 24 Year Olds | 0 (0.0%) | 0 (0.0%) |
| 25 to 34 Year Olds | 0 (0.0%) | 0 (0.0%) |
| 35 Years and over | 5 (100.0%) | 0 (0.0%) |
| Total | 49 (100.0%) | 0 (0.0%) |
Educational Attainment by Field of Study in Narcissa
Social sciences (5 | 55.6%), and science & technology (4 | 44.4%) are the most common fields of study among 9 individuals in Narcissa who have obtained a bachelor's degree or higher.
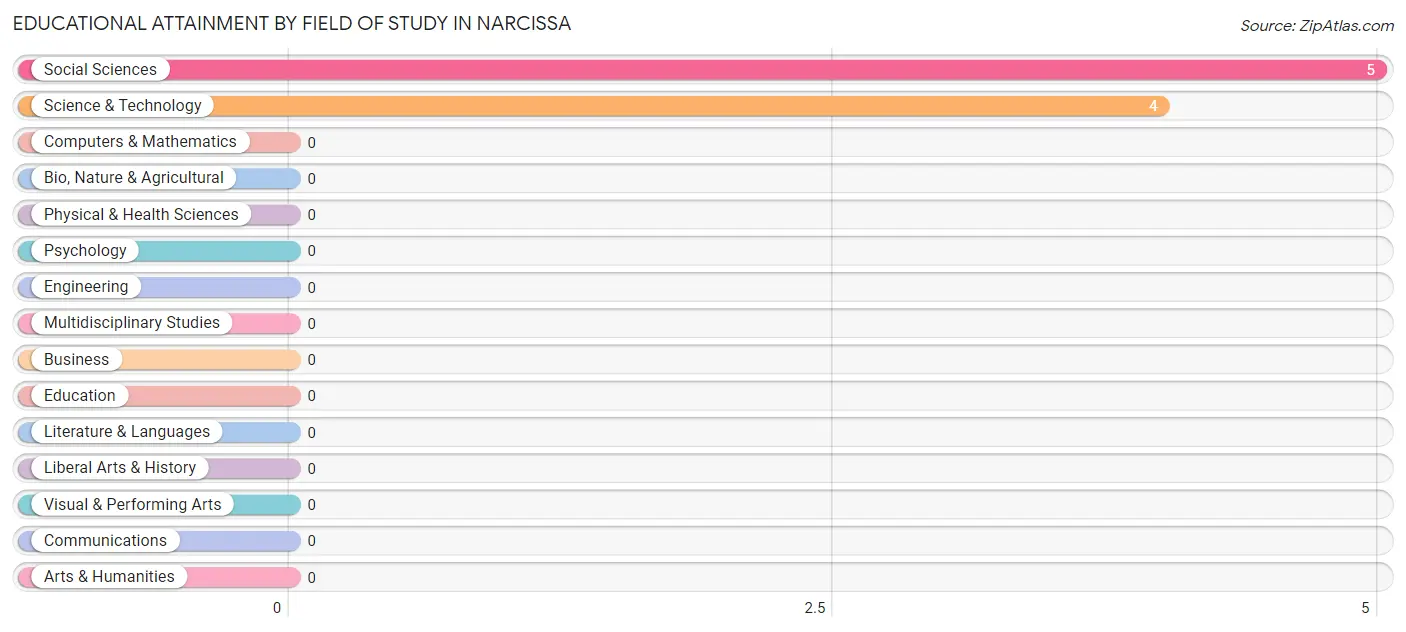
| Field of Study | # Graduates | % Graduates |
| Computers & Mathematics | 0 | 0.0% |
| Bio, Nature & Agricultural | 0 | 0.0% |
| Physical & Health Sciences | 0 | 0.0% |
| Psychology | 0 | 0.0% |
| Social Sciences | 5 | 55.6% |
| Engineering | 0 | 0.0% |
| Multidisciplinary Studies | 0 | 0.0% |
| Science & Technology | 4 | 44.4% |
| Business | 0 | 0.0% |
| Education | 0 | 0.0% |
| Literature & Languages | 0 | 0.0% |
| Liberal Arts & History | 0 | 0.0% |
| Visual & Performing Arts | 0 | 0.0% |
| Communications | 0 | 0.0% |
| Arts & Humanities | 0 | 0.0% |
| Total | 9 | 100.0% |
Transportation & Commute in Narcissa
Vehicle Availability by Sex in Narcissa
The most prevalent vehicle ownership categories in Narcissa are males with 3 vehicles (12, accounting for 80.0%) and females with 3 vehicles (5, making up 80.0%).
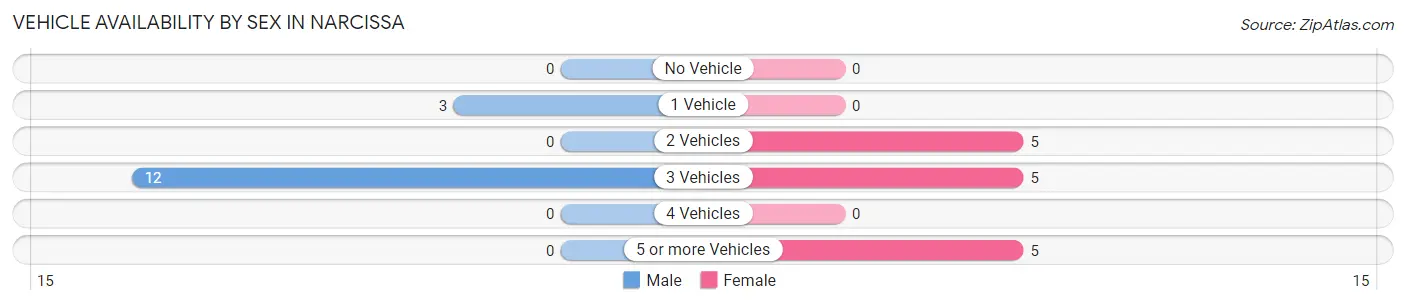
| Vehicles Available | Male | Female |
| No Vehicle | 0 (0.0%) | 0 (0.0%) |
| 1 Vehicle | 3 (20.0%) | 0 (0.0%) |
| 2 Vehicles | 0 (0.0%) | 5 (33.3%) |
| 3 Vehicles | 12 (80.0%) | 5 (33.3%) |
| 4 Vehicles | 0 (0.0%) | 0 (0.0%) |
| 5 or more Vehicles | 0 (0.0%) | 5 (33.3%) |
| Total | 15 (100.0%) | 15 (100.0%) |
Commute Time in Narcissa
The most frequently occuring commute durations in Narcissa are 15 to 19 minutes (19 commuters, 63.3%), less than 5 minutes (6 commuters, 20.0%), and 10 to 14 minutes (5 commuters, 16.7%).
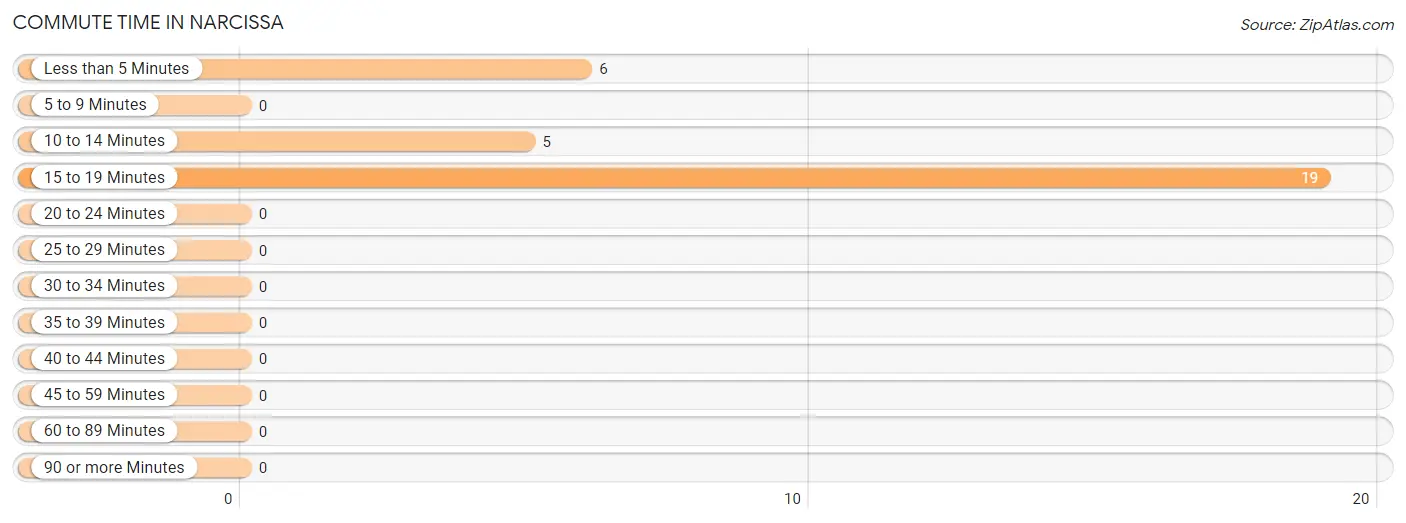
| Commute Time | # Commuters | % Commuters |
| Less than 5 Minutes | 6 | 20.0% |
| 5 to 9 Minutes | 0 | 0.0% |
| 10 to 14 Minutes | 5 | 16.7% |
| 15 to 19 Minutes | 19 | 63.3% |
| 20 to 24 Minutes | 0 | 0.0% |
| 25 to 29 Minutes | 0 | 0.0% |
| 30 to 34 Minutes | 0 | 0.0% |
| 35 to 39 Minutes | 0 | 0.0% |
| 40 to 44 Minutes | 0 | 0.0% |
| 45 to 59 Minutes | 0 | 0.0% |
| 60 to 89 Minutes | 0 | 0.0% |
| 90 or more Minutes | 0 | 0.0% |
Commute Time by Sex in Narcissa
The most common commute times in Narcissa are 15 to 19 minutes (9 commuters, 60.0%) for males and 15 to 19 minutes (10 commuters, 66.7%) for females.
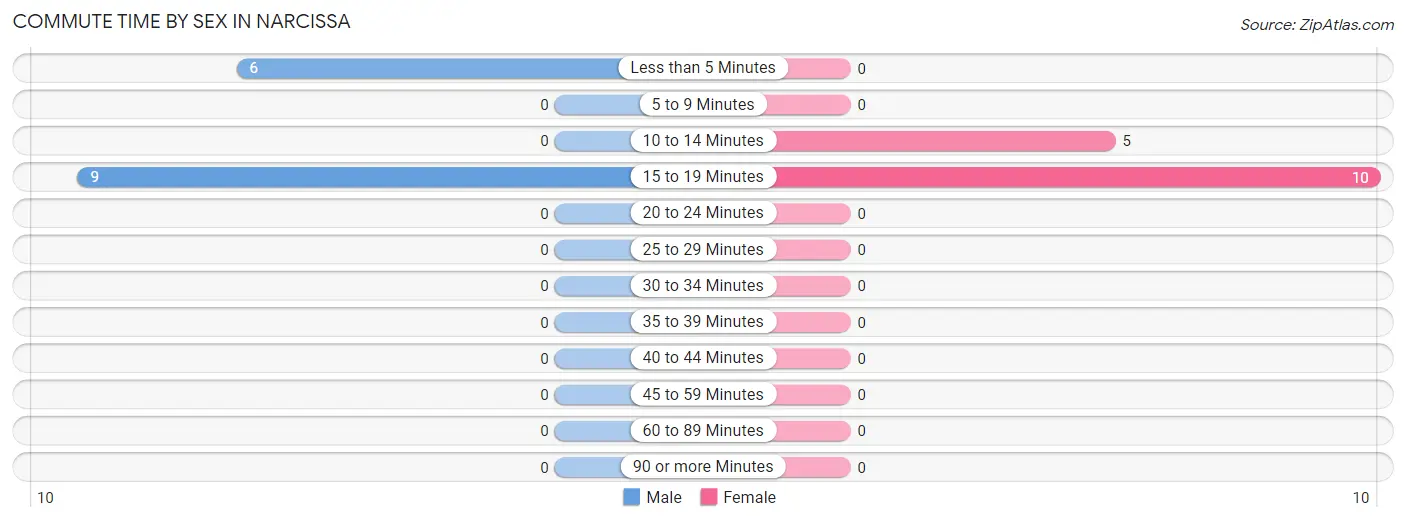
| Commute Time | Male | Female |
| Less than 5 Minutes | 6 (40.0%) | 0 (0.0%) |
| 5 to 9 Minutes | 0 (0.0%) | 0 (0.0%) |
| 10 to 14 Minutes | 0 (0.0%) | 5 (33.3%) |
| 15 to 19 Minutes | 9 (60.0%) | 10 (66.7%) |
| 20 to 24 Minutes | 0 (0.0%) | 0 (0.0%) |
| 25 to 29 Minutes | 0 (0.0%) | 0 (0.0%) |
| 30 to 34 Minutes | 0 (0.0%) | 0 (0.0%) |
| 35 to 39 Minutes | 0 (0.0%) | 0 (0.0%) |
| 40 to 44 Minutes | 0 (0.0%) | 0 (0.0%) |
| 45 to 59 Minutes | 0 (0.0%) | 0 (0.0%) |
| 60 to 89 Minutes | 0 (0.0%) | 0 (0.0%) |
| 90 or more Minutes | 0 (0.0%) | 0 (0.0%) |
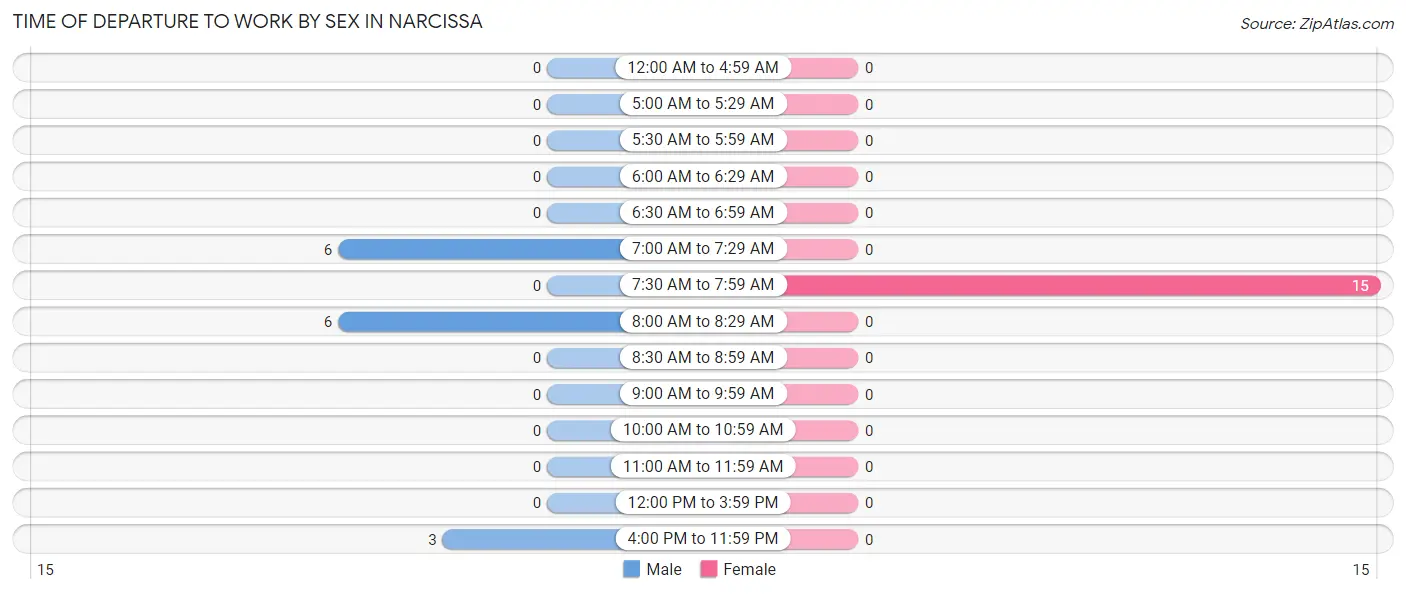
Time of Departure to Work by Sex in Narcissa
The most frequent times of departure to work in Narcissa are 7:00 AM to 7:29 AM (6, 40.0%) for males and 7:30 AM to 7:59 AM (15, 100.0%) for females.
| Time of Departure | Male | Female |
| 12:00 AM to 4:59 AM | 0 (0.0%) | 0 (0.0%) |
| 5:00 AM to 5:29 AM | 0 (0.0%) | 0 (0.0%) |
| 5:30 AM to 5:59 AM | 0 (0.0%) | 0 (0.0%) |
| 6:00 AM to 6:29 AM | 0 (0.0%) | 0 (0.0%) |
| 6:30 AM to 6:59 AM | 0 (0.0%) | 0 (0.0%) |
| 7:00 AM to 7:29 AM | 6 (40.0%) | 0 (0.0%) |
| 7:30 AM to 7:59 AM | 0 (0.0%) | 15 (100.0%) |
| 8:00 AM to 8:29 AM | 6 (40.0%) | 0 (0.0%) |
| 8:30 AM to 8:59 AM | 0 (0.0%) | 0 (0.0%) |
| 9:00 AM to 9:59 AM | 0 (0.0%) | 0 (0.0%) |
| 10:00 AM to 10:59 AM | 0 (0.0%) | 0 (0.0%) |
| 11:00 AM to 11:59 AM | 0 (0.0%) | 0 (0.0%) |
| 12:00 PM to 3:59 PM | 0 (0.0%) | 0 (0.0%) |
| 4:00 PM to 11:59 PM | 3 (20.0%) | 0 (0.0%) |
| Total | 15 (100.0%) | 15 (100.0%) |
Housing Occupancy in Narcissa
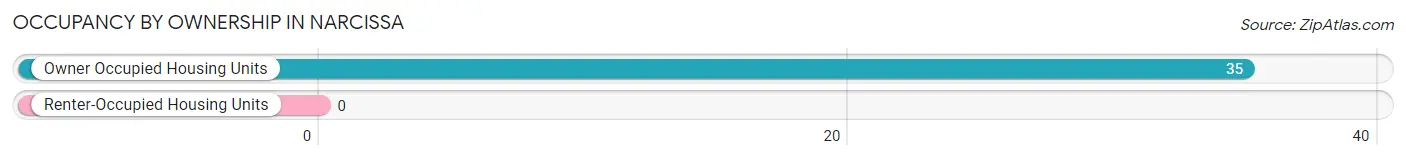
Occupancy by Ownership in Narcissa
Of the total 35 dwellings in Narcissa, owner-occupied units account for 35 (100.0%), while renter-occupied units make up 0 (0.0%).
| Occupancy | # Housing Units | % Housing Units |
| Owner Occupied Housing Units | 35 | 100.0% |
| Renter-Occupied Housing Units | 0 | 0.0% |
| Total Occupied Housing Units | 35 | 100.0% |
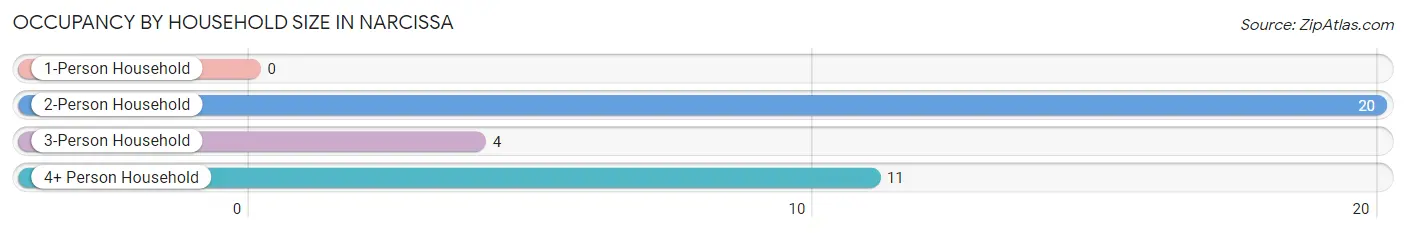
Occupancy by Household Size in Narcissa
| Household Size | # Housing Units | % Housing Units |
| 1-Person Household | 0 | 0.0% |
| 2-Person Household | 20 | 57.1% |
| 3-Person Household | 4 | 11.4% |
| 4+ Person Household | 11 | 31.4% |
| Total Housing Units | 35 | 100.0% |
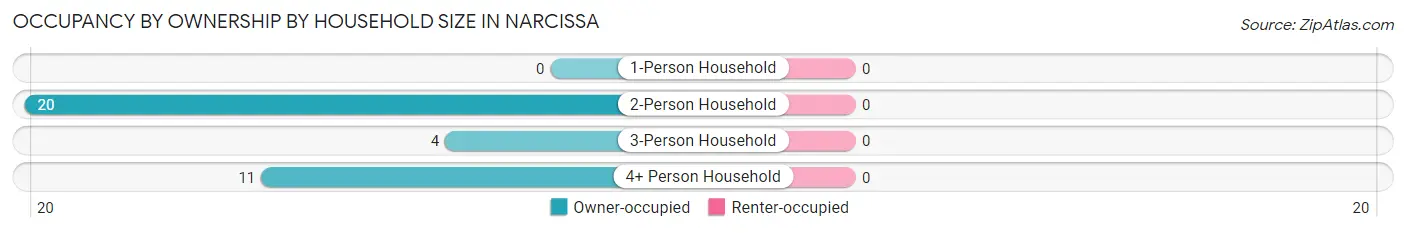
Occupancy by Ownership by Household Size in Narcissa
| Household Size | Owner-occupied | Renter-occupied |
| 1-Person Household | 0 (0.0%) | 0 (0.0%) |
| 2-Person Household | 20 (100.0%) | 0 (0.0%) |
| 3-Person Household | 4 (100.0%) | 0 (0.0%) |
| 4+ Person Household | 11 (100.0%) | 0 (0.0%) |
| Total Housing Units | 35 (100.0%) | 0 (0.0%) |
Occupancy by Educational Attainment in Narcissa
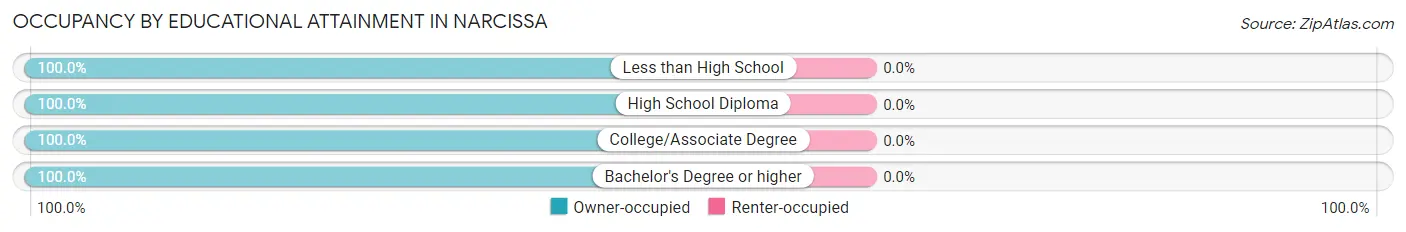
| Household Size | Owner-occupied | Renter-occupied |
| Less than High School | 6 (100.0%) | 0 (0.0%) |
| High School Diploma | 18 (100.0%) | 0 (0.0%) |
| College/Associate Degree | 6 (100.0%) | 0 (0.0%) |
| Bachelor's Degree or higher | 5 (100.0%) | 0 (0.0%) |
Occupancy by Age of Householder in Narcissa
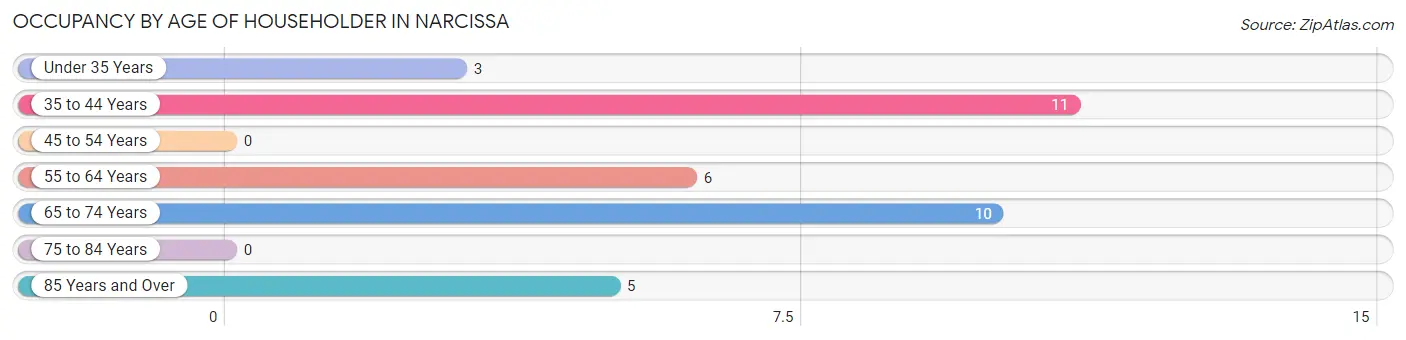
| Age Bracket | # Households | % Households |
| Under 35 Years | 3 | 8.6% |
| 35 to 44 Years | 11 | 31.4% |
| 45 to 54 Years | 0 | 0.0% |
| 55 to 64 Years | 6 | 17.1% |
| 65 to 74 Years | 10 | 28.6% |
| 75 to 84 Years | 0 | 0.0% |
| 85 Years and Over | 5 | 14.3% |
| Total | 35 | 100.0% |
Housing Finances in Narcissa
Median Income by Occupancy in Narcissa
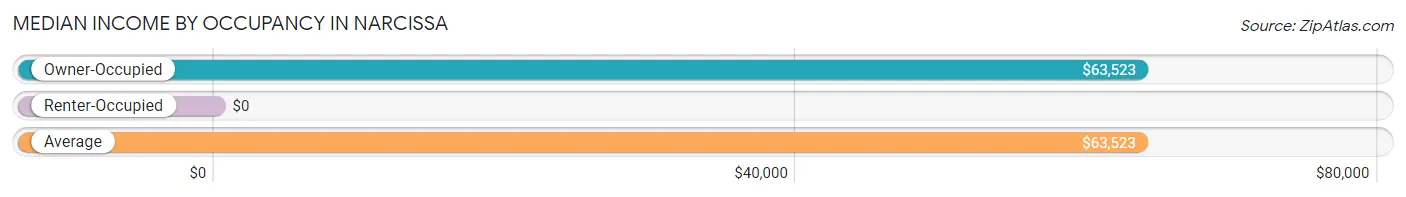
| Occupancy Type | # Households | Median Income |
| Owner-Occupied | 35 (100.0%) | $63,523 |
| Renter-Occupied | 0 (0.0%) | $0 |
| Average | 35 (100.0%) | $63,523 |
Occupancy by Householder Income Bracket in Narcissa
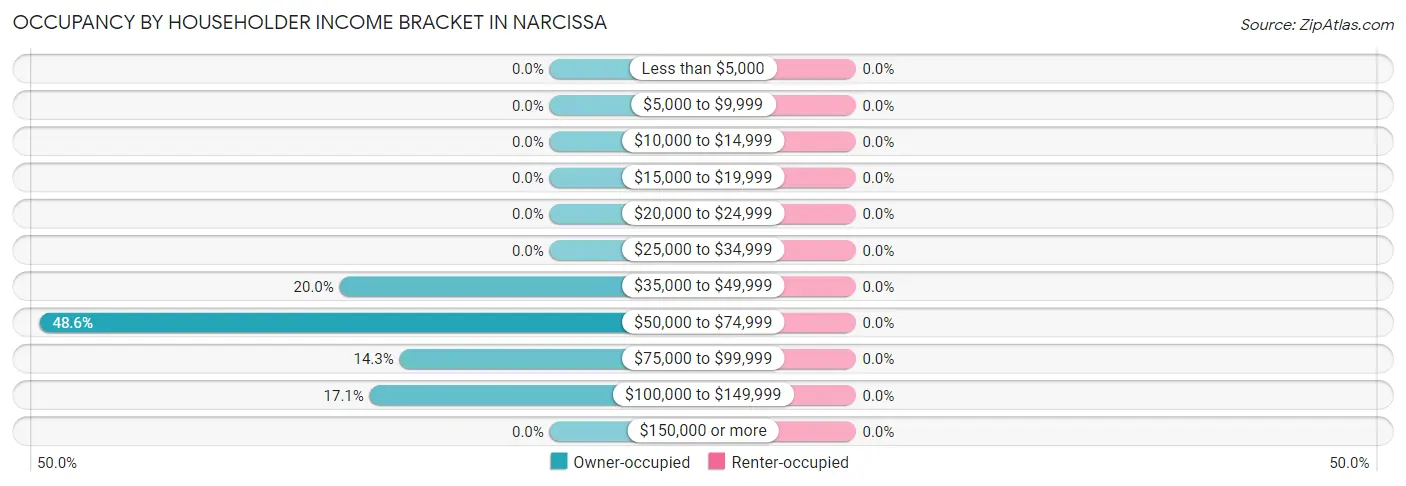
| Income Bracket | Owner-occupied | Renter-occupied |
| Less than $5,000 | 0 (0.0%) | 0 (0.0%) |
| $5,000 to $9,999 | 0 (0.0%) | 0 (0.0%) |
| $10,000 to $14,999 | 0 (0.0%) | 0 (0.0%) |
| $15,000 to $19,999 | 0 (0.0%) | 0 (0.0%) |
| $20,000 to $24,999 | 0 (0.0%) | 0 (0.0%) |
| $25,000 to $34,999 | 0 (0.0%) | 0 (0.0%) |
| $35,000 to $49,999 | 7 (20.0%) | 0 (0.0%) |
| $50,000 to $74,999 | 17 (48.6%) | 0 (0.0%) |
| $75,000 to $99,999 | 5 (14.3%) | 0 (0.0%) |
| $100,000 to $149,999 | 6 (17.1%) | 0 (0.0%) |
| $150,000 or more | 0 (0.0%) | 0 (0.0%) |
| Total | 35 (100.0%) | 0 (0.0%) |
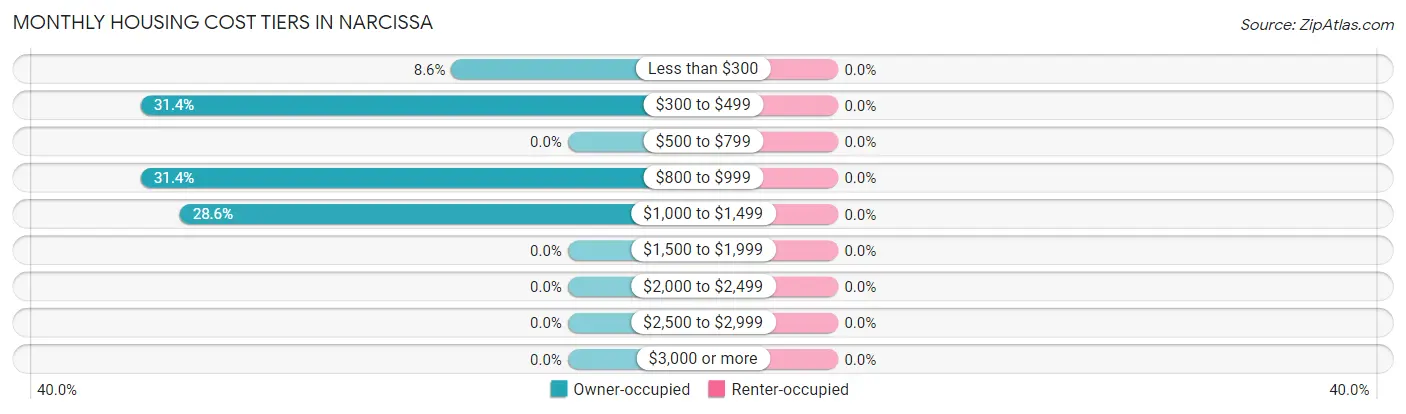
Monthly Housing Cost Tiers in Narcissa
| Monthly Cost | Owner-occupied | Renter-occupied |
| Less than $300 | 3 (8.6%) | 0 (0.0%) |
| $300 to $499 | 11 (31.4%) | 0 (0.0%) |
| $500 to $799 | 0 (0.0%) | 0 (0.0%) |
| $800 to $999 | 11 (31.4%) | 0 (0.0%) |
| $1,000 to $1,499 | 10 (28.6%) | 0 (0.0%) |
| $1,500 to $1,999 | 0 (0.0%) | 0 (0.0%) |
| $2,000 to $2,499 | 0 (0.0%) | 0 (0.0%) |
| $2,500 to $2,999 | 0 (0.0%) | 0 (0.0%) |
| $3,000 or more | 0 (0.0%) | 0 (0.0%) |
| Total | 35 (100.0%) | 0 (0.0%) |
Physical Housing Characteristics in Narcissa
Housing Structures in Narcissa
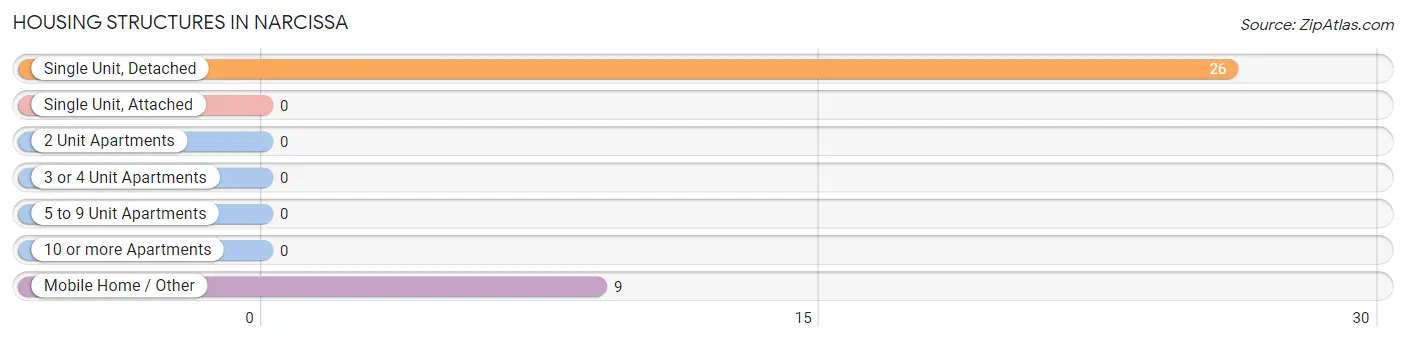
| Structure Type | # Housing Units | % Housing Units |
| Single Unit, Detached | 26 | 74.3% |
| Single Unit, Attached | 0 | 0.0% |
| 2 Unit Apartments | 0 | 0.0% |
| 3 or 4 Unit Apartments | 0 | 0.0% |
| 5 to 9 Unit Apartments | 0 | 0.0% |
| 10 or more Apartments | 0 | 0.0% |
| Mobile Home / Other | 9 | 25.7% |
| Total | 35 | 100.0% |
Housing Structures by Occupancy in Narcissa
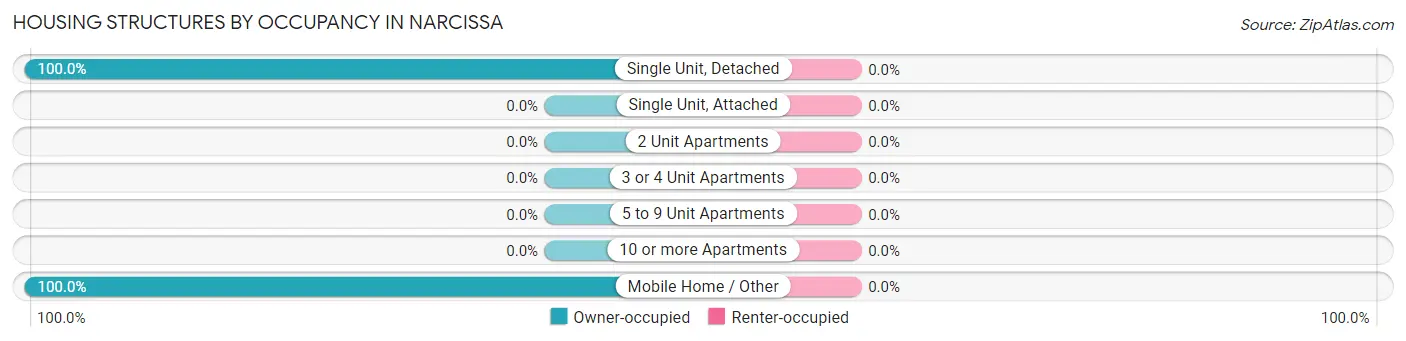
| Structure Type | Owner-occupied | Renter-occupied |
| Single Unit, Detached | 26 (100.0%) | 0 (0.0%) |
| Single Unit, Attached | 0 (0.0%) | 0 (0.0%) |
| 2 Unit Apartments | 0 (0.0%) | 0 (0.0%) |
| 3 or 4 Unit Apartments | 0 (0.0%) | 0 (0.0%) |
| 5 to 9 Unit Apartments | 0 (0.0%) | 0 (0.0%) |
| 10 or more Apartments | 0 (0.0%) | 0 (0.0%) |
| Mobile Home / Other | 9 (100.0%) | 0 (0.0%) |
| Total | 35 (100.0%) | 0 (0.0%) |
Housing Structures by Number of Rooms in Narcissa
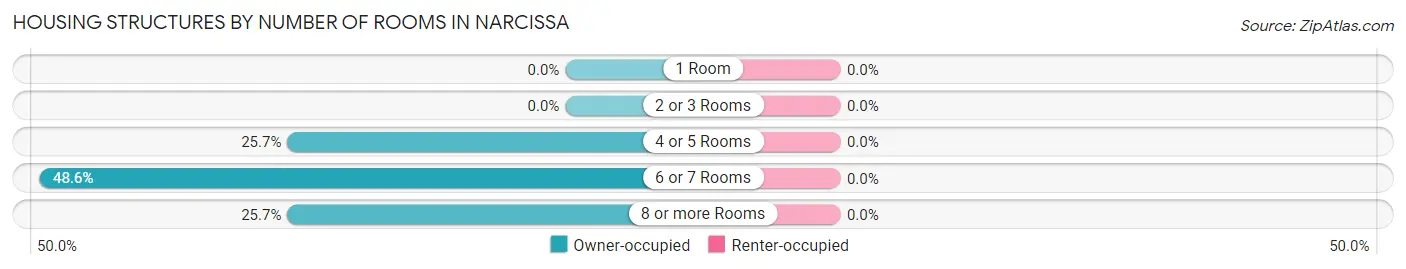
| Number of Rooms | Owner-occupied | Renter-occupied |
| 1 Room | 0 (0.0%) | 0 (0.0%) |
| 2 or 3 Rooms | 0 (0.0%) | 0 (0.0%) |
| 4 or 5 Rooms | 9 (25.7%) | 0 (0.0%) |
| 6 or 7 Rooms | 17 (48.6%) | 0 (0.0%) |
| 8 or more Rooms | 9 (25.7%) | 0 (0.0%) |
| Total | 35 (100.0%) | 0 (0.0%) |
Housing Structure by Heating Type in Narcissa
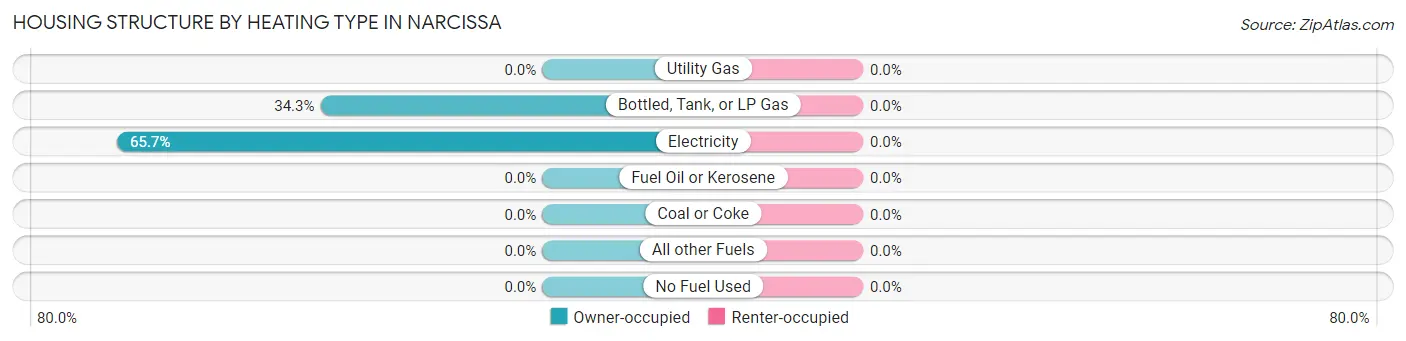
| Heating Type | Owner-occupied | Renter-occupied |
| Utility Gas | 0 (0.0%) | 0 (0.0%) |
| Bottled, Tank, or LP Gas | 12 (34.3%) | 0 (0.0%) |
| Electricity | 23 (65.7%) | 0 (0.0%) |
| Fuel Oil or Kerosene | 0 (0.0%) | 0 (0.0%) |
| Coal or Coke | 0 (0.0%) | 0 (0.0%) |
| All other Fuels | 0 (0.0%) | 0 (0.0%) |
| No Fuel Used | 0 (0.0%) | 0 (0.0%) |
| Total | 35 (100.0%) | 0 (0.0%) |
Household Vehicle Usage in Narcissa
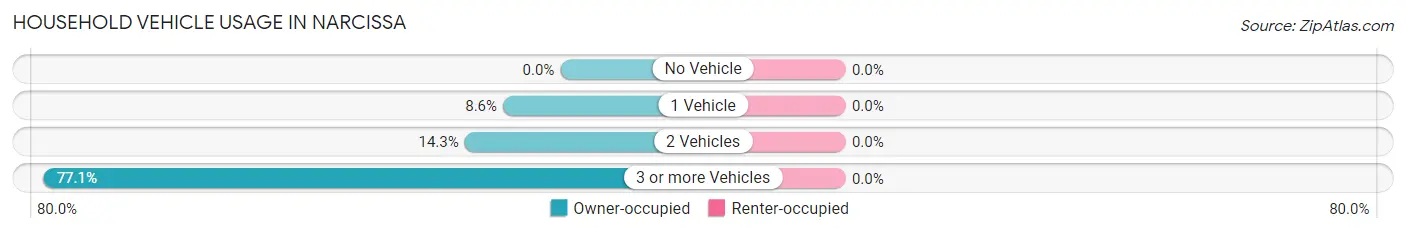
| Vehicles per Household | Owner-occupied | Renter-occupied |
| No Vehicle | 0 (0.0%) | 0 (0.0%) |
| 1 Vehicle | 3 (8.6%) | 0 (0.0%) |
| 2 Vehicles | 5 (14.3%) | 0 (0.0%) |
| 3 or more Vehicles | 27 (77.1%) | 0 (0.0%) |
| Total | 35 (100.0%) | 0 (0.0%) |
Real Estate & Mortgages in Narcissa
Real Estate and Mortgage Overview in Narcissa
| Characteristic | Without Mortgage | With Mortgage |
| Housing Units | 18 | 17 |
| Median Property Value | $181,300 | $135,400 |
| Median Household Income | - | - |
| Monthly Housing Costs | $327 | $0 |
| Real Estate Taxes | $509 | $6 |
Property Value by Mortgage Status in Narcissa
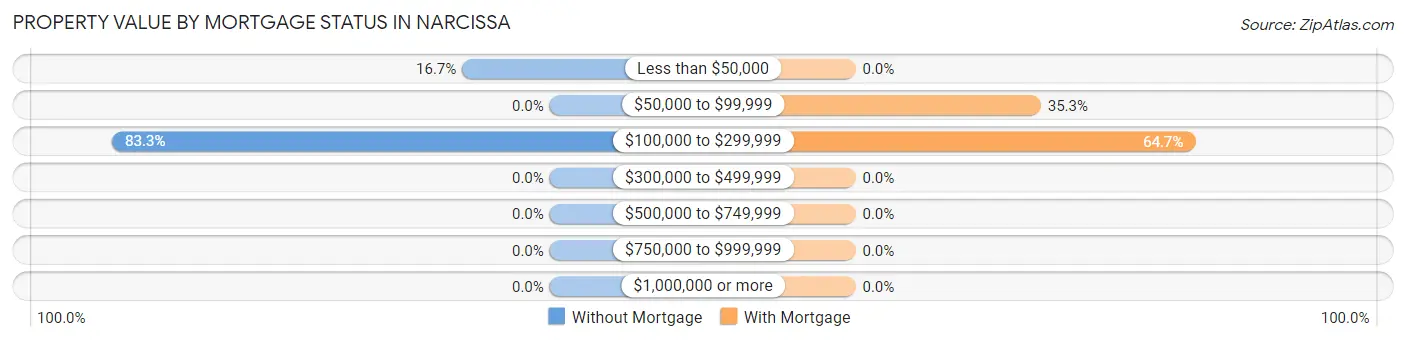
| Property Value | Without Mortgage | With Mortgage |
| Less than $50,000 | 3 (16.7%) | 0 (0.0%) |
| $50,000 to $99,999 | 0 (0.0%) | 6 (35.3%) |
| $100,000 to $299,999 | 15 (83.3%) | 11 (64.7%) |
| $300,000 to $499,999 | 0 (0.0%) | 0 (0.0%) |
| $500,000 to $749,999 | 0 (0.0%) | 0 (0.0%) |
| $750,000 to $999,999 | 0 (0.0%) | 0 (0.0%) |
| $1,000,000 or more | 0 (0.0%) | 0 (0.0%) |
| Total | 18 (100.0%) | 17 (100.0%) |
Household Income by Mortgage Status in Narcissa
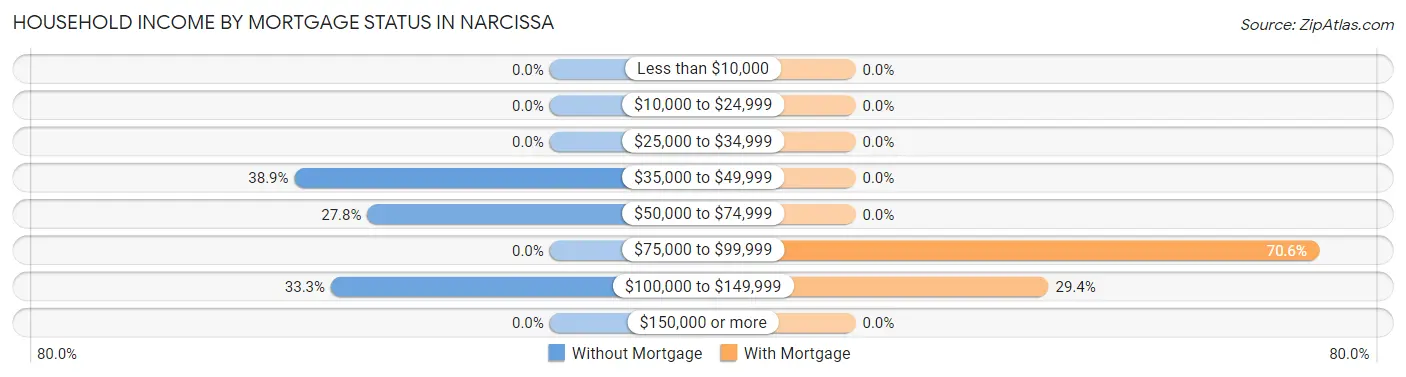
| Household Income | Without Mortgage | With Mortgage |
| Less than $10,000 | 0 (0.0%) | 0 (0.0%) |
| $10,000 to $24,999 | 0 (0.0%) | 0 (0.0%) |
| $25,000 to $34,999 | 0 (0.0%) | 0 (0.0%) |
| $35,000 to $49,999 | 7 (38.9%) | 0 (0.0%) |
| $50,000 to $74,999 | 5 (27.8%) | 0 (0.0%) |
| $75,000 to $99,999 | 0 (0.0%) | 12 (70.6%) |
| $100,000 to $149,999 | 6 (33.3%) | 5 (29.4%) |
| $150,000 or more | 0 (0.0%) | 0 (0.0%) |
| Total | 18 (100.0%) | 17 (100.0%) |
Property Value to Household Income Ratio in Narcissa
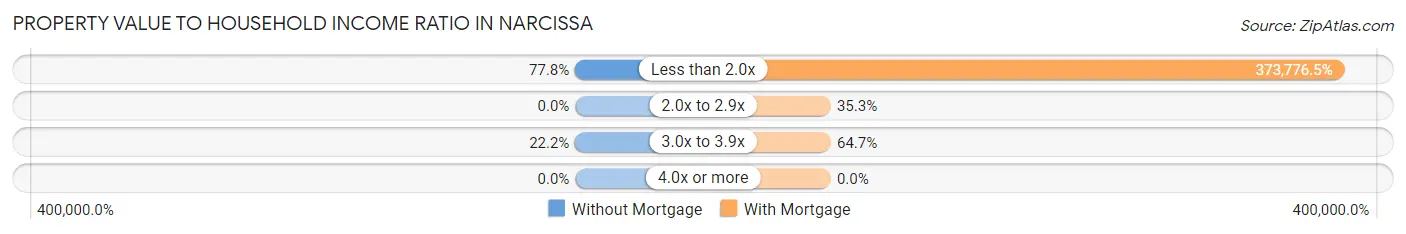
| Value-to-Income Ratio | Without Mortgage | With Mortgage |
| Less than 2.0x | 14 (77.8%) | 63,542 (373,776.5%) |
| 2.0x to 2.9x | 0 (0.0%) | 6 (35.3%) |
| 3.0x to 3.9x | 4 (22.2%) | 11 (64.7%) |
| 4.0x or more | 0 (0.0%) | 0 (0.0%) |
| Total | 18 (100.0%) | 17 (100.0%) |
Real Estate Taxes by Mortgage Status in Narcissa
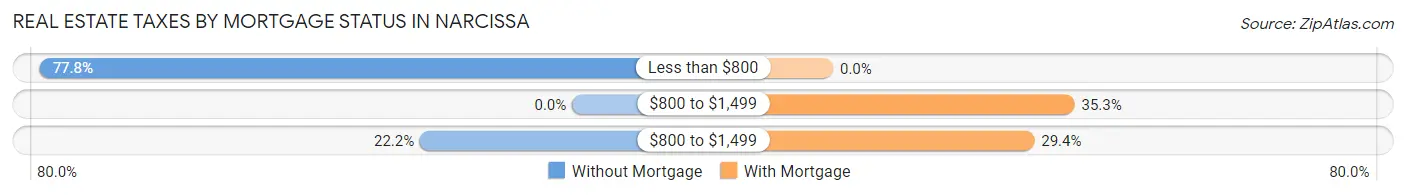
| Property Taxes | Without Mortgage | With Mortgage |
| Less than $800 | 14 (77.8%) | 0 (0.0%) |
| $800 to $1,499 | 0 (0.0%) | 6 (35.3%) |
| $800 to $1,499 | 4 (22.2%) | 5 (29.4%) |
| Total | 18 (100.0%) | 17 (100.0%) |
Health & Disability in Narcissa
Health Insurance Coverage by Age in Narcissa
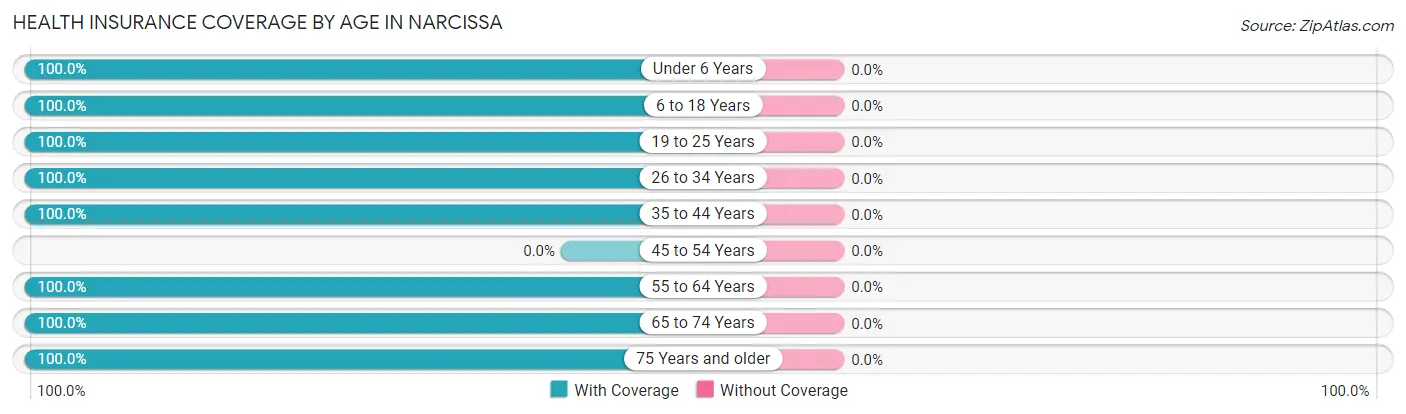
| Age Bracket | With Coverage | Without Coverage |
| Under 6 Years | 11 (100.0%) | 0 (0.0%) |
| 6 to 18 Years | 39 (100.0%) | 0 (0.0%) |
| 19 to 25 Years | 3 (100.0%) | 0 (0.0%) |
| 26 to 34 Years | 5 (100.0%) | 0 (0.0%) |
| 35 to 44 Years | 17 (100.0%) | 0 (0.0%) |
| 45 to 54 Years | 0 (0.0%) | 0 (0.0%) |
| 55 to 64 Years | 16 (100.0%) | 0 (0.0%) |
| 65 to 74 Years | 15 (100.0%) | 0 (0.0%) |
| 75 Years and older | 5 (100.0%) | 0 (0.0%) |
| Total | 111 (100.0%) | 0 (0.0%) |
Health Insurance Coverage by Citizenship Status in Narcissa
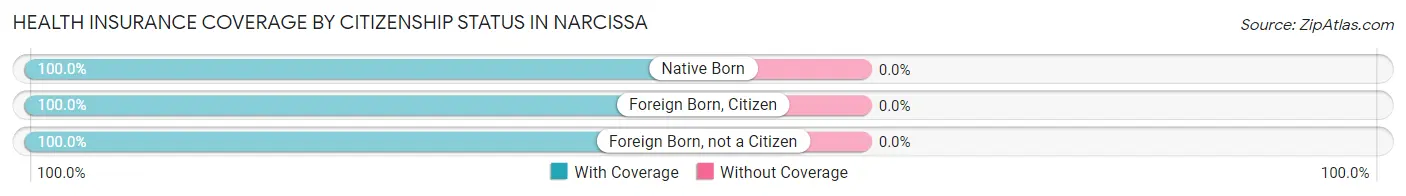
| Citizenship Status | With Coverage | Without Coverage |
| Native Born | 11 (100.0%) | 0 (0.0%) |
| Foreign Born, Citizen | 39 (100.0%) | 0 (0.0%) |
| Foreign Born, not a Citizen | 3 (100.0%) | 0 (0.0%) |
Health Insurance Coverage by Household Income in Narcissa
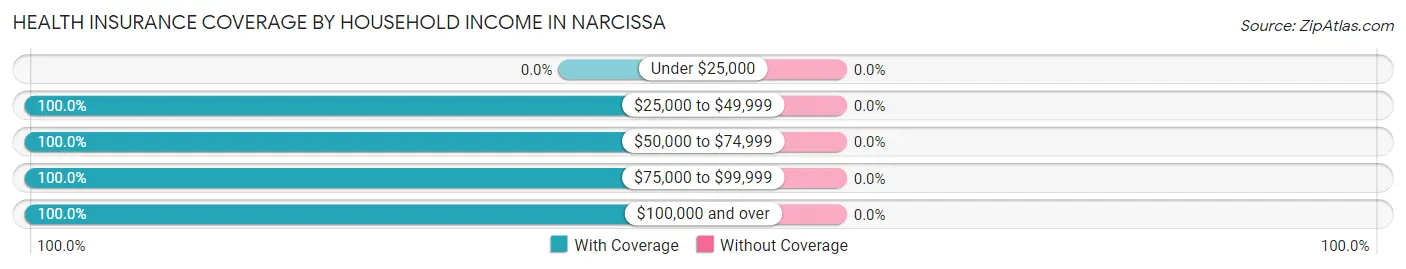
| Household Income | With Coverage | Without Coverage |
| Under $25,000 | 0 (0.0%) | 0 (0.0%) |
| $25,000 to $49,999 | 22 (100.0%) | 0 (0.0%) |
| $50,000 to $74,999 | 28 (100.0%) | 0 (0.0%) |
| $75,000 to $99,999 | 33 (100.0%) | 0 (0.0%) |
| $100,000 and over | 28 (100.0%) | 0 (0.0%) |
Public vs Private Health Insurance Coverage by Age in Narcissa
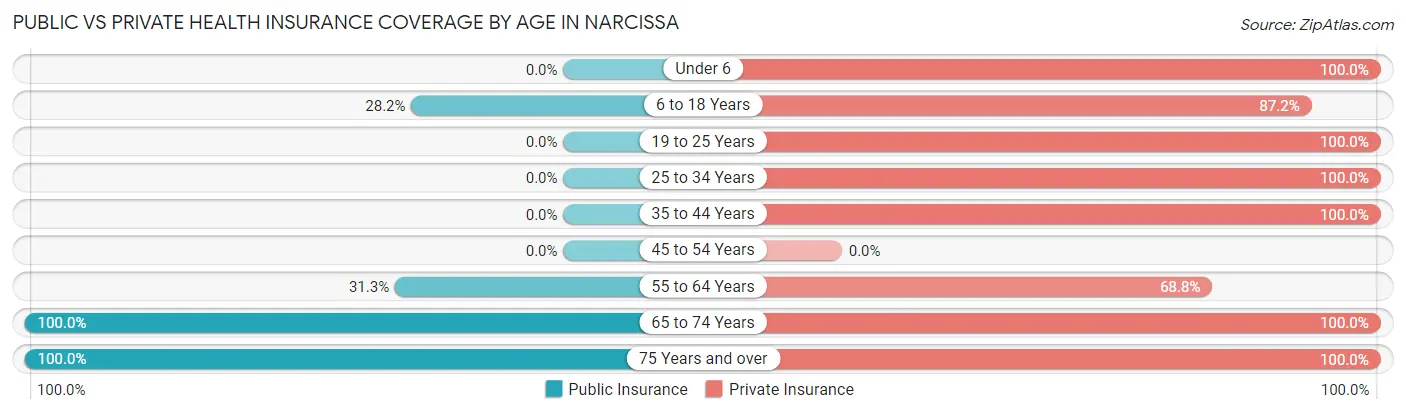
| Age Bracket | Public Insurance | Private Insurance |
| Under 6 | 0 (0.0%) | 11 (100.0%) |
| 6 to 18 Years | 11 (28.2%) | 34 (87.2%) |
| 19 to 25 Years | 0 (0.0%) | 3 (100.0%) |
| 25 to 34 Years | 0 (0.0%) | 5 (100.0%) |
| 35 to 44 Years | 0 (0.0%) | 17 (100.0%) |
| 45 to 54 Years | 0 (0.0%) | 0 (0.0%) |
| 55 to 64 Years | 5 (31.2%) | 11 (68.8%) |
| 65 to 74 Years | 15 (100.0%) | 15 (100.0%) |
| 75 Years and over | 5 (100.0%) | 5 (100.0%) |
| Total | 36 (32.4%) | 101 (91.0%) |
Disability Status by Sex by Age in Narcissa
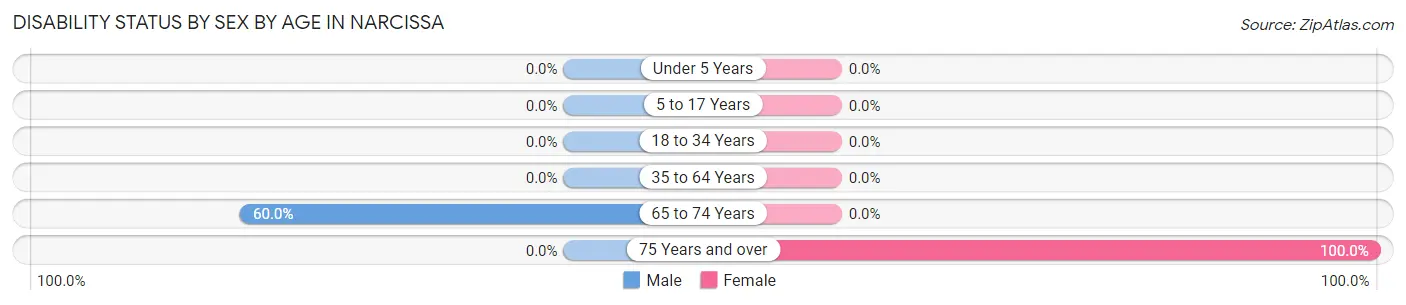
| Age Bracket | Male | Female |
| Under 5 Years | 0 (0.0%) | 0 (0.0%) |
| 5 to 17 Years | 0 (0.0%) | 0 (0.0%) |
| 18 to 34 Years | 0 (0.0%) | 0 (0.0%) |
| 35 to 64 Years | 0 (0.0%) | 0 (0.0%) |
| 65 to 74 Years | 6 (60.0%) | 0 (0.0%) |
| 75 Years and over | 0 (0.0%) | 5 (100.0%) |
Disability Class by Sex by Age in Narcissa
Disability Class: Hearing Difficulty
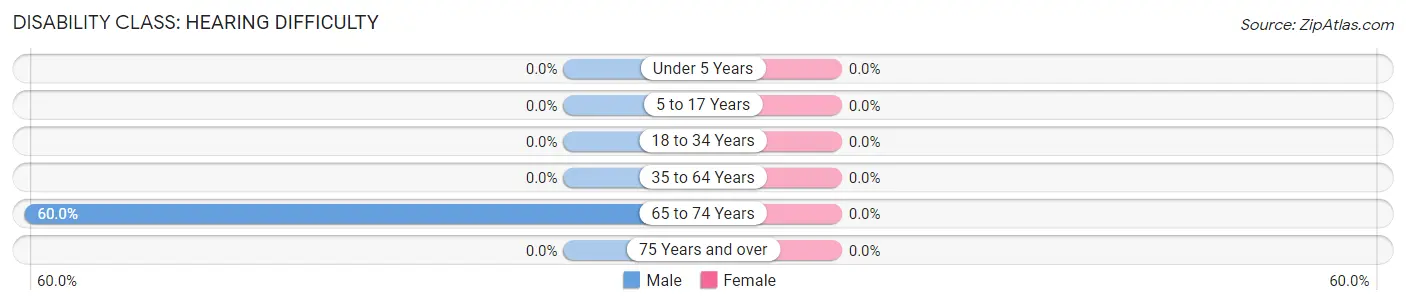
| Age Bracket | Male | Female |
| Under 5 Years | 0 (0.0%) | 0 (0.0%) |
| 5 to 17 Years | 0 (0.0%) | 0 (0.0%) |
| 18 to 34 Years | 0 (0.0%) | 0 (0.0%) |
| 35 to 64 Years | 0 (0.0%) | 0 (0.0%) |
| 65 to 74 Years | 6 (60.0%) | 0 (0.0%) |
| 75 Years and over | 0 (0.0%) | 0 (0.0%) |
Disability Class: Vision Difficulty

| Age Bracket | Male | Female |
| Under 5 Years | 0 (0.0%) | 0 (0.0%) |
| 5 to 17 Years | 0 (0.0%) | 0 (0.0%) |
| 18 to 34 Years | 0 (0.0%) | 0 (0.0%) |
| 35 to 64 Years | 0 (0.0%) | 0 (0.0%) |
| 65 to 74 Years | 6 (60.0%) | 0 (0.0%) |
| 75 Years and over | 0 (0.0%) | 0 (0.0%) |
Disability Class: Cognitive Difficulty
| Age Bracket | Male | Female |
| 5 to 17 Years | 0 (0.0%) | 0 (0.0%) |
| 18 to 34 Years | 0 (0.0%) | 0 (0.0%) |
| 35 to 64 Years | 0 (0.0%) | 0 (0.0%) |
| 65 to 74 Years | 0 (0.0%) | 0 (0.0%) |
| 75 Years and over | 0 (0.0%) | 0 (0.0%) |
Disability Class: Ambulatory Difficulty
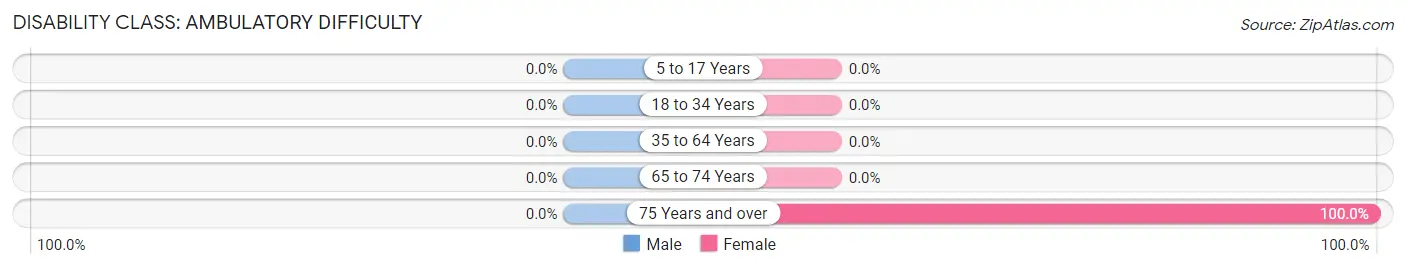
| Age Bracket | Male | Female |
| 5 to 17 Years | 0 (0.0%) | 0 (0.0%) |
| 18 to 34 Years | 0 (0.0%) | 0 (0.0%) |
| 35 to 64 Years | 0 (0.0%) | 0 (0.0%) |
| 65 to 74 Years | 0 (0.0%) | 0 (0.0%) |
| 75 Years and over | 0 (0.0%) | 5 (100.0%) |
Disability Class: Self-Care Difficulty
| Age Bracket | Male | Female |
| 5 to 17 Years | 0 (0.0%) | 0 (0.0%) |
| 18 to 34 Years | 0 (0.0%) | 0 (0.0%) |
| 35 to 64 Years | 0 (0.0%) | 0 (0.0%) |
| 65 to 74 Years | 0 (0.0%) | 0 (0.0%) |
| 75 Years and over | 0 (0.0%) | 0 (0.0%) |
Technology Access in Narcissa
Computing Device Access in Narcissa
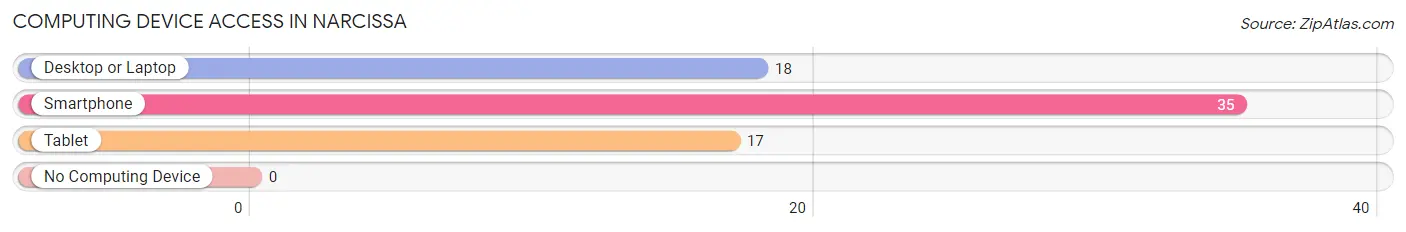
| Device Type | # Households | % Households |
| Desktop or Laptop | 18 | 51.4% |
| Smartphone | 35 | 100.0% |
| Tablet | 17 | 48.6% |
| No Computing Device | 0 | 0.0% |
| Total | 35 | 100.0% |
Internet Access in Narcissa
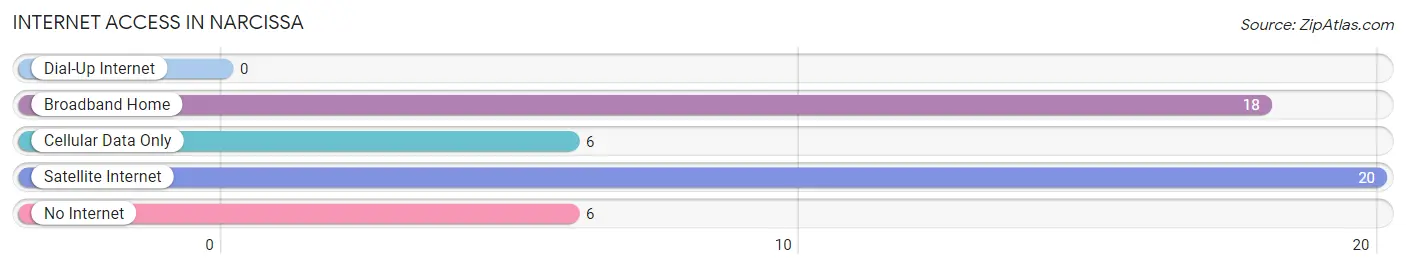
| Internet Type | # Households | % Households |
| Dial-Up Internet | 0 | 0.0% |
| Broadband Home | 18 | 51.4% |
| Cellular Data Only | 6 | 17.1% |
| Satellite Internet | 20 | 57.1% |
| No Internet | 6 | 17.1% |
| Total | 35 | 100.0% |
Narcissa Summary
Narcissa is a small unincorporated community located in Craig County, Oklahoma. It is situated in the foothills of the Ozark Mountains, approximately 10 miles south of Vinita. The town was founded in 1891 and named after Narcissa, the daughter of a local rancher.
History
Narcissa was founded in 1891 by rancher William H. Smith and his daughter Narcissa. Smith had purchased the land from the Cherokee Nation in 1887 and began to develop it for ranching. The town was named after his daughter and was the first settlement in Craig County.
In the early 1900s, Narcissa began to grow as a trading center for the surrounding area. The town had a post office, a general store, a blacksmith shop, a hotel, and a school. The school was established in 1902 and was the first school in the county.
In the 1920s, Narcissa experienced a period of growth as the oil industry began to develop in the area. The town was home to several oil wells and a refinery. The refinery was built in 1923 and was the first in the county.
Geography
Narcissa is located in the foothills of the Ozark Mountains in Craig County, Oklahoma. It is situated approximately 10 miles south of Vinita and is bordered by the towns of Big Cabin and White Oak. The town is located at an elevation of 890 feet and has a total area of 0.3 square miles.
The climate in Narcissa is characterized by hot, humid summers and mild winters. The average annual temperature is 63°F and the average annual precipitation is 40 inches.
Economy
The economy of Narcissa is largely based on agriculture and oil production. The town is home to several farms and ranches that produce cattle, hay, and other crops. The oil industry is also an important part of the local economy. The town is home to several oil wells and a refinery.
Demographics
As of the 2010 census, the population of Narcissa was 545. The racial makeup of the town was 95.3% White, 0.7% Native American, 0.2% Asian, 0.2% from other races, and 3.6% from two or more races. The median household income was $35,000 and the median family income was $41,000. The per capita income was $17,000.
Common Questions
What is Per Capita Income in Narcissa?
Per Capita income in Narcissa is $23,732.
What is the Median Family Income in Narcissa?
Median Family Income in Narcissa is $64,545.
What is the Median Household income in Narcissa?
Median Household Income in Narcissa is $63,523.
What is Income or Wage Gap in Narcissa?
Income or Wage Gap in Narcissa is 5.7%.
Women in Narcissa earn 94.3 cents for every dollar earned by a man.
What is Inequality or Gini Index in Narcissa?
Inequality or Gini Index in Narcissa is 0.23.
What is the Total Population of Narcissa?
Total Population of Narcissa is 111.
What is the Total Male Population of Narcissa?
Total Male Population of Narcissa is 50.
What is the Total Female Population of Narcissa?
Total Female Population of Narcissa is 61.
What is the Ratio of Males per 100 Females in Narcissa?
There are 81.97 Males per 100 Females in Narcissa.
What is the Ratio of Females per 100 Males in Narcissa?
There are 122.00 Females per 100 Males in Narcissa.
What is the Median Population Age in Narcissa?
Median Population Age in Narcissa is 33.5 Years.
What is the Average Family Size in Narcissa
Average Family Size in Narcissa is 3.5 People.
What is the Average Household Size in Narcissa
Average Household Size in Narcissa is 3.2 People.
How Large is the Labor Force in Narcissa?
There are 30 People in the Labor Forcein in Narcissa.
What is the Percentage of People in the Labor Force in Narcissa?
44.8% of People are in the Labor Force in Narcissa.