Dripping Springs, OK Map & Demographics
Dripping Springs Map
Dripping Springs Overview
$22,346
PER CAPITA INCOME
$92,500
AVG HOUSEHOLD INCOME
0.15
INEQUALITY / GINI INDEX
46
TOTAL POPULATION
18
MALE POPULATION
28
FEMALE POPULATION
64.29
MALES / 100 FEMALES
155.56
FEMALES / 100 MALES
29.8
MEDIAN AGE
3.3
AVG FAMILY SIZE
3.8
AVG HOUSEHOLD SIZE
25
LABOR FORCE [ PEOPLE ]
83.3%
PERCENT IN LABOR FORCE
8.0%
UNEMPLOYMENT RATE
Income in Dripping Springs
Income Overview in Dripping Springs
| Characteristic | Number | Measure |
| Per Capita Income | 46 | $22,346 |
| Median Family Income | 12 | $0 |
| Mean Family Income | 12 | $34,717 |
| Median Household Income | 12 | $92,500 |
| Mean Household Income | 12 | $82,900 |
| Income Deficit | 12 | $0 |
| Wage / Income Gap (%) | 46 | 0.00% |
| Wage / Income Gap ($) | 46 | 100.00¢ per $1 |
| Gini / Inequality Index | 46 | 0.15 |
Earnings by Sex in Dripping Springs
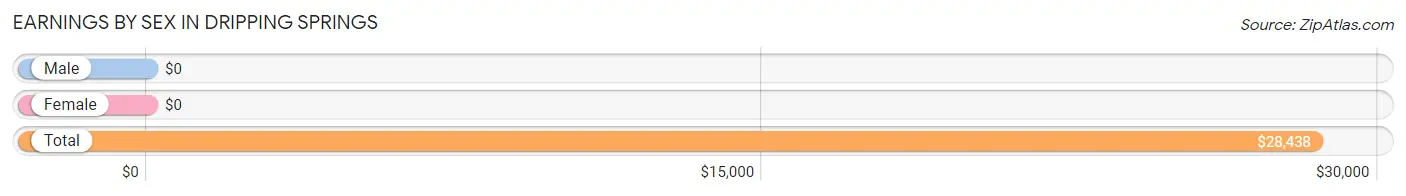
| Sex | Number | Average Earnings |
| Male | 16 (64.0%) | $0 |
| Female | 9 (36.0%) | $0 |
| Total | 25 (100.0%) | $28,438 |
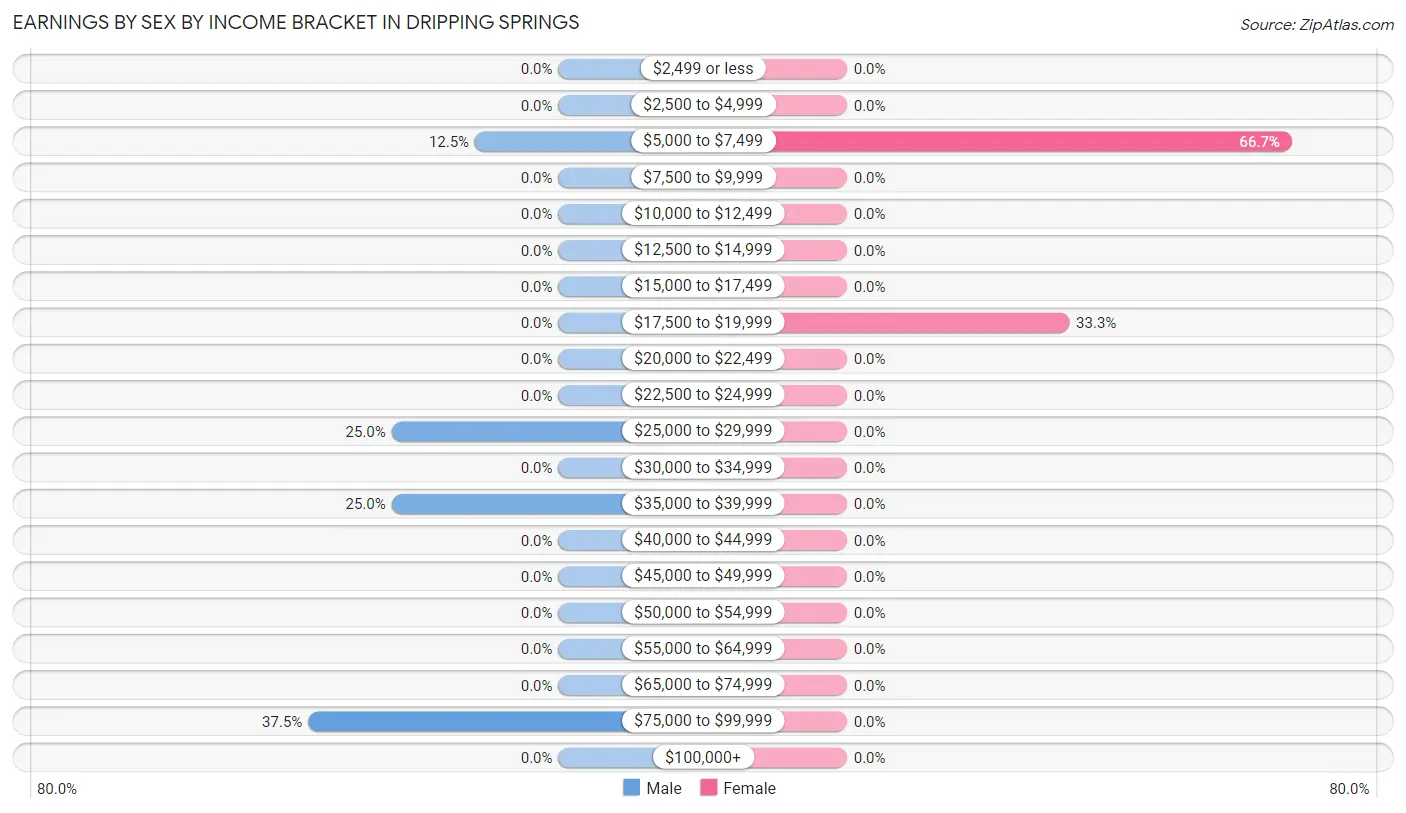
Earnings by Sex by Income Bracket in Dripping Springs
The most common earnings brackets in Dripping Springs are $75,000 to $99,999 for men (6 | 37.5%) and $5,000 to $7,499 for women (6 | 66.7%).
| Income | Male | Female |
| $2,499 or less | 0 (0.0%) | 0 (0.0%) |
| $2,500 to $4,999 | 0 (0.0%) | 0 (0.0%) |
| $5,000 to $7,499 | 2 (12.5%) | 6 (66.7%) |
| $7,500 to $9,999 | 0 (0.0%) | 0 (0.0%) |
| $10,000 to $12,499 | 0 (0.0%) | 0 (0.0%) |
| $12,500 to $14,999 | 0 (0.0%) | 0 (0.0%) |
| $15,000 to $17,499 | 0 (0.0%) | 0 (0.0%) |
| $17,500 to $19,999 | 0 (0.0%) | 3 (33.3%) |
| $20,000 to $22,499 | 0 (0.0%) | 0 (0.0%) |
| $22,500 to $24,999 | 0 (0.0%) | 0 (0.0%) |
| $25,000 to $29,999 | 4 (25.0%) | 0 (0.0%) |
| $30,000 to $34,999 | 0 (0.0%) | 0 (0.0%) |
| $35,000 to $39,999 | 4 (25.0%) | 0 (0.0%) |
| $40,000 to $44,999 | 0 (0.0%) | 0 (0.0%) |
| $45,000 to $49,999 | 0 (0.0%) | 0 (0.0%) |
| $50,000 to $54,999 | 0 (0.0%) | 0 (0.0%) |
| $55,000 to $64,999 | 0 (0.0%) | 0 (0.0%) |
| $65,000 to $74,999 | 0 (0.0%) | 0 (0.0%) |
| $75,000 to $99,999 | 6 (37.5%) | 0 (0.0%) |
| $100,000+ | 0 (0.0%) | 0 (0.0%) |
| Total | 16 (100.0%) | 9 (100.0%) |
Earnings by Sex by Educational Attainment in Dripping Springs
| Educational Attainment | Male Income | Female Income |
| Less than High School | - | - |
| High School Diploma | - | - |
| College or Associate's Degree | - | - |
| Bachelor's Degree | - | - |
| Graduate Degree | - | - |
| Total | - | - |
Family Income in Dripping Springs
Family Income Brackets in Dripping Springs
According to the Dripping Springs family income data, there are 6 families falling into the less than $10,000 income range, which is the most common income bracket and makes up 50.0% of all families.
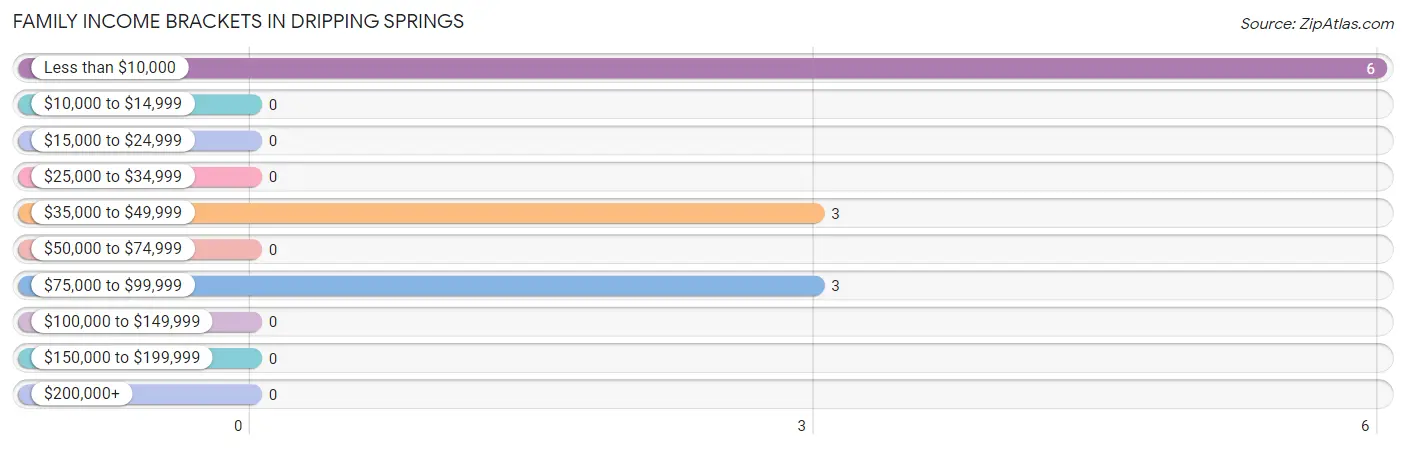
| Income Bracket | # Families | % Families |
| Less than $10,000 | 6 | 50.0% |
| $10,000 to $14,999 | 0 | 0.0% |
| $15,000 to $24,999 | 0 | 0.0% |
| $25,000 to $34,999 | 0 | 0.0% |
| $35,000 to $49,999 | 3 | 25.0% |
| $50,000 to $74,999 | 0 | 0.0% |
| $75,000 to $99,999 | 3 | 25.0% |
| $100,000 to $149,999 | 0 | 0.0% |
| $150,000 to $199,999 | 0 | 0.0% |
| $200,000+ | 0 | 0.0% |
Family Income by Famaliy Size in Dripping Springs
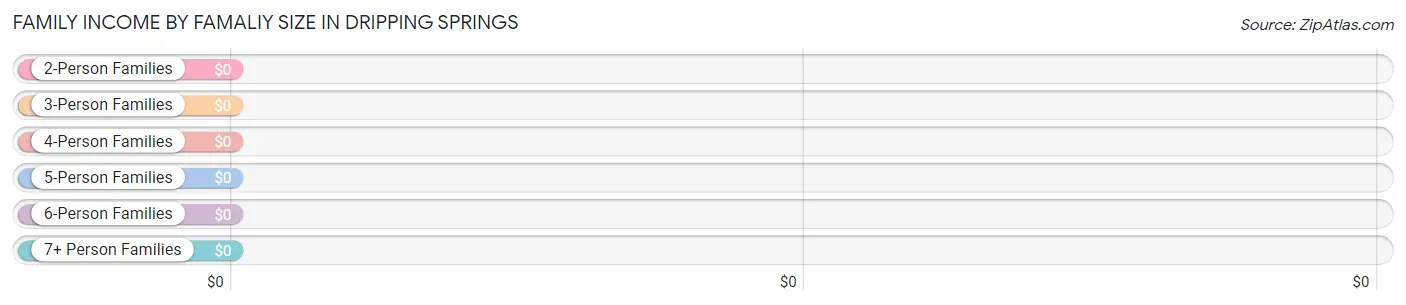
| Income Bracket | # Families | Median Income |
| 2-Person Families | 0 (0.0%) | $0 |
| 3-Person Families | 6 (50.0%) | $0 |
| 4-Person Families | 6 (50.0%) | $0 |
| 5-Person Families | 0 (0.0%) | $0 |
| 6-Person Families | 0 (0.0%) | $0 |
| 7+ Person Families | 0 (0.0%) | $0 |
| Total | 12 (100.0%) | $0 |
Family Income by Number of Earners in Dripping Springs
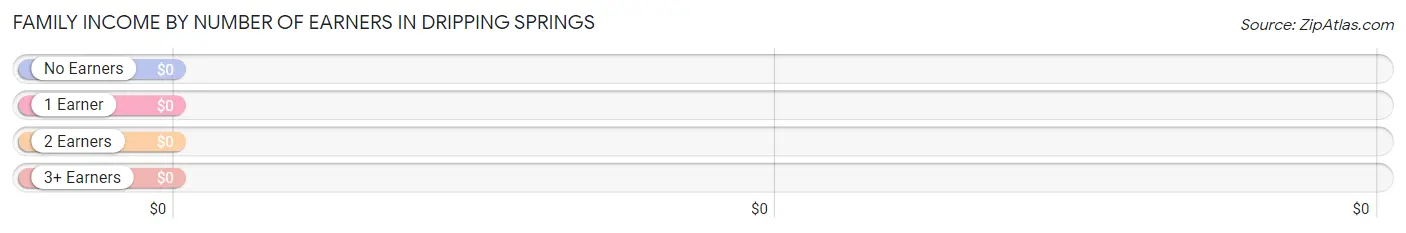
| Number of Earners | # Families | Median Income |
| No Earners | 0 (0.0%) | $0 |
| 1 Earner | 9 (75.0%) | $0 |
| 2 Earners | 0 (0.0%) | $0 |
| 3+ Earners | 3 (25.0%) | $0 |
| Total | 12 (100.0%) | $0 |
Household Income in Dripping Springs
Household Income Brackets in Dripping Springs
With 6 households falling in the category, the $100,000 to $149,999 income range is the most frequent in Dripping Springs, accounting for 50.0% of all households.
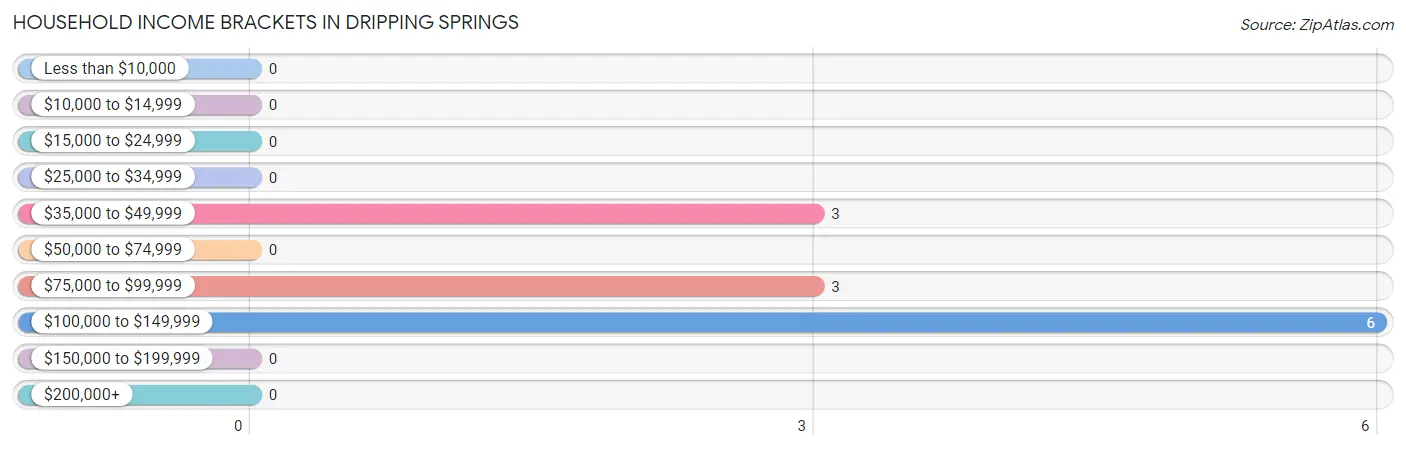
| Income Bracket | # Households | % Households |
| Less than $10,000 | 0 | 0.0% |
| $10,000 to $14,999 | 0 | 0.0% |
| $15,000 to $24,999 | 0 | 0.0% |
| $25,000 to $34,999 | 0 | 0.0% |
| $35,000 to $49,999 | 3 | 25.0% |
| $50,000 to $74,999 | 0 | 0.0% |
| $75,000 to $99,999 | 3 | 25.0% |
| $100,000 to $149,999 | 6 | 50.0% |
| $150,000 to $199,999 | 0 | 0.0% |
| $200,000+ | 0 | 0.0% |
Household Income by Householder Age in Dripping Springs
| Income Bracket | # Households | Median Income |
| 15 to 24 Years | 0 (0.0%) | $0 |
| 25 to 44 Years | 9 (75.0%) | $0 |
| 45 to 64 Years | 0 (0.0%) | $0 |
| 65+ Years | 3 (25.0%) | $0 |
| Total | 12 (100.0%) | $92,500 |
Poverty in Dripping Springs
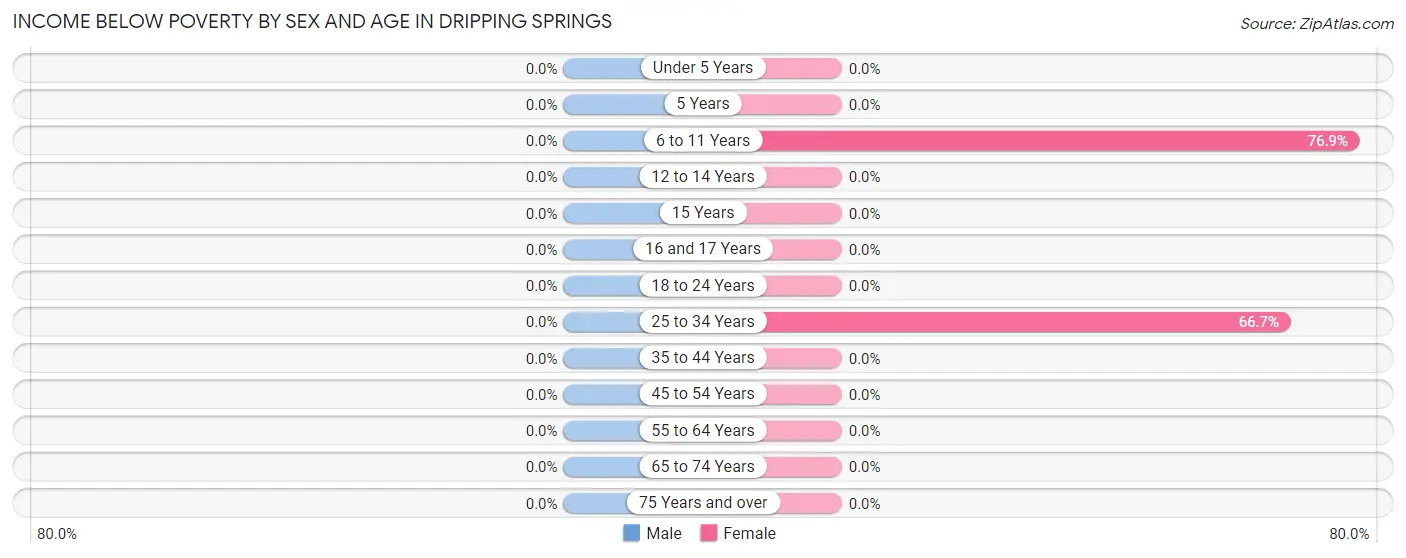
Income Below Poverty by Sex and Age in Dripping Springs
| Age Bracket | Male | Female |
| Under 5 Years | 0 (0.0%) | 0 (0.0%) |
| 5 Years | 0 (0.0%) | 0 (0.0%) |
| 6 to 11 Years | 0 (0.0%) | 10 (76.9%) |
| 12 to 14 Years | 0 (0.0%) | 0 (0.0%) |
| 15 Years | 0 (0.0%) | 0 (0.0%) |
| 16 and 17 Years | 0 (0.0%) | 0 (0.0%) |
| 18 to 24 Years | 0 (0.0%) | 0 (0.0%) |
| 25 to 34 Years | 0 (0.0%) | 6 (66.7%) |
| 35 to 44 Years | 0 (0.0%) | 0 (0.0%) |
| 45 to 54 Years | 0 (0.0%) | 0 (0.0%) |
| 55 to 64 Years | 0 (0.0%) | 0 (0.0%) |
| 65 to 74 Years | 0 (0.0%) | 0 (0.0%) |
| 75 Years and over | 0 (0.0%) | 0 (0.0%) |
| Total | 0 (0.0%) | 16 (57.1%) |
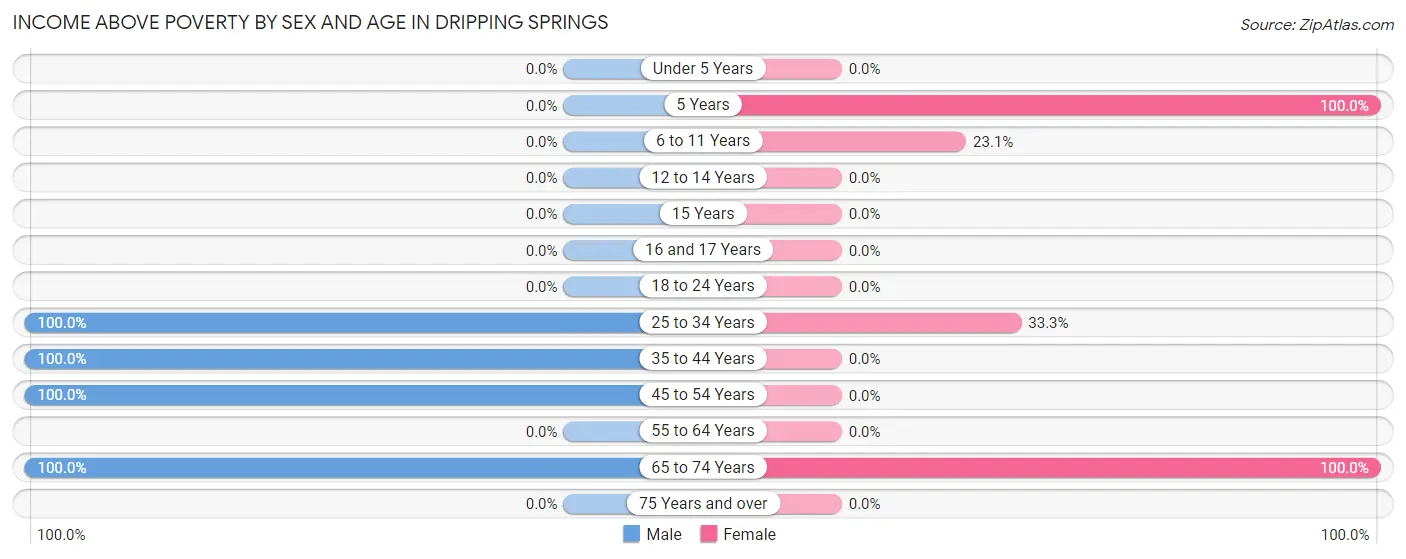
Income Above Poverty by Sex and Age in Dripping Springs
According to the poverty statistics in Dripping Springs, males aged 25 to 34 years and females aged 5 years are the age groups that are most secure financially, with 100.0% of males and 100.0% of females in these age groups living above the poverty line.
| Age Bracket | Male | Female |
| Under 5 Years | 0 (0.0%) | 0 (0.0%) |
| 5 Years | 0 (0.0%) | 3 (100.0%) |
| 6 to 11 Years | 0 (0.0%) | 3 (23.1%) |
| 12 to 14 Years | 0 (0.0%) | 0 (0.0%) |
| 15 Years | 0 (0.0%) | 0 (0.0%) |
| 16 and 17 Years | 0 (0.0%) | 0 (0.0%) |
| 18 to 24 Years | 0 (0.0%) | 0 (0.0%) |
| 25 to 34 Years | 8 (100.0%) | 3 (33.3%) |
| 35 to 44 Years | 6 (100.0%) | 0 (0.0%) |
| 45 to 54 Years | 2 (100.0%) | 0 (0.0%) |
| 55 to 64 Years | 0 (0.0%) | 0 (0.0%) |
| 65 to 74 Years | 2 (100.0%) | 3 (100.0%) |
| 75 Years and over | 0 (0.0%) | 0 (0.0%) |
| Total | 18 (100.0%) | 12 (42.9%) |
Income Below Poverty Among Married-Couple Families in Dripping Springs
| Children | Above Poverty | Below Poverty |
| No Children | 0 (0.0%) | 0 (0.0%) |
| 1 or 2 Children | 6 (100.0%) | 0 (0.0%) |
| 3 or 4 Children | 0 (0.0%) | 0 (0.0%) |
| 5 or more Children | 0 (0.0%) | 0 (0.0%) |
| Total | 6 (100.0%) | 0 (0.0%) |
Income Below Poverty Among Single-Parent Households in Dripping Springs
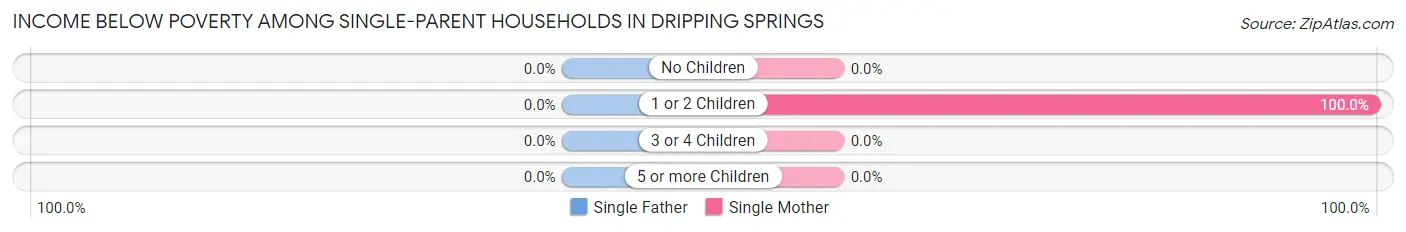
| Children | Single Father | Single Mother |
| No Children | 0 (0.0%) | 0 (0.0%) |
| 1 or 2 Children | 0 (0.0%) | 6 (100.0%) |
| 3 or 4 Children | 0 (0.0%) | 0 (0.0%) |
| 5 or more Children | 0 (0.0%) | 0 (0.0%) |
| Total | 0 (0.0%) | 6 (100.0%) |
Income Below Poverty Among Married-Couple vs Single-Parent Households in Dripping Springs
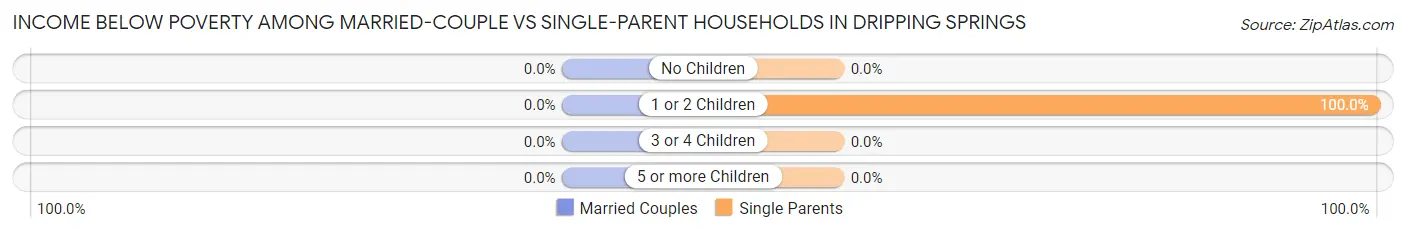
| Children | Married-Couple Families | Single-Parent Households |
| No Children | 0 (0.0%) | 0 (0.0%) |
| 1 or 2 Children | 0 (0.0%) | 6 (100.0%) |
| 3 or 4 Children | 0 (0.0%) | 0 (0.0%) |
| 5 or more Children | 0 (0.0%) | 0 (0.0%) |
| Total | 0 (0.0%) | 6 (100.0%) |
Race in Dripping Springs
The most populous races in Dripping Springs are Native / Alaskan (23 | 50.0%), Two or more Races (14 | 30.4%), and White / Caucasian (9 | 19.6%).
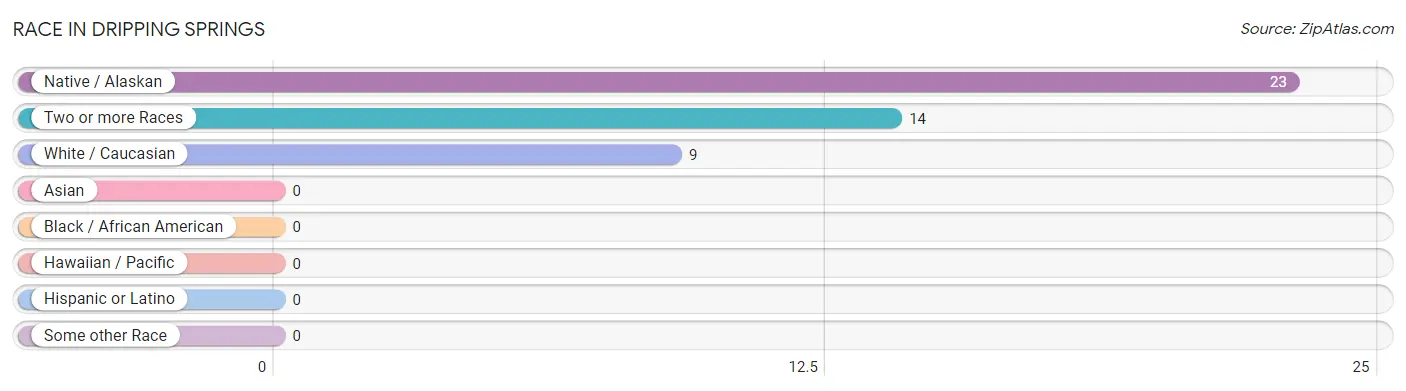
| Race | # Population | % Population |
| Asian | 0 | 0.0% |
| Black / African American | 0 | 0.0% |
| Hawaiian / Pacific | 0 | 0.0% |
| Hispanic or Latino | 0 | 0.0% |
| Native / Alaskan | 23 | 50.0% |
| White / Caucasian | 9 | 19.6% |
| Two or more Races | 14 | 30.4% |
| Some other Race | 0 | 0.0% |
| Total | 46 | 100.0% |
Ancestry in Dripping Springs
The most populous ancestries reported in Dripping Springs are Cherokee (37 | 80.4%), and American (3 | 6.5%), together accounting for 87.0% of all Dripping Springs residents.
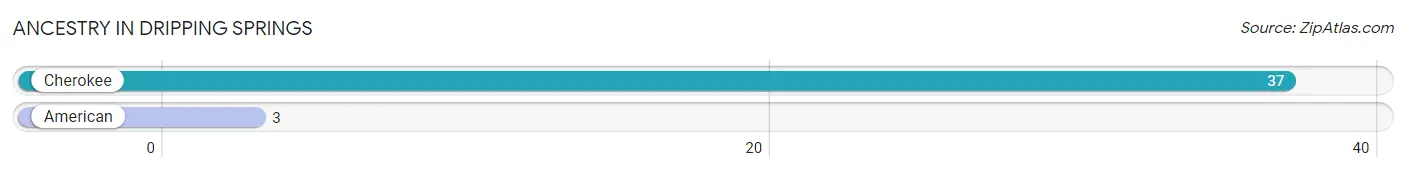
| Ancestry | # Population | % Population |
| American | 3 | 6.5% |
| Cherokee | 37 | 80.4% | View All 2 Rows |
Immigrants in Dripping Springs

| Immigration Origin | # Population | % Population | View All 0 Rows |
Sex and Age in Dripping Springs
Sex and Age in Dripping Springs
The most populous age groups in Dripping Springs are 25 to 29 Years (8 | 44.4%) for men and 5 to 9 Years (11 | 39.3%) for women.
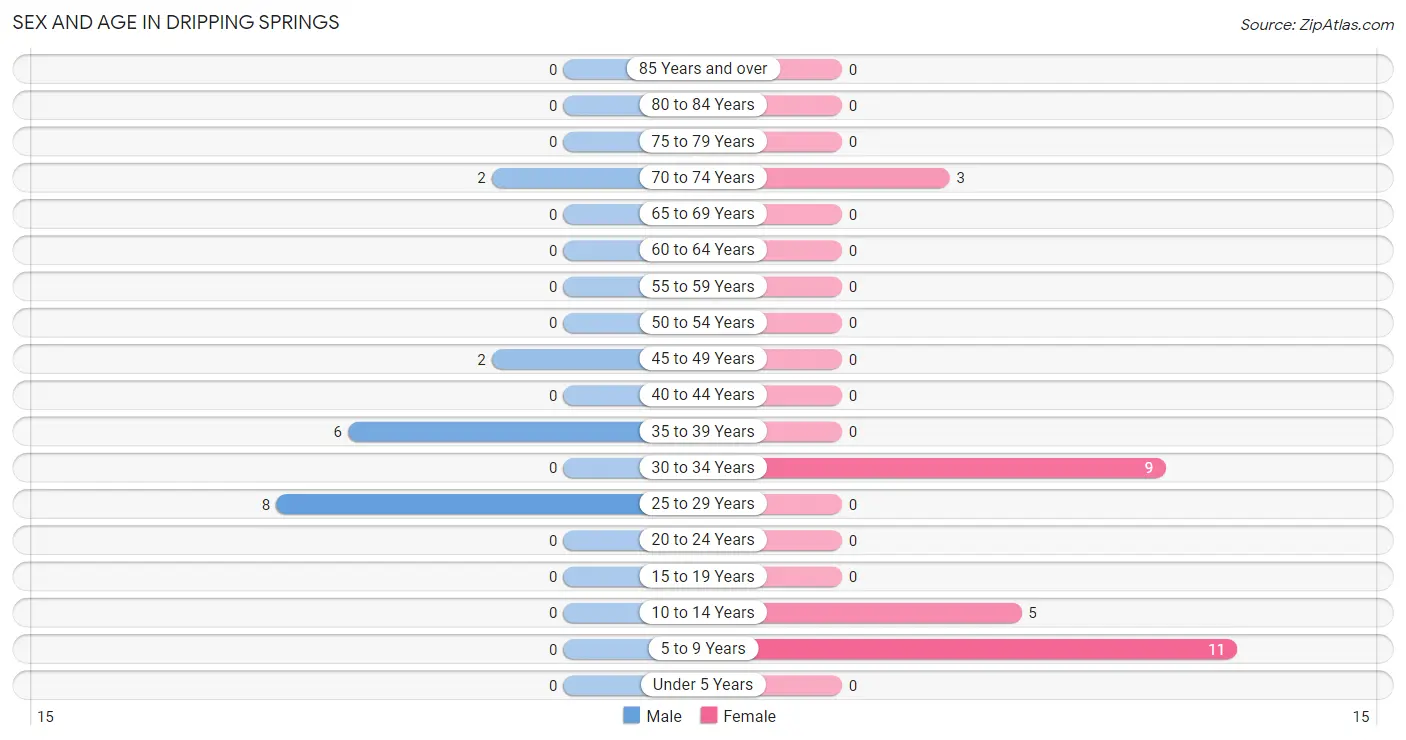
| Age Bracket | Male | Female |
| Under 5 Years | 0 (0.0%) | 0 (0.0%) |
| 5 to 9 Years | 0 (0.0%) | 11 (39.3%) |
| 10 to 14 Years | 0 (0.0%) | 5 (17.9%) |
| 15 to 19 Years | 0 (0.0%) | 0 (0.0%) |
| 20 to 24 Years | 0 (0.0%) | 0 (0.0%) |
| 25 to 29 Years | 8 (44.4%) | 0 (0.0%) |
| 30 to 34 Years | 0 (0.0%) | 9 (32.1%) |
| 35 to 39 Years | 6 (33.3%) | 0 (0.0%) |
| 40 to 44 Years | 0 (0.0%) | 0 (0.0%) |
| 45 to 49 Years | 2 (11.1%) | 0 (0.0%) |
| 50 to 54 Years | 0 (0.0%) | 0 (0.0%) |
| 55 to 59 Years | 0 (0.0%) | 0 (0.0%) |
| 60 to 64 Years | 0 (0.0%) | 0 (0.0%) |
| 65 to 69 Years | 0 (0.0%) | 0 (0.0%) |
| 70 to 74 Years | 2 (11.1%) | 3 (10.7%) |
| 75 to 79 Years | 0 (0.0%) | 0 (0.0%) |
| 80 to 84 Years | 0 (0.0%) | 0 (0.0%) |
| 85 Years and over | 0 (0.0%) | 0 (0.0%) |
| Total | 18 (100.0%) | 28 (100.0%) |
Families and Households in Dripping Springs
Median Family Size in Dripping Springs
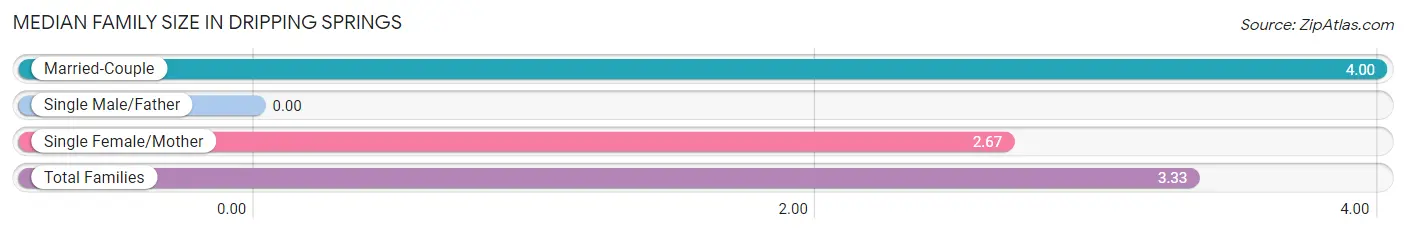
| Family Type | # Families | Family Size |
| Married-Couple | 6 (50.0%) | 4.00 |
| Single Male/Father | 0 (0.0%) | - |
| Single Female/Mother | 6 (50.0%) | 2.67 |
| Total Families | 12 (100.0%) | 3.33 |
Median Household Size in Dripping Springs
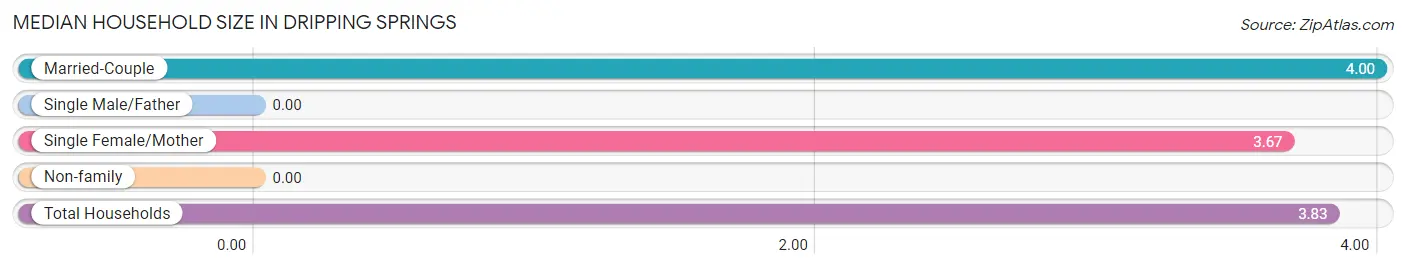
| Household Type | # Households | Household Size |
| Married-Couple | 6 (50.0%) | 4.00 |
| Single Male/Father | 0 (0.0%) | - |
| Single Female/Mother | 6 (50.0%) | 3.67 |
| Non-family | 0 (0.0%) | - |
| Total Households | 12 (100.0%) | 3.83 |
Household Size by Marriage Status in Dripping Springs
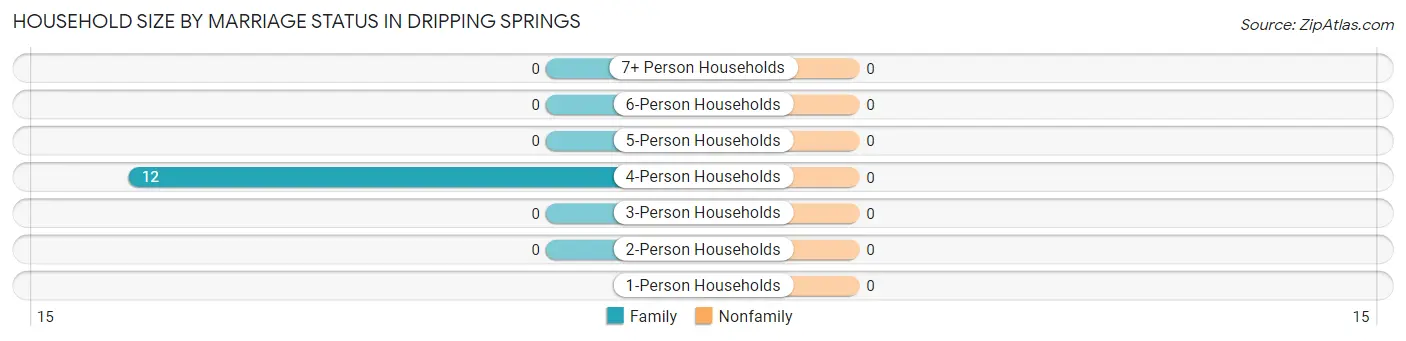
| Household Size | Family Households | Nonfamily Households |
| 1-Person Households | - | 0 (0.0%) |
| 2-Person Households | 0 (0.0%) | 0 (0.0%) |
| 3-Person Households | 0 (0.0%) | 0 (0.0%) |
| 4-Person Households | 12 (100.0%) | 0 (0.0%) |
| 5-Person Households | 0 (0.0%) | 0 (0.0%) |
| 6-Person Households | 0 (0.0%) | 0 (0.0%) |
| 7+ Person Households | 0 (0.0%) | 0 (0.0%) |
| Total | 12 (100.0%) | 0 (0.0%) |
Female Fertility in Dripping Springs
Fertility by Age in Dripping Springs
| Age Bracket | Women with Births | Births / 1,000 Women |
| 15 to 19 years | 0 (0.0%) | 0.0 |
| 20 to 34 years | 0 (0.0%) | 0.0 |
| 35 to 50 years | 0 (0.0%) | 0.0 |
| Total | 0 (0.0%) | 0.0 |
Fertility by Age by Marriage Status in Dripping Springs
| Age Bracket | Married | Unmarried |
| 15 to 19 years | 0 (0.0%) | 0 (0.0%) |
| 20 to 34 years | 0 (0.0%) | 0 (0.0%) |
| 35 to 50 years | 0 (0.0%) | 0 (0.0%) |
| Total | 0 (0.0%) | 0 (0.0%) |
Fertility by Education in Dripping Springs
| Educational Attainment | Women with Births | Births / 1,000 Women |
| Less than High School | 0 (0.0%) | 0.0 |
| High School Diploma | 0 (0.0%) | 0.0 |
| College or Associate's Degree | 0 (0.0%) | 0.0 |
| Bachelor's Degree | 0 (0.0%) | 0.0 |
| Graduate Degree | 0 (0.0%) | 0.0 |
| Total | 0 (0.0%) | 0.0 |
Fertility by Education by Marriage Status in Dripping Springs
| Educational Attainment | Married | Unmarried |
| Less than High School | 0 (0.0%) | 0 (0.0%) |
| High School Diploma | 0 (0.0%) | 0 (0.0%) |
| College or Associate's Degree | 0 (0.0%) | 0 (0.0%) |
| Bachelor's Degree | 0 (0.0%) | 0 (0.0%) |
| Graduate Degree | 0 (0.0%) | 0 (0.0%) |
| Total | 0 (0.0%) | 0 (0.0%) |
Employment Characteristics in Dripping Springs
Employment by Class of Employer in Dripping Springs
Among the 23 employed individuals in Dripping Springs, private company employees (17 | 73.9%), and local government employees (6 | 26.1%) make up the most common classes of employment.
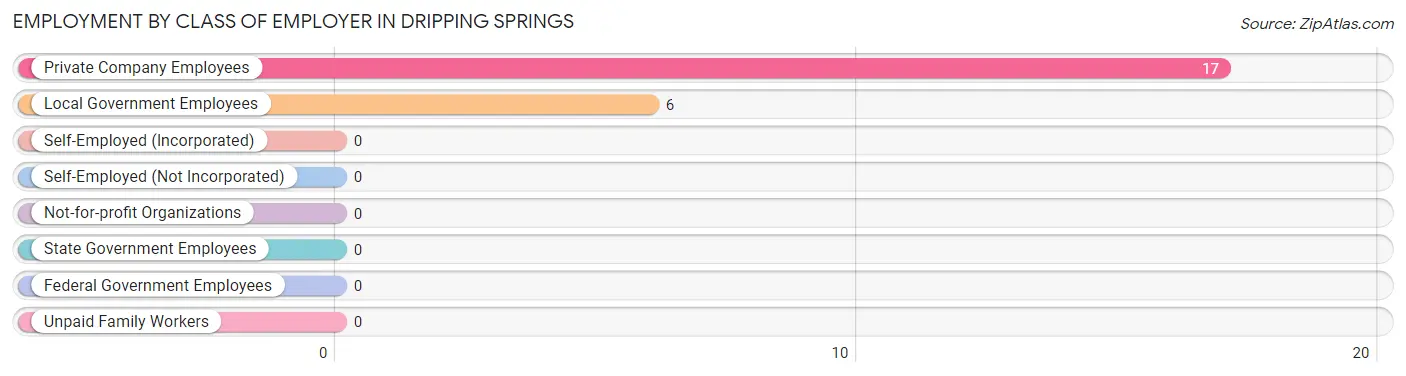
| Employer Class | # Employees | % Employees |
| Private Company Employees | 17 | 73.9% |
| Self-Employed (Incorporated) | 0 | 0.0% |
| Self-Employed (Not Incorporated) | 0 | 0.0% |
| Not-for-profit Organizations | 0 | 0.0% |
| Local Government Employees | 6 | 26.1% |
| State Government Employees | 0 | 0.0% |
| Federal Government Employees | 0 | 0.0% |
| Unpaid Family Workers | 0 | 0.0% |
| Total | 23 | 100.0% |
Employment Status by Age in Dripping Springs
According to the labor force statistics for Dripping Springs, out of the total population over 16 years of age (30), 83.3% or 25 individuals are in the labor force, with 8.0% or 2 of them unemployed. The age group with the highest labor force participation rate is 25 to 29 years, with 100.0% or 8 individuals in the labor force. Within the labor force, the 45 to 54 years age range has the highest percentage of unemployed individuals, with 100.0% or 2 of them being unemployed.
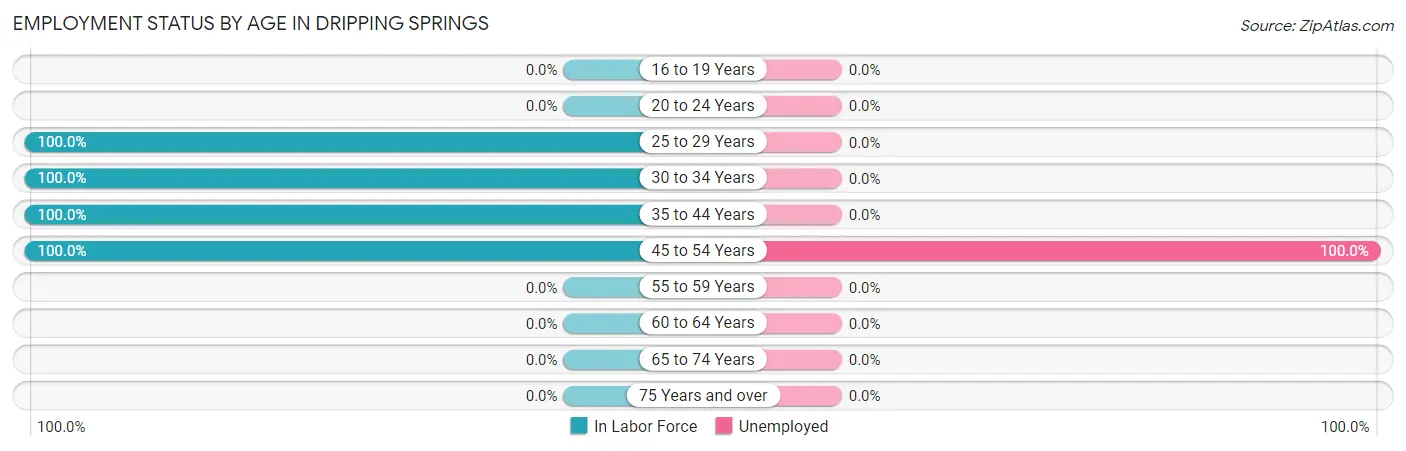
| Age Bracket | In Labor Force | Unemployed |
| 16 to 19 Years | 0 (0.0%) | 0 (0.0%) |
| 20 to 24 Years | 0 (0.0%) | 0 (0.0%) |
| 25 to 29 Years | 8 (100.0%) | 0 (0.0%) |
| 30 to 34 Years | 9 (100.0%) | 0 (0.0%) |
| 35 to 44 Years | 6 (100.0%) | 0 (0.0%) |
| 45 to 54 Years | 2 (100.0%) | 2 (100.0%) |
| 55 to 59 Years | 0 (0.0%) | 0 (0.0%) |
| 60 to 64 Years | 0 (0.0%) | 0 (0.0%) |
| 65 to 74 Years | 0 (0.0%) | 0 (0.0%) |
| 75 Years and over | 0 (0.0%) | 0 (0.0%) |
| Total | 25 (83.3%) | 2 (8.0%) |
Employment Status by Educational Attainment in Dripping Springs
According to labor force statistics for Dripping Springs, 100.0% of individuals (25) out of the total population between 25 and 64 years of age (25) are in the labor force, with 8.0% or 2 of them being unemployed. The group with the highest labor force participation rate are those with the educational attainment of high school diploma, with 100.0% or 19 individuals in the labor force. Within the labor force, individuals with high school diploma education have the highest percentage of unemployment, with 10.5% or 2 of them being unemployed.
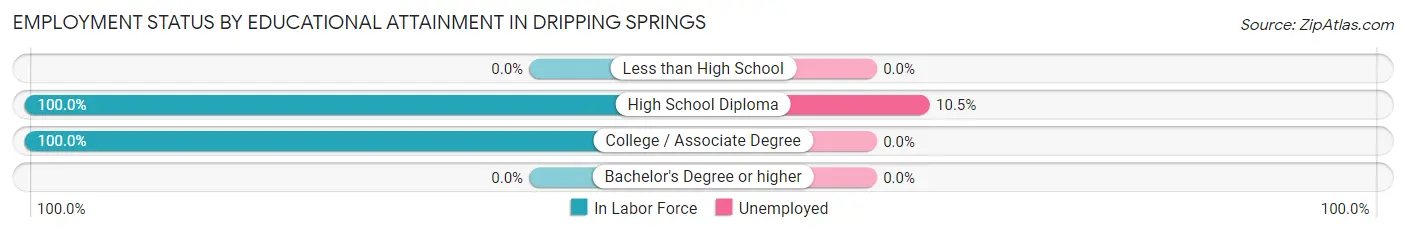
| Educational Attainment | In Labor Force | Unemployed |
| Less than High School | 0 (0.0%) | 0 (0.0%) |
| High School Diploma | 19 (100.0%) | 2 (10.5%) |
| College / Associate Degree | 6 (100.0%) | 0 (0.0%) |
| Bachelor's Degree or higher | 0 (0.0%) | 0 (0.0%) |
| Total | 25 (100.0%) | 2 (8.0%) |
Employment Occupations by Sex in Dripping Springs
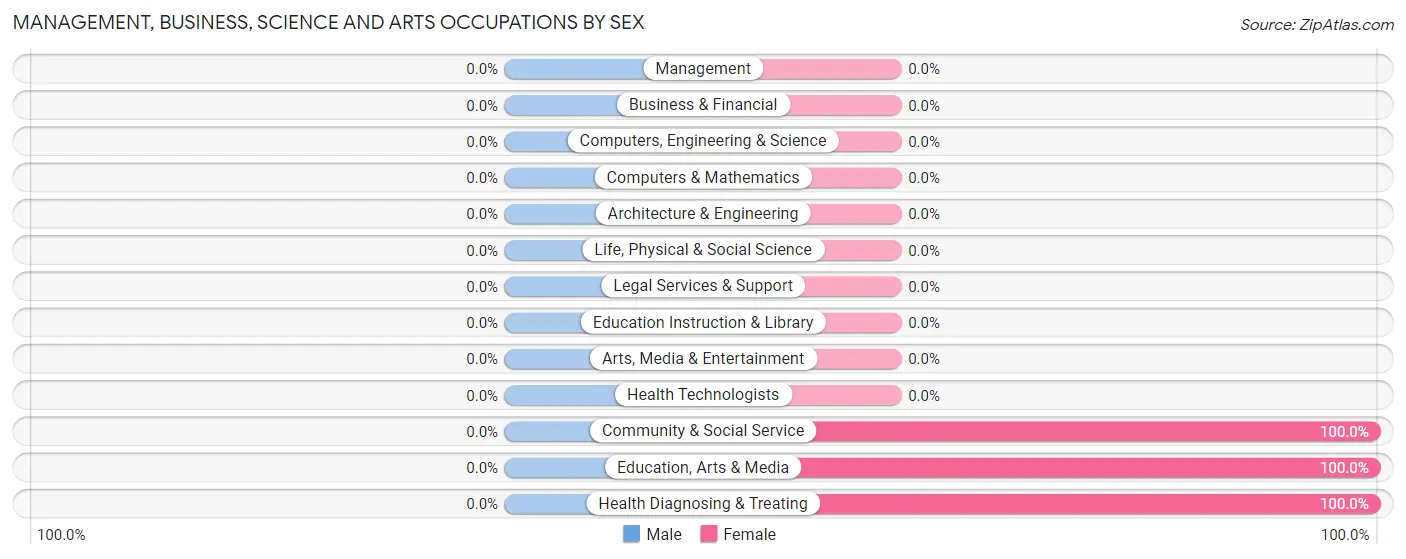
Management, Business, Science and Arts Occupations
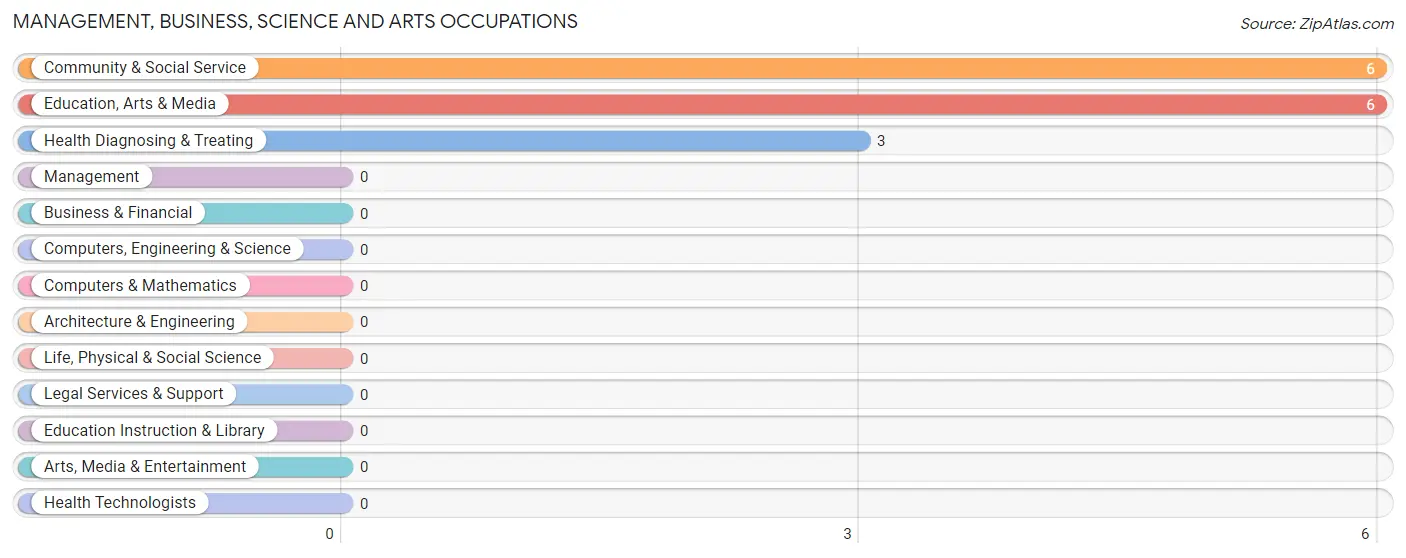
The most common Management, Business, Science and Arts occupations in Dripping Springs are Community & Social Service (6 | 26.1%), Education, Arts & Media (6 | 26.1%), and Health Diagnosing & Treating (3 | 13.0%).
Management, Business, Science and Arts Occupations by Sex
| Occupation | Male | Female |
| Management | 0 (0.0%) | 0 (0.0%) |
| Business & Financial | 0 (0.0%) | 0 (0.0%) |
| Computers, Engineering & Science | 0 (0.0%) | 0 (0.0%) |
| Computers & Mathematics | 0 (0.0%) | 0 (0.0%) |
| Architecture & Engineering | 0 (0.0%) | 0 (0.0%) |
| Life, Physical & Social Science | 0 (0.0%) | 0 (0.0%) |
| Community & Social Service | 0 (0.0%) | 6 (100.0%) |
| Education, Arts & Media | 0 (0.0%) | 6 (100.0%) |
| Legal Services & Support | 0 (0.0%) | 0 (0.0%) |
| Education Instruction & Library | 0 (0.0%) | 0 (0.0%) |
| Arts, Media & Entertainment | 0 (0.0%) | 0 (0.0%) |
| Health Diagnosing & Treating | 0 (0.0%) | 3 (100.0%) |
| Health Technologists | 0 (0.0%) | 0 (0.0%) |
| Total (Category) | 0 (0.0%) | 9 (100.0%) |
| Total (Overall) | 14 (60.9%) | 9 (39.1%) |
Services Occupations
Services Occupations by Sex
| Occupation | Male | Female |
| Healthcare Support | 0 (0.0%) | 0 (0.0%) |
| Security & Protection | 0 (0.0%) | 0 (0.0%) |
| Firefighting & Prevention | 0 (0.0%) | 0 (0.0%) |
| Law Enforcement | 0 (0.0%) | 0 (0.0%) |
| Food Preparation & Serving | 0 (0.0%) | 0 (0.0%) |
| Cleaning & Maintenance | 0 (0.0%) | 0 (0.0%) |
| Personal Care & Service | 0 (0.0%) | 0 (0.0%) |
| Total (Category) | 0 (0.0%) | 0 (0.0%) |
| Total (Overall) | 14 (60.9%) | 9 (39.1%) |
Sales and Office Occupations
Sales and Office Occupations by Sex
| Occupation | Male | Female |
| Sales & Related | 0 (0.0%) | 0 (0.0%) |
| Office & Administration | 0 (0.0%) | 0 (0.0%) |
| Total (Category) | 0 (0.0%) | 0 (0.0%) |
| Total (Overall) | 14 (60.9%) | 9 (39.1%) |
Natural Resources, Construction and Maintenance Occupations
The most common Natural Resources, Construction and Maintenance occupations in Dripping Springs are , and Farming, Fishing & Forestry (4 | 17.4%).
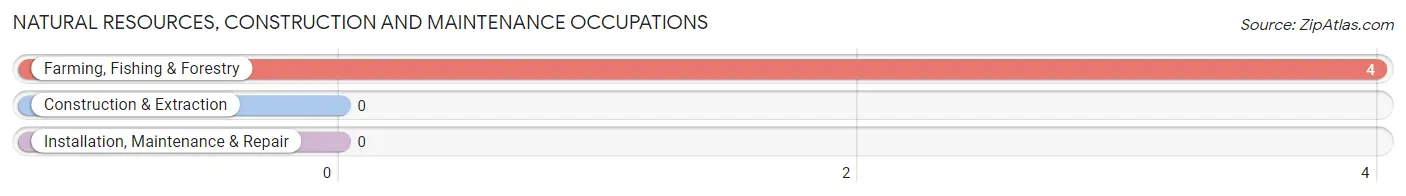
Natural Resources, Construction and Maintenance Occupations by Sex
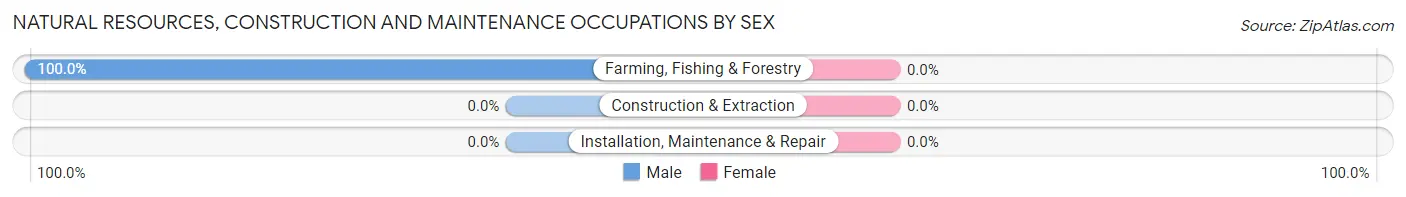
| Occupation | Male | Female |
| Farming, Fishing & Forestry | 4 (100.0%) | 0 (0.0%) |
| Construction & Extraction | 0 (0.0%) | 0 (0.0%) |
| Installation, Maintenance & Repair | 0 (0.0%) | 0 (0.0%) |
| Total (Category) | 4 (100.0%) | 0 (0.0%) |
| Total (Overall) | 14 (60.9%) | 9 (39.1%) |
Production, Transportation and Moving Occupations
The most common Production, Transportation and Moving occupations in Dripping Springs are Transportation (6 | 26.1%), and Production (4 | 17.4%).
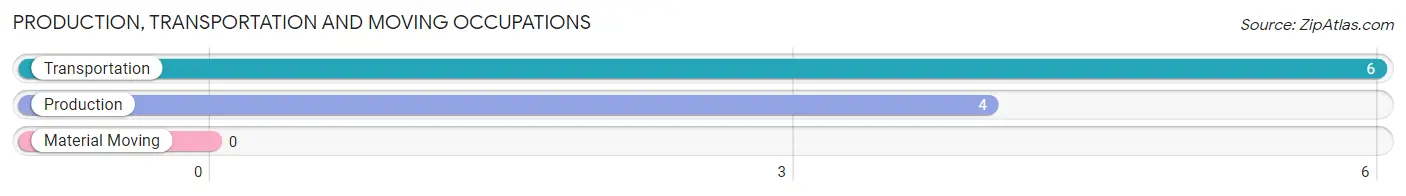
Production, Transportation and Moving Occupations by Sex
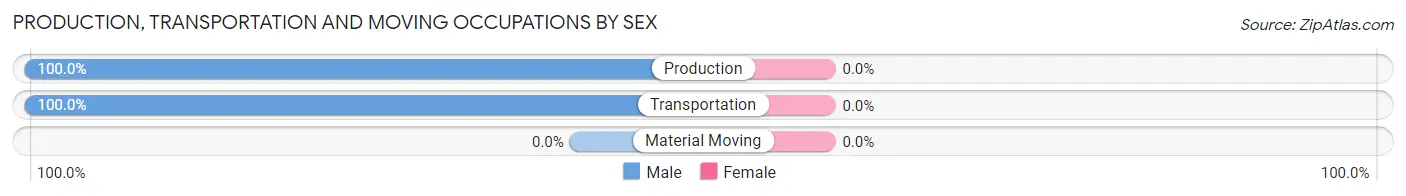
| Occupation | Male | Female |
| Production | 4 (100.0%) | 0 (0.0%) |
| Transportation | 6 (100.0%) | 0 (0.0%) |
| Material Moving | 0 (0.0%) | 0 (0.0%) |
| Total (Category) | 10 (100.0%) | 0 (0.0%) |
| Total (Overall) | 14 (60.9%) | 9 (39.1%) |
Employment Industries by Sex in Dripping Springs
Employment Industries in Dripping Springs
The major employment industries in Dripping Springs include Health Care & Social Assistance (9 | 39.1%), Transportation & Warehousing (6 | 26.1%), Agriculture, Fishing & Hunting (4 | 17.4%), and Arts, Entertainment & Recreation (4 | 17.4%).
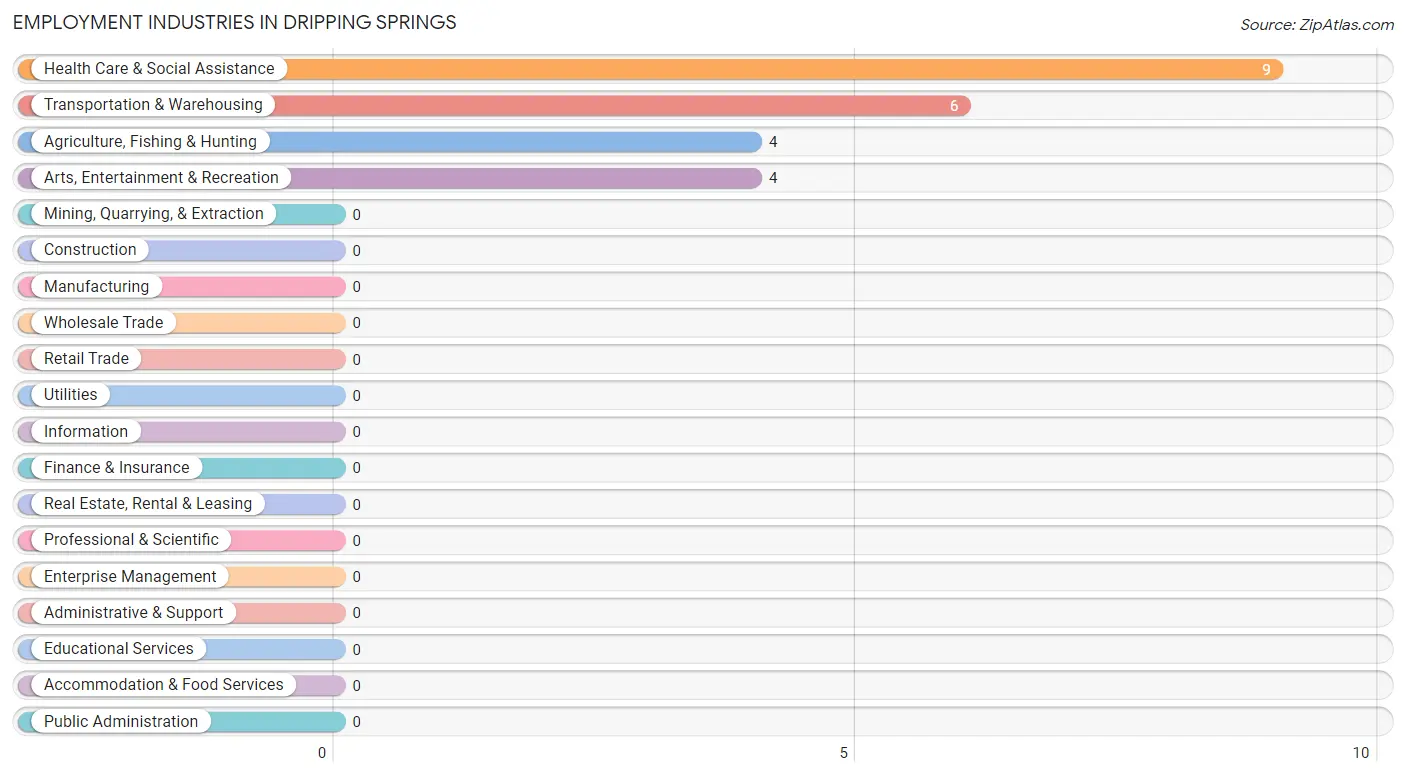
Employment Industries by Sex in Dripping Springs
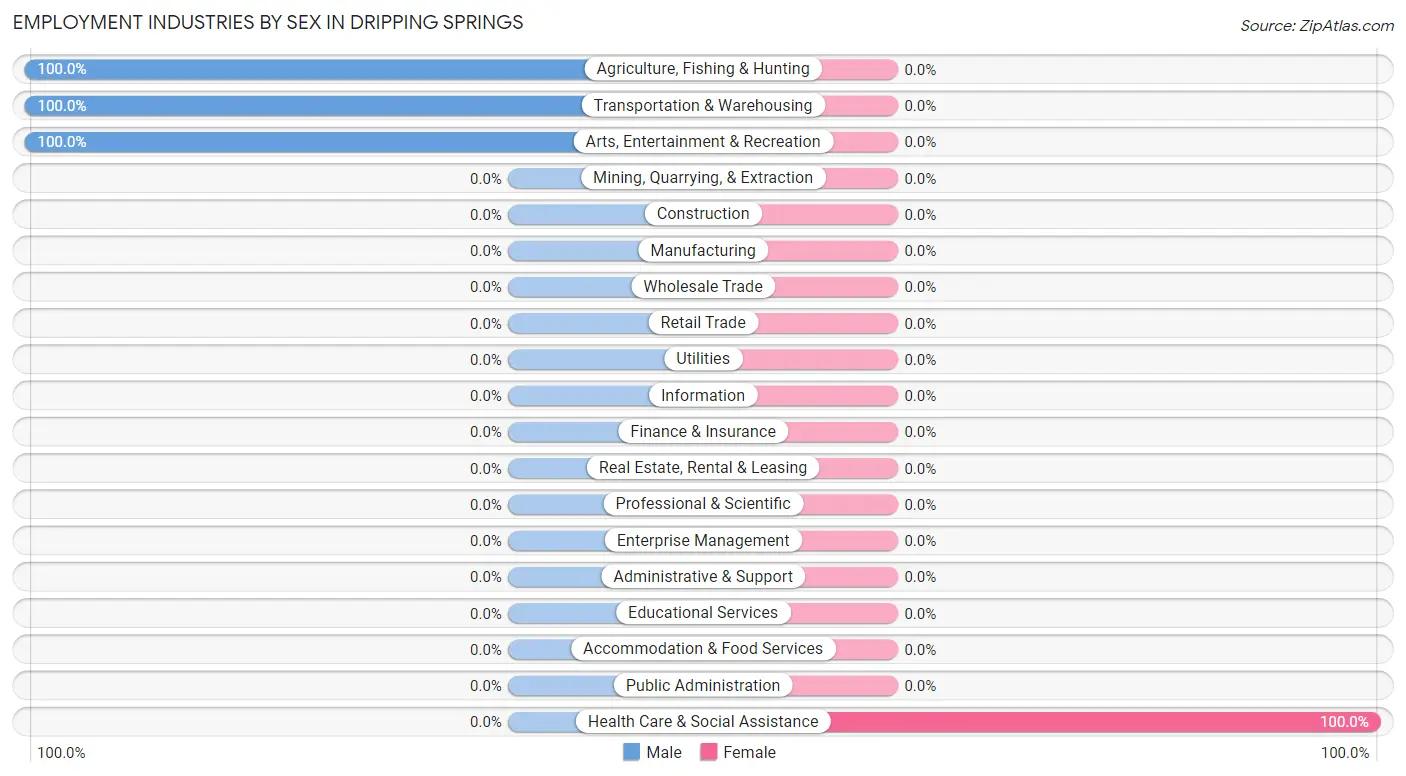
| Industry | Male | Female |
| Agriculture, Fishing & Hunting | 4 (100.0%) | 0 (0.0%) |
| Mining, Quarrying, & Extraction | 0 (0.0%) | 0 (0.0%) |
| Construction | 0 (0.0%) | 0 (0.0%) |
| Manufacturing | 0 (0.0%) | 0 (0.0%) |
| Wholesale Trade | 0 (0.0%) | 0 (0.0%) |
| Retail Trade | 0 (0.0%) | 0 (0.0%) |
| Transportation & Warehousing | 6 (100.0%) | 0 (0.0%) |
| Utilities | 0 (0.0%) | 0 (0.0%) |
| Information | 0 (0.0%) | 0 (0.0%) |
| Finance & Insurance | 0 (0.0%) | 0 (0.0%) |
| Real Estate, Rental & Leasing | 0 (0.0%) | 0 (0.0%) |
| Professional & Scientific | 0 (0.0%) | 0 (0.0%) |
| Enterprise Management | 0 (0.0%) | 0 (0.0%) |
| Administrative & Support | 0 (0.0%) | 0 (0.0%) |
| Educational Services | 0 (0.0%) | 0 (0.0%) |
| Health Care & Social Assistance | 0 (0.0%) | 9 (100.0%) |
| Arts, Entertainment & Recreation | 4 (100.0%) | 0 (0.0%) |
| Accommodation & Food Services | 0 (0.0%) | 0 (0.0%) |
| Public Administration | 0 (0.0%) | 0 (0.0%) |
| Total | 14 (60.9%) | 9 (39.1%) |
Education in Dripping Springs
School Enrollment in Dripping Springs
The most common levels of schooling among the 16 students in Dripping Springs are elementary school (8 | 50.0%), middle school (5 | 31.2%), and nursery / preschool (3 | 18.8%).
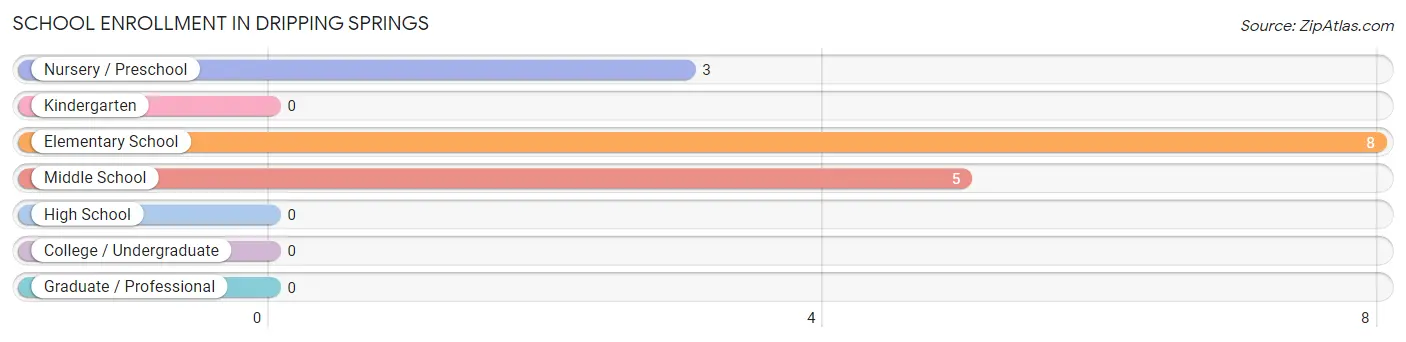
| School Level | # Students | % Students |
| Nursery / Preschool | 3 | 18.8% |
| Kindergarten | 0 | 0.0% |
| Elementary School | 8 | 50.0% |
| Middle School | 5 | 31.2% |
| High School | 0 | 0.0% |
| College / Undergraduate | 0 | 0.0% |
| Graduate / Professional | 0 | 0.0% |
| Total | 16 | 100.0% |
School Enrollment by Age by Funding Source in Dripping Springs
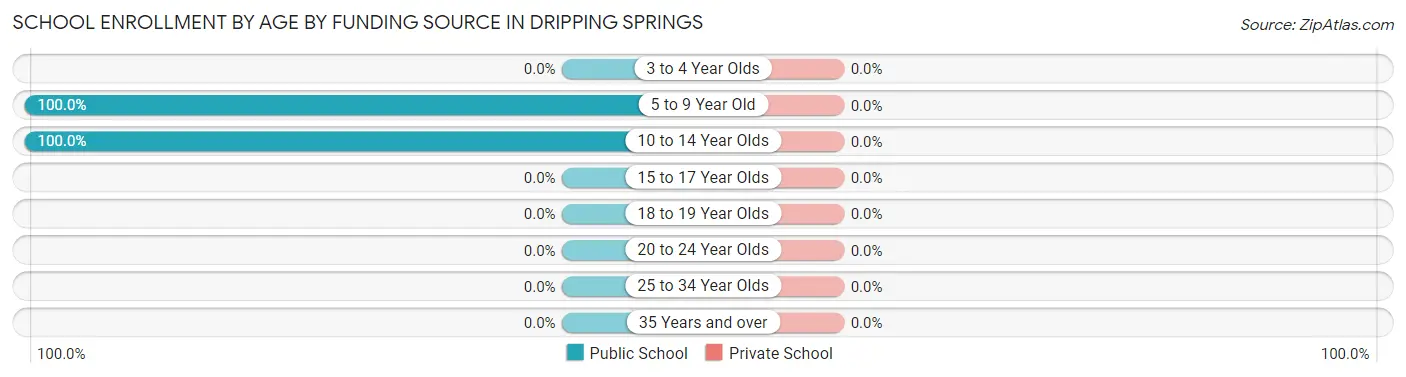
| Age Bracket | Public School | Private School |
| 3 to 4 Year Olds | 0 (0.0%) | 0 (0.0%) |
| 5 to 9 Year Old | 11 (100.0%) | 0 (0.0%) |
| 10 to 14 Year Olds | 5 (100.0%) | 0 (0.0%) |
| 15 to 17 Year Olds | 0 (0.0%) | 0 (0.0%) |
| 18 to 19 Year Olds | 0 (0.0%) | 0 (0.0%) |
| 20 to 24 Year Olds | 0 (0.0%) | 0 (0.0%) |
| 25 to 34 Year Olds | 0 (0.0%) | 0 (0.0%) |
| 35 Years and over | 0 (0.0%) | 0 (0.0%) |
| Total | 16 (100.0%) | 0 (0.0%) |
Educational Attainment by Field of Study in Dripping Springs
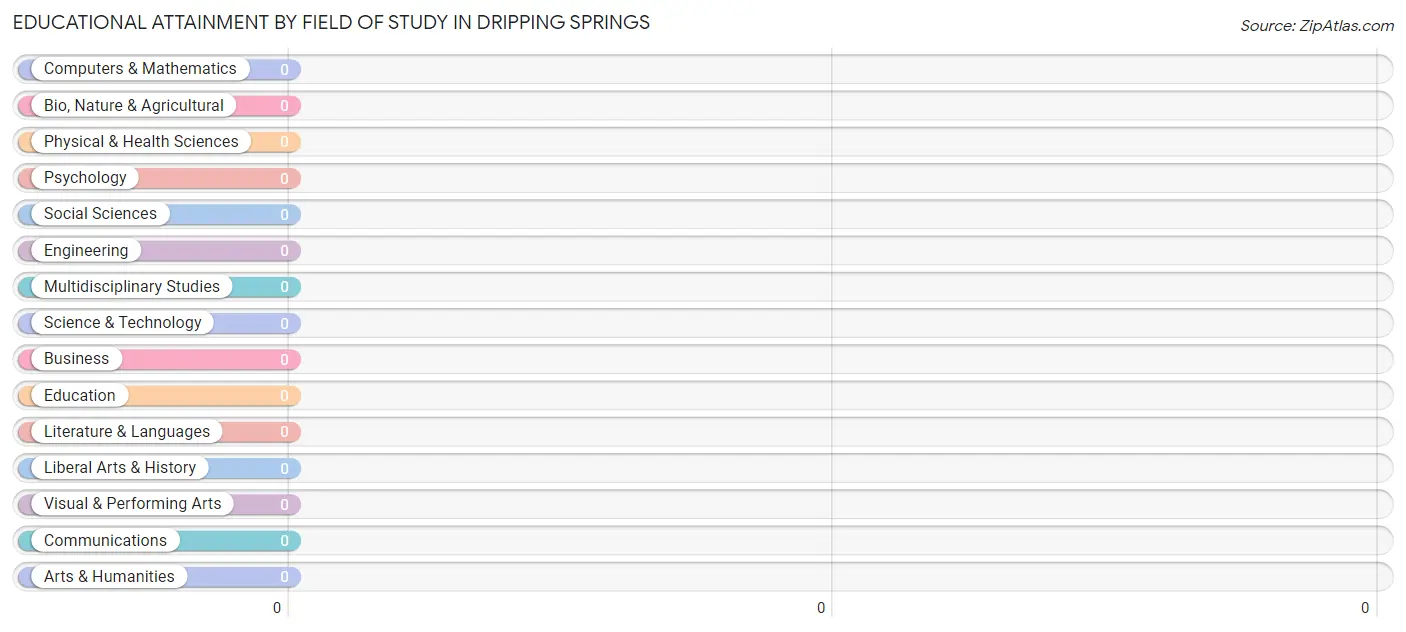
| Field of Study | # Graduates | % Graduates |
| Computers & Mathematics | 0 | 0.0% |
| Bio, Nature & Agricultural | 0 | 0.0% |
| Physical & Health Sciences | 0 | 0.0% |
| Psychology | 0 | 0.0% |
| Social Sciences | 0 | 0.0% |
| Engineering | 0 | 0.0% |
| Multidisciplinary Studies | 0 | 0.0% |
| Science & Technology | 0 | 0.0% |
| Business | 0 | 0.0% |
| Education | 0 | 0.0% |
| Literature & Languages | 0 | 0.0% |
| Liberal Arts & History | 0 | 0.0% |
| Visual & Performing Arts | 0 | 0.0% |
| Communications | 0 | 0.0% |
| Arts & Humanities | 0 | 0.0% |
| Total | 0 | 0.0% |
Transportation & Commute in Dripping Springs
Vehicle Availability by Sex in Dripping Springs
The most prevalent vehicle ownership categories in Dripping Springs are males with 5 or more vehicles (14, accounting for 100.0%) and females with 5 or more vehicles (9, making up 155.6%).
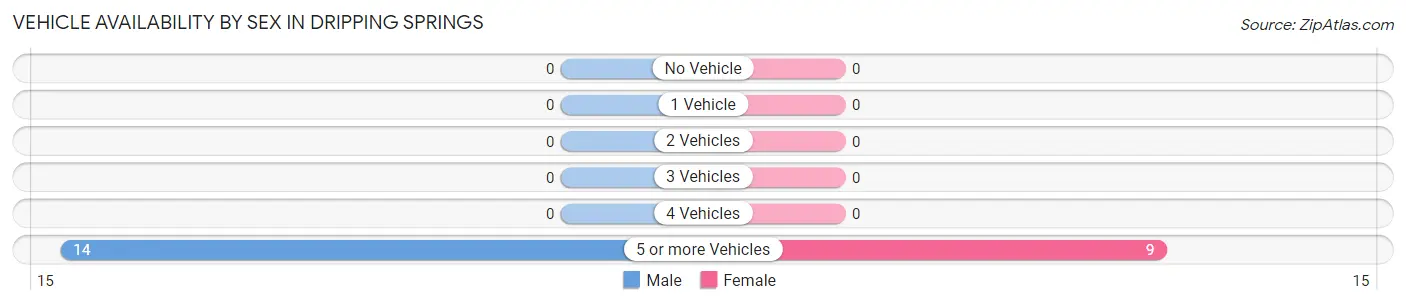
| Vehicles Available | Male | Female |
| No Vehicle | 0 (0.0%) | 0 (0.0%) |
| 1 Vehicle | 0 (0.0%) | 0 (0.0%) |
| 2 Vehicles | 0 (0.0%) | 0 (0.0%) |
| 3 Vehicles | 0 (0.0%) | 0 (0.0%) |
| 4 Vehicles | 0 (0.0%) | 0 (0.0%) |
| 5 or more Vehicles | 14 (100.0%) | 9 (100.0%) |
| Total | 14 (100.0%) | 9 (100.0%) |
Commute Time in Dripping Springs
The most frequently occuring commute durations in Dripping Springs are 10 to 14 minutes (6 commuters, 26.1%), 15 to 19 minutes (6 commuters, 26.1%), and 5 to 9 minutes (4 commuters, 17.4%).
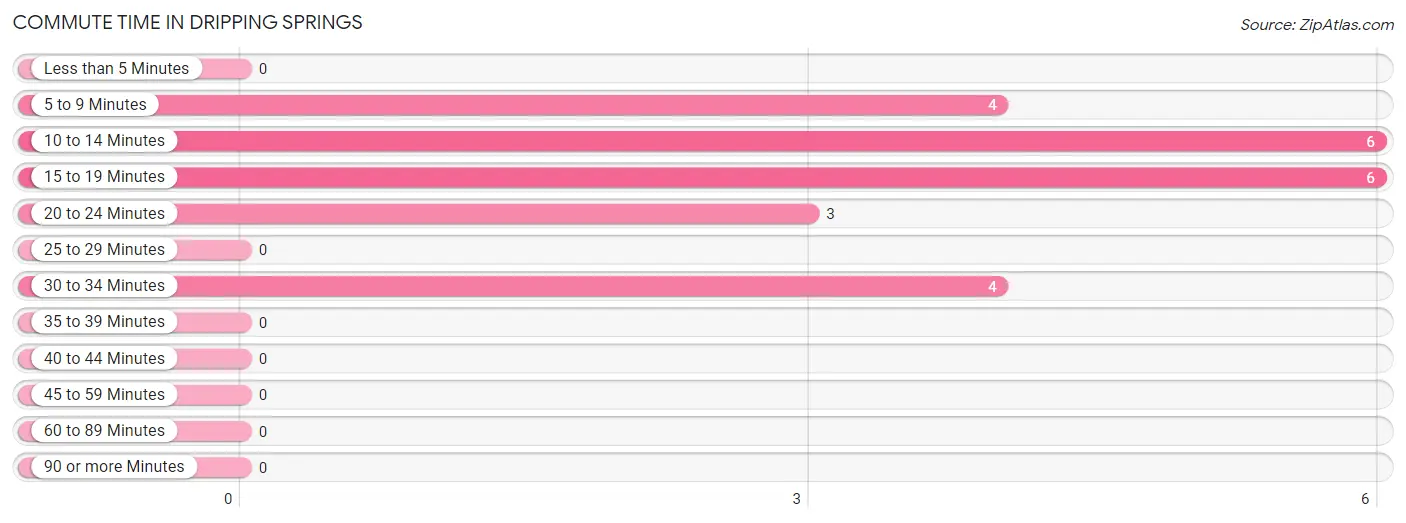
| Commute Time | # Commuters | % Commuters |
| Less than 5 Minutes | 0 | 0.0% |
| 5 to 9 Minutes | 4 | 17.4% |
| 10 to 14 Minutes | 6 | 26.1% |
| 15 to 19 Minutes | 6 | 26.1% |
| 20 to 24 Minutes | 3 | 13.0% |
| 25 to 29 Minutes | 0 | 0.0% |
| 30 to 34 Minutes | 4 | 17.4% |
| 35 to 39 Minutes | 0 | 0.0% |
| 40 to 44 Minutes | 0 | 0.0% |
| 45 to 59 Minutes | 0 | 0.0% |
| 60 to 89 Minutes | 0 | 0.0% |
| 90 or more Minutes | 0 | 0.0% |
Commute Time by Sex in Dripping Springs
The most common commute times in Dripping Springs are 10 to 14 minutes (6 commuters, 42.9%) for males and 15 to 19 minutes (6 commuters, 66.7%) for females.
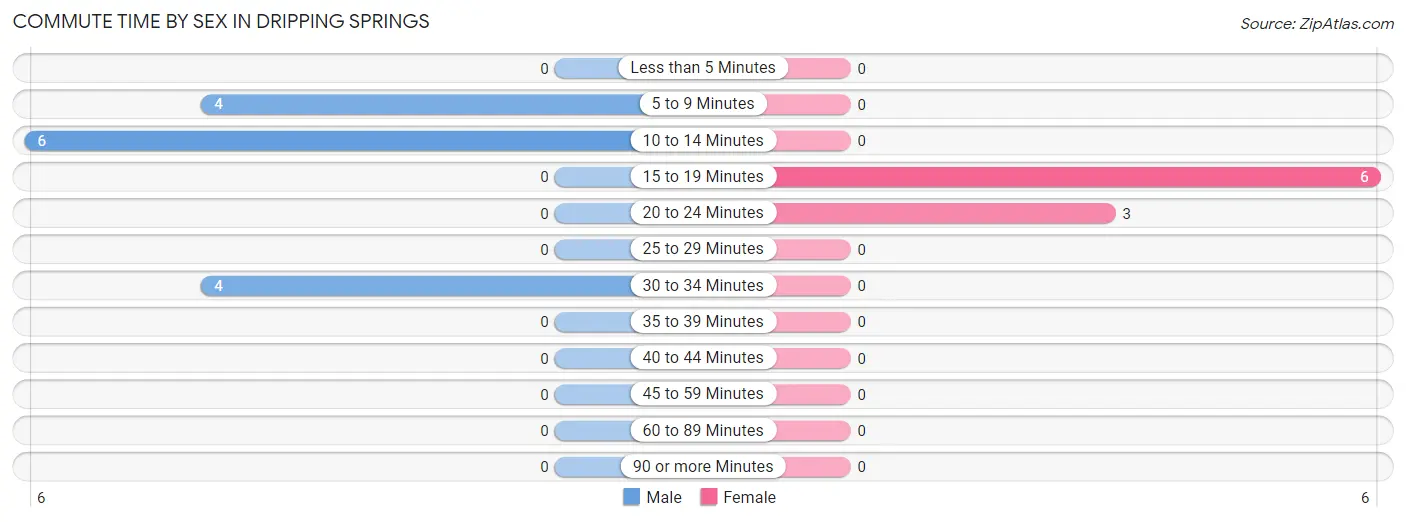
| Commute Time | Male | Female |
| Less than 5 Minutes | 0 (0.0%) | 0 (0.0%) |
| 5 to 9 Minutes | 4 (28.6%) | 0 (0.0%) |
| 10 to 14 Minutes | 6 (42.9%) | 0 (0.0%) |
| 15 to 19 Minutes | 0 (0.0%) | 6 (66.7%) |
| 20 to 24 Minutes | 0 (0.0%) | 3 (33.3%) |
| 25 to 29 Minutes | 0 (0.0%) | 0 (0.0%) |
| 30 to 34 Minutes | 4 (28.6%) | 0 (0.0%) |
| 35 to 39 Minutes | 0 (0.0%) | 0 (0.0%) |
| 40 to 44 Minutes | 0 (0.0%) | 0 (0.0%) |
| 45 to 59 Minutes | 0 (0.0%) | 0 (0.0%) |
| 60 to 89 Minutes | 0 (0.0%) | 0 (0.0%) |
| 90 or more Minutes | 0 (0.0%) | 0 (0.0%) |
Time of Departure to Work by Sex in Dripping Springs
The most frequent times of departure to work in Dripping Springs are 12:00 AM to 4:59 AM (6, 42.9%) for males and 5:30 AM to 5:59 AM (6, 66.7%) for females.
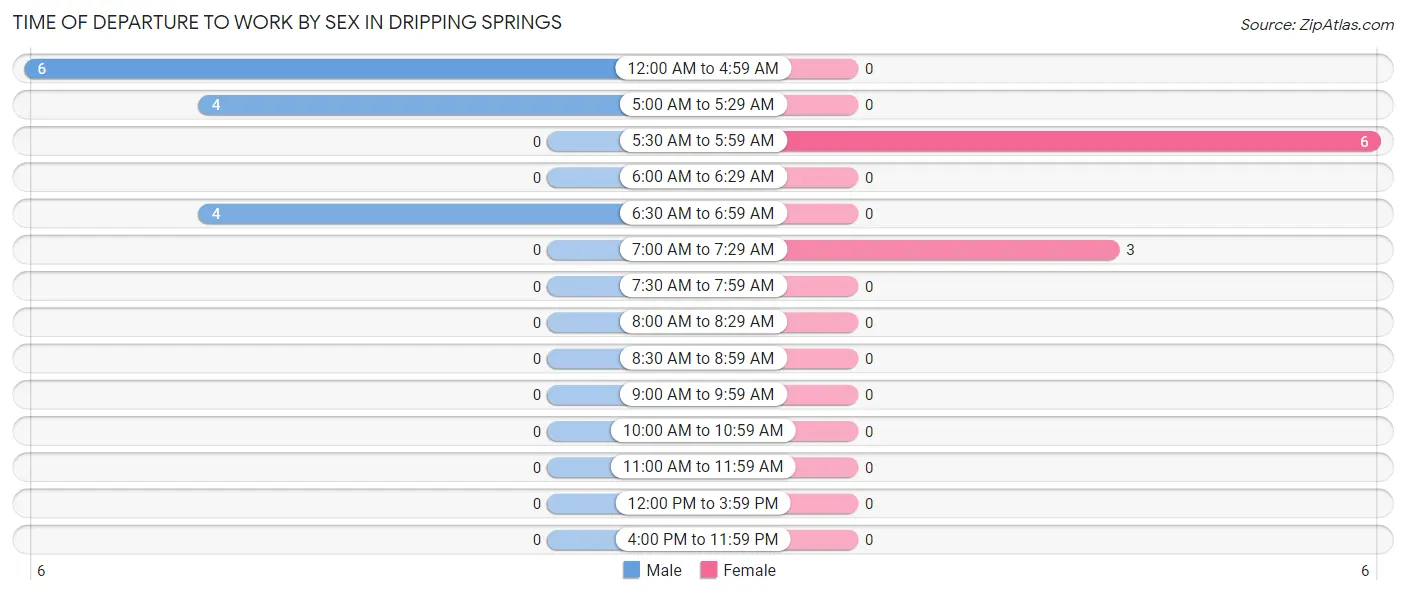
| Time of Departure | Male | Female |
| 12:00 AM to 4:59 AM | 6 (42.9%) | 0 (0.0%) |
| 5:00 AM to 5:29 AM | 4 (28.6%) | 0 (0.0%) |
| 5:30 AM to 5:59 AM | 0 (0.0%) | 6 (66.7%) |
| 6:00 AM to 6:29 AM | 0 (0.0%) | 0 (0.0%) |
| 6:30 AM to 6:59 AM | 4 (28.6%) | 0 (0.0%) |
| 7:00 AM to 7:29 AM | 0 (0.0%) | 3 (33.3%) |
| 7:30 AM to 7:59 AM | 0 (0.0%) | 0 (0.0%) |
| 8:00 AM to 8:29 AM | 0 (0.0%) | 0 (0.0%) |
| 8:30 AM to 8:59 AM | 0 (0.0%) | 0 (0.0%) |
| 9:00 AM to 9:59 AM | 0 (0.0%) | 0 (0.0%) |
| 10:00 AM to 10:59 AM | 0 (0.0%) | 0 (0.0%) |
| 11:00 AM to 11:59 AM | 0 (0.0%) | 0 (0.0%) |
| 12:00 PM to 3:59 PM | 0 (0.0%) | 0 (0.0%) |
| 4:00 PM to 11:59 PM | 0 (0.0%) | 0 (0.0%) |
| Total | 14 (100.0%) | 9 (100.0%) |
Housing Occupancy in Dripping Springs
Occupancy by Ownership in Dripping Springs
Of the total 12 dwellings in Dripping Springs, owner-occupied units account for 12 (100.0%), while renter-occupied units make up 0 (0.0%).
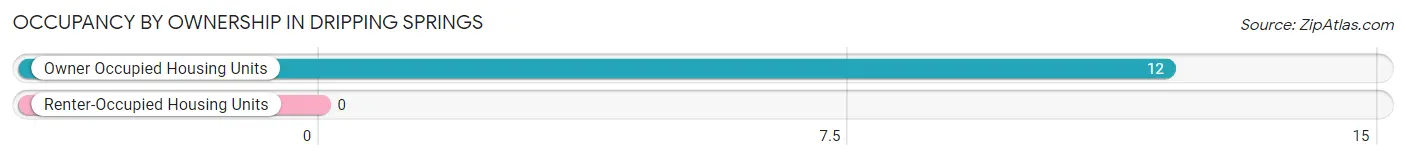
| Occupancy | # Housing Units | % Housing Units |
| Owner Occupied Housing Units | 12 | 100.0% |
| Renter-Occupied Housing Units | 0 | 0.0% |
| Total Occupied Housing Units | 12 | 100.0% |
Occupancy by Household Size in Dripping Springs
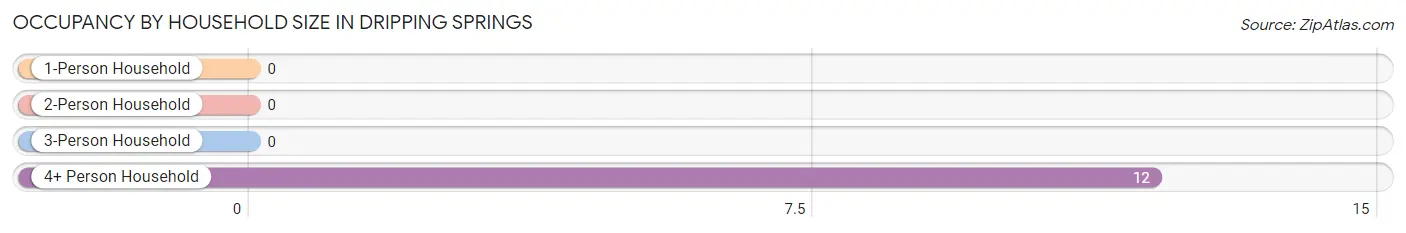
| Household Size | # Housing Units | % Housing Units |
| 1-Person Household | 0 | 0.0% |
| 2-Person Household | 0 | 0.0% |
| 3-Person Household | 0 | 0.0% |
| 4+ Person Household | 12 | 100.0% |
| Total Housing Units | 12 | 100.0% |
Occupancy by Ownership by Household Size in Dripping Springs
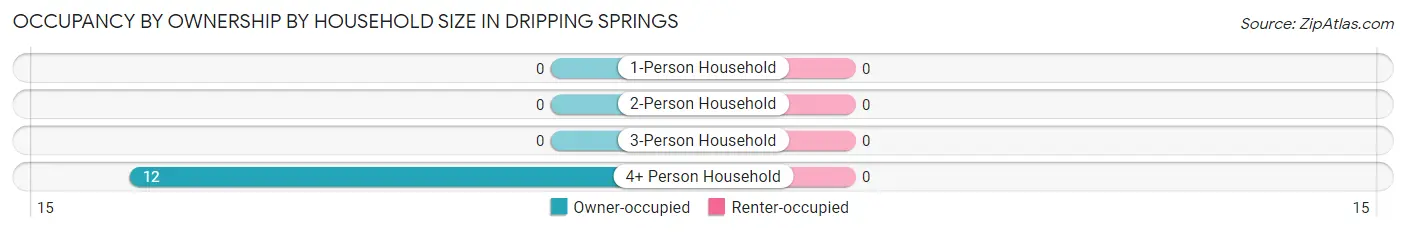
| Household Size | Owner-occupied | Renter-occupied |
| 1-Person Household | 0 (0.0%) | 0 (0.0%) |
| 2-Person Household | 0 (0.0%) | 0 (0.0%) |
| 3-Person Household | 0 (0.0%) | 0 (0.0%) |
| 4+ Person Household | 12 (100.0%) | 0 (0.0%) |
| Total Housing Units | 12 (100.0%) | 0 (0.0%) |
Occupancy by Educational Attainment in Dripping Springs
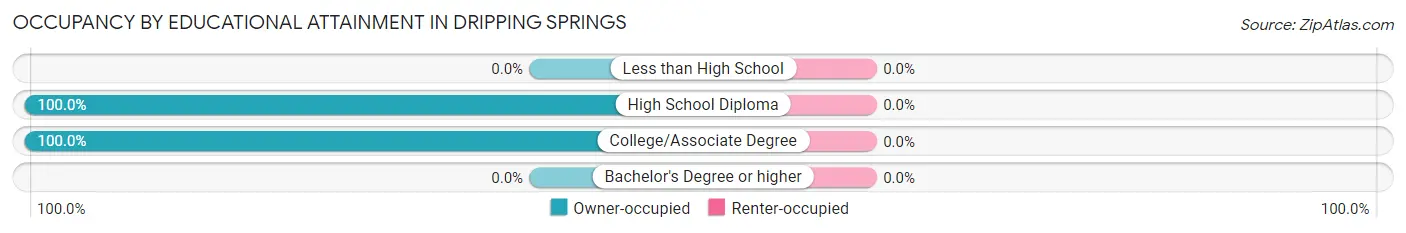
| Household Size | Owner-occupied | Renter-occupied |
| Less than High School | 0 (0.0%) | 0 (0.0%) |
| High School Diploma | 6 (100.0%) | 0 (0.0%) |
| College/Associate Degree | 6 (100.0%) | 0 (0.0%) |
| Bachelor's Degree or higher | 0 (0.0%) | 0 (0.0%) |
Occupancy by Age of Householder in Dripping Springs
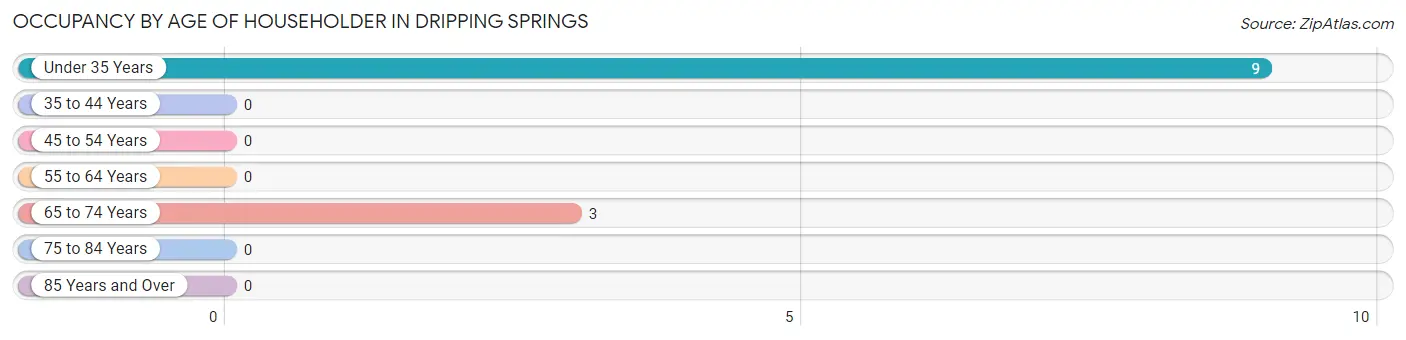
| Age Bracket | # Households | % Households |
| Under 35 Years | 9 | 75.0% |
| 35 to 44 Years | 0 | 0.0% |
| 45 to 54 Years | 0 | 0.0% |
| 55 to 64 Years | 0 | 0.0% |
| 65 to 74 Years | 3 | 25.0% |
| 75 to 84 Years | 0 | 0.0% |
| 85 Years and Over | 0 | 0.0% |
| Total | 12 | 100.0% |
Housing Finances in Dripping Springs
Median Income by Occupancy in Dripping Springs
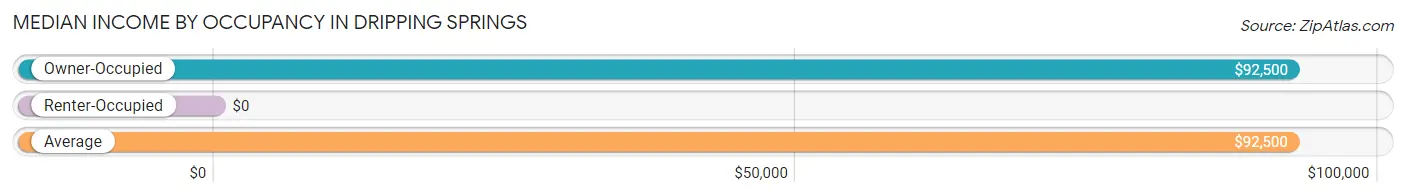
| Occupancy Type | # Households | Median Income |
| Owner-Occupied | 12 (100.0%) | $92,500 |
| Renter-Occupied | 0 (0.0%) | $0 |
| Average | 12 (100.0%) | $92,500 |
Occupancy by Householder Income Bracket in Dripping Springs
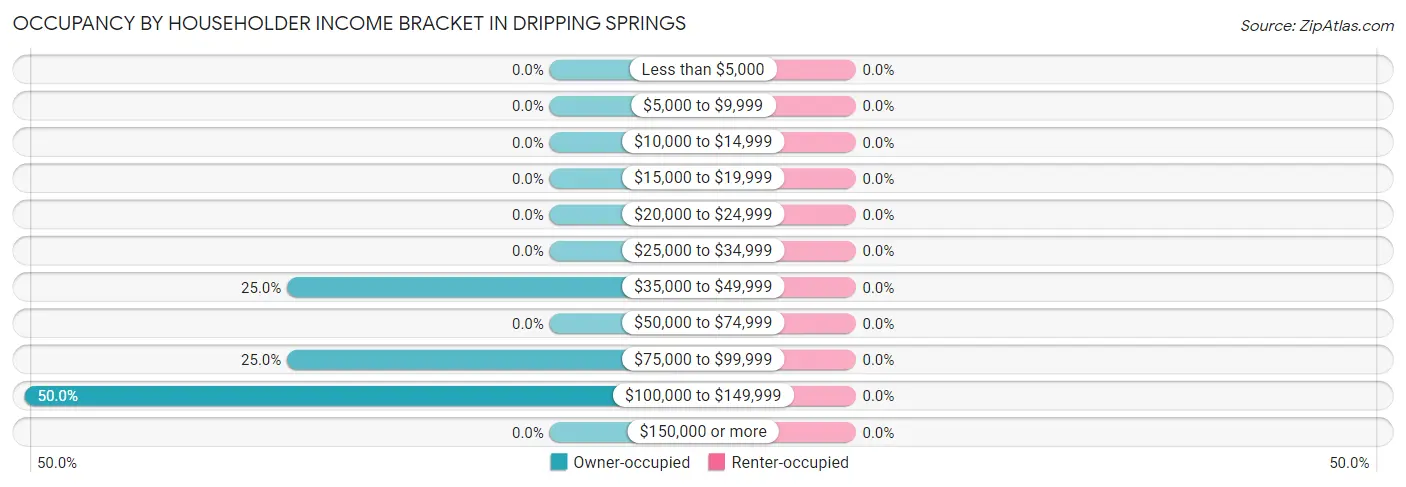
| Income Bracket | Owner-occupied | Renter-occupied |
| Less than $5,000 | 0 (0.0%) | 0 (0.0%) |
| $5,000 to $9,999 | 0 (0.0%) | 0 (0.0%) |
| $10,000 to $14,999 | 0 (0.0%) | 0 (0.0%) |
| $15,000 to $19,999 | 0 (0.0%) | 0 (0.0%) |
| $20,000 to $24,999 | 0 (0.0%) | 0 (0.0%) |
| $25,000 to $34,999 | 0 (0.0%) | 0 (0.0%) |
| $35,000 to $49,999 | 3 (25.0%) | 0 (0.0%) |
| $50,000 to $74,999 | 0 (0.0%) | 0 (0.0%) |
| $75,000 to $99,999 | 3 (25.0%) | 0 (0.0%) |
| $100,000 to $149,999 | 6 (50.0%) | 0 (0.0%) |
| $150,000 or more | 0 (0.0%) | 0 (0.0%) |
| Total | 12 (100.0%) | 0 (0.0%) |
Monthly Housing Cost Tiers in Dripping Springs
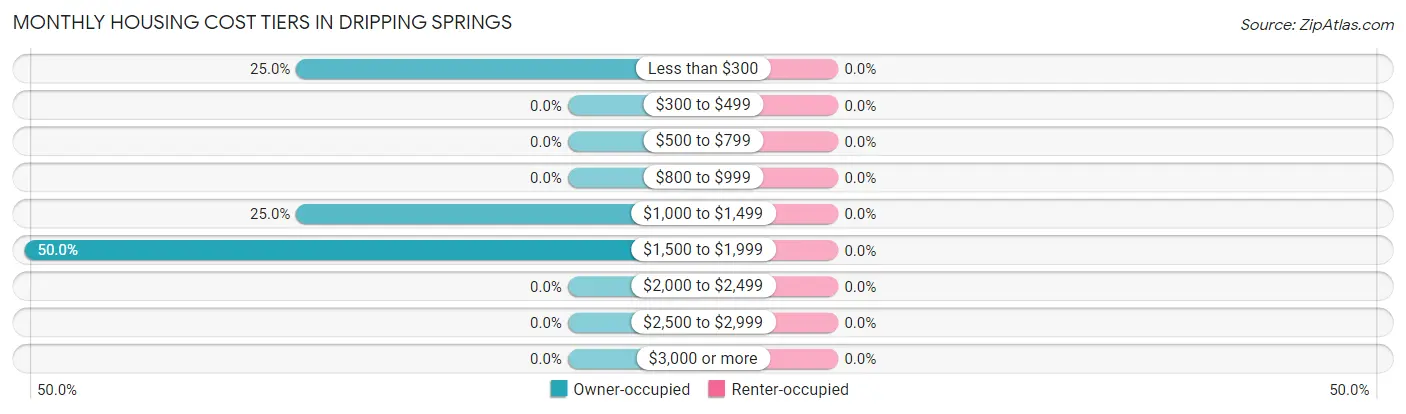
| Monthly Cost | Owner-occupied | Renter-occupied |
| Less than $300 | 3 (25.0%) | 0 (0.0%) |
| $300 to $499 | 0 (0.0%) | 0 (0.0%) |
| $500 to $799 | 0 (0.0%) | 0 (0.0%) |
| $800 to $999 | 0 (0.0%) | 0 (0.0%) |
| $1,000 to $1,499 | 3 (25.0%) | 0 (0.0%) |
| $1,500 to $1,999 | 6 (50.0%) | 0 (0.0%) |
| $2,000 to $2,499 | 0 (0.0%) | 0 (0.0%) |
| $2,500 to $2,999 | 0 (0.0%) | 0 (0.0%) |
| $3,000 or more | 0 (0.0%) | 0 (0.0%) |
| Total | 12 (100.0%) | 0 (0.0%) |
Physical Housing Characteristics in Dripping Springs
Housing Structures in Dripping Springs
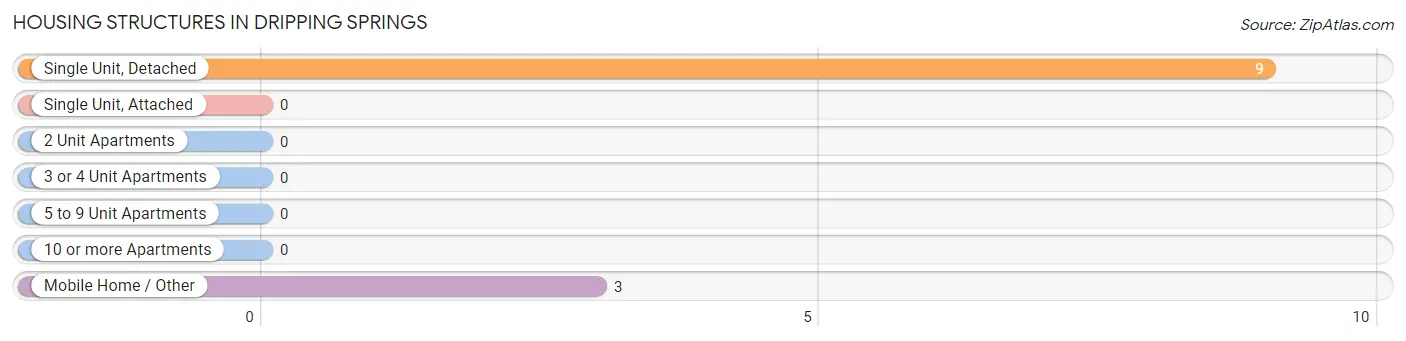
| Structure Type | # Housing Units | % Housing Units |
| Single Unit, Detached | 9 | 75.0% |
| Single Unit, Attached | 0 | 0.0% |
| 2 Unit Apartments | 0 | 0.0% |
| 3 or 4 Unit Apartments | 0 | 0.0% |
| 5 to 9 Unit Apartments | 0 | 0.0% |
| 10 or more Apartments | 0 | 0.0% |
| Mobile Home / Other | 3 | 25.0% |
| Total | 12 | 100.0% |
Housing Structures by Occupancy in Dripping Springs
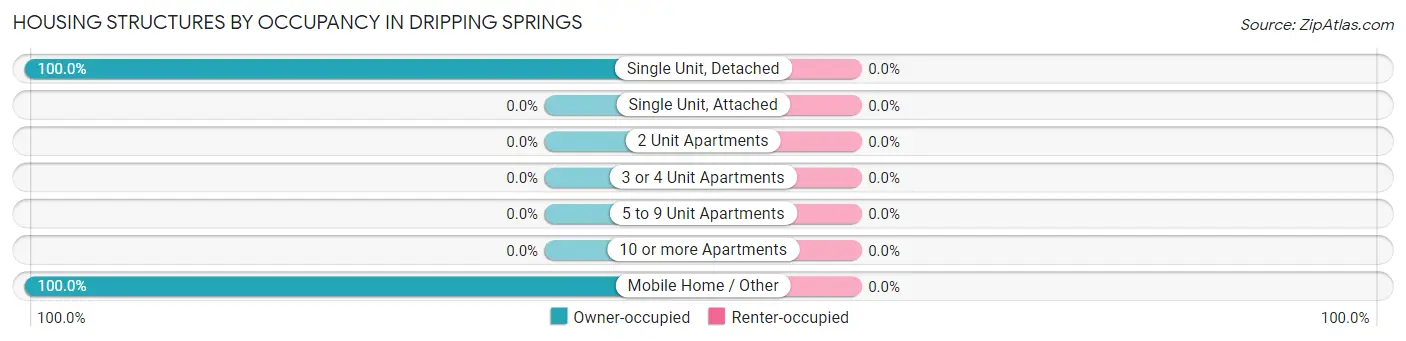
| Structure Type | Owner-occupied | Renter-occupied |
| Single Unit, Detached | 9 (100.0%) | 0 (0.0%) |
| Single Unit, Attached | 0 (0.0%) | 0 (0.0%) |
| 2 Unit Apartments | 0 (0.0%) | 0 (0.0%) |
| 3 or 4 Unit Apartments | 0 (0.0%) | 0 (0.0%) |
| 5 to 9 Unit Apartments | 0 (0.0%) | 0 (0.0%) |
| 10 or more Apartments | 0 (0.0%) | 0 (0.0%) |
| Mobile Home / Other | 3 (100.0%) | 0 (0.0%) |
| Total | 12 (100.0%) | 0 (0.0%) |
Housing Structures by Number of Rooms in Dripping Springs
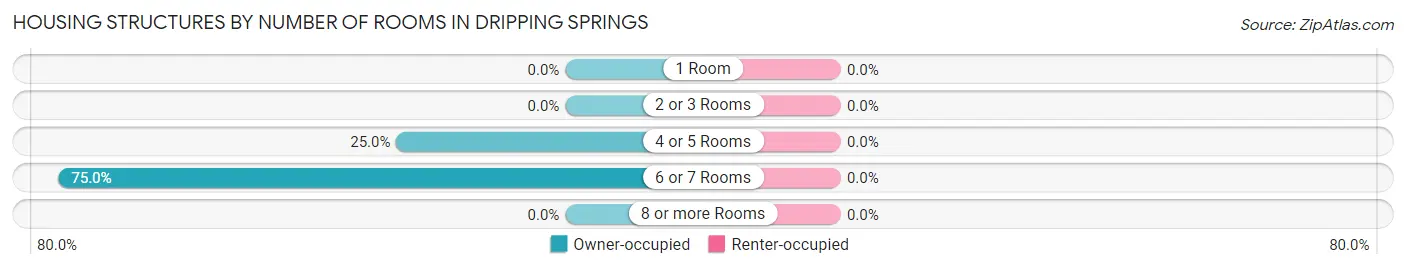
| Number of Rooms | Owner-occupied | Renter-occupied |
| 1 Room | 0 (0.0%) | 0 (0.0%) |
| 2 or 3 Rooms | 0 (0.0%) | 0 (0.0%) |
| 4 or 5 Rooms | 3 (25.0%) | 0 (0.0%) |
| 6 or 7 Rooms | 9 (75.0%) | 0 (0.0%) |
| 8 or more Rooms | 0 (0.0%) | 0 (0.0%) |
| Total | 12 (100.0%) | 0 (0.0%) |
Housing Structure by Heating Type in Dripping Springs
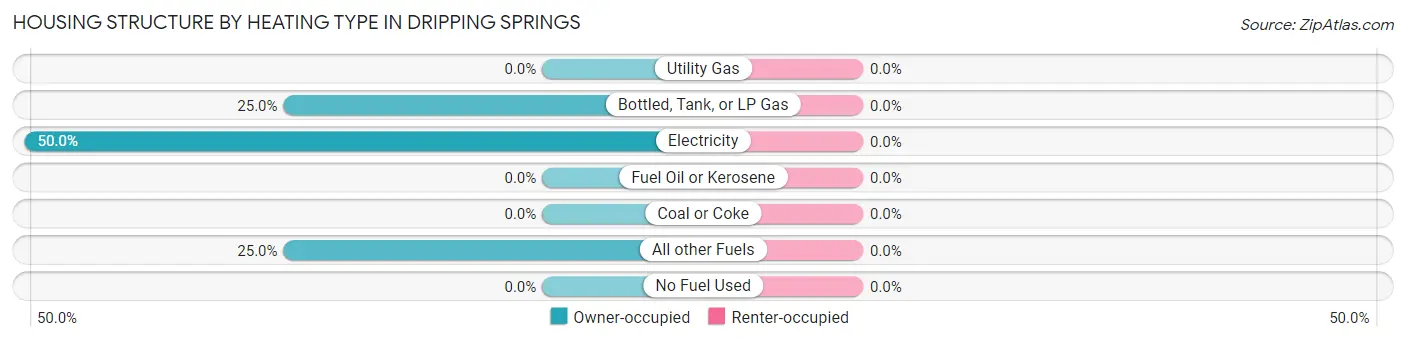
| Heating Type | Owner-occupied | Renter-occupied |
| Utility Gas | 0 (0.0%) | 0 (0.0%) |
| Bottled, Tank, or LP Gas | 3 (25.0%) | 0 (0.0%) |
| Electricity | 6 (50.0%) | 0 (0.0%) |
| Fuel Oil or Kerosene | 0 (0.0%) | 0 (0.0%) |
| Coal or Coke | 0 (0.0%) | 0 (0.0%) |
| All other Fuels | 3 (25.0%) | 0 (0.0%) |
| No Fuel Used | 0 (0.0%) | 0 (0.0%) |
| Total | 12 (100.0%) | 0 (0.0%) |
Household Vehicle Usage in Dripping Springs
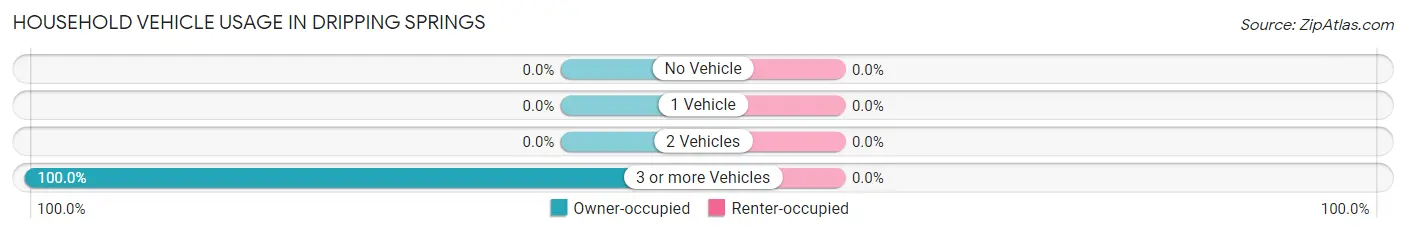
| Vehicles per Household | Owner-occupied | Renter-occupied |
| No Vehicle | 0 (0.0%) | 0 (0.0%) |
| 1 Vehicle | 0 (0.0%) | 0 (0.0%) |
| 2 Vehicles | 0 (0.0%) | 0 (0.0%) |
| 3 or more Vehicles | 12 (100.0%) | 0 (0.0%) |
| Total | 12 (100.0%) | 0 (0.0%) |
Real Estate & Mortgages in Dripping Springs
Real Estate and Mortgage Overview in Dripping Springs
| Characteristic | Without Mortgage | With Mortgage |
| Housing Units | 3 | 9 |
| Median Property Value | - | - |
| Median Household Income | - | - |
| Monthly Housing Costs | - | - |
| Real Estate Taxes | - | - |
Property Value by Mortgage Status in Dripping Springs
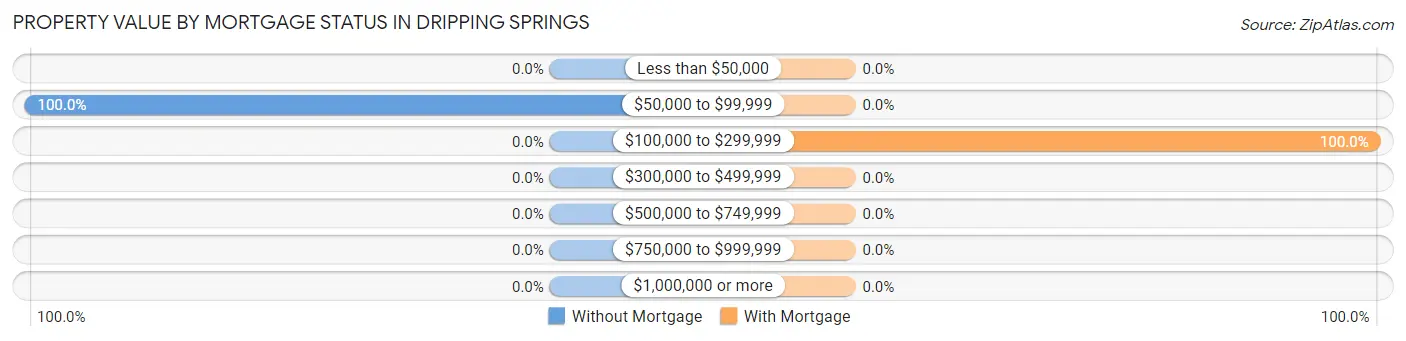
| Property Value | Without Mortgage | With Mortgage |
| Less than $50,000 | 0 (0.0%) | 0 (0.0%) |
| $50,000 to $99,999 | 3 (100.0%) | 0 (0.0%) |
| $100,000 to $299,999 | 0 (0.0%) | 9 (100.0%) |
| $300,000 to $499,999 | 0 (0.0%) | 0 (0.0%) |
| $500,000 to $749,999 | 0 (0.0%) | 0 (0.0%) |
| $750,000 to $999,999 | 0 (0.0%) | 0 (0.0%) |
| $1,000,000 or more | 0 (0.0%) | 0 (0.0%) |
| Total | 3 (100.0%) | 9 (100.0%) |
Household Income by Mortgage Status in Dripping Springs
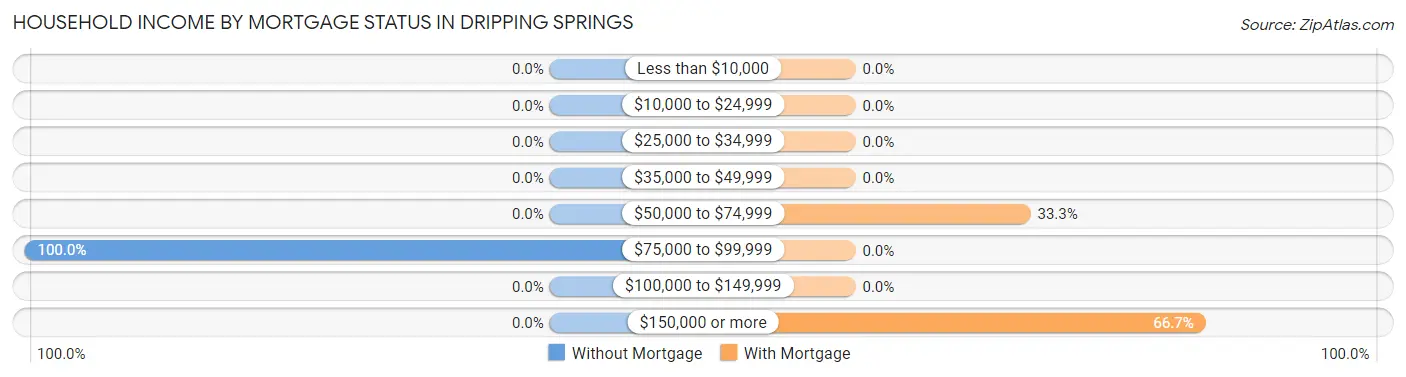
| Household Income | Without Mortgage | With Mortgage |
| Less than $10,000 | 0 (0.0%) | 0 (0.0%) |
| $10,000 to $24,999 | 0 (0.0%) | 0 (0.0%) |
| $25,000 to $34,999 | 0 (0.0%) | 0 (0.0%) |
| $35,000 to $49,999 | 0 (0.0%) | 0 (0.0%) |
| $50,000 to $74,999 | 0 (0.0%) | 3 (33.3%) |
| $75,000 to $99,999 | 3 (100.0%) | 0 (0.0%) |
| $100,000 to $149,999 | 0 (0.0%) | 0 (0.0%) |
| $150,000 or more | 0 (0.0%) | 6 (66.7%) |
| Total | 3 (100.0%) | 9 (100.0%) |
Property Value to Household Income Ratio in Dripping Springs
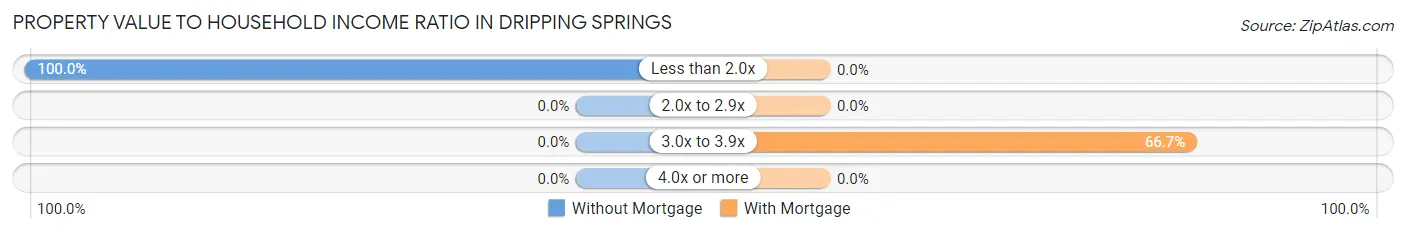
| Value-to-Income Ratio | Without Mortgage | With Mortgage |
| Less than 2.0x | 3 (100.0%) | 0 (0.0%) |
| 2.0x to 2.9x | 0 (0.0%) | 0 (0.0%) |
| 3.0x to 3.9x | 0 (0.0%) | 6 (66.7%) |
| 4.0x or more | 0 (0.0%) | 0 (0.0%) |
| Total | 3 (100.0%) | 9 (100.0%) |
Real Estate Taxes by Mortgage Status in Dripping Springs
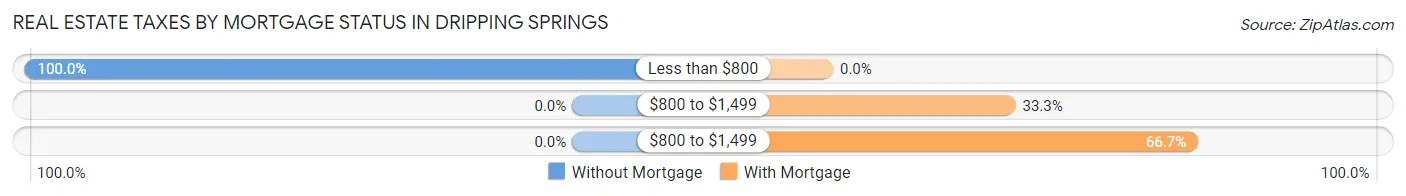
| Property Taxes | Without Mortgage | With Mortgage |
| Less than $800 | 3 (100.0%) | 0 (0.0%) |
| $800 to $1,499 | 0 (0.0%) | 3 (33.3%) |
| $800 to $1,499 | 0 (0.0%) | 6 (66.7%) |
| Total | 3 (100.0%) | 9 (100.0%) |
Health & Disability in Dripping Springs
Health Insurance Coverage by Age in Dripping Springs
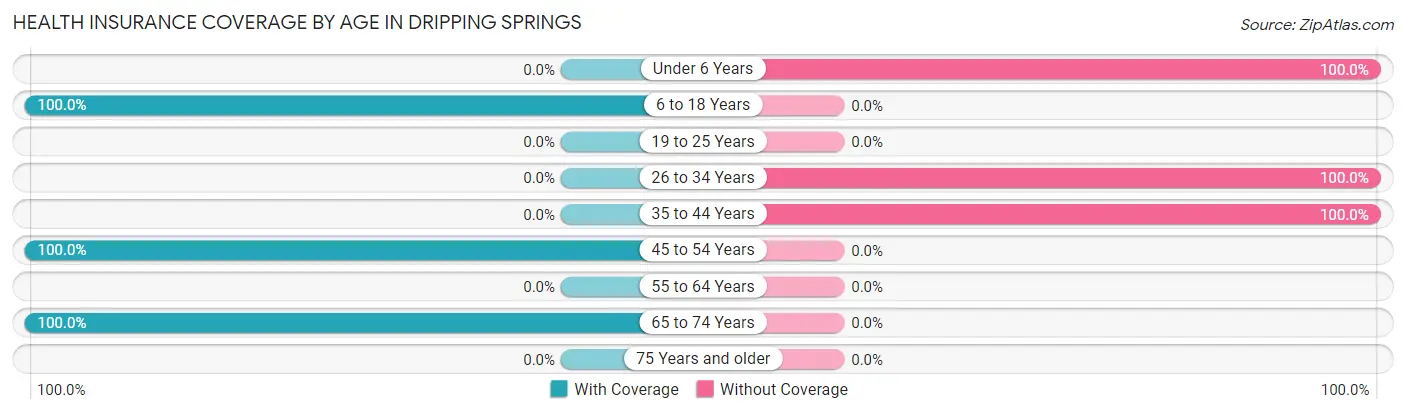
| Age Bracket | With Coverage | Without Coverage |
| Under 6 Years | 0 (0.0%) | 3 (100.0%) |
| 6 to 18 Years | 13 (100.0%) | 0 (0.0%) |
| 19 to 25 Years | 0 (0.0%) | 0 (0.0%) |
| 26 to 34 Years | 0 (0.0%) | 17 (100.0%) |
| 35 to 44 Years | 0 (0.0%) | 6 (100.0%) |
| 45 to 54 Years | 2 (100.0%) | 0 (0.0%) |
| 55 to 64 Years | 0 (0.0%) | 0 (0.0%) |
| 65 to 74 Years | 5 (100.0%) | 0 (0.0%) |
| 75 Years and older | 0 (0.0%) | 0 (0.0%) |
| Total | 20 (43.5%) | 26 (56.5%) |
Health Insurance Coverage by Citizenship Status in Dripping Springs
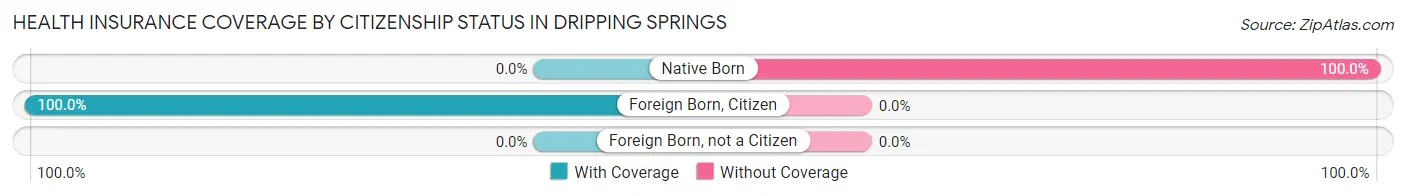
| Citizenship Status | With Coverage | Without Coverage |
| Native Born | 0 (0.0%) | 3 (100.0%) |
| Foreign Born, Citizen | 13 (100.0%) | 0 (0.0%) |
| Foreign Born, not a Citizen | 0 (0.0%) | 0 (0.0%) |
Health Insurance Coverage by Household Income in Dripping Springs
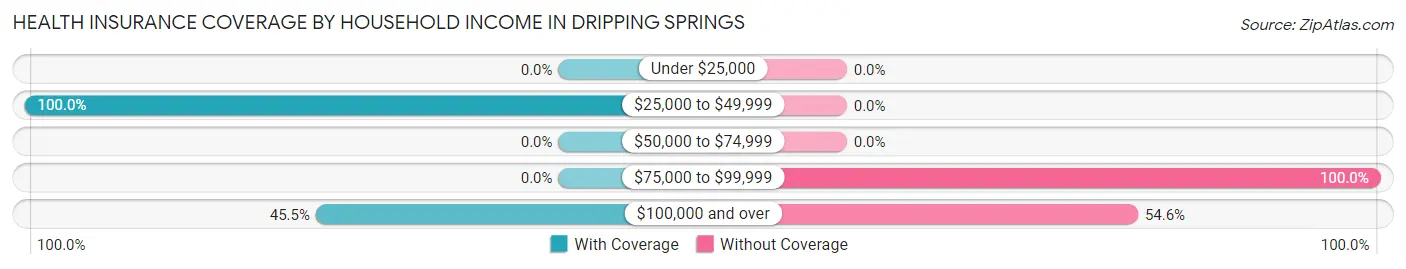
| Household Income | With Coverage | Without Coverage |
| Under $25,000 | 0 (0.0%) | 0 (0.0%) |
| $25,000 to $49,999 | 10 (100.0%) | 0 (0.0%) |
| $50,000 to $74,999 | 0 (0.0%) | 0 (0.0%) |
| $75,000 to $99,999 | 0 (0.0%) | 14 (100.0%) |
| $100,000 and over | 10 (45.5%) | 12 (54.5%) |
Public vs Private Health Insurance Coverage by Age in Dripping Springs
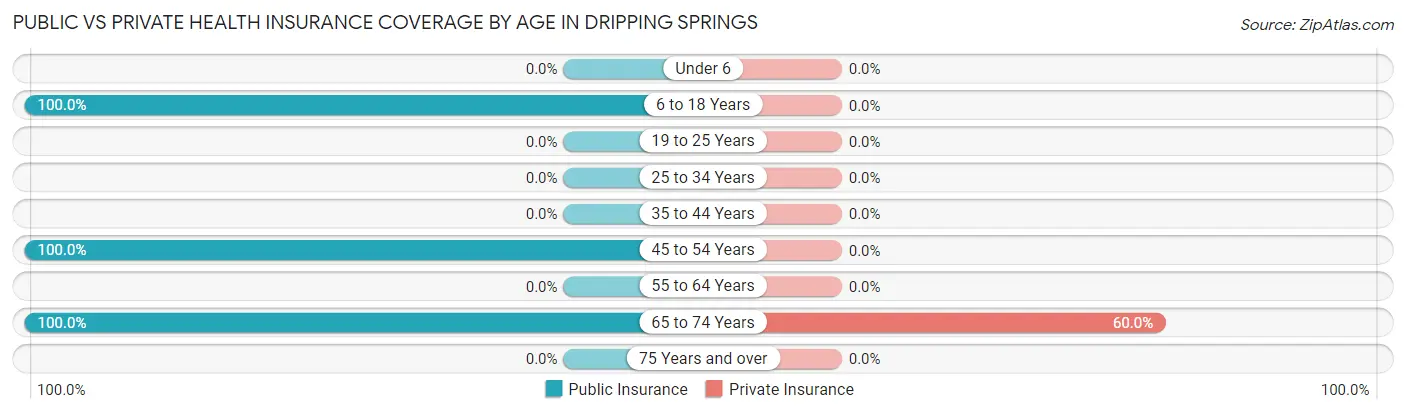
| Age Bracket | Public Insurance | Private Insurance |
| Under 6 | 0 (0.0%) | 0 (0.0%) |
| 6 to 18 Years | 13 (100.0%) | 0 (0.0%) |
| 19 to 25 Years | 0 (0.0%) | 0 (0.0%) |
| 25 to 34 Years | 0 (0.0%) | 0 (0.0%) |
| 35 to 44 Years | 0 (0.0%) | 0 (0.0%) |
| 45 to 54 Years | 2 (100.0%) | 0 (0.0%) |
| 55 to 64 Years | 0 (0.0%) | 0 (0.0%) |
| 65 to 74 Years | 5 (100.0%) | 3 (60.0%) |
| 75 Years and over | 0 (0.0%) | 0 (0.0%) |
| Total | 20 (43.5%) | 3 (6.5%) |
Disability Status by Sex by Age in Dripping Springs
| Age Bracket | Male | Female |
| Under 5 Years | 0 (0.0%) | 0 (0.0%) |
| 5 to 17 Years | 0 (0.0%) | 0 (0.0%) |
| 18 to 34 Years | 0 (0.0%) | 0 (0.0%) |
| 35 to 64 Years | 0 (0.0%) | 0 (0.0%) |
| 65 to 74 Years | 0 (0.0%) | 0 (0.0%) |
| 75 Years and over | 0 (0.0%) | 0 (0.0%) |
Disability Class by Sex by Age in Dripping Springs
Disability Class: Hearing Difficulty
| Age Bracket | Male | Female |
| Under 5 Years | 0 (0.0%) | 0 (0.0%) |
| 5 to 17 Years | 0 (0.0%) | 0 (0.0%) |
| 18 to 34 Years | 0 (0.0%) | 0 (0.0%) |
| 35 to 64 Years | 0 (0.0%) | 0 (0.0%) |
| 65 to 74 Years | 0 (0.0%) | 0 (0.0%) |
| 75 Years and over | 0 (0.0%) | 0 (0.0%) |
Disability Class: Vision Difficulty
| Age Bracket | Male | Female |
| Under 5 Years | 0 (0.0%) | 0 (0.0%) |
| 5 to 17 Years | 0 (0.0%) | 0 (0.0%) |
| 18 to 34 Years | 0 (0.0%) | 0 (0.0%) |
| 35 to 64 Years | 0 (0.0%) | 0 (0.0%) |
| 65 to 74 Years | 0 (0.0%) | 0 (0.0%) |
| 75 Years and over | 0 (0.0%) | 0 (0.0%) |
Disability Class: Cognitive Difficulty
| Age Bracket | Male | Female |
| 5 to 17 Years | 0 (0.0%) | 0 (0.0%) |
| 18 to 34 Years | 0 (0.0%) | 0 (0.0%) |
| 35 to 64 Years | 0 (0.0%) | 0 (0.0%) |
| 65 to 74 Years | 0 (0.0%) | 0 (0.0%) |
| 75 Years and over | 0 (0.0%) | 0 (0.0%) |
Disability Class: Ambulatory Difficulty
| Age Bracket | Male | Female |
| 5 to 17 Years | 0 (0.0%) | 0 (0.0%) |
| 18 to 34 Years | 0 (0.0%) | 0 (0.0%) |
| 35 to 64 Years | 0 (0.0%) | 0 (0.0%) |
| 65 to 74 Years | 0 (0.0%) | 0 (0.0%) |
| 75 Years and over | 0 (0.0%) | 0 (0.0%) |
Disability Class: Self-Care Difficulty
| Age Bracket | Male | Female |
| 5 to 17 Years | 0 (0.0%) | 0 (0.0%) |
| 18 to 34 Years | 0 (0.0%) | 0 (0.0%) |
| 35 to 64 Years | 0 (0.0%) | 0 (0.0%) |
| 65 to 74 Years | 0 (0.0%) | 0 (0.0%) |
| 75 Years and over | 0 (0.0%) | 0 (0.0%) |
Technology Access in Dripping Springs
Computing Device Access in Dripping Springs
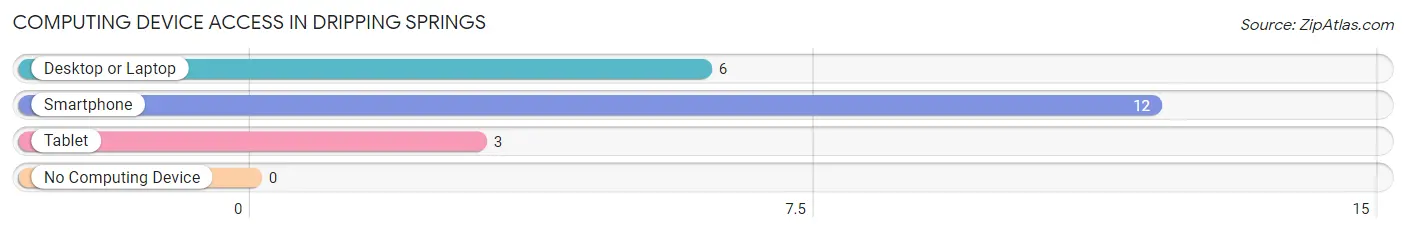
| Device Type | # Households | % Households |
| Desktop or Laptop | 6 | 50.0% |
| Smartphone | 12 | 100.0% |
| Tablet | 3 | 25.0% |
| No Computing Device | 0 | 0.0% |
| Total | 12 | 100.0% |
Internet Access in Dripping Springs
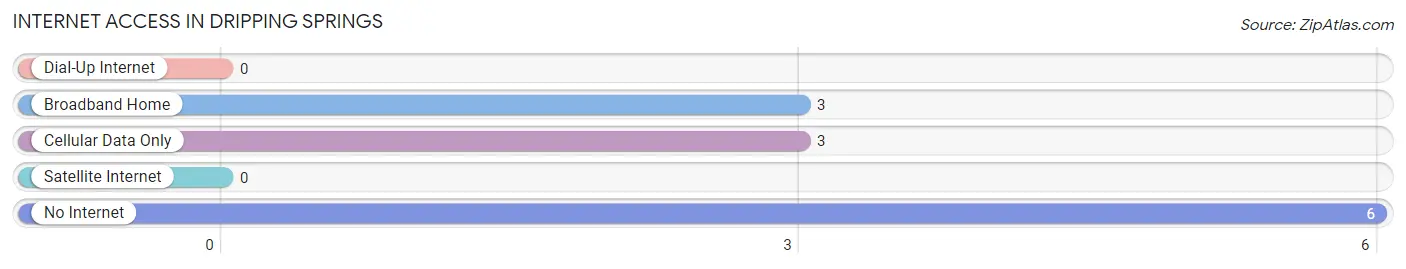
| Internet Type | # Households | % Households |
| Dial-Up Internet | 0 | 0.0% |
| Broadband Home | 3 | 25.0% |
| Cellular Data Only | 3 | 25.0% |
| Satellite Internet | 0 | 0.0% |
| No Internet | 6 | 50.0% |
| Total | 12 | 100.0% |
Dripping Springs Summary
Dripping Springs is a small town located in Oklahoma, United States. It is situated in the southeastern part of the state, about 25 miles south of Oklahoma City. The town is part of the Oklahoma City metropolitan area and is home to a population of just over 1,000 people.
History
Dripping Springs was founded in 1891 by a group of settlers from Texas. The town was named after a nearby spring that was said to have a “dripping” sound. The settlers were attracted to the area due to its fertile soil and abundant water supply. The town quickly grew and by the early 1900s, it had become a thriving agricultural community.
In the early 1900s, the town was home to a variety of businesses, including a general store, a blacksmith shop, a livery stable, and a hotel. The town also had a school, a post office, and a church.
In the 1920s, the town began to decline as the agricultural industry in the area began to suffer. The Great Depression further exacerbated the town’s economic woes and by the 1940s, the population had dwindled to just over 500 people.
In the 1950s, the town began to experience a resurgence as the oil and gas industry began to boom in the area. This led to an influx of new residents and businesses, and the population of Dripping Springs began to grow once again.
Geography
Dripping Springs is located in southeastern Oklahoma, about 25 miles south of Oklahoma City. The town is situated in the Cross Timbers region of the state, which is characterized by rolling hills and wooded areas. The town is located in an area of the state known as “Tornado Alley” due to its frequent tornadoes.
The town is situated on the banks of the North Canadian River, which provides a source of water for the town. The town is also located near several lakes, including Lake Thunderbird, Lake Texoma, and Lake Murray.
Economy
The economy of Dripping Springs is largely based on agriculture and oil and gas production. The town is home to several farms, which produce a variety of crops, including corn, wheat, soybeans, and cotton. The town is also home to several oil and gas production companies, which provide jobs for many of the town’s residents.
In addition to agriculture and oil and gas production, the town is also home to several small businesses, including restaurants, retail stores, and service providers. The town is also home to a number of tourist attractions, including a museum, a golf course, and a water park.
Demographics
As of the 2010 census, the population of Dripping Springs was 1,072. The town is predominantly white, with about 90% of the population identifying as such. The town also has a small Hispanic population, with about 5% of the population identifying as such. The town also has a small African American population, with about 2% of the population identifying as such.
The median household income in Dripping Springs is $41,250, which is slightly lower than the national median of $50,221. The town also has a poverty rate of about 15%, which is slightly higher than the national average of 13.5%.
Conclusion
Dripping Springs is a small town located in southeastern Oklahoma. The town was founded in 1891 and has a population of just over 1,000 people. The town’s economy is largely based on agriculture and oil and gas production, and the town is home to a variety of small businesses. The town is predominantly white, with a small Hispanic and African American population. The median household income in Dripping Springs is slightly lower than the national average, and the town has a poverty rate of about 15%.
Common Questions
What is Per Capita Income in Dripping Springs?
Per Capita income in Dripping Springs is $22,346.
What is the Median Household income in Dripping Springs?
Median Household Income in Dripping Springs is $92,500.
What is Inequality or Gini Index in Dripping Springs?
Inequality or Gini Index in Dripping Springs is 0.15.
What is the Total Population of Dripping Springs?
Total Population of Dripping Springs is 46.
What is the Total Male Population of Dripping Springs?
Total Male Population of Dripping Springs is 18.
What is the Total Female Population of Dripping Springs?
Total Female Population of Dripping Springs is 28.
What is the Ratio of Males per 100 Females in Dripping Springs?
There are 64.29 Males per 100 Females in Dripping Springs.
What is the Ratio of Females per 100 Males in Dripping Springs?
There are 155.56 Females per 100 Males in Dripping Springs.
What is the Median Population Age in Dripping Springs?
Median Population Age in Dripping Springs is 29.8 Years.
What is the Average Family Size in Dripping Springs
Average Family Size in Dripping Springs is 3.3 People.
What is the Average Household Size in Dripping Springs
Average Household Size in Dripping Springs is 3.8 People.
How Large is the Labor Force in Dripping Springs?
There are 25 People in the Labor Forcein in Dripping Springs.
What is the Percentage of People in the Labor Force in Dripping Springs?
83.3% of People are in the Labor Force in Dripping Springs.
What is the Unemployment Rate in Dripping Springs?
Unemployment Rate in Dripping Springs is 8.0%.