Zip Codes with the Highest Percentage of Population Employed in Life, Physical & Social Science in Roswell, NM
RELATED REPORTS & OPTIONS
Life, Physical & Social Science
Roswell
Compare Zip Codes
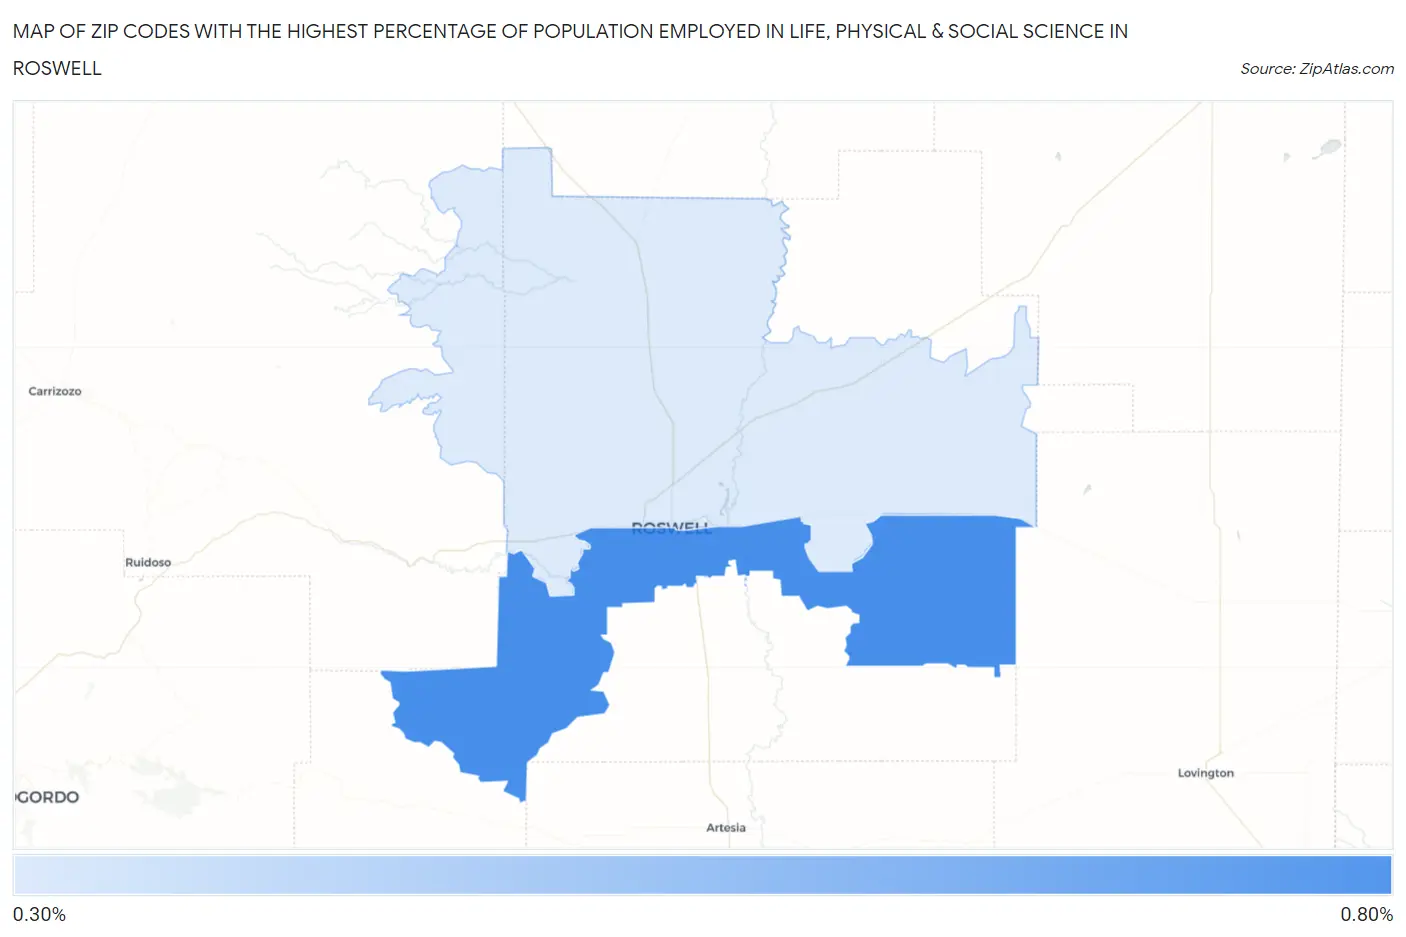
Map of Zip Codes with the Highest Percentage of Population Employed in Life, Physical & Social Science in Roswell
0.36%
0.75%
Zip Codes with the Highest Percentage of Population Employed in Life, Physical & Social Science in Roswell, NM
| Zip Code | % Employed | vs State | vs National | |
| 1. | 88203 | 0.75% | 1.7%(-0.948)#108 | 1.1%(-0.337)#11,461 |
| 2. | 88201 | 0.36% | 1.7%(-1.34)#125 | 1.1%(-0.728)#16,244 |
1
Common Questions
What are the Top Zip Codes with the Highest Percentage of Population Employed in Life, Physical & Social Science in Roswell, NM?
Top Zip Codes with the Highest Percentage of Population Employed in Life, Physical & Social Science in Roswell, NM are:
What zip code has the Highest Percentage of Population Employed in Life, Physical & Social Science in Roswell, NM?
88203 has the Highest Percentage of Population Employed in Life, Physical & Social Science in Roswell, NM with 0.75%.
What is the Percentage of Population Employed in Life, Physical & Social Science in Roswell, NM?
Percentage of Population Employed in Life, Physical & Social Science in Roswell is 0.42%.
What is the Percentage of Population Employed in Life, Physical & Social Science in New Mexico?
Percentage of Population Employed in Life, Physical & Social Science in New Mexico is 1.7%.
What is the Percentage of Population Employed in Life, Physical & Social Science in the United States?
Percentage of Population Employed in Life, Physical & Social Science in the United States is 1.1%.