Sombrillo, NM Map & Demographics
Sombrillo Map
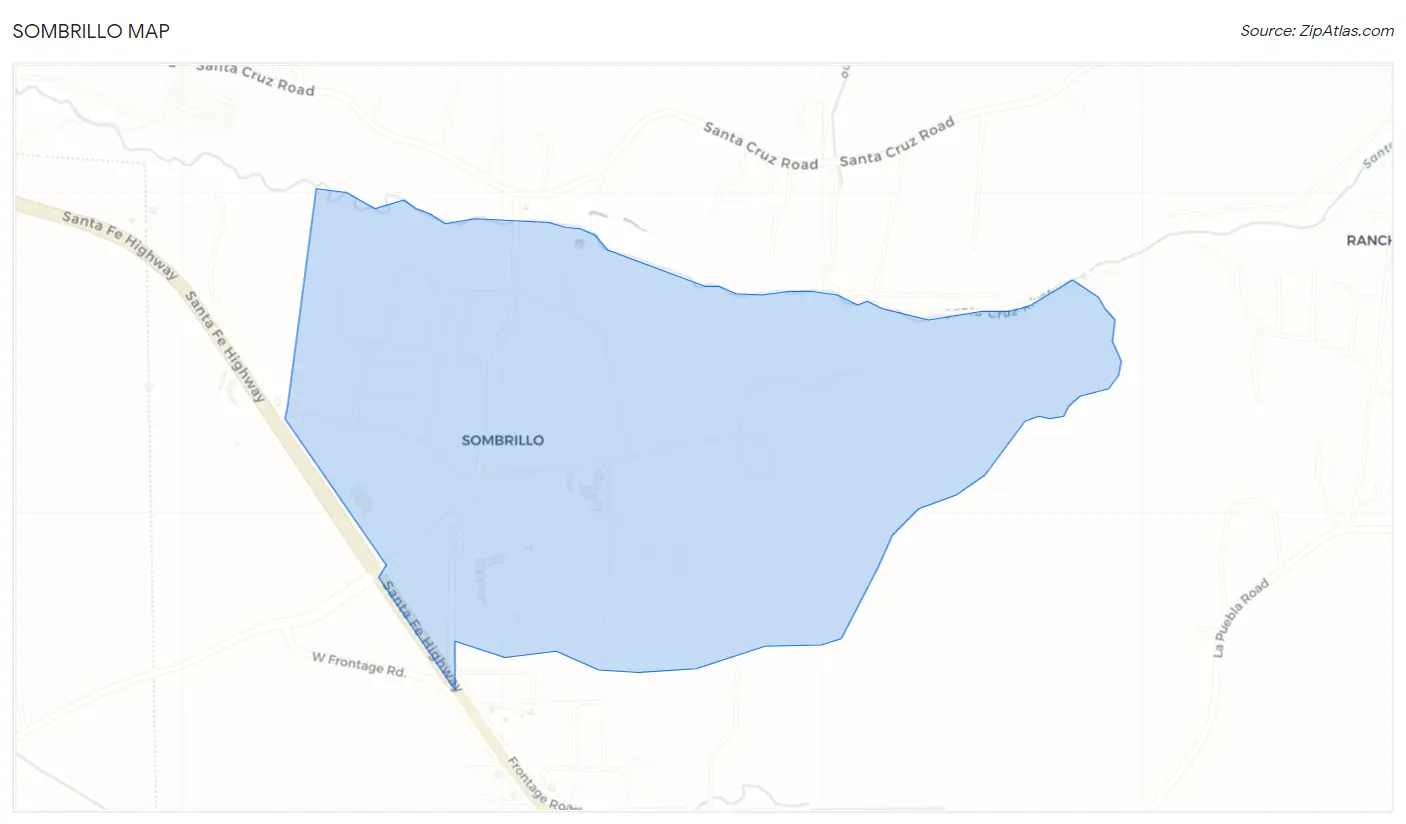
Sombrillo Overview
$60,278
PER CAPITA INCOME
$174,375
AVG FAMILY INCOME
$175,234
AVG HOUSEHOLD INCOME
0.35
INEQUALITY / GINI INDEX
120
TOTAL POPULATION
44
MALE POPULATION
76
FEMALE POPULATION
57.89
MALES / 100 FEMALES
172.73
FEMALES / 100 MALES
63.0
MEDIAN AGE
2.6
AVG FAMILY SIZE
2.5
AVG HOUSEHOLD SIZE
40
LABOR FORCE [ PEOPLE ]
38.1%
PERCENT IN LABOR FORCE
Income in Sombrillo
Income Overview in Sombrillo
Per Capita Income in Sombrillo is $60,278, while median incomes of families and households are $174,375 and $175,234 respectively.
| Characteristic | Number | Measure |
| Per Capita Income | 120 | $60,278 |
| Median Family Income | 39 | $174,375 |
| Mean Family Income | 39 | $134,115 |
| Median Household Income | 47 | $175,234 |
| Mean Household Income | 47 | $135,466 |
| Income Deficit | 39 | $0 |
| Wage / Income Gap (%) | 120 | 0.00% |
| Wage / Income Gap ($) | 120 | 100.00¢ per $1 |
| Gini / Inequality Index | 120 | 0.35 |
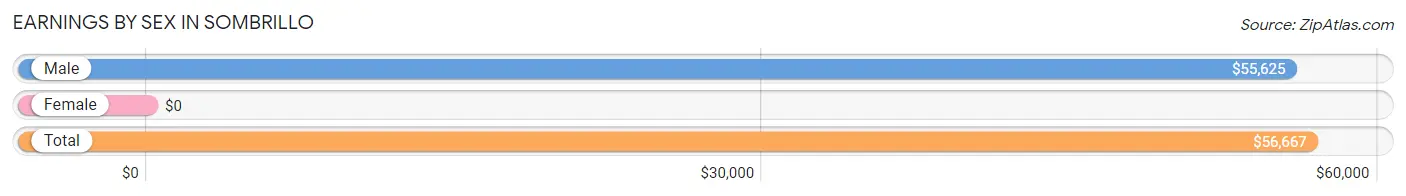
Earnings by Sex in Sombrillo
| Sex | Number | Average Earnings |
| Male | 15 (35.7%) | $55,625 |
| Female | 27 (64.3%) | $0 |
| Total | 42 (100.0%) | $56,667 |
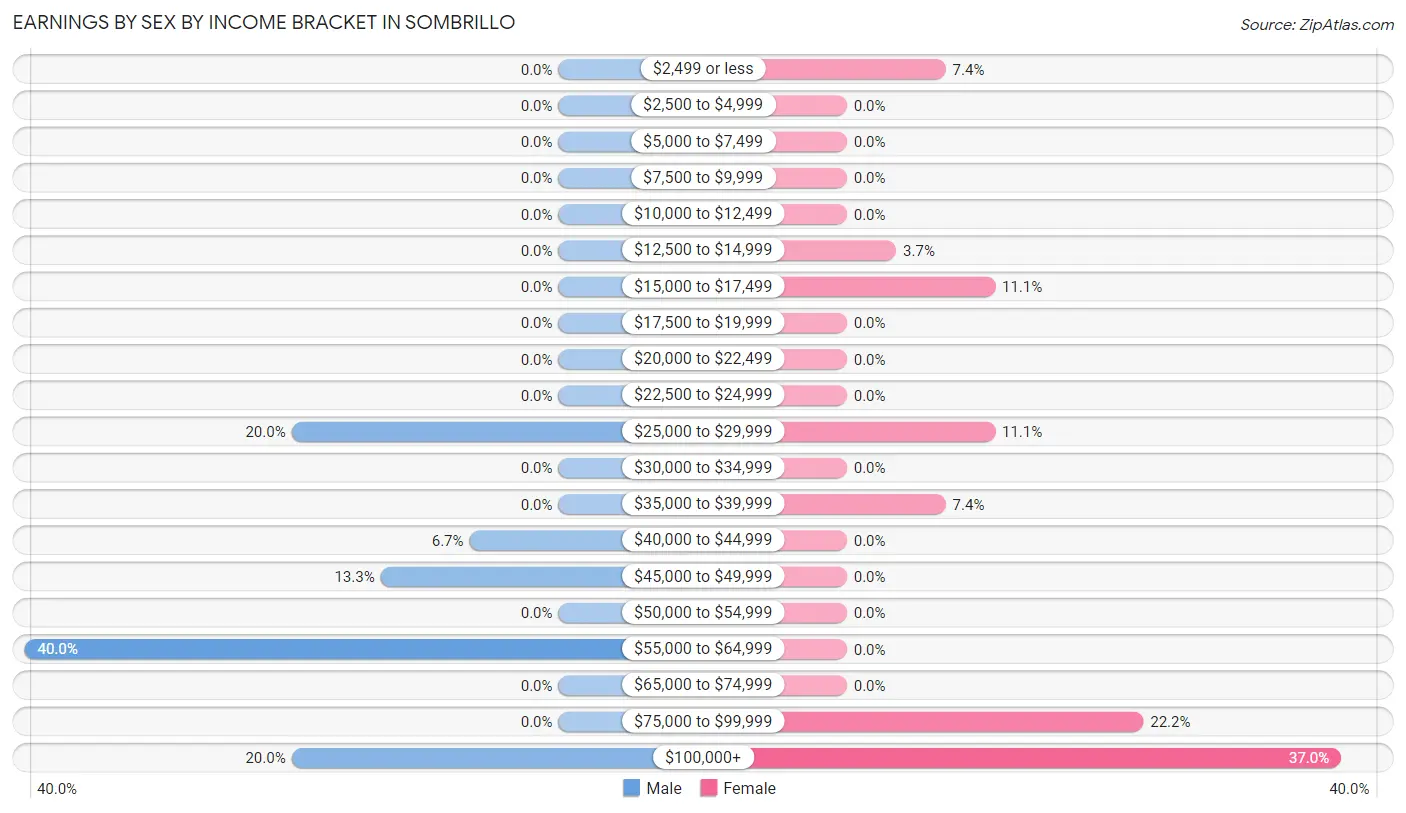
Earnings by Sex by Income Bracket in Sombrillo
The most common earnings brackets in Sombrillo are $55,000 to $64,999 for men (6 | 40.0%) and $100,000+ for women (10 | 37.0%).
| Income | Male | Female |
| $2,499 or less | 0 (0.0%) | 2 (7.4%) |
| $2,500 to $4,999 | 0 (0.0%) | 0 (0.0%) |
| $5,000 to $7,499 | 0 (0.0%) | 0 (0.0%) |
| $7,500 to $9,999 | 0 (0.0%) | 0 (0.0%) |
| $10,000 to $12,499 | 0 (0.0%) | 0 (0.0%) |
| $12,500 to $14,999 | 0 (0.0%) | 1 (3.7%) |
| $15,000 to $17,499 | 0 (0.0%) | 3 (11.1%) |
| $17,500 to $19,999 | 0 (0.0%) | 0 (0.0%) |
| $20,000 to $22,499 | 0 (0.0%) | 0 (0.0%) |
| $22,500 to $24,999 | 0 (0.0%) | 0 (0.0%) |
| $25,000 to $29,999 | 3 (20.0%) | 3 (11.1%) |
| $30,000 to $34,999 | 0 (0.0%) | 0 (0.0%) |
| $35,000 to $39,999 | 0 (0.0%) | 2 (7.4%) |
| $40,000 to $44,999 | 1 (6.7%) | 0 (0.0%) |
| $45,000 to $49,999 | 2 (13.3%) | 0 (0.0%) |
| $50,000 to $54,999 | 0 (0.0%) | 0 (0.0%) |
| $55,000 to $64,999 | 6 (40.0%) | 0 (0.0%) |
| $65,000 to $74,999 | 0 (0.0%) | 0 (0.0%) |
| $75,000 to $99,999 | 0 (0.0%) | 6 (22.2%) |
| $100,000+ | 3 (20.0%) | 10 (37.0%) |
| Total | 15 (100.0%) | 27 (100.0%) |
Earnings by Sex by Educational Attainment in Sombrillo
| Educational Attainment | Male Income | Female Income |
| Less than High School | - | - |
| High School Diploma | - | - |
| College or Associate's Degree | - | - |
| Bachelor's Degree | - | - |
| Graduate Degree | - | - |
| Total | $55,625 | $0 |
Family Income in Sombrillo
Family Income Brackets in Sombrillo
According to the Sombrillo family income data, there are 18 families falling into the $150,000 to $199,999 income range, which is the most common income bracket and makes up 46.2% of all families.
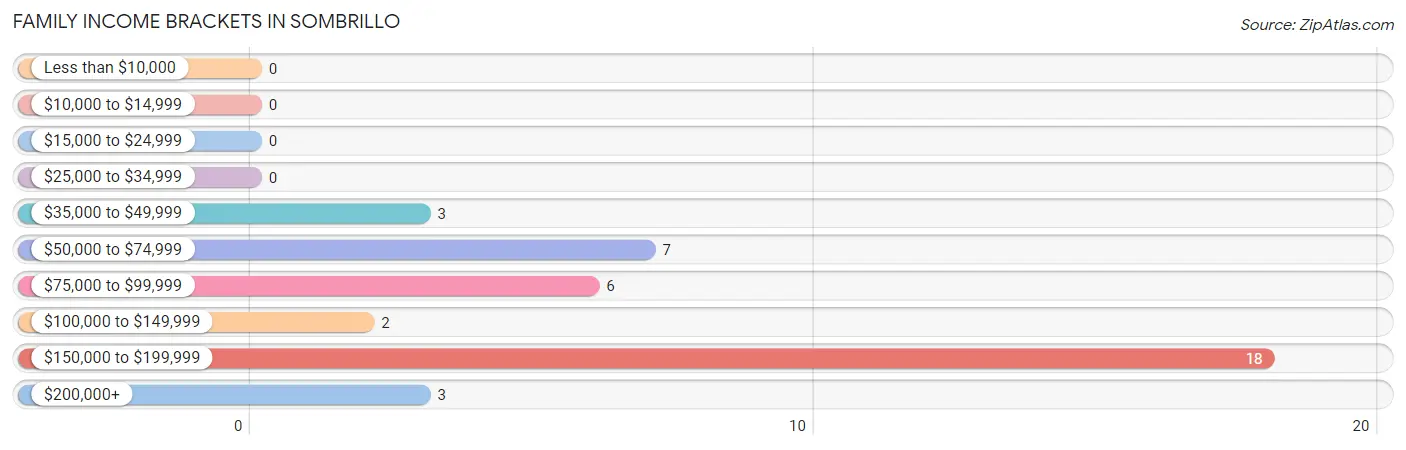
| Income Bracket | # Families | % Families |
| Less than $10,000 | 0 | 0.0% |
| $10,000 to $14,999 | 0 | 0.0% |
| $15,000 to $24,999 | 0 | 0.0% |
| $25,000 to $34,999 | 0 | 0.0% |
| $35,000 to $49,999 | 3 | 7.7% |
| $50,000 to $74,999 | 7 | 17.9% |
| $75,000 to $99,999 | 6 | 15.4% |
| $100,000 to $149,999 | 2 | 5.1% |
| $150,000 to $199,999 | 18 | 46.2% |
| $200,000+ | 3 | 7.7% |
Family Income by Famaliy Size in Sombrillo
2-person families (30 | 76.9%) account for the highest median family income in Sombrillo with $175,156 per family, while 2-person families (30 | 76.9%) have the highest median income of $87,578 per family member.
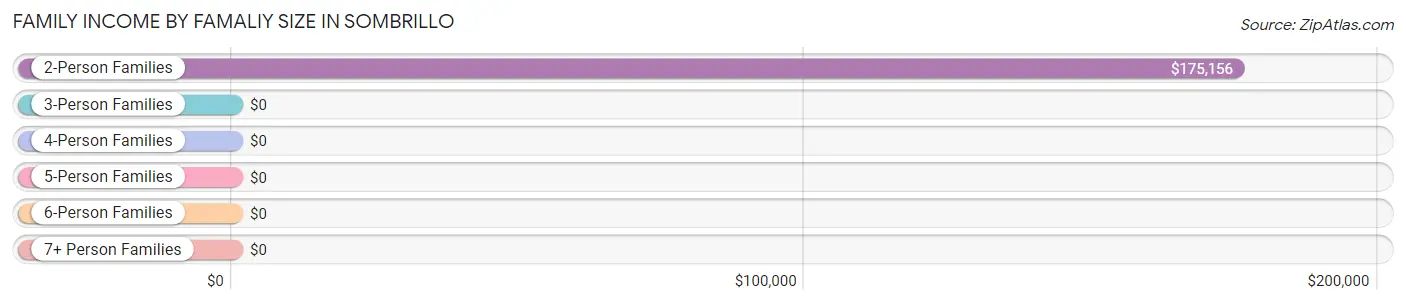
| Income Bracket | # Families | Median Income |
| 2-Person Families | 30 (76.9%) | $175,156 |
| 3-Person Families | 9 (23.1%) | $0 |
| 4-Person Families | 0 (0.0%) | $0 |
| 5-Person Families | 0 (0.0%) | $0 |
| 6-Person Families | 0 (0.0%) | $0 |
| 7+ Person Families | 0 (0.0%) | $0 |
| Total | 39 (100.0%) | $174,375 |
Family Income by Number of Earners in Sombrillo
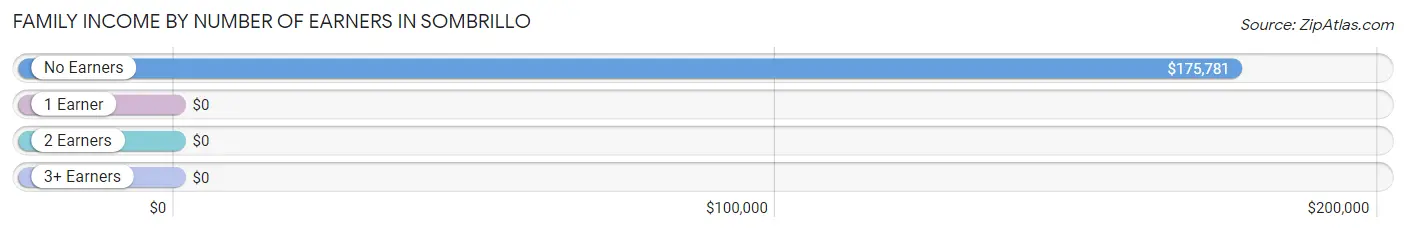
| Number of Earners | # Families | Median Income |
| No Earners | 22 (56.4%) | $175,781 |
| 1 Earner | 3 (7.7%) | $0 |
| 2 Earners | 14 (35.9%) | $0 |
| 3+ Earners | 0 (0.0%) | $0 |
| Total | 39 (100.0%) | $174,375 |
Household Income in Sombrillo
Household Income Brackets in Sombrillo
With 18 households falling in the category, the $150,000 to $199,999 income range is the most frequent in Sombrillo, accounting for 38.3% of all households.
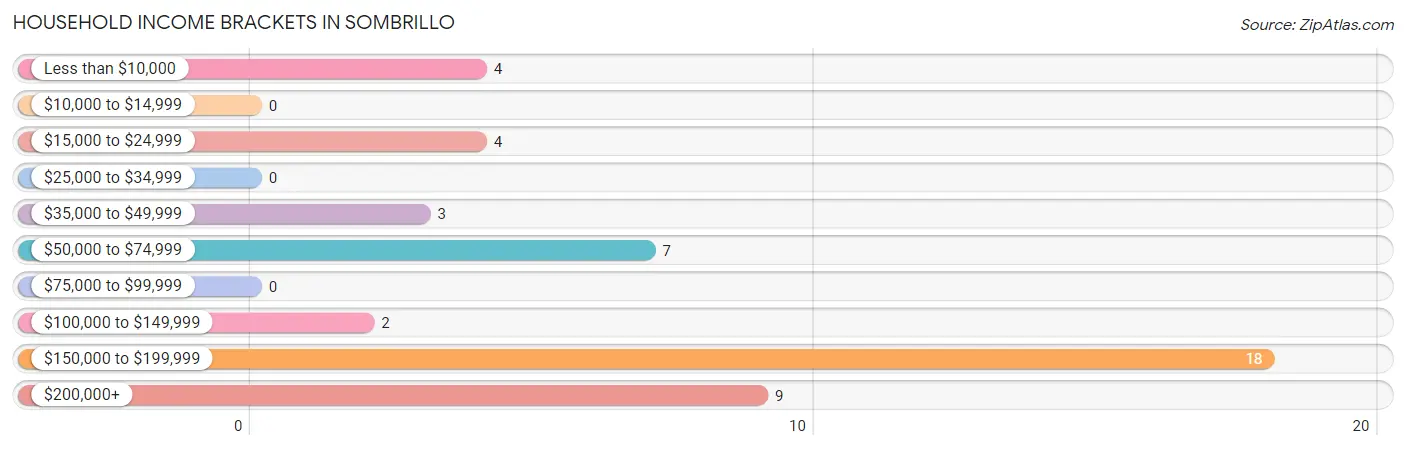
| Income Bracket | # Households | % Households |
| Less than $10,000 | 4 | 8.5% |
| $10,000 to $14,999 | 0 | 0.0% |
| $15,000 to $24,999 | 4 | 8.5% |
| $25,000 to $34,999 | 0 | 0.0% |
| $35,000 to $49,999 | 3 | 6.4% |
| $50,000 to $74,999 | 7 | 14.9% |
| $75,000 to $99,999 | 0 | 0.0% |
| $100,000 to $149,999 | 2 | 4.3% |
| $150,000 to $199,999 | 18 | 38.3% |
| $200,000+ | 9 | 19.1% |
Household Income by Householder Age in Sombrillo
The median household income in Sombrillo is $175,234, with the highest median household income of $175,000 found in the 65+ years age bracket for the primary householder. A total of 32 households (68.1%) fall into this category.
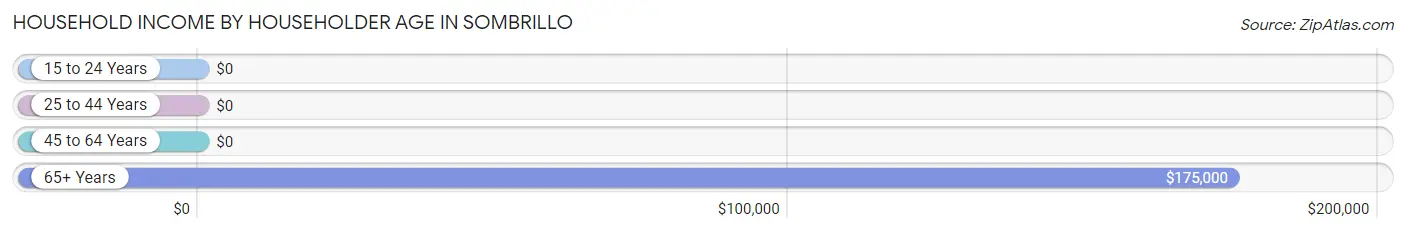
| Income Bracket | # Households | Median Income |
| 15 to 24 Years | 0 (0.0%) | $0 |
| 25 to 44 Years | 0 (0.0%) | $0 |
| 45 to 64 Years | 15 (31.9%) | $0 |
| 65+ Years | 32 (68.1%) | $175,000 |
| Total | 47 (100.0%) | $175,234 |
Poverty in Sombrillo
Income Below Poverty by Sex and Age in Sombrillo
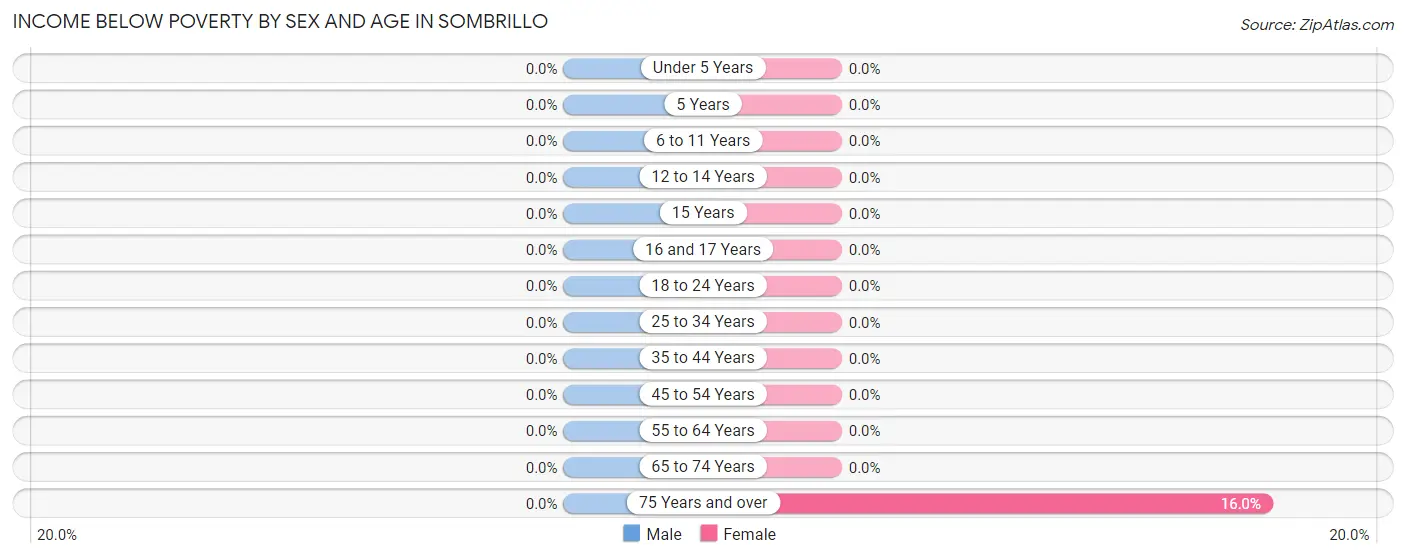
| Age Bracket | Male | Female |
| Under 5 Years | 0 (0.0%) | 0 (0.0%) |
| 5 Years | 0 (0.0%) | 0 (0.0%) |
| 6 to 11 Years | 0 (0.0%) | 0 (0.0%) |
| 12 to 14 Years | 0 (0.0%) | 0 (0.0%) |
| 15 Years | 0 (0.0%) | 0 (0.0%) |
| 16 and 17 Years | 0 (0.0%) | 0 (0.0%) |
| 18 to 24 Years | 0 (0.0%) | 0 (0.0%) |
| 25 to 34 Years | 0 (0.0%) | 0 (0.0%) |
| 35 to 44 Years | 0 (0.0%) | 0 (0.0%) |
| 45 to 54 Years | 0 (0.0%) | 0 (0.0%) |
| 55 to 64 Years | 0 (0.0%) | 0 (0.0%) |
| 65 to 74 Years | 0 (0.0%) | 0 (0.0%) |
| 75 Years and over | 0 (0.0%) | 4 (16.0%) |
| Total | 0 (0.0%) | 4 (5.3%) |
Income Above Poverty by Sex and Age in Sombrillo
According to the poverty statistics in Sombrillo, males aged 55 to 64 years and females aged under 5 years are the age groups that are most secure financially, with 100.0% of males and 100.0% of females in these age groups living above the poverty line.
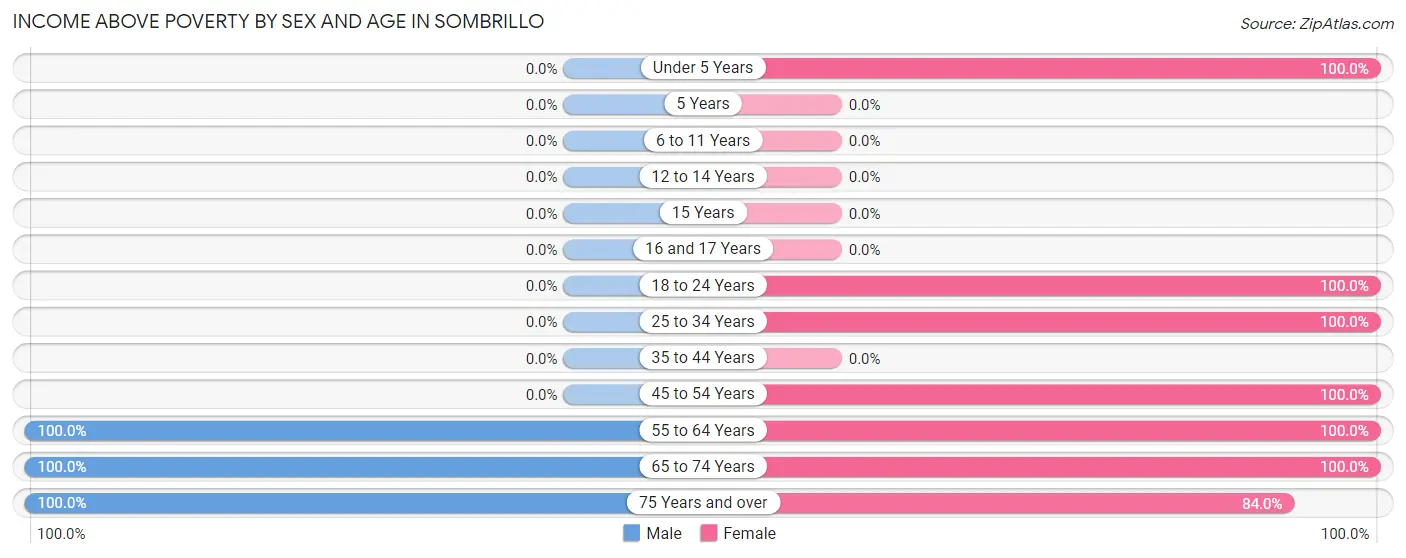
| Age Bracket | Male | Female |
| Under 5 Years | 0 (0.0%) | 15 (100.0%) |
| 5 Years | 0 (0.0%) | 0 (0.0%) |
| 6 to 11 Years | 0 (0.0%) | 0 (0.0%) |
| 12 to 14 Years | 0 (0.0%) | 0 (0.0%) |
| 15 Years | 0 (0.0%) | 0 (0.0%) |
| 16 and 17 Years | 0 (0.0%) | 0 (0.0%) |
| 18 to 24 Years | 0 (0.0%) | 5 (100.0%) |
| 25 to 34 Years | 0 (0.0%) | 3 (100.0%) |
| 35 to 44 Years | 0 (0.0%) | 0 (0.0%) |
| 45 to 54 Years | 0 (0.0%) | 6 (100.0%) |
| 55 to 64 Years | 17 (100.0%) | 16 (100.0%) |
| 65 to 74 Years | 9 (100.0%) | 6 (100.0%) |
| 75 Years and over | 18 (100.0%) | 21 (84.0%) |
| Total | 44 (100.0%) | 72 (94.7%) |
Income Below Poverty Among Married-Couple Families in Sombrillo
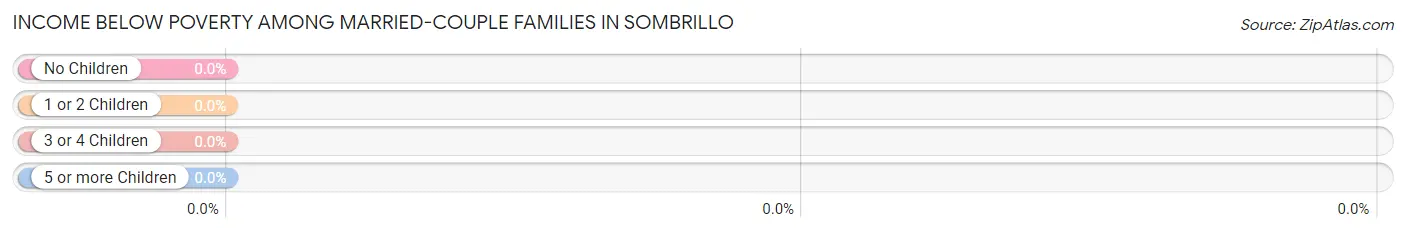
| Children | Above Poverty | Below Poverty |
| No Children | 33 (100.0%) | 0 (0.0%) |
| 1 or 2 Children | 0 (0.0%) | 0 (0.0%) |
| 3 or 4 Children | 0 (0.0%) | 0 (0.0%) |
| 5 or more Children | 0 (0.0%) | 0 (0.0%) |
| Total | 33 (100.0%) | 0 (0.0%) |
Income Below Poverty Among Single-Parent Households in Sombrillo
| Children | Single Father | Single Mother |
| No Children | 0 (0.0%) | 0 (0.0%) |
| 1 or 2 Children | 0 (0.0%) | 0 (0.0%) |
| 3 or 4 Children | 0 (0.0%) | 0 (0.0%) |
| 5 or more Children | 0 (0.0%) | 0 (0.0%) |
| Total | 0 (0.0%) | 0 (0.0%) |
Income Below Poverty Among Married-Couple vs Single-Parent Households in Sombrillo
| Children | Married-Couple Families | Single-Parent Households |
| No Children | 0 (0.0%) | 0 (0.0%) |
| 1 or 2 Children | 0 (0.0%) | 0 (0.0%) |
| 3 or 4 Children | 0 (0.0%) | 0 (0.0%) |
| 5 or more Children | 0 (0.0%) | 0 (0.0%) |
| Total | 0 (0.0%) | 0 (0.0%) |
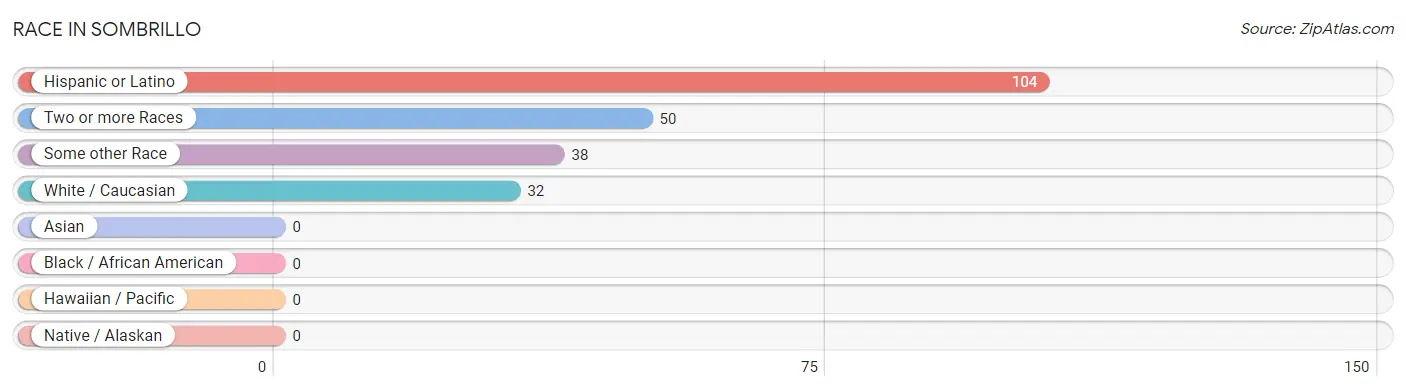
Race in Sombrillo
The most populous races in Sombrillo are Hispanic or Latino (104 | 86.7%), Two or more Races (50 | 41.7%), and Some other Race (38 | 31.7%).
| Race | # Population | % Population |
| Asian | 0 | 0.0% |
| Black / African American | 0 | 0.0% |
| Hawaiian / Pacific | 0 | 0.0% |
| Hispanic or Latino | 104 | 86.7% |
| Native / Alaskan | 0 | 0.0% |
| White / Caucasian | 32 | 26.7% |
| Two or more Races | 50 | 41.7% |
| Some other Race | 38 | 31.7% |
| Total | 120 | 100.0% |
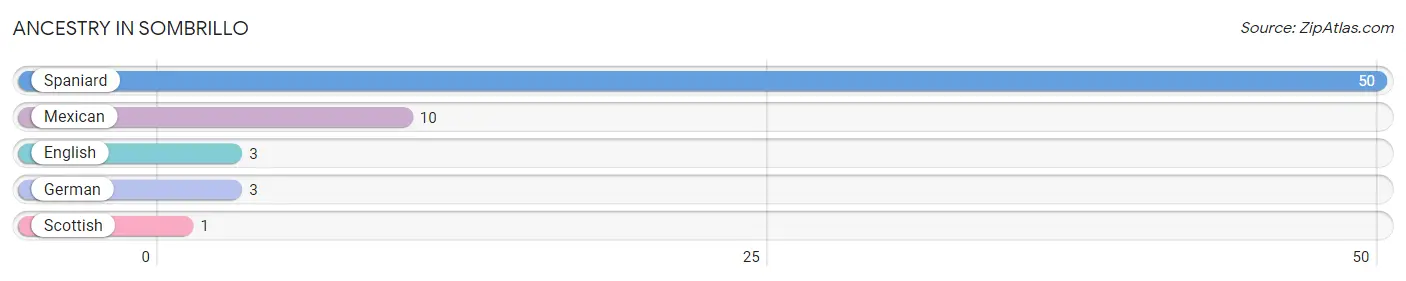
Ancestry in Sombrillo
The most populous ancestries reported in Sombrillo are Spaniard (50 | 41.7%), Mexican (10 | 8.3%), English (3 | 2.5%), German (3 | 2.5%), and Scottish (1 | 0.8%), together accounting for 55.8% of all Sombrillo residents.
| Ancestry | # Population | % Population |
| English | 3 | 2.5% |
| German | 3 | 2.5% |
| Mexican | 10 | 8.3% |
| Scottish | 1 | 0.8% |
| Spaniard | 50 | 41.7% | View All 5 Rows |
Immigrants in Sombrillo
The most numerous immigrant groups reported in Sombrillo came from Central America (4 | 3.3%), Latin America (4 | 3.3%), and Mexico (4 | 3.3%), together accounting for 10.0% of all Sombrillo residents.
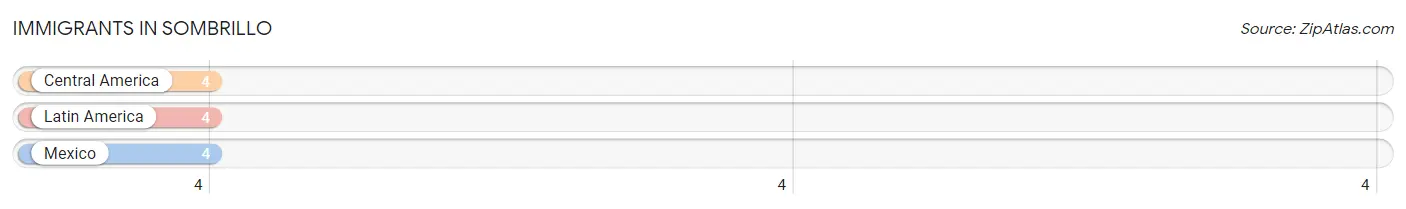
| Immigration Origin | # Population | % Population |
| Central America | 4 | 3.3% |
| Latin America | 4 | 3.3% |
| Mexico | 4 | 3.3% | View All 3 Rows |
Sex and Age in Sombrillo
Sex and Age in Sombrillo
The most populous age groups in Sombrillo are 80 to 84 Years (16 | 36.4%) for men and 75 to 79 Years (21 | 27.6%) for women.
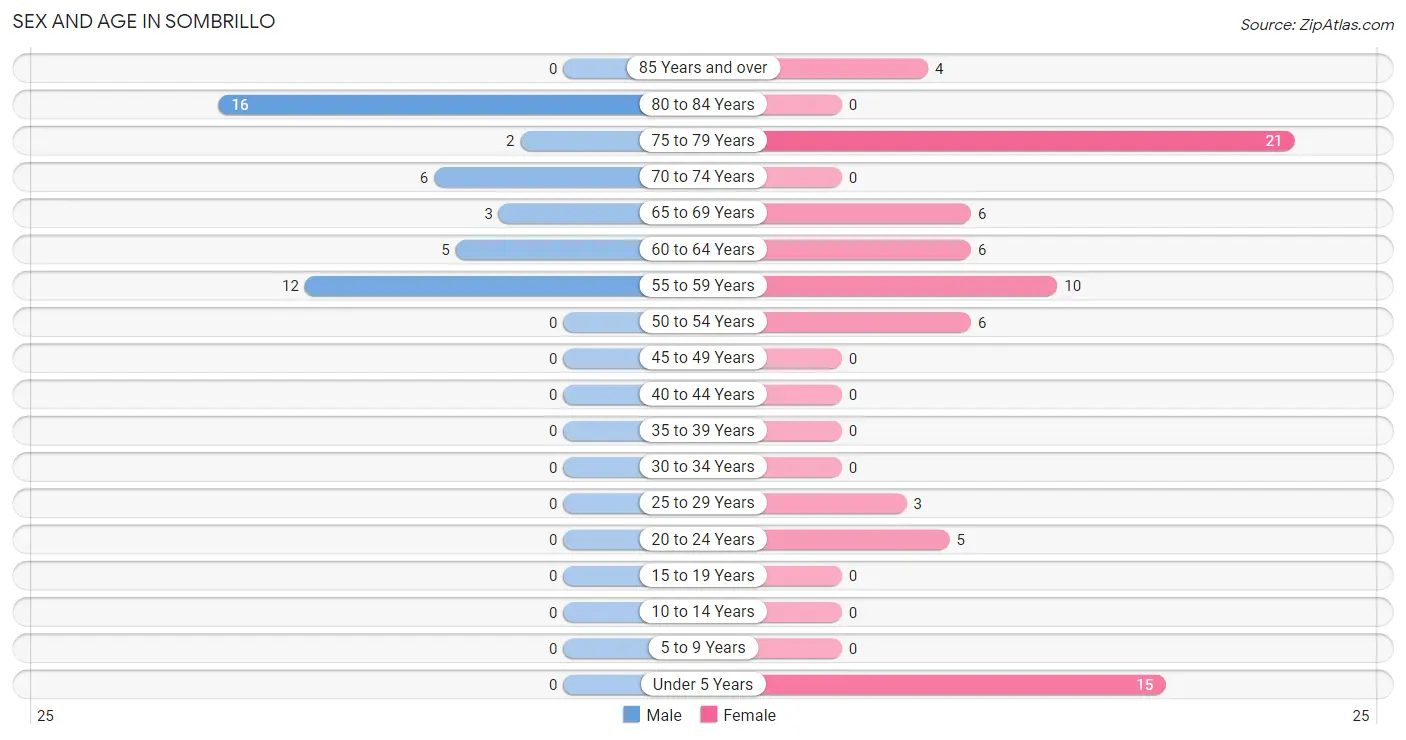
| Age Bracket | Male | Female |
| Under 5 Years | 0 (0.0%) | 15 (19.7%) |
| 5 to 9 Years | 0 (0.0%) | 0 (0.0%) |
| 10 to 14 Years | 0 (0.0%) | 0 (0.0%) |
| 15 to 19 Years | 0 (0.0%) | 0 (0.0%) |
| 20 to 24 Years | 0 (0.0%) | 5 (6.6%) |
| 25 to 29 Years | 0 (0.0%) | 3 (4.0%) |
| 30 to 34 Years | 0 (0.0%) | 0 (0.0%) |
| 35 to 39 Years | 0 (0.0%) | 0 (0.0%) |
| 40 to 44 Years | 0 (0.0%) | 0 (0.0%) |
| 45 to 49 Years | 0 (0.0%) | 0 (0.0%) |
| 50 to 54 Years | 0 (0.0%) | 6 (7.9%) |
| 55 to 59 Years | 12 (27.3%) | 10 (13.2%) |
| 60 to 64 Years | 5 (11.4%) | 6 (7.9%) |
| 65 to 69 Years | 3 (6.8%) | 6 (7.9%) |
| 70 to 74 Years | 6 (13.6%) | 0 (0.0%) |
| 75 to 79 Years | 2 (4.5%) | 21 (27.6%) |
| 80 to 84 Years | 16 (36.4%) | 0 (0.0%) |
| 85 Years and over | 0 (0.0%) | 4 (5.3%) |
| Total | 44 (100.0%) | 76 (100.0%) |
Families and Households in Sombrillo
Median Family Size in Sombrillo
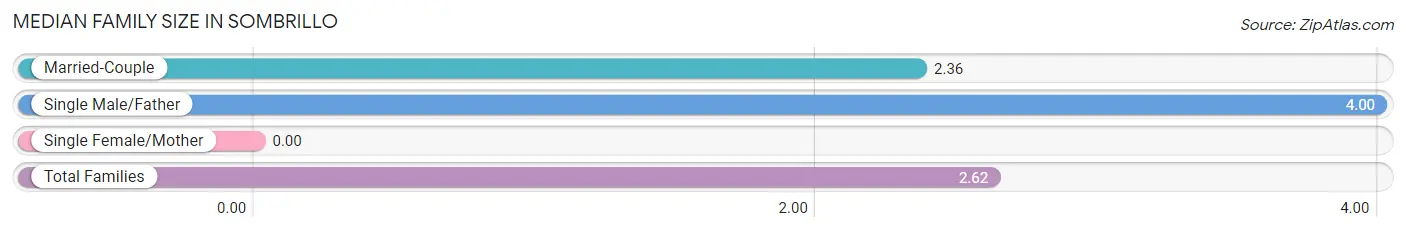
| Family Type | # Families | Family Size |
| Married-Couple | 33 (84.6%) | 2.36 |
| Single Male/Father | 6 (15.4%) | 4.00 |
| Single Female/Mother | 0 (0.0%) | - |
| Total Families | 39 (100.0%) | 2.62 |
Median Household Size in Sombrillo
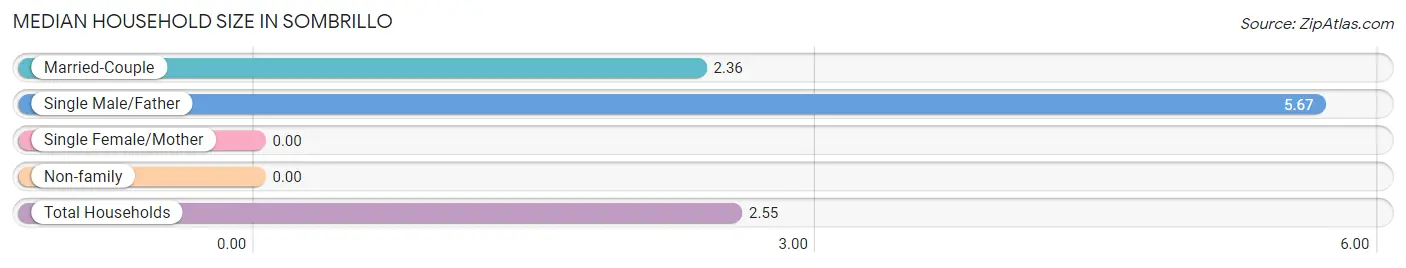
| Household Type | # Households | Household Size |
| Married-Couple | 33 (70.2%) | 2.36 |
| Single Male/Father | 6 (12.8%) | 5.67 |
| Single Female/Mother | 0 (0.0%) | - |
| Non-family | 8 (17.0%) | - |
| Total Households | 47 (100.0%) | 2.55 |
Household Size by Marriage Status in Sombrillo
Out of a total of 47 households in Sombrillo, 39 (83.0%) are family households, while 8 (17.0%) are nonfamily households. The most numerous type of family households are 2-person households, comprising 30, and the most common type of nonfamily households are 1-person households, comprising 8.
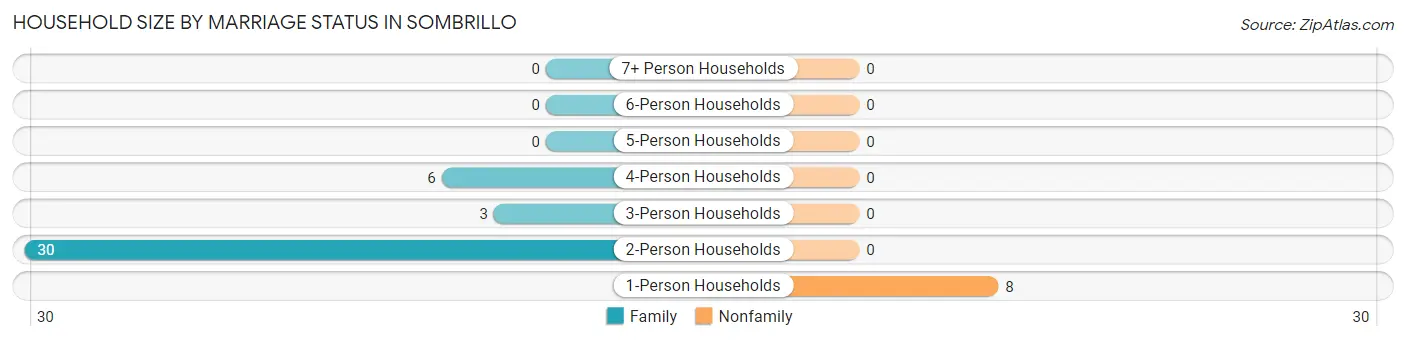
| Household Size | Family Households | Nonfamily Households |
| 1-Person Households | - | 8 (17.0%) |
| 2-Person Households | 30 (63.8%) | 0 (0.0%) |
| 3-Person Households | 3 (6.4%) | 0 (0.0%) |
| 4-Person Households | 6 (12.8%) | 0 (0.0%) |
| 5-Person Households | 0 (0.0%) | 0 (0.0%) |
| 6-Person Households | 0 (0.0%) | 0 (0.0%) |
| 7+ Person Households | 0 (0.0%) | 0 (0.0%) |
| Total | 39 (83.0%) | 8 (17.0%) |
Female Fertility in Sombrillo
Fertility by Age in Sombrillo
Average fertility rate in Sombrillo is 214.0 births per 1,000 women. Women in the age bracket of 20 to 34 years have the highest fertility rate with 375.0 births per 1,000 women. Women in the age bracket of 20 to 34 years acount for 100.0% of all women with births.
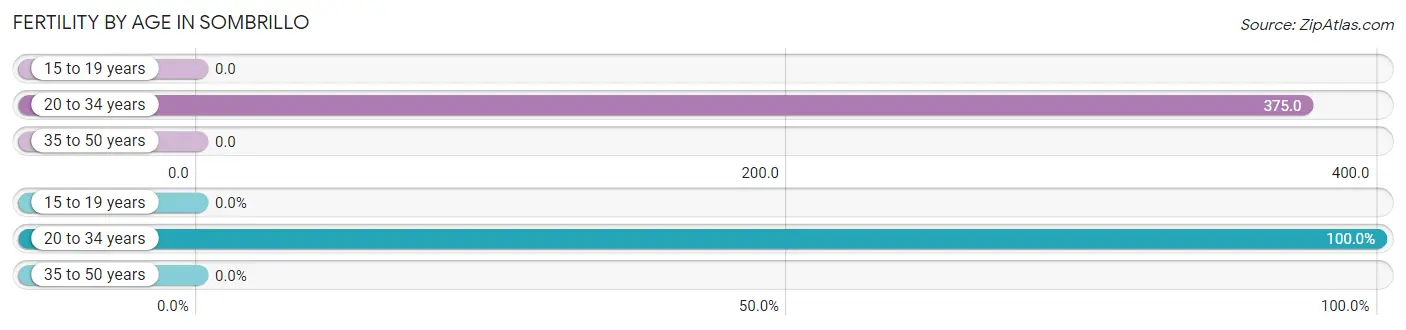
| Age Bracket | Women with Births | Births / 1,000 Women |
| 15 to 19 years | 0 (0.0%) | 0.0 |
| 20 to 34 years | 3 (100.0%) | 375.0 |
| 35 to 50 years | 0 (0.0%) | 0.0 |
| Total | 3 (100.0%) | 214.0 |
Fertility by Age by Marriage Status in Sombrillo
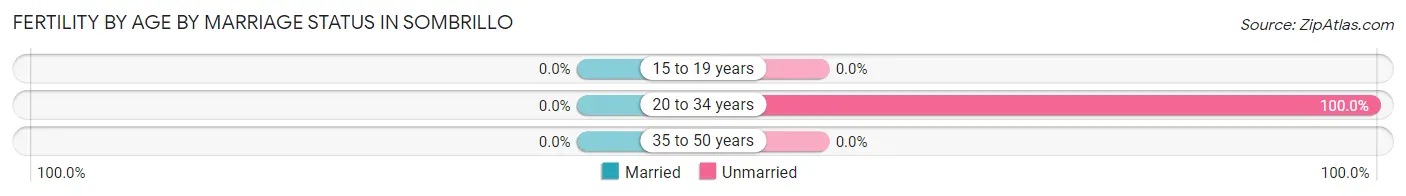
| Age Bracket | Married | Unmarried |
| 15 to 19 years | 0 (0.0%) | 0 (0.0%) |
| 20 to 34 years | 0 (0.0%) | 3 (100.0%) |
| 35 to 50 years | 0 (0.0%) | 0 (0.0%) |
| Total | 0 (0.0%) | 3 (100.0%) |
Fertility by Education in Sombrillo
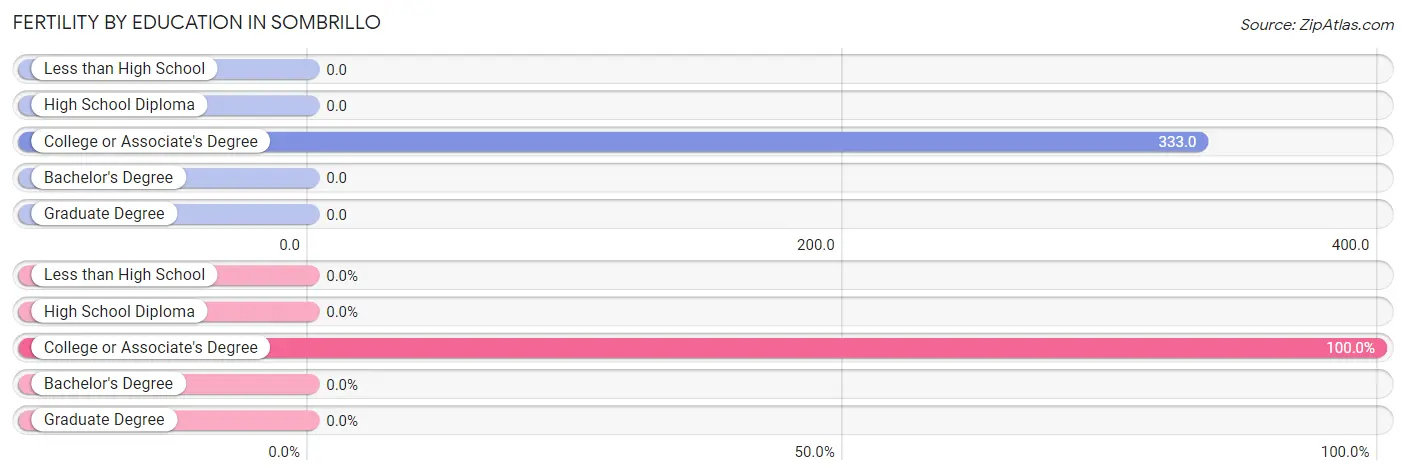
| Educational Attainment | Women with Births | Births / 1,000 Women |
| Less than High School | 0 (0.0%) | 0.0 |
| High School Diploma | 0 (0.0%) | 0.0 |
| College or Associate's Degree | 3 (100.0%) | 333.0 |
| Bachelor's Degree | 0 (0.0%) | 0.0 |
| Graduate Degree | 0 (0.0%) | 0.0 |
| Total | 3 (100.0%) | 214.0 |
Fertility by Education by Marriage Status in Sombrillo
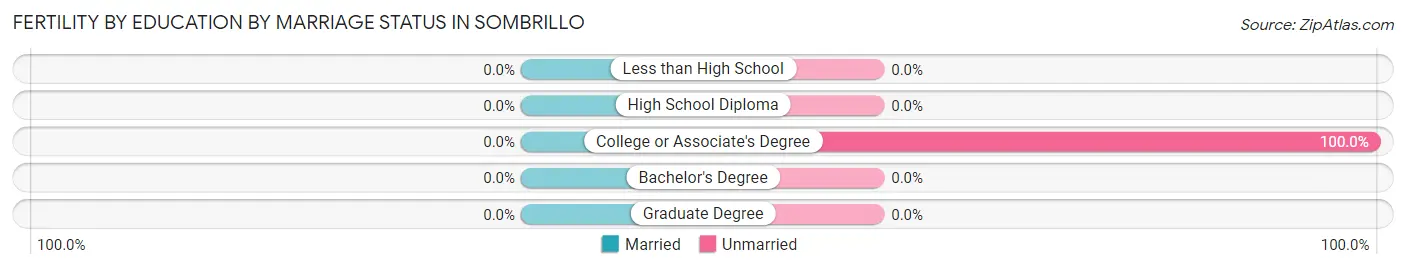
| Educational Attainment | Married | Unmarried |
| Less than High School | 0 (0.0%) | 0 (0.0%) |
| High School Diploma | 0 (0.0%) | 0 (0.0%) |
| College or Associate's Degree | 0 (0.0%) | 3 (100.0%) |
| Bachelor's Degree | 0 (0.0%) | 0 (0.0%) |
| Graduate Degree | 0 (0.0%) | 0 (0.0%) |
| Total | 0 (0.0%) | 3 (100.0%) |
Employment Characteristics in Sombrillo
Employment by Class of Employer in Sombrillo
Among the 40 employed individuals in Sombrillo, private company employees (18 | 45.0%), not-for-profit organizations (13 | 32.5%), and federal government employees (9 | 22.5%) make up the most common classes of employment.
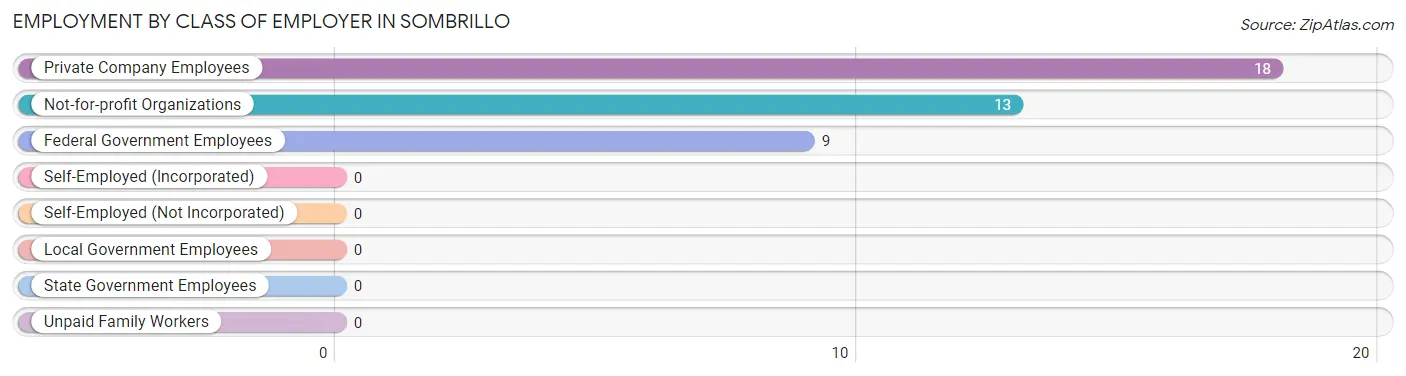
| Employer Class | # Employees | % Employees |
| Private Company Employees | 18 | 45.0% |
| Self-Employed (Incorporated) | 0 | 0.0% |
| Self-Employed (Not Incorporated) | 0 | 0.0% |
| Not-for-profit Organizations | 13 | 32.5% |
| Local Government Employees | 0 | 0.0% |
| State Government Employees | 0 | 0.0% |
| Federal Government Employees | 9 | 22.5% |
| Unpaid Family Workers | 0 | 0.0% |
| Total | 40 | 100.0% |
Employment Status by Age in Sombrillo
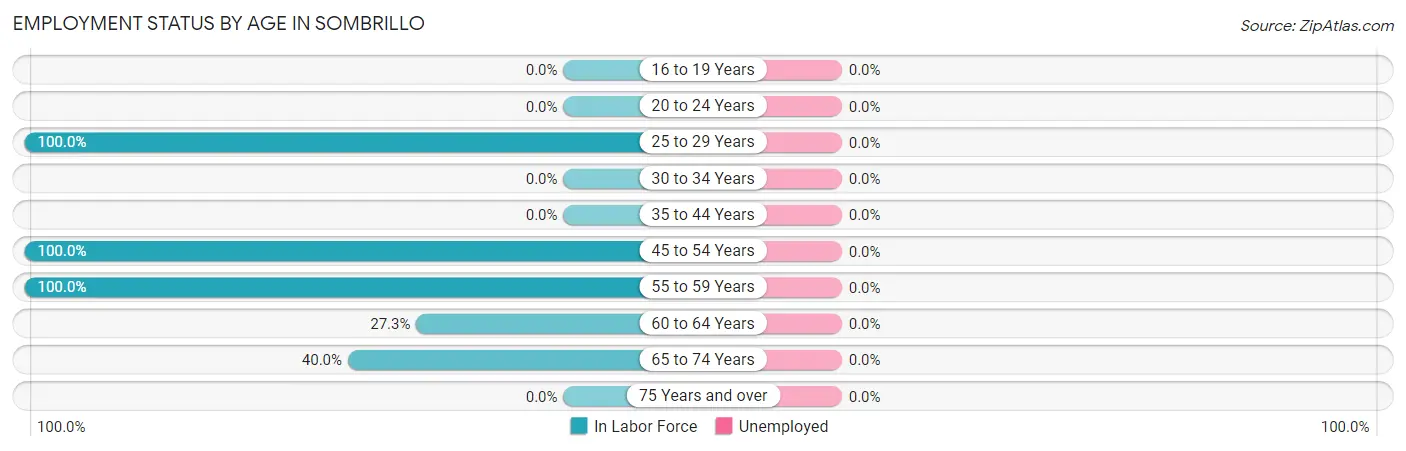
| Age Bracket | In Labor Force | Unemployed |
| 16 to 19 Years | 0 (0.0%) | 0 (0.0%) |
| 20 to 24 Years | 0 (0.0%) | 0 (0.0%) |
| 25 to 29 Years | 3 (100.0%) | 0 (0.0%) |
| 30 to 34 Years | 0 (0.0%) | 0 (0.0%) |
| 35 to 44 Years | 0 (0.0%) | 0 (0.0%) |
| 45 to 54 Years | 6 (100.0%) | 0 (0.0%) |
| 55 to 59 Years | 22 (100.0%) | 0 (0.0%) |
| 60 to 64 Years | 3 (27.3%) | 0 (0.0%) |
| 65 to 74 Years | 6 (40.0%) | 0 (0.0%) |
| 75 Years and over | 0 (0.0%) | 0 (0.0%) |
| Total | 40 (38.1%) | 0 (0.0%) |
Employment Status by Educational Attainment in Sombrillo
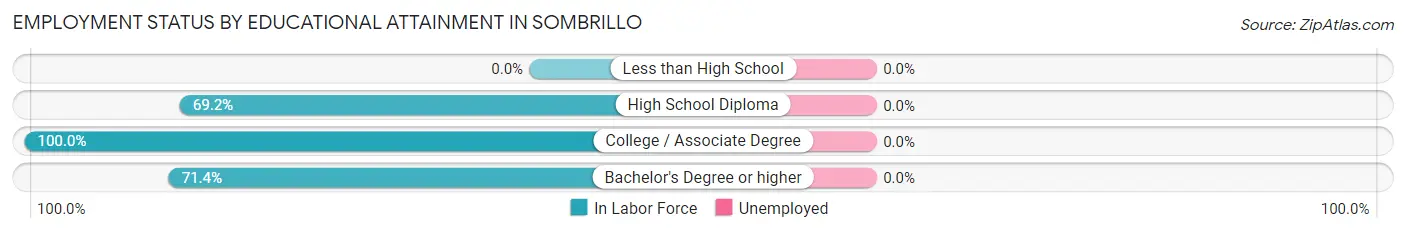
| Educational Attainment | In Labor Force | Unemployed |
| Less than High School | 0 (0.0%) | 0 (0.0%) |
| High School Diploma | 9 (69.2%) | 0 (0.0%) |
| College / Associate Degree | 15 (100.0%) | 0 (0.0%) |
| Bachelor's Degree or higher | 10 (71.4%) | 0 (0.0%) |
| Total | 34 (81.0%) | 0 (0.0%) |
Employment Occupations by Sex in Sombrillo
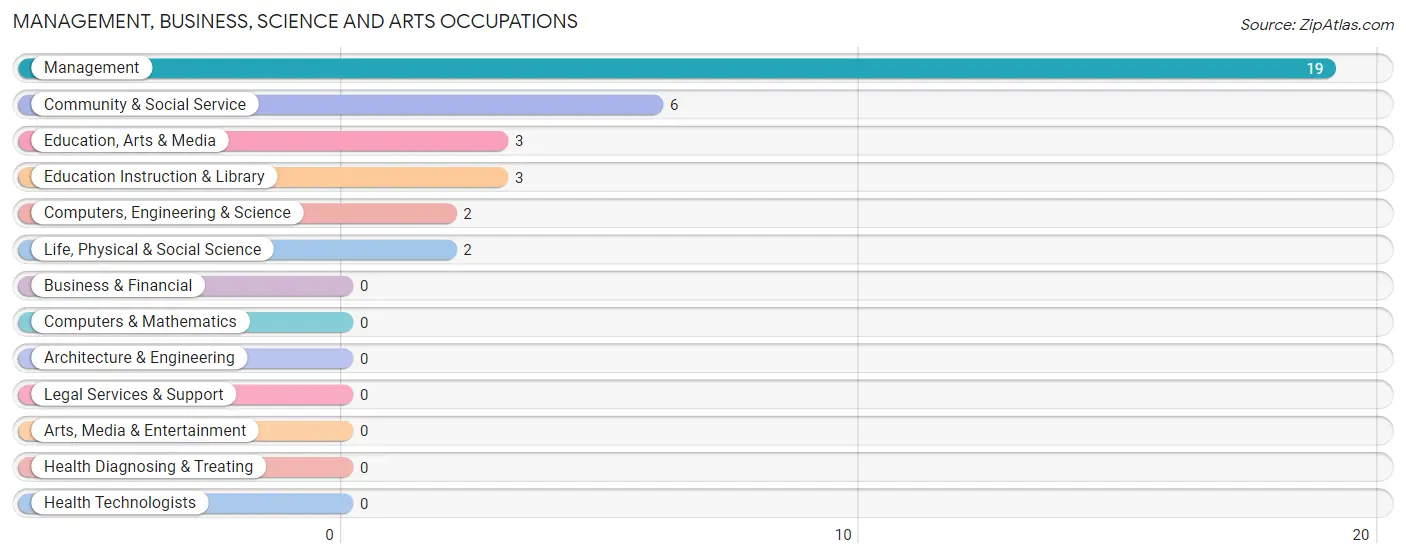
Management, Business, Science and Arts Occupations
The most common Management, Business, Science and Arts occupations in Sombrillo are Management (19 | 47.5%), Community & Social Service (6 | 15.0%), Education, Arts & Media (3 | 7.5%), Education Instruction & Library (3 | 7.5%), and Computers, Engineering & Science (2 | 5.0%).
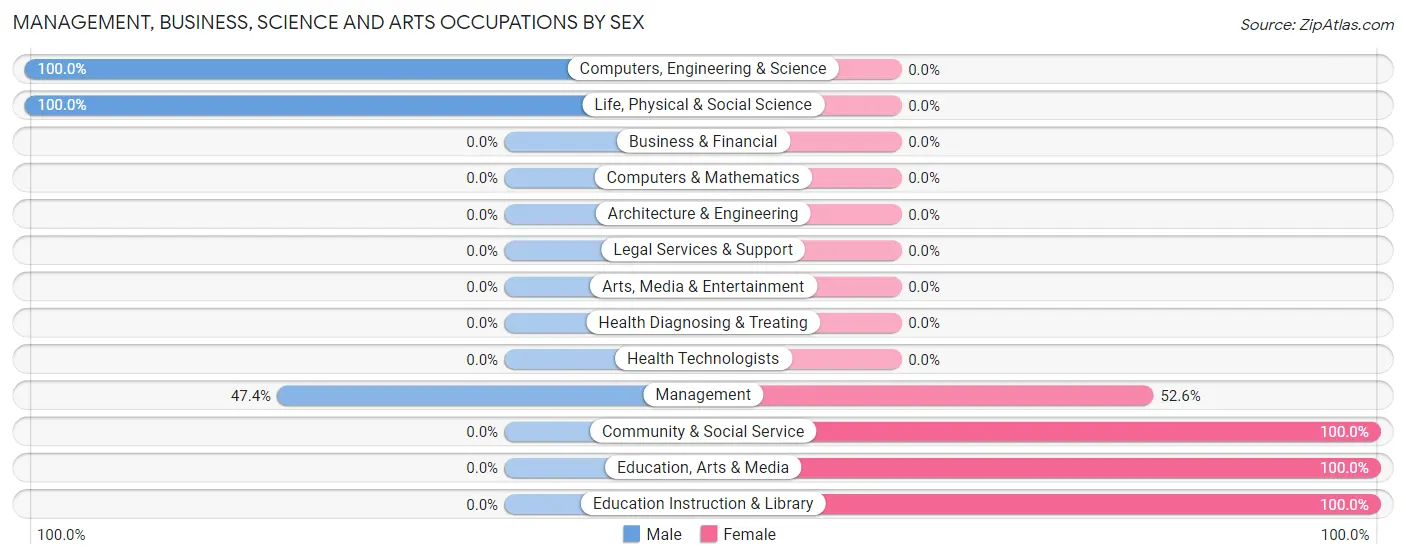
Management, Business, Science and Arts Occupations by Sex
Within the Management, Business, Science and Arts occupations in Sombrillo, the most male-oriented occupations are Computers, Engineering & Science (100.0%), Life, Physical & Social Science (100.0%), and Management (47.4%), while the most female-oriented occupations are Community & Social Service (100.0%), Education, Arts & Media (100.0%), and Education Instruction & Library (100.0%).
| Occupation | Male | Female |
| Management | 9 (47.4%) | 10 (52.6%) |
| Business & Financial | 0 (0.0%) | 0 (0.0%) |
| Computers, Engineering & Science | 2 (100.0%) | 0 (0.0%) |
| Computers & Mathematics | 0 (0.0%) | 0 (0.0%) |
| Architecture & Engineering | 0 (0.0%) | 0 (0.0%) |
| Life, Physical & Social Science | 2 (100.0%) | 0 (0.0%) |
| Community & Social Service | 0 (0.0%) | 6 (100.0%) |
| Education, Arts & Media | 0 (0.0%) | 3 (100.0%) |
| Legal Services & Support | 0 (0.0%) | 0 (0.0%) |
| Education Instruction & Library | 0 (0.0%) | 3 (100.0%) |
| Arts, Media & Entertainment | 0 (0.0%) | 0 (0.0%) |
| Health Diagnosing & Treating | 0 (0.0%) | 0 (0.0%) |
| Health Technologists | 0 (0.0%) | 0 (0.0%) |
| Total (Category) | 11 (40.7%) | 16 (59.3%) |
| Total (Overall) | 15 (37.5%) | 25 (62.5%) |
Services Occupations
Services Occupations by Sex
| Occupation | Male | Female |
| Healthcare Support | 0 (0.0%) | 0 (0.0%) |
| Security & Protection | 0 (0.0%) | 0 (0.0%) |
| Firefighting & Prevention | 0 (0.0%) | 0 (0.0%) |
| Law Enforcement | 0 (0.0%) | 0 (0.0%) |
| Food Preparation & Serving | 0 (0.0%) | 0 (0.0%) |
| Cleaning & Maintenance | 0 (0.0%) | 0 (0.0%) |
| Personal Care & Service | 0 (0.0%) | 0 (0.0%) |
| Total (Category) | 0 (0.0%) | 0 (0.0%) |
| Total (Overall) | 15 (37.5%) | 25 (62.5%) |
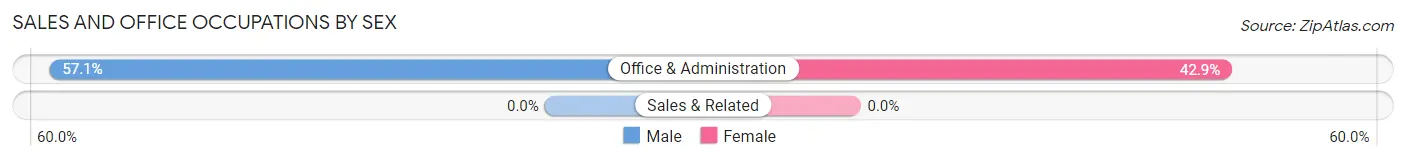
Sales and Office Occupations
The most common Sales and Office occupations in Sombrillo are , and Office & Administration (7 | 17.5%).
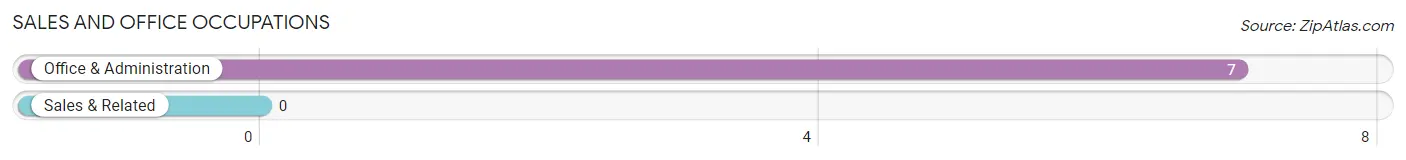
Sales and Office Occupations by Sex
| Occupation | Male | Female |
| Sales & Related | 0 (0.0%) | 0 (0.0%) |
| Office & Administration | 4 (57.1%) | 3 (42.9%) |
| Total (Category) | 4 (57.1%) | 3 (42.9%) |
| Total (Overall) | 15 (37.5%) | 25 (62.5%) |
Natural Resources, Construction and Maintenance Occupations
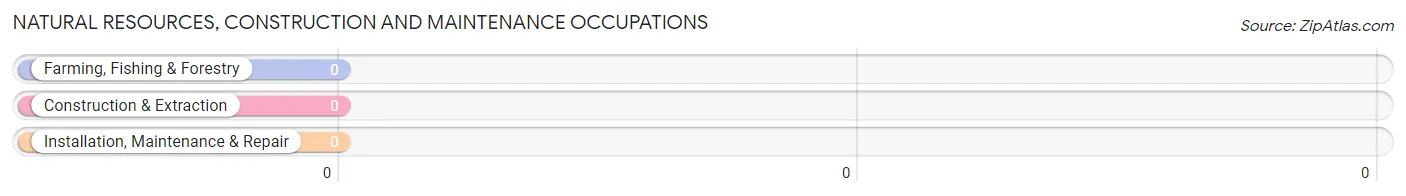
Natural Resources, Construction and Maintenance Occupations by Sex
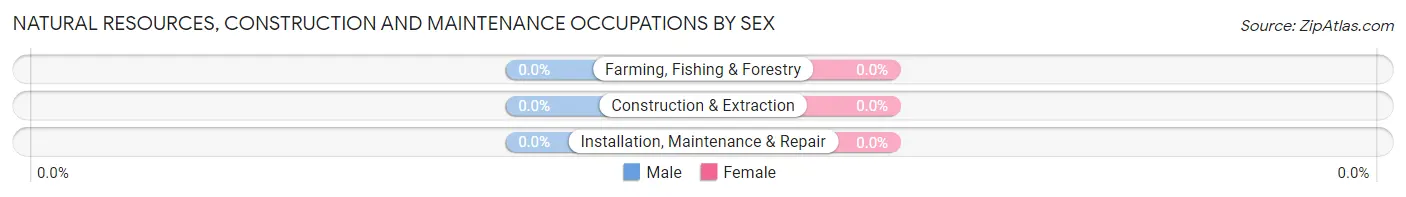
| Occupation | Male | Female |
| Farming, Fishing & Forestry | 0 (0.0%) | 0 (0.0%) |
| Construction & Extraction | 0 (0.0%) | 0 (0.0%) |
| Installation, Maintenance & Repair | 0 (0.0%) | 0 (0.0%) |
| Total (Category) | 0 (0.0%) | 0 (0.0%) |
| Total (Overall) | 15 (37.5%) | 25 (62.5%) |
Production, Transportation and Moving Occupations
The most common Production, Transportation and Moving occupations in Sombrillo are , and Production (6 | 15.0%).
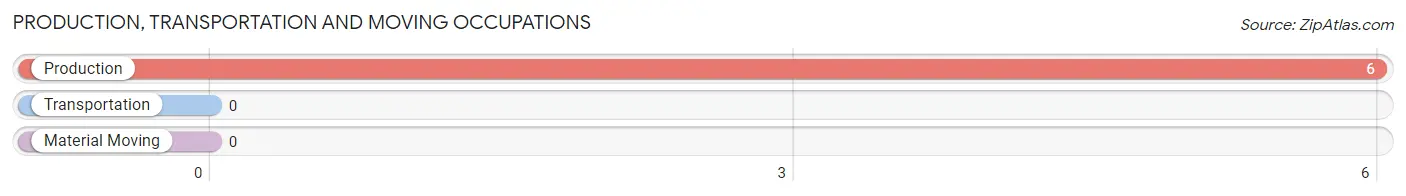
Production, Transportation and Moving Occupations by Sex
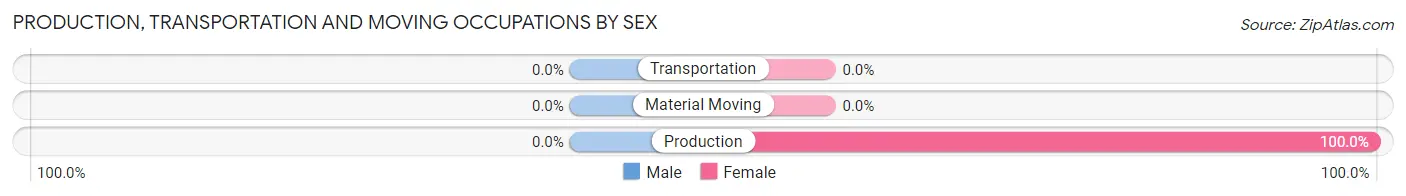
| Occupation | Male | Female |
| Production | 0 (0.0%) | 6 (100.0%) |
| Transportation | 0 (0.0%) | 0 (0.0%) |
| Material Moving | 0 (0.0%) | 0 (0.0%) |
| Total (Category) | 0 (0.0%) | 6 (100.0%) |
| Total (Overall) | 15 (37.5%) | 25 (62.5%) |
Employment Industries by Sex in Sombrillo
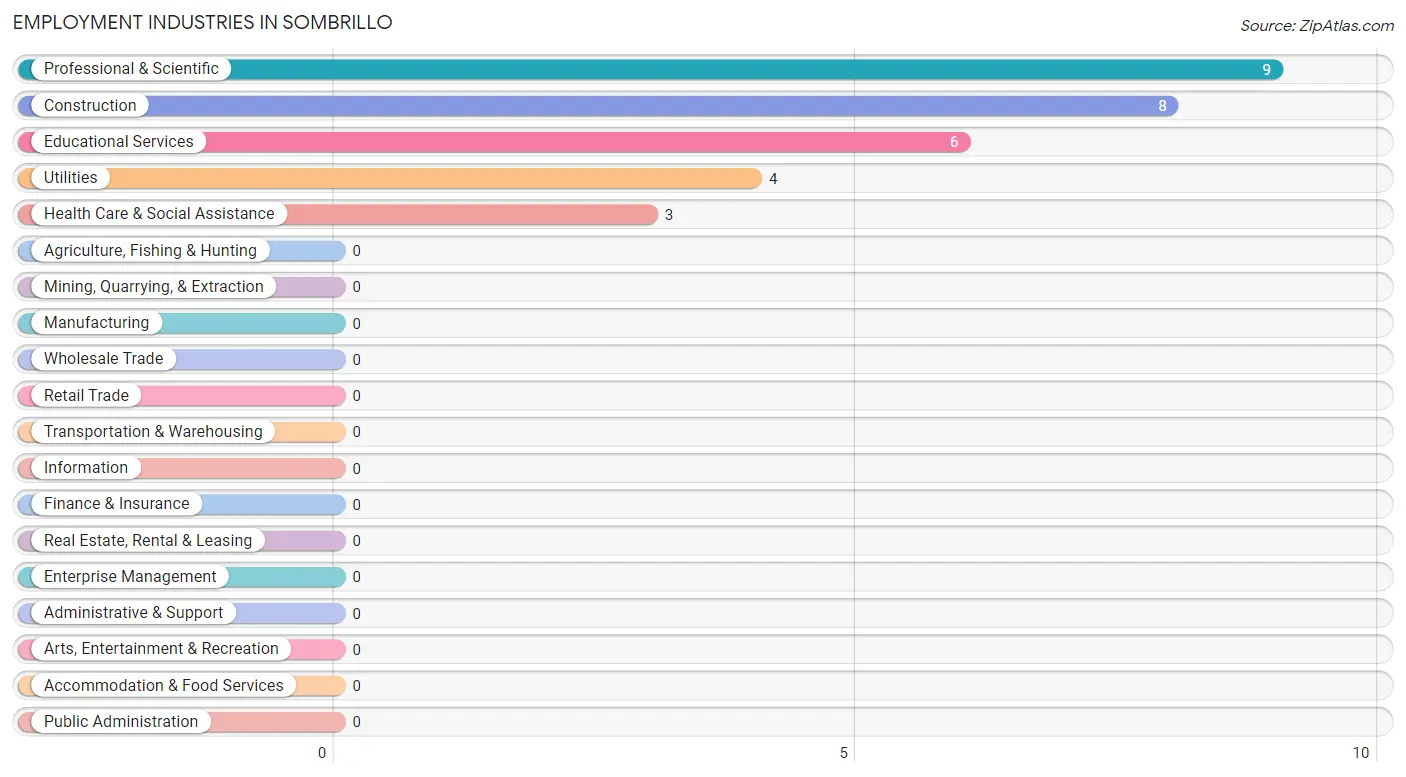
Employment Industries in Sombrillo
The major employment industries in Sombrillo include Professional & Scientific (9 | 22.5%), Construction (8 | 20.0%), Educational Services (6 | 15.0%), Utilities (4 | 10.0%), and Health Care & Social Assistance (3 | 7.5%).
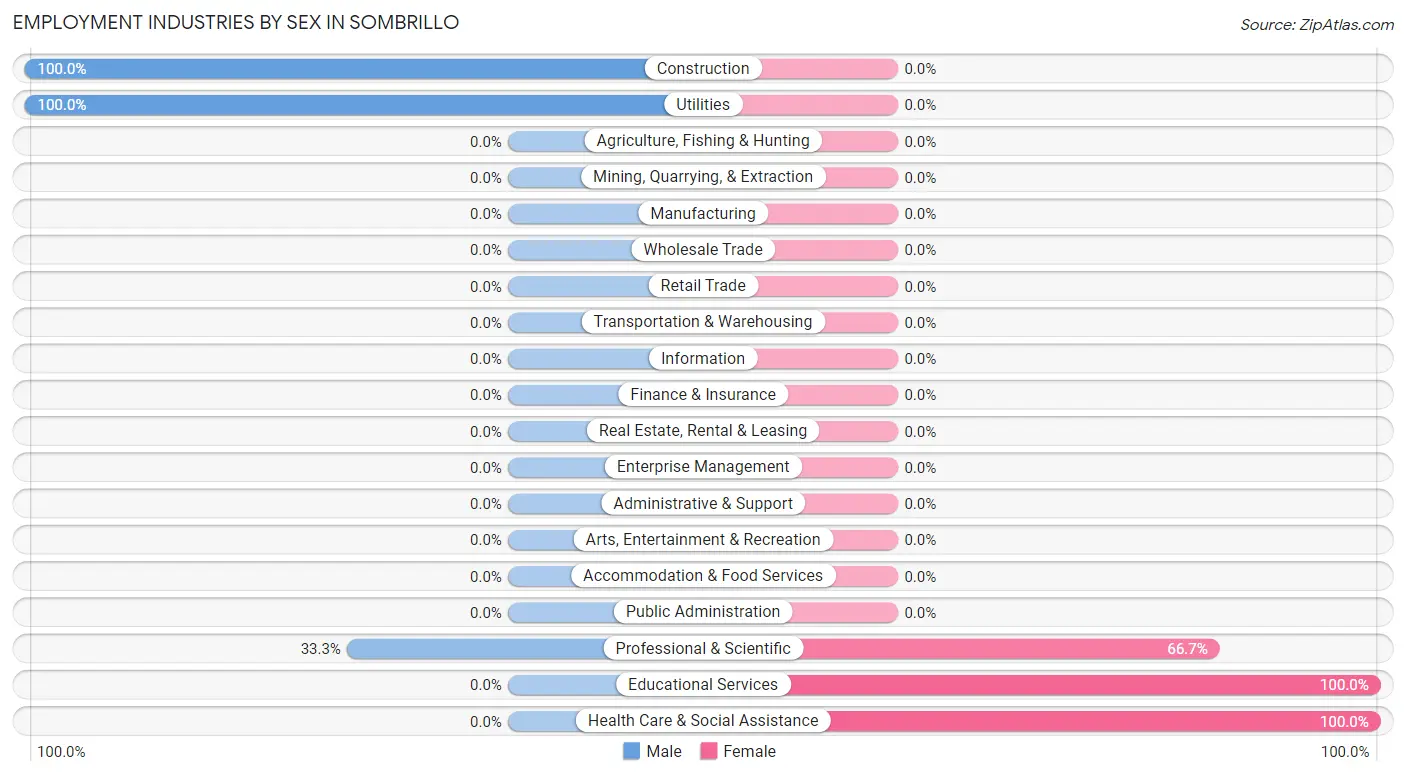
Employment Industries by Sex in Sombrillo
The Sombrillo industries that see more men than women are Construction (100.0%), Utilities (100.0%), and Professional & Scientific (33.3%), whereas the industries that tend to have a higher number of women are Educational Services (100.0%), Health Care & Social Assistance (100.0%), and Professional & Scientific (66.7%).
| Industry | Male | Female |
| Agriculture, Fishing & Hunting | 0 (0.0%) | 0 (0.0%) |
| Mining, Quarrying, & Extraction | 0 (0.0%) | 0 (0.0%) |
| Construction | 8 (100.0%) | 0 (0.0%) |
| Manufacturing | 0 (0.0%) | 0 (0.0%) |
| Wholesale Trade | 0 (0.0%) | 0 (0.0%) |
| Retail Trade | 0 (0.0%) | 0 (0.0%) |
| Transportation & Warehousing | 0 (0.0%) | 0 (0.0%) |
| Utilities | 4 (100.0%) | 0 (0.0%) |
| Information | 0 (0.0%) | 0 (0.0%) |
| Finance & Insurance | 0 (0.0%) | 0 (0.0%) |
| Real Estate, Rental & Leasing | 0 (0.0%) | 0 (0.0%) |
| Professional & Scientific | 3 (33.3%) | 6 (66.7%) |
| Enterprise Management | 0 (0.0%) | 0 (0.0%) |
| Administrative & Support | 0 (0.0%) | 0 (0.0%) |
| Educational Services | 0 (0.0%) | 6 (100.0%) |
| Health Care & Social Assistance | 0 (0.0%) | 3 (100.0%) |
| Arts, Entertainment & Recreation | 0 (0.0%) | 0 (0.0%) |
| Accommodation & Food Services | 0 (0.0%) | 0 (0.0%) |
| Public Administration | 0 (0.0%) | 0 (0.0%) |
| Total | 15 (37.5%) | 25 (62.5%) |
Education in Sombrillo
School Enrollment in Sombrillo
The most common levels of schooling among the 6 students in Sombrillo are college / undergraduate (5 | 83.3%), and high school (1 | 16.7%).
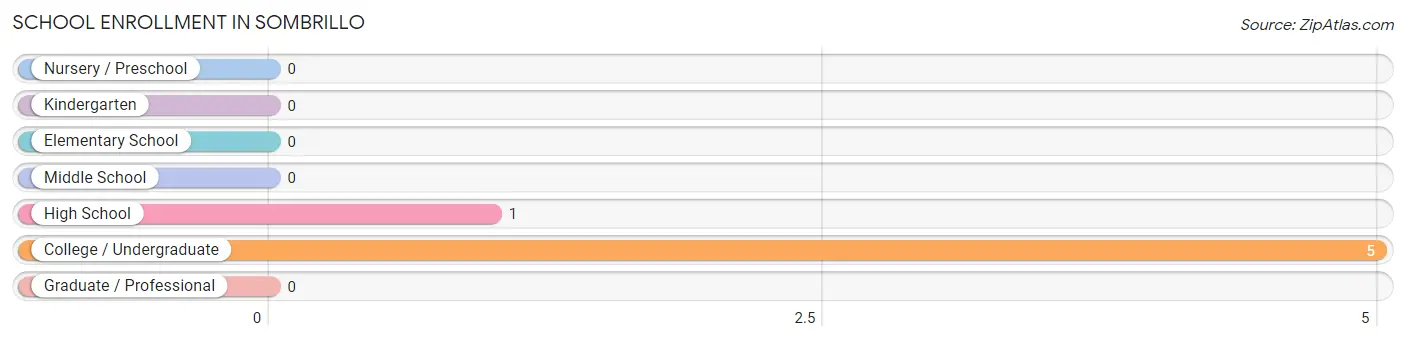
| School Level | # Students | % Students |
| Nursery / Preschool | 0 | 0.0% |
| Kindergarten | 0 | 0.0% |
| Elementary School | 0 | 0.0% |
| Middle School | 0 | 0.0% |
| High School | 1 | 16.7% |
| College / Undergraduate | 5 | 83.3% |
| Graduate / Professional | 0 | 0.0% |
| Total | 6 | 100.0% |
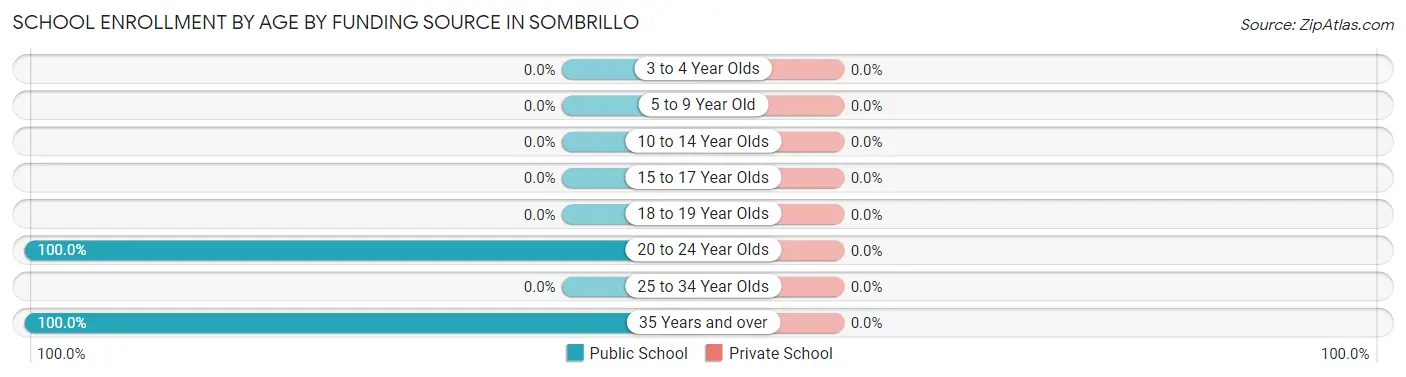
School Enrollment by Age by Funding Source in Sombrillo
| Age Bracket | Public School | Private School |
| 3 to 4 Year Olds | 0 (0.0%) | 0 (0.0%) |
| 5 to 9 Year Old | 0 (0.0%) | 0 (0.0%) |
| 10 to 14 Year Olds | 0 (0.0%) | 0 (0.0%) |
| 15 to 17 Year Olds | 0 (0.0%) | 0 (0.0%) |
| 18 to 19 Year Olds | 0 (0.0%) | 0 (0.0%) |
| 20 to 24 Year Olds | 5 (100.0%) | 0 (0.0%) |
| 25 to 34 Year Olds | 0 (0.0%) | 0 (0.0%) |
| 35 Years and over | 1 (100.0%) | 0 (0.0%) |
| Total | 6 (100.0%) | 0 (0.0%) |
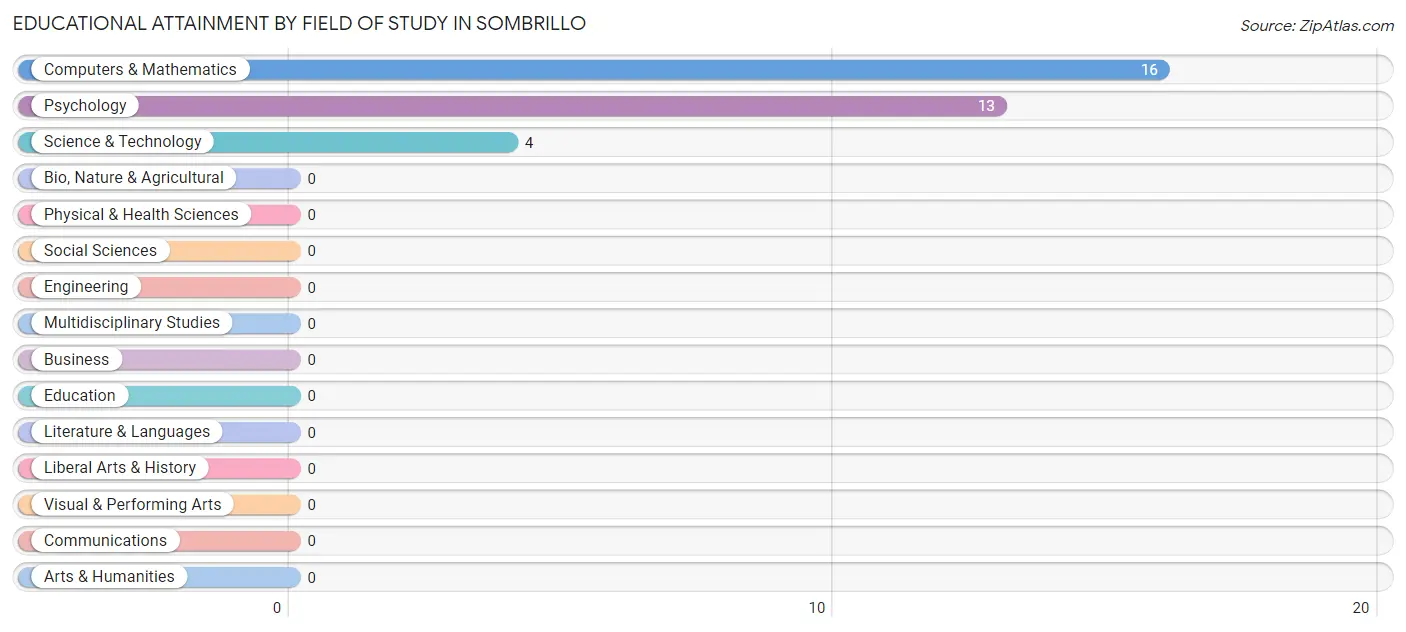
Educational Attainment by Field of Study in Sombrillo
Computers & mathematics (16 | 48.5%), psychology (13 | 39.4%), and science & technology (4 | 12.1%) are the most common fields of study among 33 individuals in Sombrillo who have obtained a bachelor's degree or higher.
| Field of Study | # Graduates | % Graduates |
| Computers & Mathematics | 16 | 48.5% |
| Bio, Nature & Agricultural | 0 | 0.0% |
| Physical & Health Sciences | 0 | 0.0% |
| Psychology | 13 | 39.4% |
| Social Sciences | 0 | 0.0% |
| Engineering | 0 | 0.0% |
| Multidisciplinary Studies | 0 | 0.0% |
| Science & Technology | 4 | 12.1% |
| Business | 0 | 0.0% |
| Education | 0 | 0.0% |
| Literature & Languages | 0 | 0.0% |
| Liberal Arts & History | 0 | 0.0% |
| Visual & Performing Arts | 0 | 0.0% |
| Communications | 0 | 0.0% |
| Arts & Humanities | 0 | 0.0% |
| Total | 33 | 100.0% |
Transportation & Commute in Sombrillo
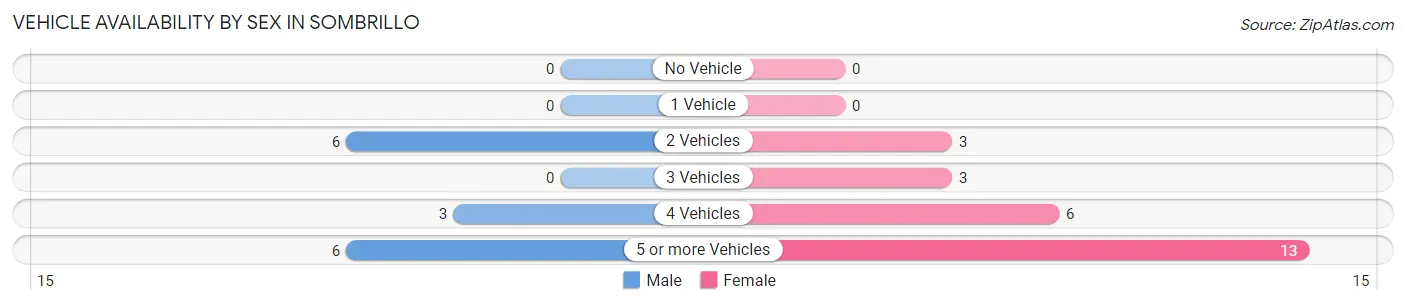
Vehicle Availability by Sex in Sombrillo
The most prevalent vehicle ownership categories in Sombrillo are males with 2 vehicles (6, accounting for 40.0%) and females with 2 vehicles (3, making up 24.0%).
| Vehicles Available | Male | Female |
| No Vehicle | 0 (0.0%) | 0 (0.0%) |
| 1 Vehicle | 0 (0.0%) | 0 (0.0%) |
| 2 Vehicles | 6 (40.0%) | 3 (12.0%) |
| 3 Vehicles | 0 (0.0%) | 3 (12.0%) |
| 4 Vehicles | 3 (20.0%) | 6 (24.0%) |
| 5 or more Vehicles | 6 (40.0%) | 13 (52.0%) |
| Total | 15 (100.0%) | 25 (100.0%) |
Commute Time in Sombrillo
The most frequently occuring commute durations in Sombrillo are 45 to 59 minutes (18 commuters, 45.0%), 35 to 39 minutes (9 commuters, 22.5%), and 30 to 34 minutes (5 commuters, 12.5%).
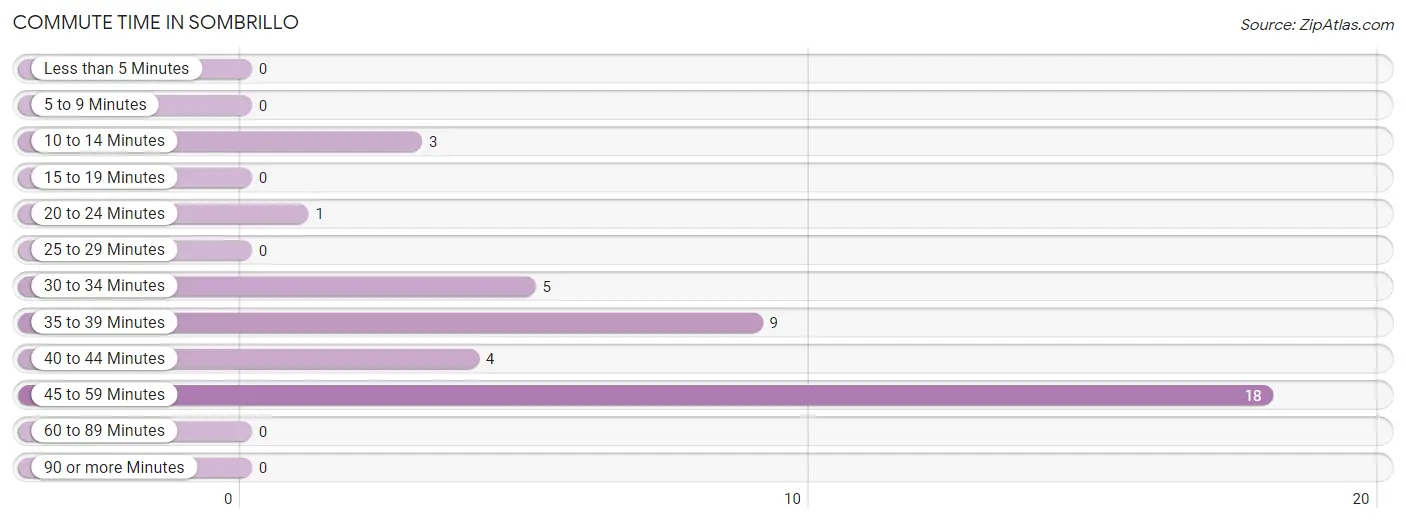
| Commute Time | # Commuters | % Commuters |
| Less than 5 Minutes | 0 | 0.0% |
| 5 to 9 Minutes | 0 | 0.0% |
| 10 to 14 Minutes | 3 | 7.5% |
| 15 to 19 Minutes | 0 | 0.0% |
| 20 to 24 Minutes | 1 | 2.5% |
| 25 to 29 Minutes | 0 | 0.0% |
| 30 to 34 Minutes | 5 | 12.5% |
| 35 to 39 Minutes | 9 | 22.5% |
| 40 to 44 Minutes | 4 | 10.0% |
| 45 to 59 Minutes | 18 | 45.0% |
| 60 to 89 Minutes | 0 | 0.0% |
| 90 or more Minutes | 0 | 0.0% |
Commute Time by Sex in Sombrillo
The most common commute times in Sombrillo are 45 to 59 minutes (6 commuters, 40.0%) for males and 45 to 59 minutes (12 commuters, 48.0%) for females.
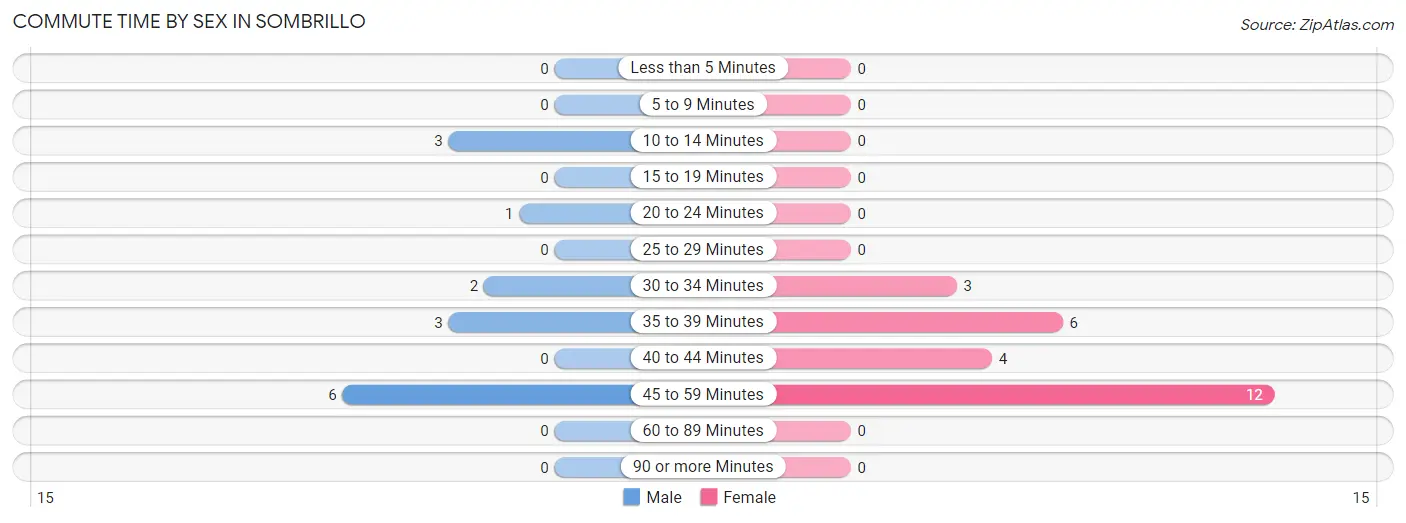
| Commute Time | Male | Female |
| Less than 5 Minutes | 0 (0.0%) | 0 (0.0%) |
| 5 to 9 Minutes | 0 (0.0%) | 0 (0.0%) |
| 10 to 14 Minutes | 3 (20.0%) | 0 (0.0%) |
| 15 to 19 Minutes | 0 (0.0%) | 0 (0.0%) |
| 20 to 24 Minutes | 1 (6.7%) | 0 (0.0%) |
| 25 to 29 Minutes | 0 (0.0%) | 0 (0.0%) |
| 30 to 34 Minutes | 2 (13.3%) | 3 (12.0%) |
| 35 to 39 Minutes | 3 (20.0%) | 6 (24.0%) |
| 40 to 44 Minutes | 0 (0.0%) | 4 (16.0%) |
| 45 to 59 Minutes | 6 (40.0%) | 12 (48.0%) |
| 60 to 89 Minutes | 0 (0.0%) | 0 (0.0%) |
| 90 or more Minutes | 0 (0.0%) | 0 (0.0%) |
Time of Departure to Work by Sex in Sombrillo
The most frequent times of departure to work in Sombrillo are 7:30 AM to 7:59 AM (6, 40.0%) for males and 8:00 AM to 8:29 AM (12, 48.0%) for females.
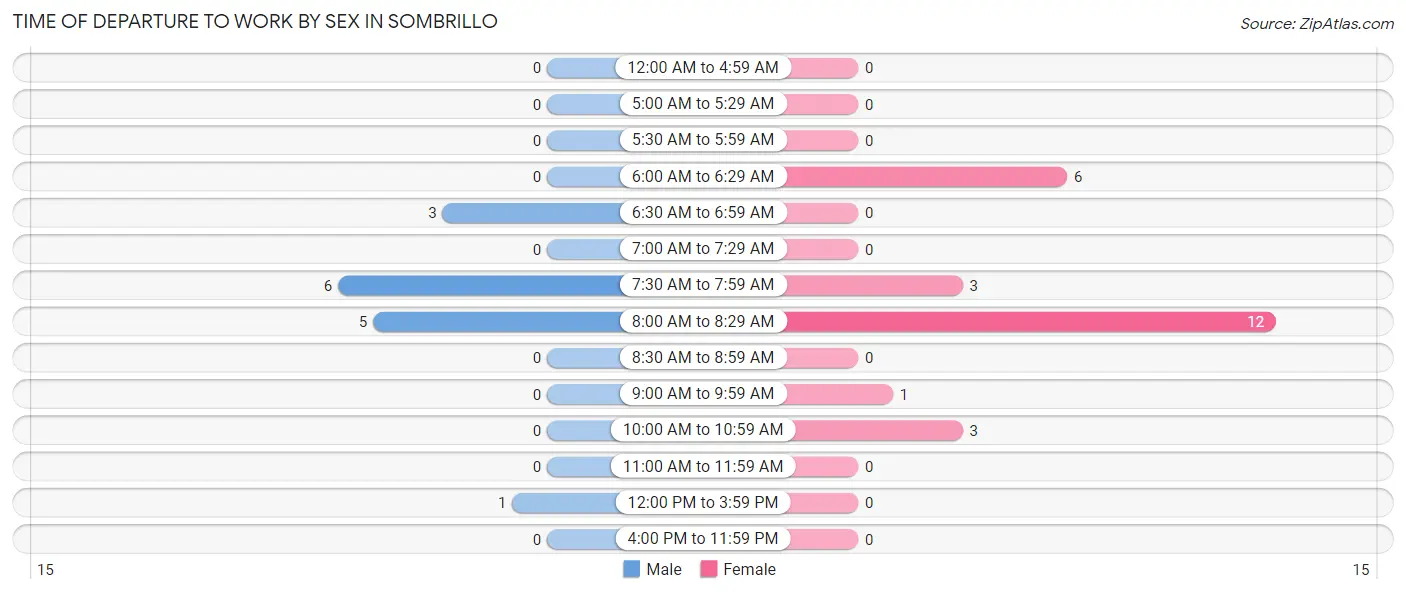
| Time of Departure | Male | Female |
| 12:00 AM to 4:59 AM | 0 (0.0%) | 0 (0.0%) |
| 5:00 AM to 5:29 AM | 0 (0.0%) | 0 (0.0%) |
| 5:30 AM to 5:59 AM | 0 (0.0%) | 0 (0.0%) |
| 6:00 AM to 6:29 AM | 0 (0.0%) | 6 (24.0%) |
| 6:30 AM to 6:59 AM | 3 (20.0%) | 0 (0.0%) |
| 7:00 AM to 7:29 AM | 0 (0.0%) | 0 (0.0%) |
| 7:30 AM to 7:59 AM | 6 (40.0%) | 3 (12.0%) |
| 8:00 AM to 8:29 AM | 5 (33.3%) | 12 (48.0%) |
| 8:30 AM to 8:59 AM | 0 (0.0%) | 0 (0.0%) |
| 9:00 AM to 9:59 AM | 0 (0.0%) | 1 (4.0%) |
| 10:00 AM to 10:59 AM | 0 (0.0%) | 3 (12.0%) |
| 11:00 AM to 11:59 AM | 0 (0.0%) | 0 (0.0%) |
| 12:00 PM to 3:59 PM | 1 (6.7%) | 0 (0.0%) |
| 4:00 PM to 11:59 PM | 0 (0.0%) | 0 (0.0%) |
| Total | 15 (100.0%) | 25 (100.0%) |
Housing Occupancy in Sombrillo
Occupancy by Ownership in Sombrillo
Of the total 47 dwellings in Sombrillo, owner-occupied units account for 47 (100.0%), while renter-occupied units make up 0 (0.0%).
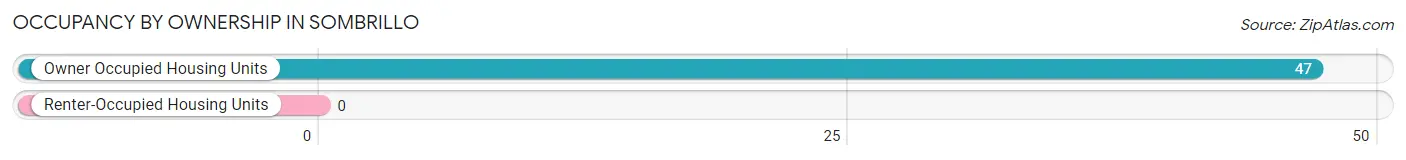
| Occupancy | # Housing Units | % Housing Units |
| Owner Occupied Housing Units | 47 | 100.0% |
| Renter-Occupied Housing Units | 0 | 0.0% |
| Total Occupied Housing Units | 47 | 100.0% |
Occupancy by Household Size in Sombrillo
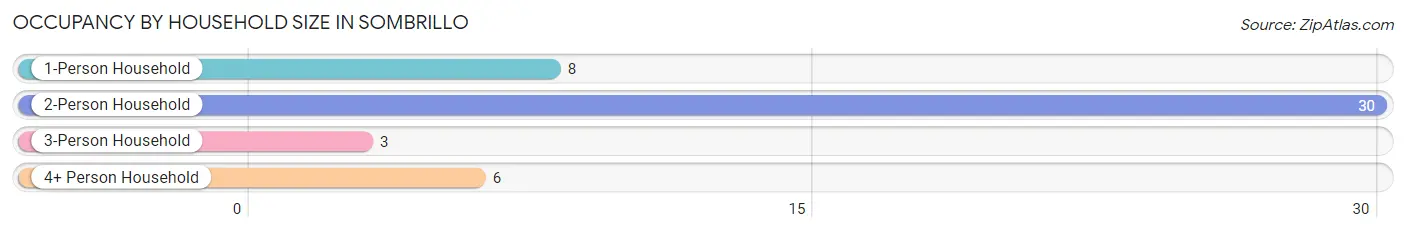
| Household Size | # Housing Units | % Housing Units |
| 1-Person Household | 8 | 17.0% |
| 2-Person Household | 30 | 63.8% |
| 3-Person Household | 3 | 6.4% |
| 4+ Person Household | 6 | 12.8% |
| Total Housing Units | 47 | 100.0% |
Occupancy by Ownership by Household Size in Sombrillo
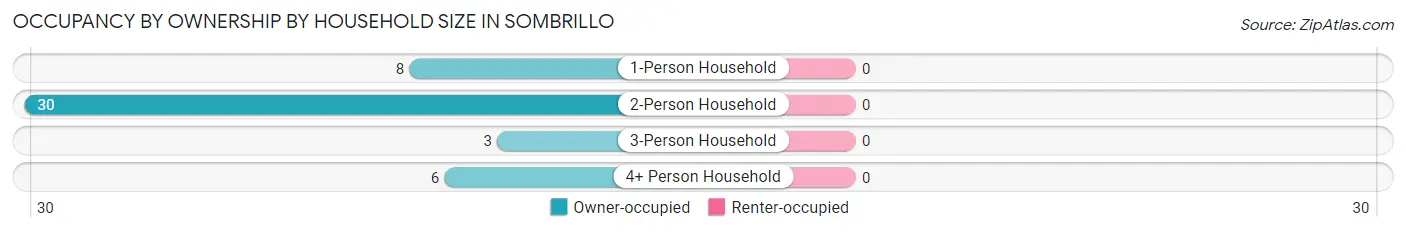
| Household Size | Owner-occupied | Renter-occupied |
| 1-Person Household | 8 (100.0%) | 0 (0.0%) |
| 2-Person Household | 30 (100.0%) | 0 (0.0%) |
| 3-Person Household | 3 (100.0%) | 0 (0.0%) |
| 4+ Person Household | 6 (100.0%) | 0 (0.0%) |
| Total Housing Units | 47 (100.0%) | 0 (0.0%) |
Occupancy by Educational Attainment in Sombrillo
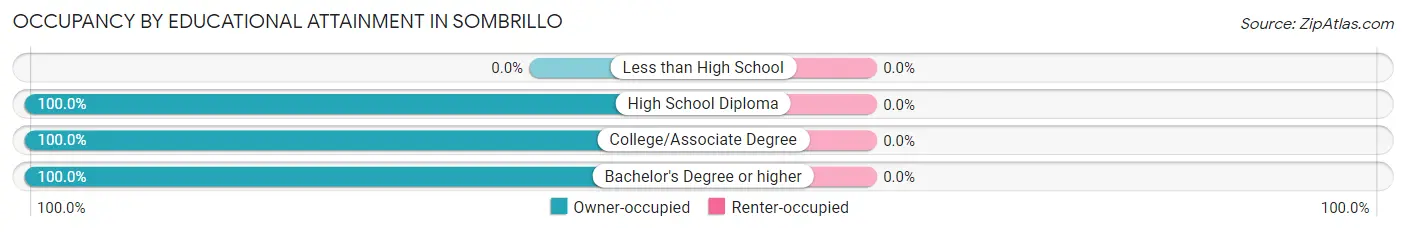
| Household Size | Owner-occupied | Renter-occupied |
| Less than High School | 0 (0.0%) | 0 (0.0%) |
| High School Diploma | 14 (100.0%) | 0 (0.0%) |
| College/Associate Degree | 14 (100.0%) | 0 (0.0%) |
| Bachelor's Degree or higher | 19 (100.0%) | 0 (0.0%) |
Occupancy by Age of Householder in Sombrillo
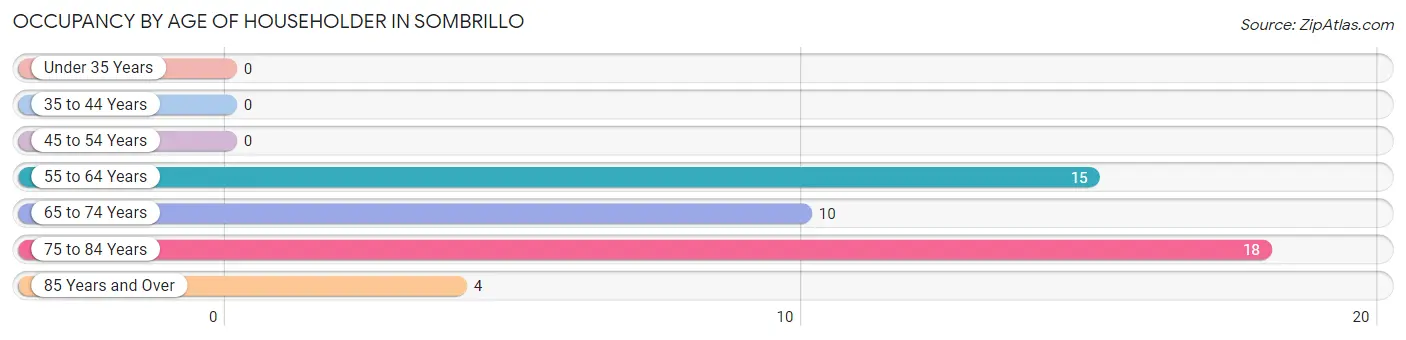
| Age Bracket | # Households | % Households |
| Under 35 Years | 0 | 0.0% |
| 35 to 44 Years | 0 | 0.0% |
| 45 to 54 Years | 0 | 0.0% |
| 55 to 64 Years | 15 | 31.9% |
| 65 to 74 Years | 10 | 21.3% |
| 75 to 84 Years | 18 | 38.3% |
| 85 Years and Over | 4 | 8.5% |
| Total | 47 | 100.0% |
Housing Finances in Sombrillo
Median Income by Occupancy in Sombrillo
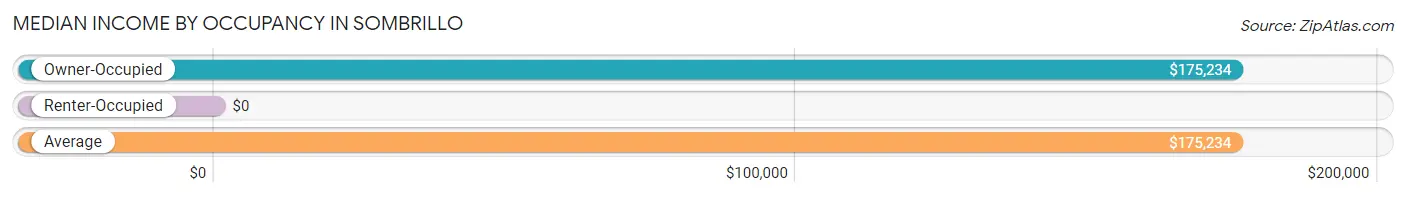
| Occupancy Type | # Households | Median Income |
| Owner-Occupied | 47 (100.0%) | $175,234 |
| Renter-Occupied | 0 (0.0%) | $0 |
| Average | 47 (100.0%) | $175,234 |
Occupancy by Householder Income Bracket in Sombrillo
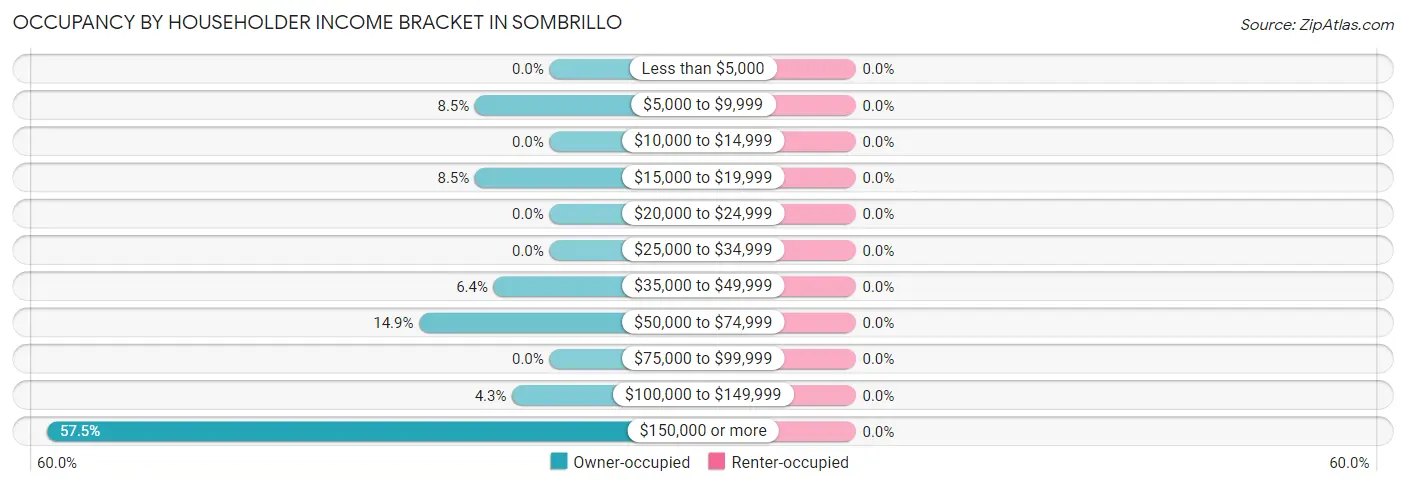
| Income Bracket | Owner-occupied | Renter-occupied |
| Less than $5,000 | 0 (0.0%) | 0 (0.0%) |
| $5,000 to $9,999 | 4 (8.5%) | 0 (0.0%) |
| $10,000 to $14,999 | 0 (0.0%) | 0 (0.0%) |
| $15,000 to $19,999 | 4 (8.5%) | 0 (0.0%) |
| $20,000 to $24,999 | 0 (0.0%) | 0 (0.0%) |
| $25,000 to $34,999 | 0 (0.0%) | 0 (0.0%) |
| $35,000 to $49,999 | 3 (6.4%) | 0 (0.0%) |
| $50,000 to $74,999 | 7 (14.9%) | 0 (0.0%) |
| $75,000 to $99,999 | 0 (0.0%) | 0 (0.0%) |
| $100,000 to $149,999 | 2 (4.3%) | 0 (0.0%) |
| $150,000 or more | 27 (57.5%) | 0 (0.0%) |
| Total | 47 (100.0%) | 0 (0.0%) |
Monthly Housing Cost Tiers in Sombrillo
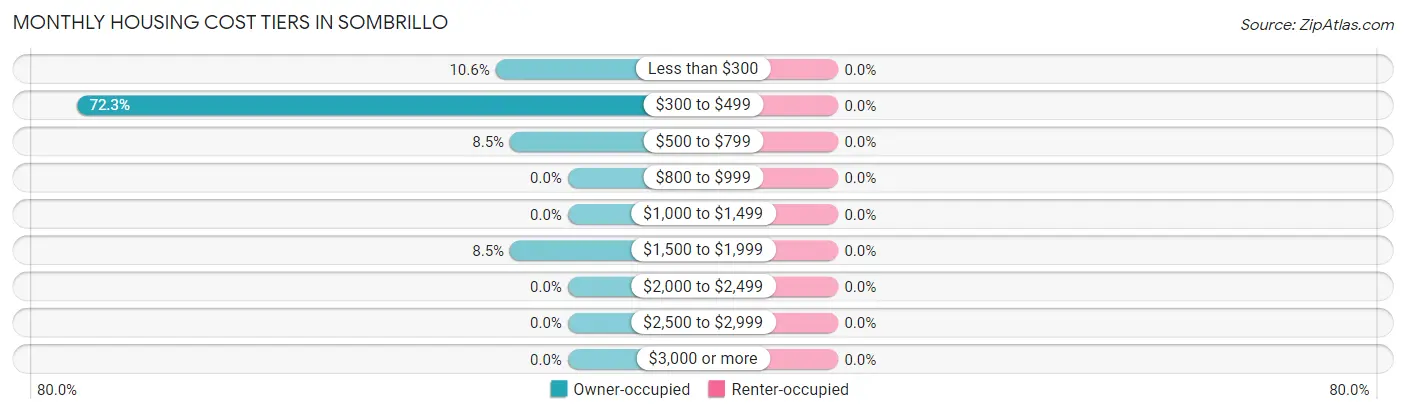
| Monthly Cost | Owner-occupied | Renter-occupied |
| Less than $300 | 5 (10.6%) | 0 (0.0%) |
| $300 to $499 | 34 (72.3%) | 0 (0.0%) |
| $500 to $799 | 4 (8.5%) | 0 (0.0%) |
| $800 to $999 | 0 (0.0%) | 0 (0.0%) |
| $1,000 to $1,499 | 0 (0.0%) | 0 (0.0%) |
| $1,500 to $1,999 | 4 (8.5%) | 0 (0.0%) |
| $2,000 to $2,499 | 0 (0.0%) | 0 (0.0%) |
| $2,500 to $2,999 | 0 (0.0%) | 0 (0.0%) |
| $3,000 or more | 0 (0.0%) | 0 (0.0%) |
| Total | 47 (100.0%) | 0 (0.0%) |
Physical Housing Characteristics in Sombrillo
Housing Structures in Sombrillo
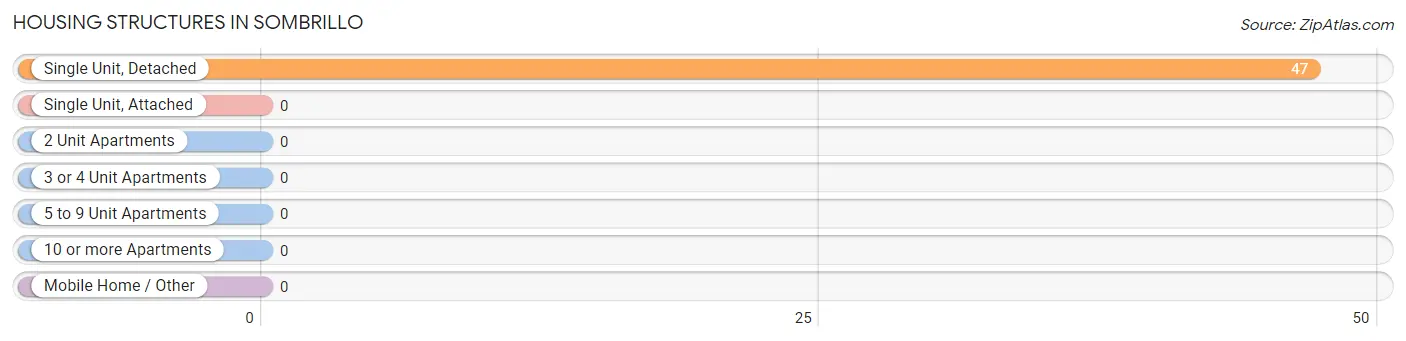
| Structure Type | # Housing Units | % Housing Units |
| Single Unit, Detached | 47 | 100.0% |
| Single Unit, Attached | 0 | 0.0% |
| 2 Unit Apartments | 0 | 0.0% |
| 3 or 4 Unit Apartments | 0 | 0.0% |
| 5 to 9 Unit Apartments | 0 | 0.0% |
| 10 or more Apartments | 0 | 0.0% |
| Mobile Home / Other | 0 | 0.0% |
| Total | 47 | 100.0% |
Housing Structures by Occupancy in Sombrillo
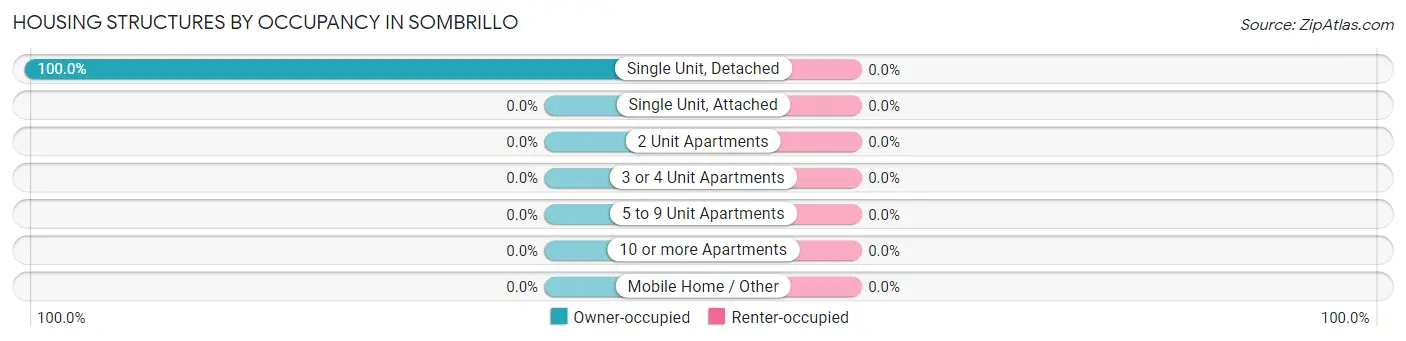
| Structure Type | Owner-occupied | Renter-occupied |
| Single Unit, Detached | 47 (100.0%) | 0 (0.0%) |
| Single Unit, Attached | 0 (0.0%) | 0 (0.0%) |
| 2 Unit Apartments | 0 (0.0%) | 0 (0.0%) |
| 3 or 4 Unit Apartments | 0 (0.0%) | 0 (0.0%) |
| 5 to 9 Unit Apartments | 0 (0.0%) | 0 (0.0%) |
| 10 or more Apartments | 0 (0.0%) | 0 (0.0%) |
| Mobile Home / Other | 0 (0.0%) | 0 (0.0%) |
| Total | 47 (100.0%) | 0 (0.0%) |
Housing Structures by Number of Rooms in Sombrillo
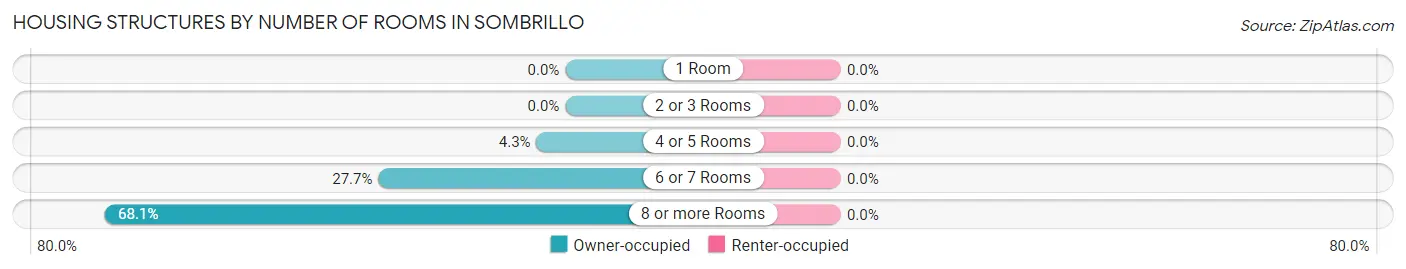
| Number of Rooms | Owner-occupied | Renter-occupied |
| 1 Room | 0 (0.0%) | 0 (0.0%) |
| 2 or 3 Rooms | 0 (0.0%) | 0 (0.0%) |
| 4 or 5 Rooms | 2 (4.3%) | 0 (0.0%) |
| 6 or 7 Rooms | 13 (27.7%) | 0 (0.0%) |
| 8 or more Rooms | 32 (68.1%) | 0 (0.0%) |
| Total | 47 (100.0%) | 0 (0.0%) |
Housing Structure by Heating Type in Sombrillo
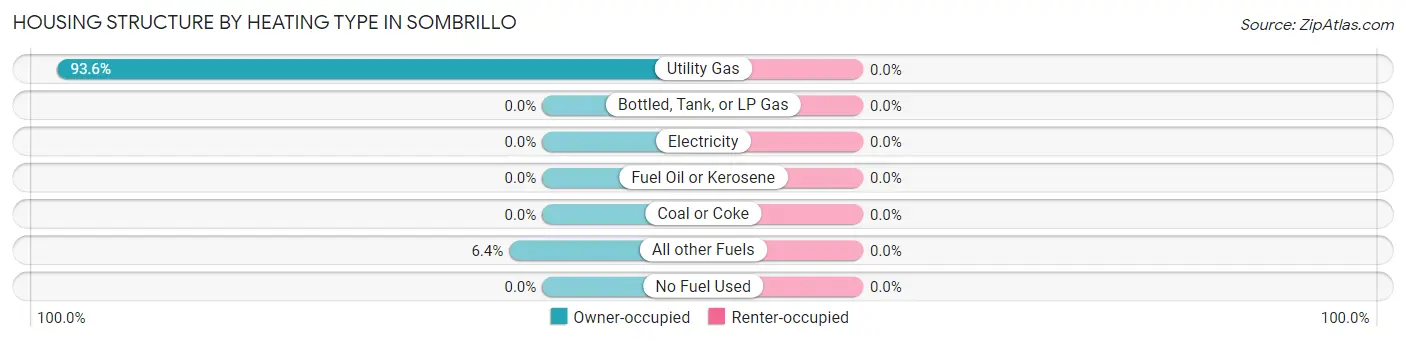
| Heating Type | Owner-occupied | Renter-occupied |
| Utility Gas | 44 (93.6%) | 0 (0.0%) |
| Bottled, Tank, or LP Gas | 0 (0.0%) | 0 (0.0%) |
| Electricity | 0 (0.0%) | 0 (0.0%) |
| Fuel Oil or Kerosene | 0 (0.0%) | 0 (0.0%) |
| Coal or Coke | 0 (0.0%) | 0 (0.0%) |
| All other Fuels | 3 (6.4%) | 0 (0.0%) |
| No Fuel Used | 0 (0.0%) | 0 (0.0%) |
| Total | 47 (100.0%) | 0 (0.0%) |
Household Vehicle Usage in Sombrillo
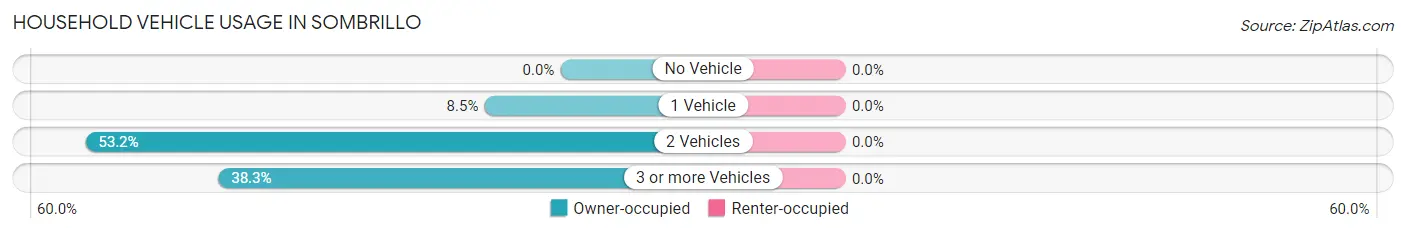
| Vehicles per Household | Owner-occupied | Renter-occupied |
| No Vehicle | 0 (0.0%) | 0 (0.0%) |
| 1 Vehicle | 4 (8.5%) | 0 (0.0%) |
| 2 Vehicles | 25 (53.2%) | 0 (0.0%) |
| 3 or more Vehicles | 18 (38.3%) | 0 (0.0%) |
| Total | 47 (100.0%) | 0 (0.0%) |
Real Estate & Mortgages in Sombrillo
Real Estate and Mortgage Overview in Sombrillo
| Characteristic | Without Mortgage | With Mortgage |
| Housing Units | 43 | 4 |
| Median Property Value | $246,300 | $0 |
| Median Household Income | $175,078 | $3 |
| Monthly Housing Costs | $356 | $0 |
| Real Estate Taxes | $1,275 | $0 |
Property Value by Mortgage Status in Sombrillo
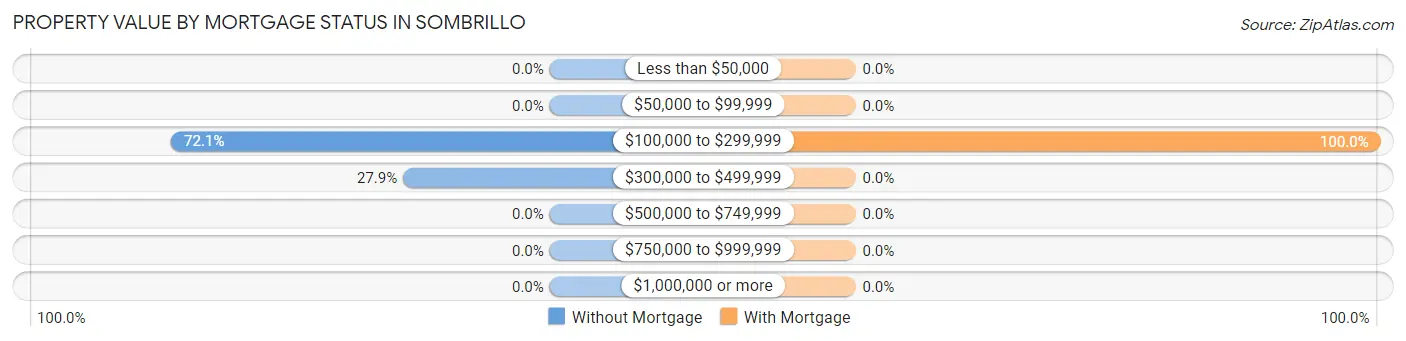
| Property Value | Without Mortgage | With Mortgage |
| Less than $50,000 | 0 (0.0%) | 0 (0.0%) |
| $50,000 to $99,999 | 0 (0.0%) | 0 (0.0%) |
| $100,000 to $299,999 | 31 (72.1%) | 4 (100.0%) |
| $300,000 to $499,999 | 12 (27.9%) | 0 (0.0%) |
| $500,000 to $749,999 | 0 (0.0%) | 0 (0.0%) |
| $750,000 to $999,999 | 0 (0.0%) | 0 (0.0%) |
| $1,000,000 or more | 0 (0.0%) | 0 (0.0%) |
| Total | 43 (100.0%) | 4 (100.0%) |
Household Income by Mortgage Status in Sombrillo
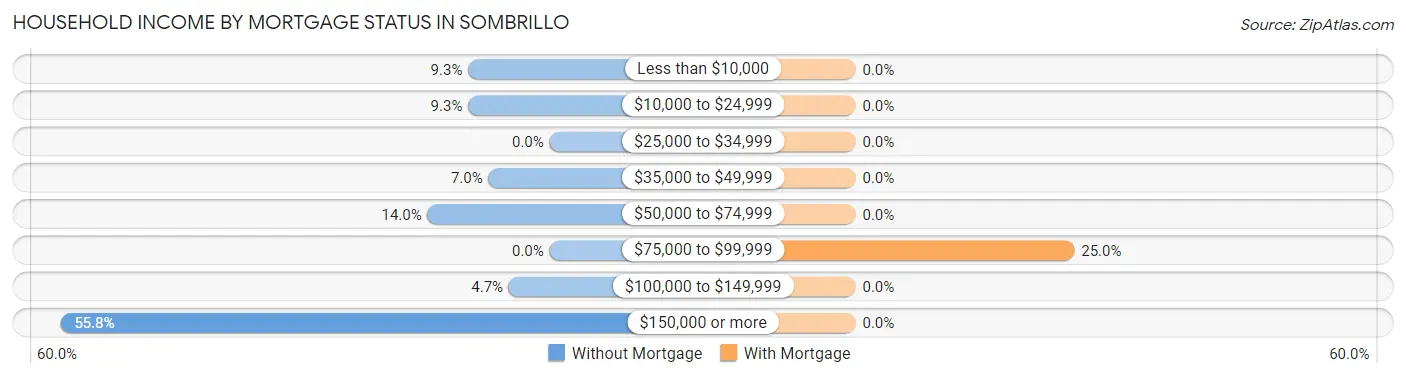
| Household Income | Without Mortgage | With Mortgage |
| Less than $10,000 | 4 (9.3%) | 0 (0.0%) |
| $10,000 to $24,999 | 4 (9.3%) | 0 (0.0%) |
| $25,000 to $34,999 | 0 (0.0%) | 0 (0.0%) |
| $35,000 to $49,999 | 3 (7.0%) | 0 (0.0%) |
| $50,000 to $74,999 | 6 (14.0%) | 0 (0.0%) |
| $75,000 to $99,999 | 0 (0.0%) | 1 (25.0%) |
| $100,000 to $149,999 | 2 (4.6%) | 0 (0.0%) |
| $150,000 or more | 24 (55.8%) | 0 (0.0%) |
| Total | 43 (100.0%) | 4 (100.0%) |
Property Value to Household Income Ratio in Sombrillo
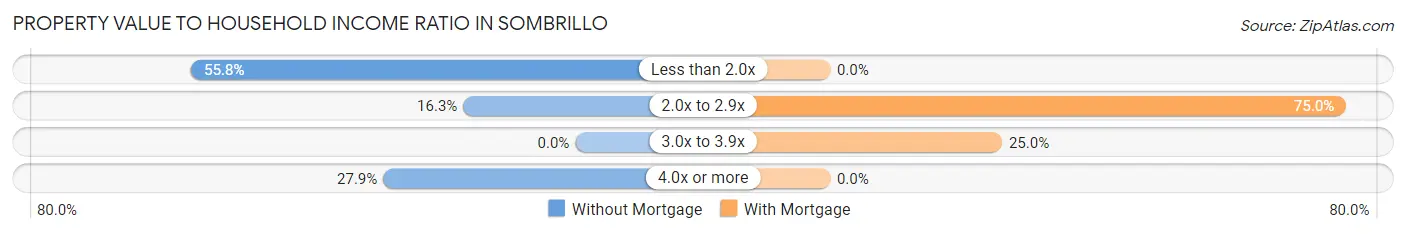
| Value-to-Income Ratio | Without Mortgage | With Mortgage |
| Less than 2.0x | 24 (55.8%) | 0 (0.0%) |
| 2.0x to 2.9x | 7 (16.3%) | 3 (75.0%) |
| 3.0x to 3.9x | 0 (0.0%) | 1 (25.0%) |
| 4.0x or more | 12 (27.9%) | 0 (0.0%) |
| Total | 43 (100.0%) | 4 (100.0%) |
Real Estate Taxes by Mortgage Status in Sombrillo
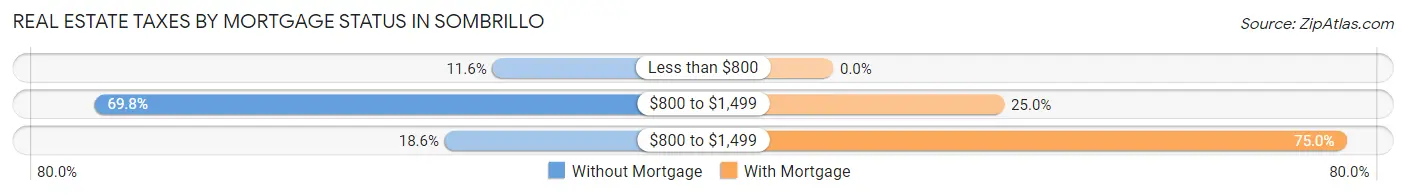
| Property Taxes | Without Mortgage | With Mortgage |
| Less than $800 | 5 (11.6%) | 0 (0.0%) |
| $800 to $1,499 | 30 (69.8%) | 1 (25.0%) |
| $800 to $1,499 | 8 (18.6%) | 3 (75.0%) |
| Total | 43 (100.0%) | 4 (100.0%) |
Health & Disability in Sombrillo
Health Insurance Coverage by Age in Sombrillo
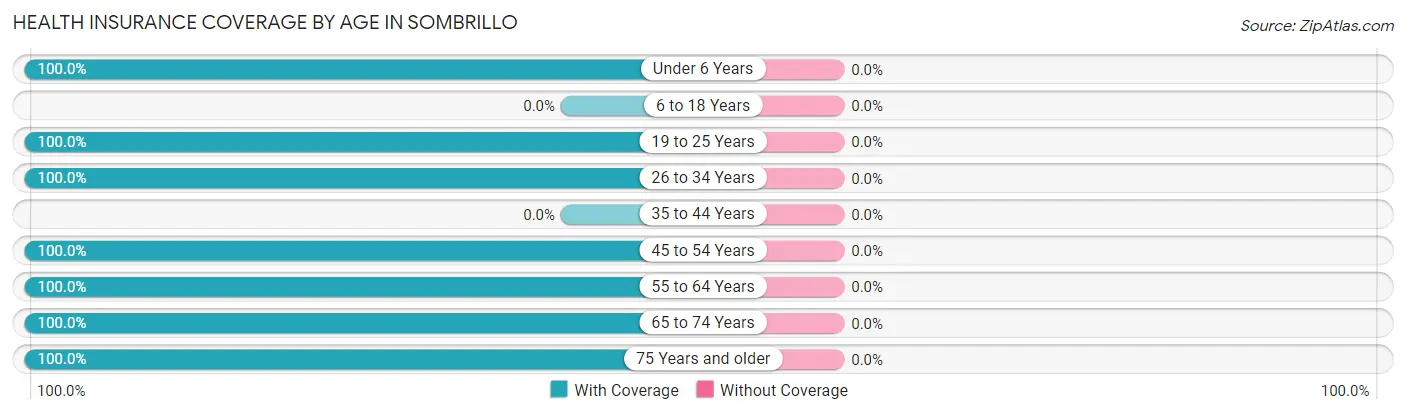
| Age Bracket | With Coverage | Without Coverage |
| Under 6 Years | 15 (100.0%) | 0 (0.0%) |
| 6 to 18 Years | 0 (0.0%) | 0 (0.0%) |
| 19 to 25 Years | 5 (100.0%) | 0 (0.0%) |
| 26 to 34 Years | 3 (100.0%) | 0 (0.0%) |
| 35 to 44 Years | 0 (0.0%) | 0 (0.0%) |
| 45 to 54 Years | 6 (100.0%) | 0 (0.0%) |
| 55 to 64 Years | 33 (100.0%) | 0 (0.0%) |
| 65 to 74 Years | 15 (100.0%) | 0 (0.0%) |
| 75 Years and older | 43 (100.0%) | 0 (0.0%) |
| Total | 120 (100.0%) | 0 (0.0%) |
Health Insurance Coverage by Citizenship Status in Sombrillo
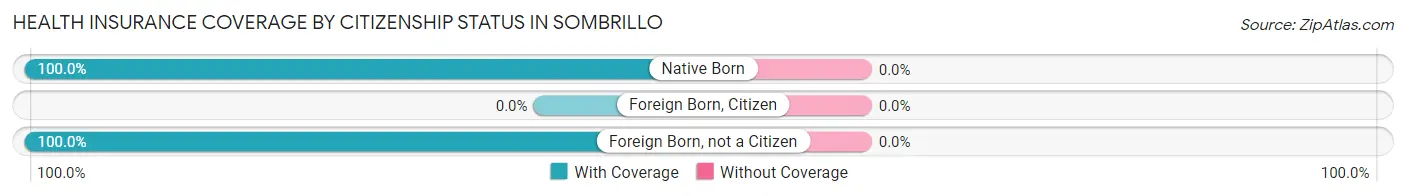
| Citizenship Status | With Coverage | Without Coverage |
| Native Born | 15 (100.0%) | 0 (0.0%) |
| Foreign Born, Citizen | 0 (0.0%) | 0 (0.0%) |
| Foreign Born, not a Citizen | 5 (100.0%) | 0 (0.0%) |
Health Insurance Coverage by Household Income in Sombrillo
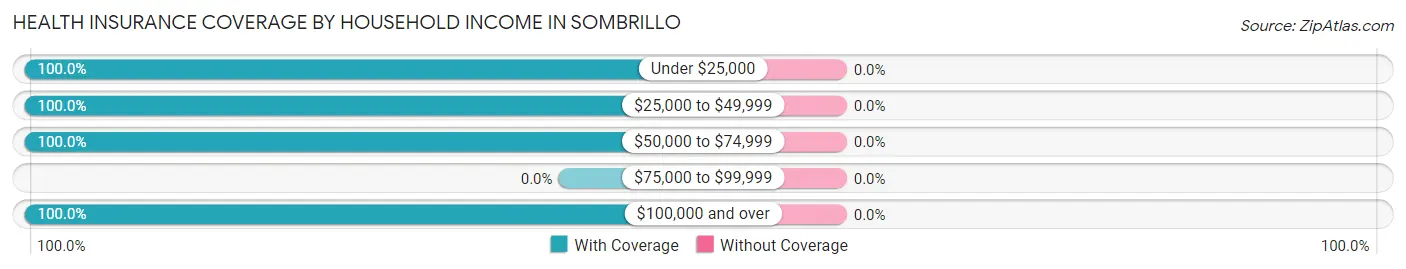
| Household Income | With Coverage | Without Coverage |
| Under $25,000 | 8 (100.0%) | 0 (0.0%) |
| $25,000 to $49,999 | 6 (100.0%) | 0 (0.0%) |
| $50,000 to $74,999 | 15 (100.0%) | 0 (0.0%) |
| $75,000 to $99,999 | 0 (0.0%) | 0 (0.0%) |
| $100,000 and over | 91 (100.0%) | 0 (0.0%) |
Public vs Private Health Insurance Coverage by Age in Sombrillo
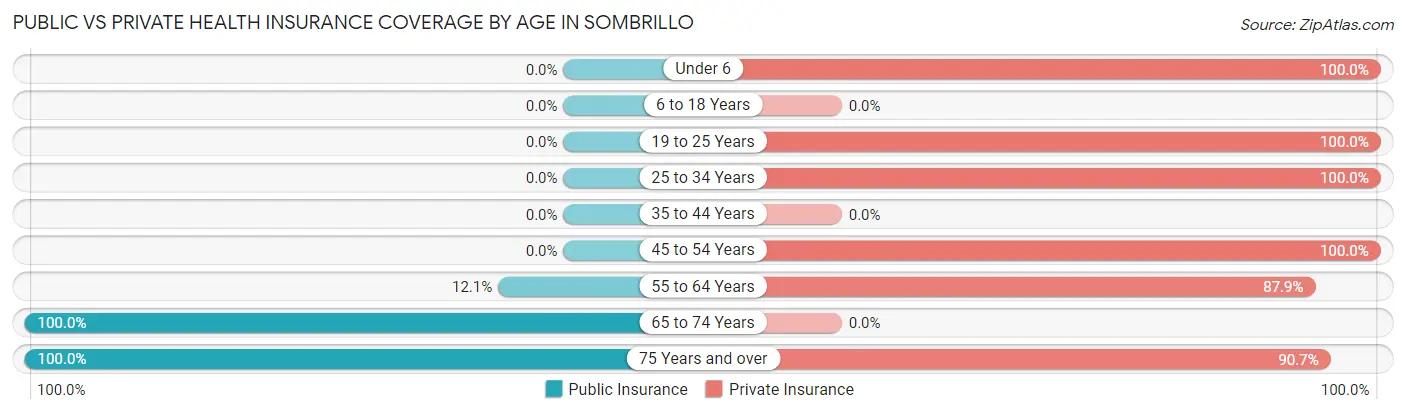
| Age Bracket | Public Insurance | Private Insurance |
| Under 6 | 0 (0.0%) | 15 (100.0%) |
| 6 to 18 Years | 0 (0.0%) | 0 (0.0%) |
| 19 to 25 Years | 0 (0.0%) | 5 (100.0%) |
| 25 to 34 Years | 0 (0.0%) | 3 (100.0%) |
| 35 to 44 Years | 0 (0.0%) | 0 (0.0%) |
| 45 to 54 Years | 0 (0.0%) | 6 (100.0%) |
| 55 to 64 Years | 4 (12.1%) | 29 (87.9%) |
| 65 to 74 Years | 15 (100.0%) | 0 (0.0%) |
| 75 Years and over | 43 (100.0%) | 39 (90.7%) |
| Total | 62 (51.7%) | 97 (80.8%) |
Disability Status by Sex by Age in Sombrillo
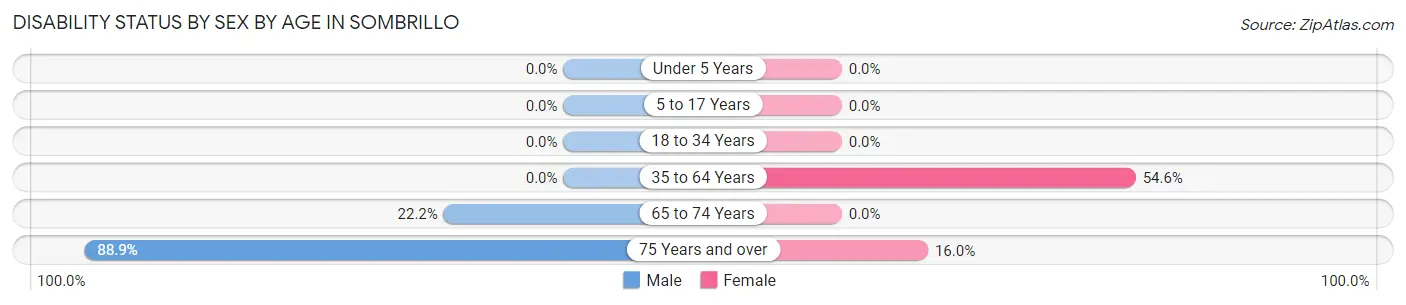
| Age Bracket | Male | Female |
| Under 5 Years | 0 (0.0%) | 0 (0.0%) |
| 5 to 17 Years | 0 (0.0%) | 0 (0.0%) |
| 18 to 34 Years | 0 (0.0%) | 0 (0.0%) |
| 35 to 64 Years | 0 (0.0%) | 12 (54.5%) |
| 65 to 74 Years | 2 (22.2%) | 0 (0.0%) |
| 75 Years and over | 16 (88.9%) | 4 (16.0%) |
Disability Class by Sex by Age in Sombrillo
Disability Class: Hearing Difficulty
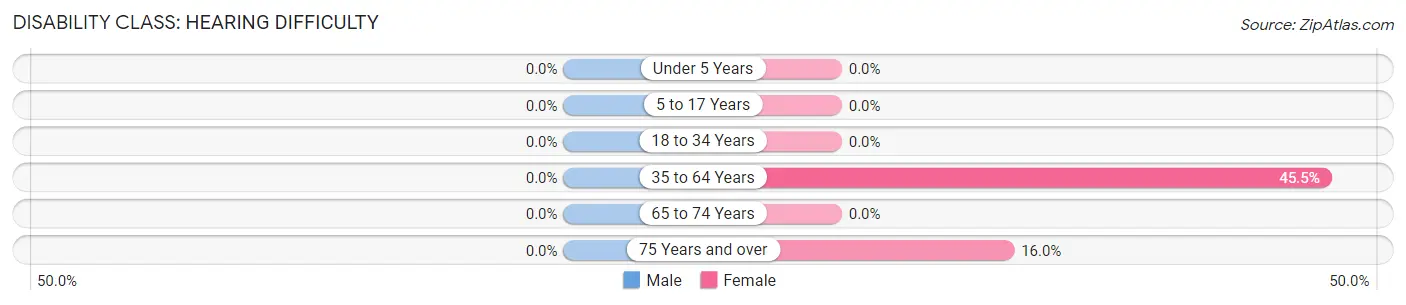
| Age Bracket | Male | Female |
| Under 5 Years | 0 (0.0%) | 0 (0.0%) |
| 5 to 17 Years | 0 (0.0%) | 0 (0.0%) |
| 18 to 34 Years | 0 (0.0%) | 0 (0.0%) |
| 35 to 64 Years | 0 (0.0%) | 10 (45.5%) |
| 65 to 74 Years | 0 (0.0%) | 0 (0.0%) |
| 75 Years and over | 0 (0.0%) | 4 (16.0%) |
Disability Class: Vision Difficulty
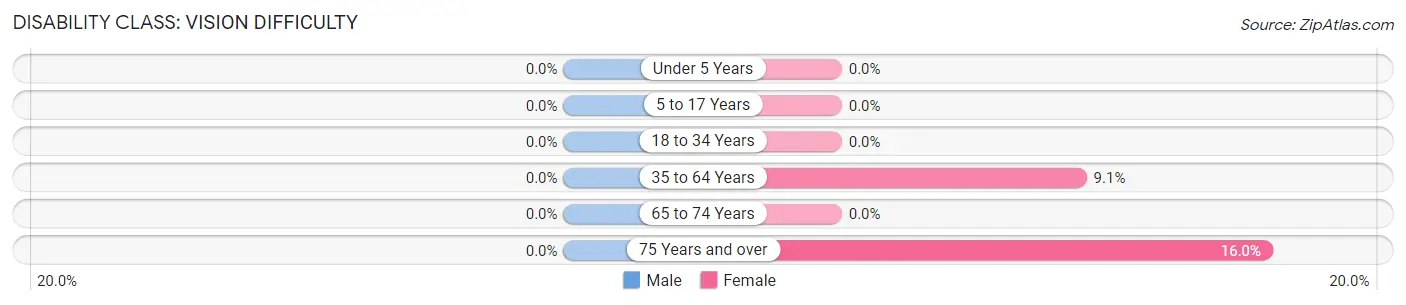
| Age Bracket | Male | Female |
| Under 5 Years | 0 (0.0%) | 0 (0.0%) |
| 5 to 17 Years | 0 (0.0%) | 0 (0.0%) |
| 18 to 34 Years | 0 (0.0%) | 0 (0.0%) |
| 35 to 64 Years | 0 (0.0%) | 2 (9.1%) |
| 65 to 74 Years | 0 (0.0%) | 0 (0.0%) |
| 75 Years and over | 0 (0.0%) | 4 (16.0%) |
Disability Class: Cognitive Difficulty
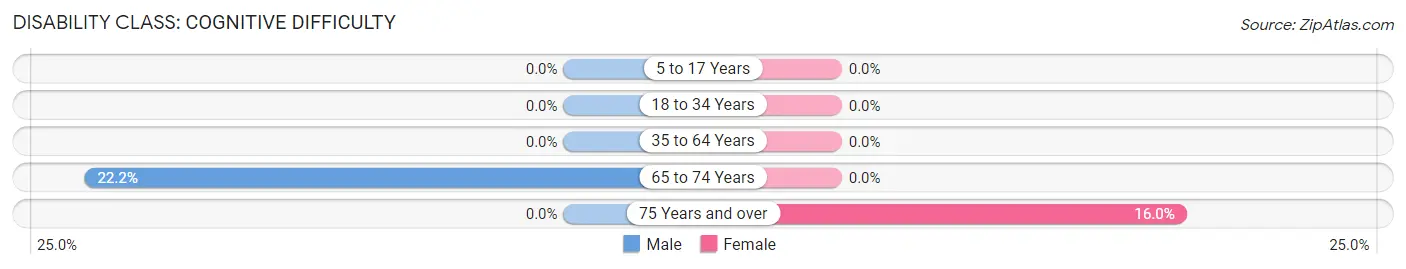
| Age Bracket | Male | Female |
| 5 to 17 Years | 0 (0.0%) | 0 (0.0%) |
| 18 to 34 Years | 0 (0.0%) | 0 (0.0%) |
| 35 to 64 Years | 0 (0.0%) | 0 (0.0%) |
| 65 to 74 Years | 2 (22.2%) | 0 (0.0%) |
| 75 Years and over | 0 (0.0%) | 4 (16.0%) |
Disability Class: Ambulatory Difficulty
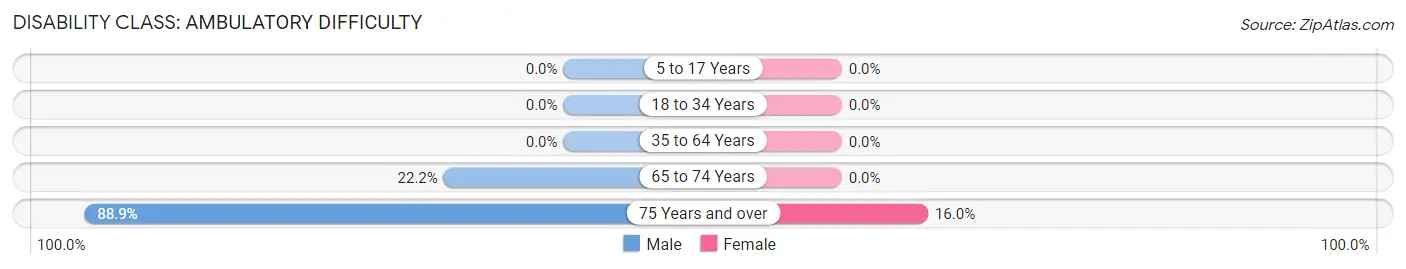
| Age Bracket | Male | Female |
| 5 to 17 Years | 0 (0.0%) | 0 (0.0%) |
| 18 to 34 Years | 0 (0.0%) | 0 (0.0%) |
| 35 to 64 Years | 0 (0.0%) | 0 (0.0%) |
| 65 to 74 Years | 2 (22.2%) | 0 (0.0%) |
| 75 Years and over | 16 (88.9%) | 4 (16.0%) |
Disability Class: Self-Care Difficulty
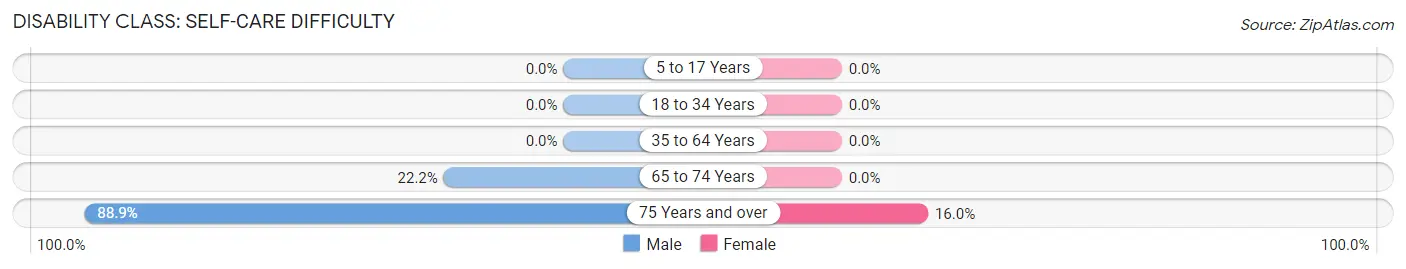
| Age Bracket | Male | Female |
| 5 to 17 Years | 0 (0.0%) | 0 (0.0%) |
| 18 to 34 Years | 0 (0.0%) | 0 (0.0%) |
| 35 to 64 Years | 0 (0.0%) | 0 (0.0%) |
| 65 to 74 Years | 2 (22.2%) | 0 (0.0%) |
| 75 Years and over | 16 (88.9%) | 4 (16.0%) |
Technology Access in Sombrillo
Computing Device Access in Sombrillo
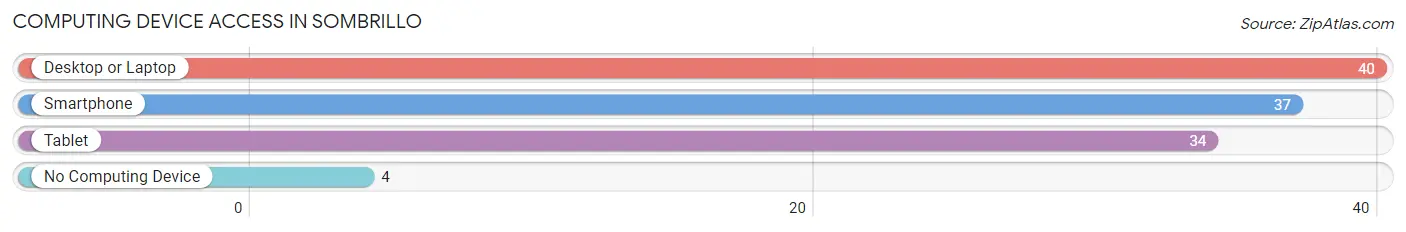
| Device Type | # Households | % Households |
| Desktop or Laptop | 40 | 85.1% |
| Smartphone | 37 | 78.7% |
| Tablet | 34 | 72.3% |
| No Computing Device | 4 | 8.5% |
| Total | 47 | 100.0% |
Internet Access in Sombrillo
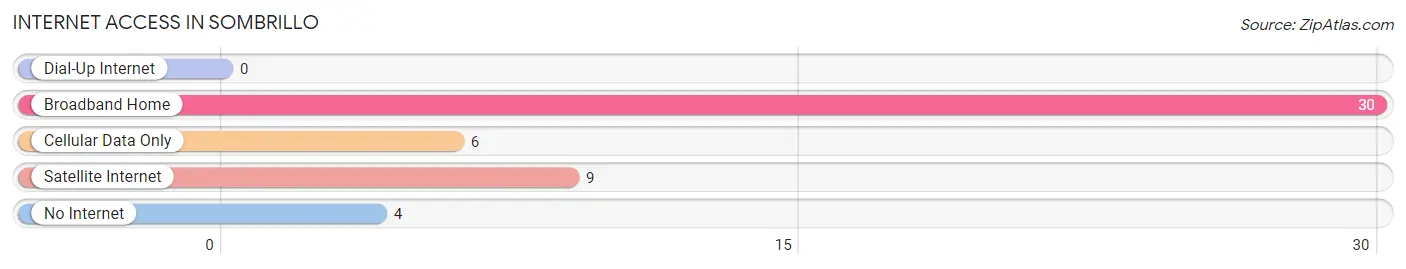
| Internet Type | # Households | % Households |
| Dial-Up Internet | 0 | 0.0% |
| Broadband Home | 30 | 63.8% |
| Cellular Data Only | 6 | 12.8% |
| Satellite Internet | 9 | 19.2% |
| No Internet | 4 | 8.5% |
| Total | 47 | 100.0% |
Sombrillo Summary
Sombrillo is a small unincorporated community located in the state of New Mexico. It is situated in the northern part of the state, in the county of Rio Arriba. The community is located in the foothills of the Sangre de Cristo Mountains, and is surrounded by the Chama River Valley. The population of Sombrillo was estimated to be around 200 people in 2000.
History
The area that is now Sombrillo was originally inhabited by the Tewa Indians. The Tewa were a Pueblo people who lived in the area for centuries before the arrival of the Spanish in the 16th century. The Spanish established a mission in the area in 1620, and the Tewa were forced to convert to Catholicism. The mission was abandoned in 1680, and the Tewa returned to their traditional way of life.
In the late 19th century, the area was settled by Anglo-American settlers. The settlement was originally known as "Sombrillo Springs," and was named after the nearby springs that provided water for the settlers. The settlement was officially established in 1891, and the post office was established in 1895.
Geography
Sombrillo is located in the northern part of New Mexico, in the county of Rio Arriba. The community is situated in the foothills of the Sangre de Cristo Mountains, and is surrounded by the Chama River Valley. The elevation of Sombrillo is 6,400 feet above sea level.
The climate of Sombrillo is semi-arid, with hot summers and cold winters. The average annual temperature is around 50 degrees Fahrenheit, and the average annual precipitation is around 12 inches.
Economy
The economy of Sombrillo is largely based on agriculture and tourism. The area is known for its production of apples, peaches, and other fruits and vegetables. The area is also popular with tourists, who come to enjoy the scenic beauty of the Sangre de Cristo Mountains and the Chama River Valley.
Demographics
As of the 2000 census, the population of Sombrillo was estimated to be around 200 people. The racial makeup of the community was 95.5% White, 0.5% African American, 0.5% Native American, 0.5% Asian, and 3% from other races. The median household income was $25,000, and the median family income was $30,000. The per capita income was $14,000.
Common Questions
What is Per Capita Income in Sombrillo?
Per Capita income in Sombrillo is $60,278.
What is the Median Family Income in Sombrillo?
Median Family Income in Sombrillo is $174,375.
What is the Median Household income in Sombrillo?
Median Household Income in Sombrillo is $175,234.
What is Inequality or Gini Index in Sombrillo?
Inequality or Gini Index in Sombrillo is 0.35.
What is the Total Population of Sombrillo?
Total Population of Sombrillo is 120.
What is the Total Male Population of Sombrillo?
Total Male Population of Sombrillo is 44.
What is the Total Female Population of Sombrillo?
Total Female Population of Sombrillo is 76.
What is the Ratio of Males per 100 Females in Sombrillo?
There are 57.89 Males per 100 Females in Sombrillo.
What is the Ratio of Females per 100 Males in Sombrillo?
There are 172.73 Females per 100 Males in Sombrillo.
What is the Median Population Age in Sombrillo?
Median Population Age in Sombrillo is 63.0 Years.
What is the Average Family Size in Sombrillo
Average Family Size in Sombrillo is 2.6 People.
What is the Average Household Size in Sombrillo
Average Household Size in Sombrillo is 2.5 People.
How Large is the Labor Force in Sombrillo?
There are 40 People in the Labor Forcein in Sombrillo.
What is the Percentage of People in the Labor Force in Sombrillo?
38.1% of People are in the Labor Force in Sombrillo.