Winterville, NC Map & Demographics
Winterville Map
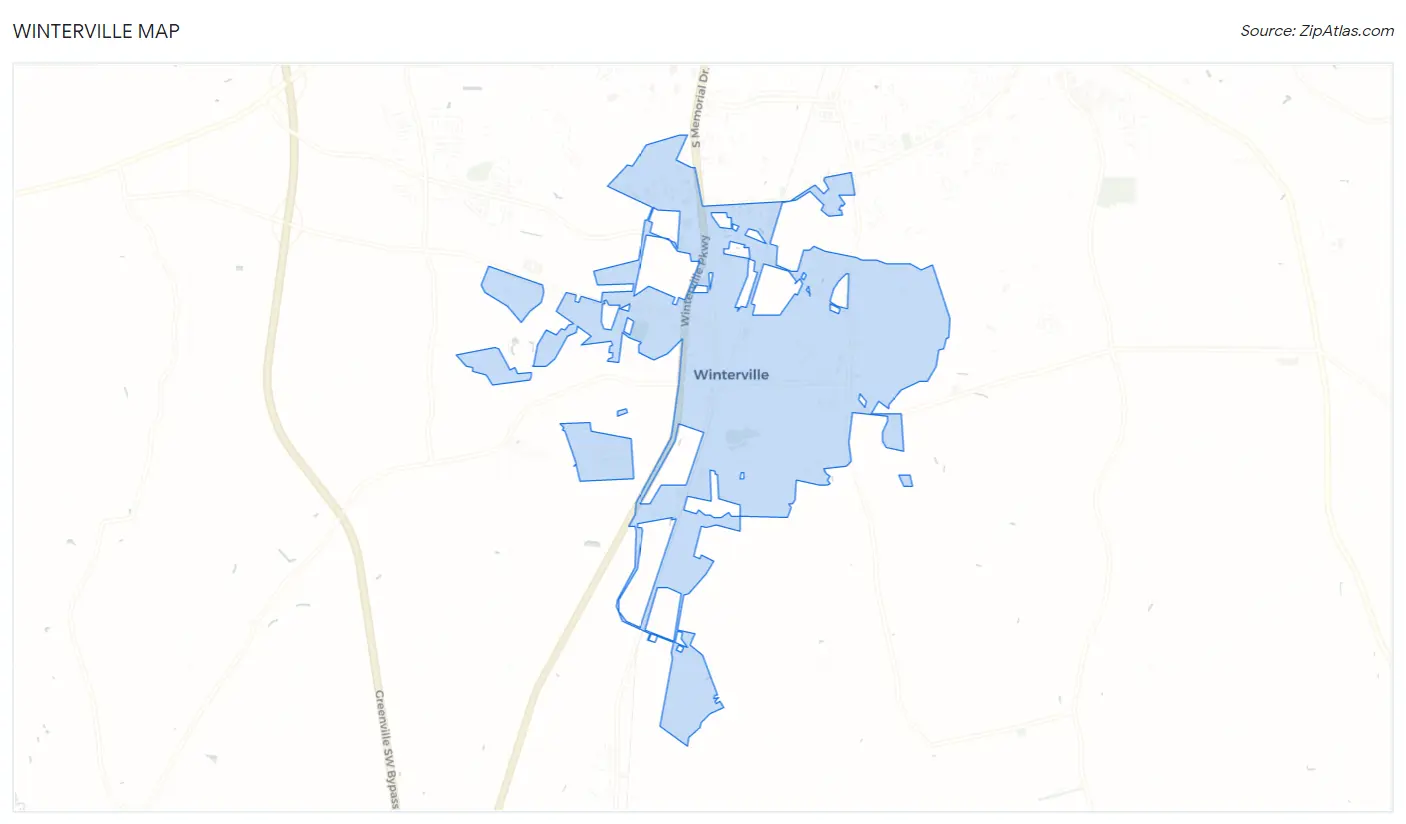
Winterville Overview
$38,652
PER CAPITA INCOME
$85,991
AVG FAMILY INCOME
$82,969
AVG HOUSEHOLD INCOME
36.4%
WAGE / INCOME GAP [ % ]
63.6¢/ $1
WAGE / INCOME GAP [ $ ]
0.37
INEQUALITY / GINI INDEX
10,510
TOTAL POPULATION
5,374
MALE POPULATION
5,136
FEMALE POPULATION
104.63
MALES / 100 FEMALES
95.57
FEMALES / 100 MALES
39.6
MEDIAN AGE
2.8
AVG FAMILY SIZE
2.4
AVG HOUSEHOLD SIZE
5,936
LABOR FORCE [ PEOPLE ]
68.7%
PERCENT IN LABOR FORCE
4.1%
UNEMPLOYMENT RATE
Winterville Zip Codes
Winterville Area Codes
Income in Winterville
Income Overview in Winterville
Per Capita Income in Winterville is $38,652, while median incomes of families and households are $85,991 and $82,969 respectively.
| Characteristic | Number | Measure |
| Per Capita Income | 10,510 | $38,652 |
| Median Family Income | 3,175 | $85,991 |
| Mean Family Income | 3,175 | $100,214 |
| Median Household Income | 4,309 | $82,969 |
| Mean Household Income | 4,309 | $95,316 |
| Income Deficit | 3,175 | $0 |
| Wage / Income Gap (%) | 10,510 | 36.38% |
| Wage / Income Gap ($) | 10,510 | 63.62¢ per $1 |
| Gini / Inequality Index | 10,510 | 0.37 |
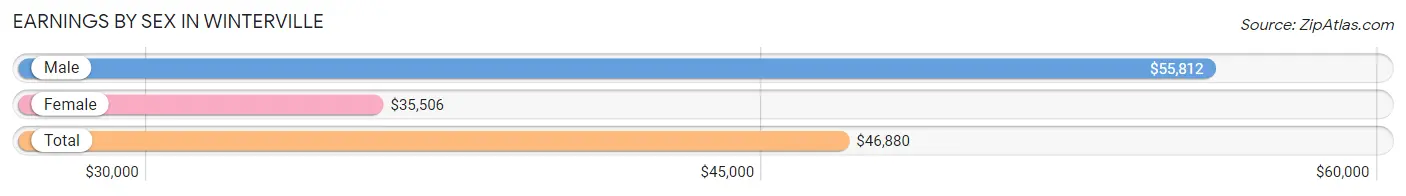
Earnings by Sex in Winterville
Average Earnings in Winterville are $46,880, $55,812 for men and $35,506 for women, a difference of 36.4%.
| Sex | Number | Average Earnings |
| Male | 3,446 (55.7%) | $55,812 |
| Female | 2,742 (44.3%) | $35,506 |
| Total | 6,188 (100.0%) | $46,880 |
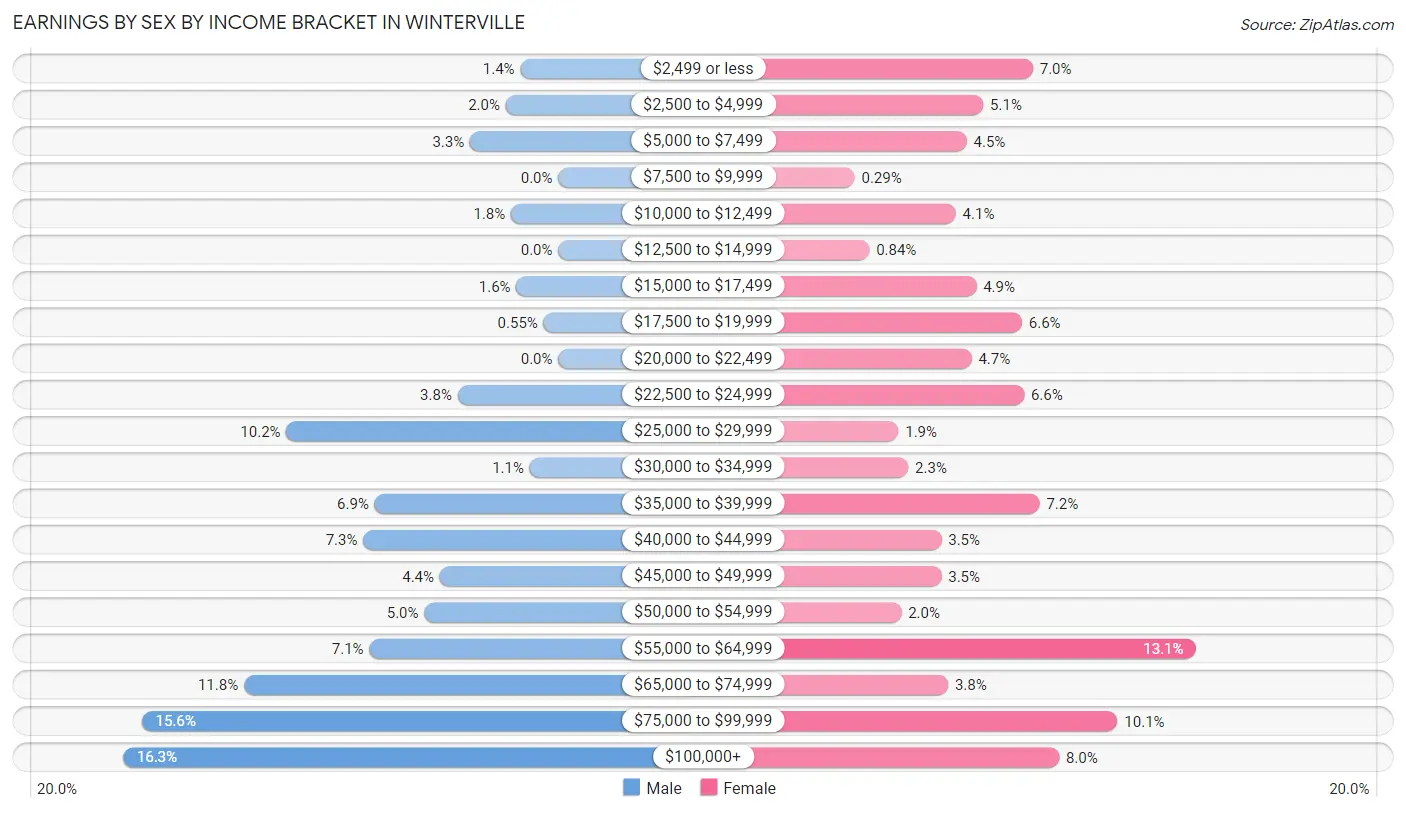
Earnings by Sex by Income Bracket in Winterville
The most common earnings brackets in Winterville are $100,000+ for men (561 | 16.3%) and $55,000 to $64,999 for women (358 | 13.1%).
| Income | Male | Female |
| $2,499 or less | 49 (1.4%) | 191 (7.0%) |
| $2,500 to $4,999 | 68 (2.0%) | 140 (5.1%) |
| $5,000 to $7,499 | 114 (3.3%) | 123 (4.5%) |
| $7,500 to $9,999 | 0 (0.0%) | 8 (0.3%) |
| $10,000 to $12,499 | 61 (1.8%) | 112 (4.1%) |
| $12,500 to $14,999 | 0 (0.0%) | 23 (0.8%) |
| $15,000 to $17,499 | 54 (1.6%) | 133 (4.9%) |
| $17,500 to $19,999 | 19 (0.5%) | 180 (6.6%) |
| $20,000 to $22,499 | 0 (0.0%) | 128 (4.7%) |
| $22,500 to $24,999 | 130 (3.8%) | 182 (6.6%) |
| $25,000 to $29,999 | 351 (10.2%) | 53 (1.9%) |
| $30,000 to $34,999 | 37 (1.1%) | 63 (2.3%) |
| $35,000 to $39,999 | 237 (6.9%) | 198 (7.2%) |
| $40,000 to $44,999 | 252 (7.3%) | 97 (3.5%) |
| $45,000 to $49,999 | 153 (4.4%) | 97 (3.5%) |
| $50,000 to $54,999 | 173 (5.0%) | 56 (2.0%) |
| $55,000 to $64,999 | 244 (7.1%) | 358 (13.1%) |
| $65,000 to $74,999 | 406 (11.8%) | 104 (3.8%) |
| $75,000 to $99,999 | 537 (15.6%) | 278 (10.1%) |
| $100,000+ | 561 (16.3%) | 218 (8.0%) |
| Total | 3,446 (100.0%) | 2,742 (100.0%) |
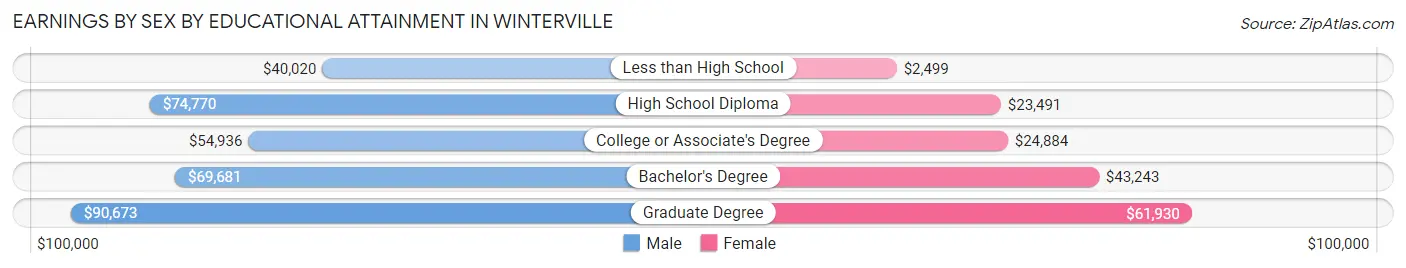
Earnings by Sex by Educational Attainment in Winterville
Average earnings in Winterville are $65,497 for men and $42,154 for women, a difference of 35.6%. Men with an educational attainment of graduate degree enjoy the highest average annual earnings of $90,673, while those with less than high school education earn the least with $40,020. Women with an educational attainment of graduate degree earn the most with the average annual earnings of $61,930, while those with less than high school education have the smallest earnings of $2,499.
| Educational Attainment | Male Income | Female Income |
| Less than High School | $40,020 | $2,499 |
| High School Diploma | $74,770 | $23,491 |
| College or Associate's Degree | $54,936 | $24,884 |
| Bachelor's Degree | $69,681 | $43,243 |
| Graduate Degree | $90,673 | $61,930 |
| Total | $65,497 | $42,154 |
Family Income in Winterville
Family Income Brackets in Winterville
According to the Winterville family income data, there are 803 families falling into the $100,000 to $149,999 income range, which is the most common income bracket and makes up 25.3% of all families. Conversely, the $10,000 to $14,999 income bracket is the least frequent group with only 13 families (0.4%) belonging to this category.
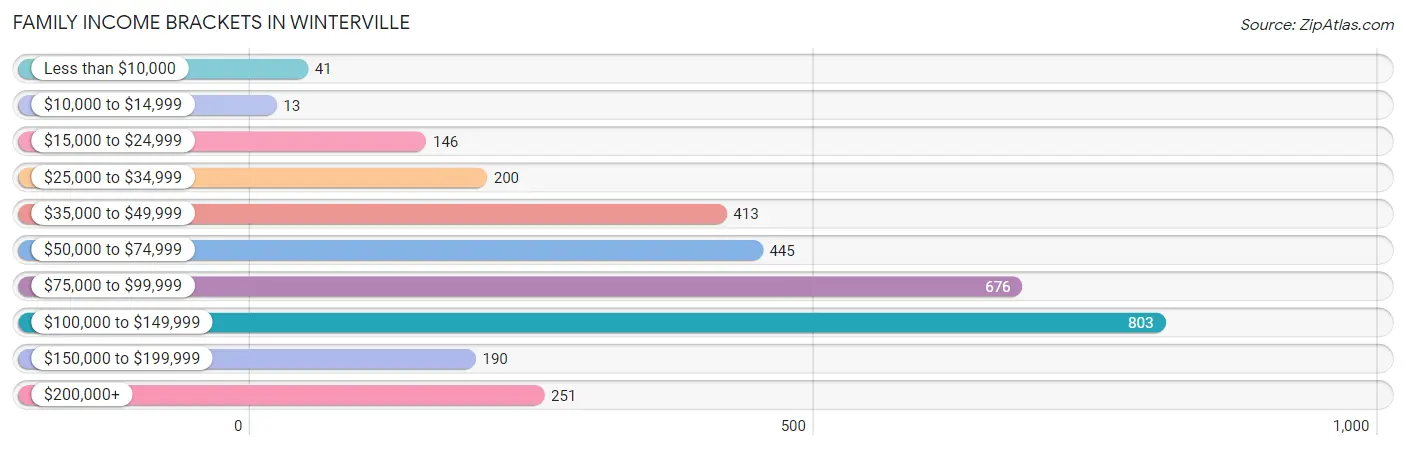
| Income Bracket | # Families | % Families |
| Less than $10,000 | 41 | 1.3% |
| $10,000 to $14,999 | 13 | 0.4% |
| $15,000 to $24,999 | 146 | 4.6% |
| $25,000 to $34,999 | 200 | 6.3% |
| $35,000 to $49,999 | 413 | 13.0% |
| $50,000 to $74,999 | 445 | 14.0% |
| $75,000 to $99,999 | 676 | 21.3% |
| $100,000 to $149,999 | 803 | 25.3% |
| $150,000 to $199,999 | 190 | 6.0% |
| $200,000+ | 251 | 7.9% |
Family Income by Famaliy Size in Winterville
6-person families (170 | 5.3%) account for the highest median family income in Winterville with $149,815 per family, while 3-person families (477 | 15.0%) have the highest median income of $42,524 per family member.
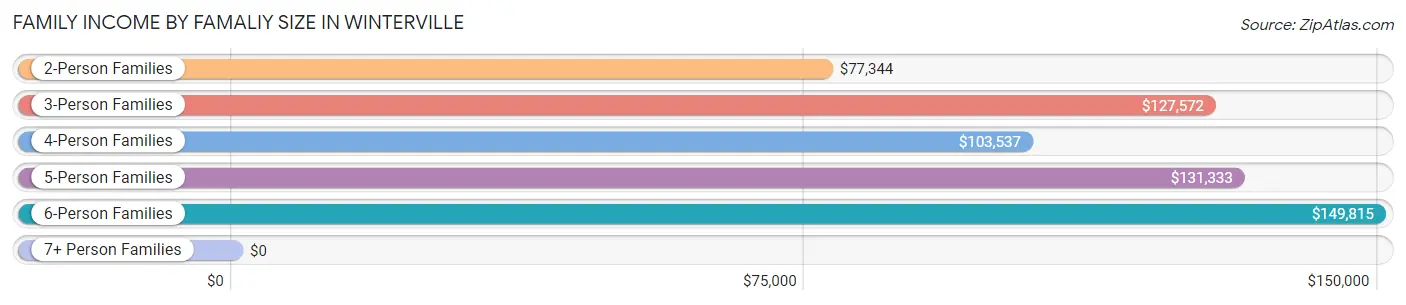
| Income Bracket | # Families | Median Income |
| 2-Person Families | 1,839 (57.9%) | $77,344 |
| 3-Person Families | 477 (15.0%) | $127,572 |
| 4-Person Families | 566 (17.8%) | $103,537 |
| 5-Person Families | 110 (3.5%) | $131,333 |
| 6-Person Families | 170 (5.3%) | $149,815 |
| 7+ Person Families | 13 (0.4%) | $0 |
| Total | 3,175 (100.0%) | $85,991 |
Family Income by Number of Earners in Winterville
The median family income in Winterville is $85,991, with families comprising 3+ earners (453) having the highest median family income of $128,244, while families with 1 earner (1,137) have the lowest median family income of $39,730, accounting for 14.3% and 35.8% of families, respectively.
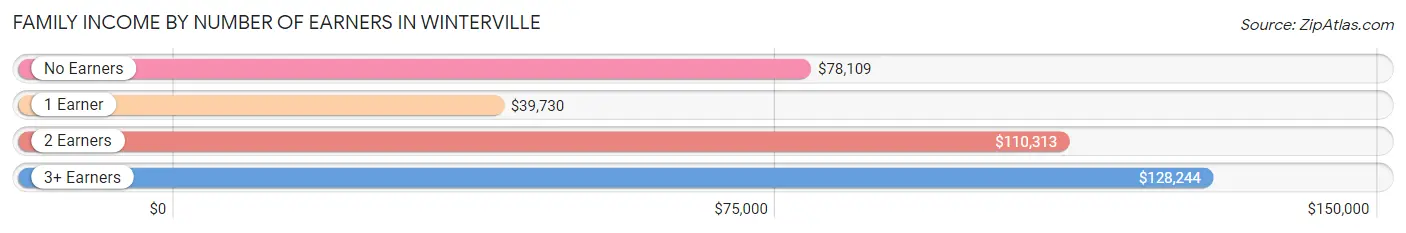
| Number of Earners | # Families | Median Income |
| No Earners | 291 (9.2%) | $78,109 |
| 1 Earner | 1,137 (35.8%) | $39,730 |
| 2 Earners | 1,294 (40.8%) | $110,313 |
| 3+ Earners | 453 (14.3%) | $128,244 |
| Total | 3,175 (100.0%) | $85,991 |
Household Income in Winterville
Household Income Brackets in Winterville
With 1,094 households falling in the category, the $100,000 to $149,999 income range is the most frequent in Winterville, accounting for 25.4% of all households. In contrast, only 112 households (2.6%) fall into the $10,000 to $14,999 income bracket, making it the least populous group.
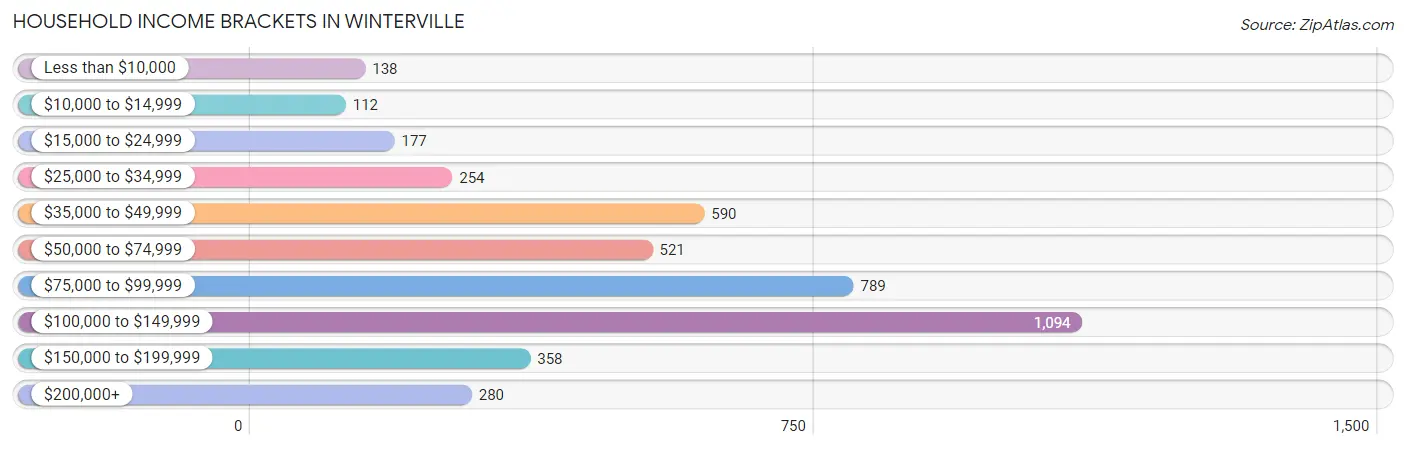
| Income Bracket | # Households | % Households |
| Less than $10,000 | 138 | 3.2% |
| $10,000 to $14,999 | 112 | 2.6% |
| $15,000 to $24,999 | 177 | 4.1% |
| $25,000 to $34,999 | 254 | 5.9% |
| $35,000 to $49,999 | 590 | 13.7% |
| $50,000 to $74,999 | 521 | 12.1% |
| $75,000 to $99,999 | 789 | 18.3% |
| $100,000 to $149,999 | 1,094 | 25.4% |
| $150,000 to $199,999 | 358 | 8.3% |
| $200,000+ | 280 | 6.5% |
Household Income by Householder Age in Winterville
The median household income in Winterville is $82,969, with the highest median household income of $108,277 found in the 25 to 44 years age bracket for the primary householder. A total of 1,381 households (32.1%) fall into this category. Meanwhile, the 15 to 24 years age bracket for the primary householder has the lowest median household income of $38,411, with 424 households (9.8%) in this group.
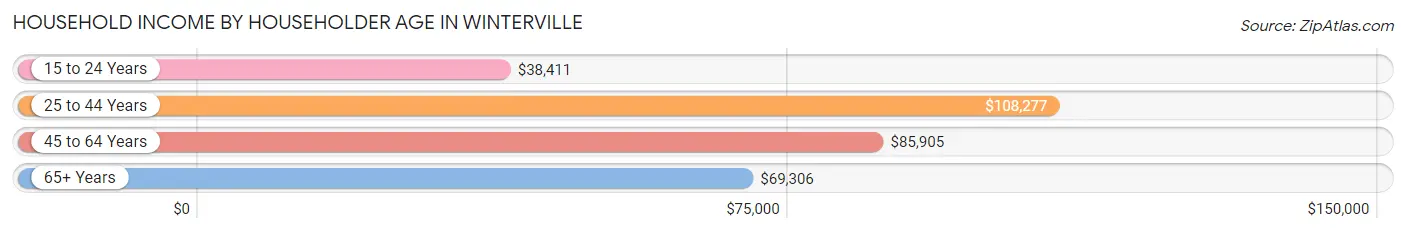
| Income Bracket | # Households | Median Income |
| 15 to 24 Years | 424 (9.8%) | $38,411 |
| 25 to 44 Years | 1,381 (32.1%) | $108,277 |
| 45 to 64 Years | 1,703 (39.5%) | $85,905 |
| 65+ Years | 801 (18.6%) | $69,306 |
| Total | 4,309 (100.0%) | $82,969 |
Poverty in Winterville
Income Below Poverty by Sex and Age in Winterville
With 8.6% poverty level for males and 5.5% for females among the residents of Winterville, 18 to 24 year old males and 75 year old and over females are the most vulnerable to poverty, with 96 males (16.5%) and 23 females (11.7%) in their respective age groups living below the poverty level.
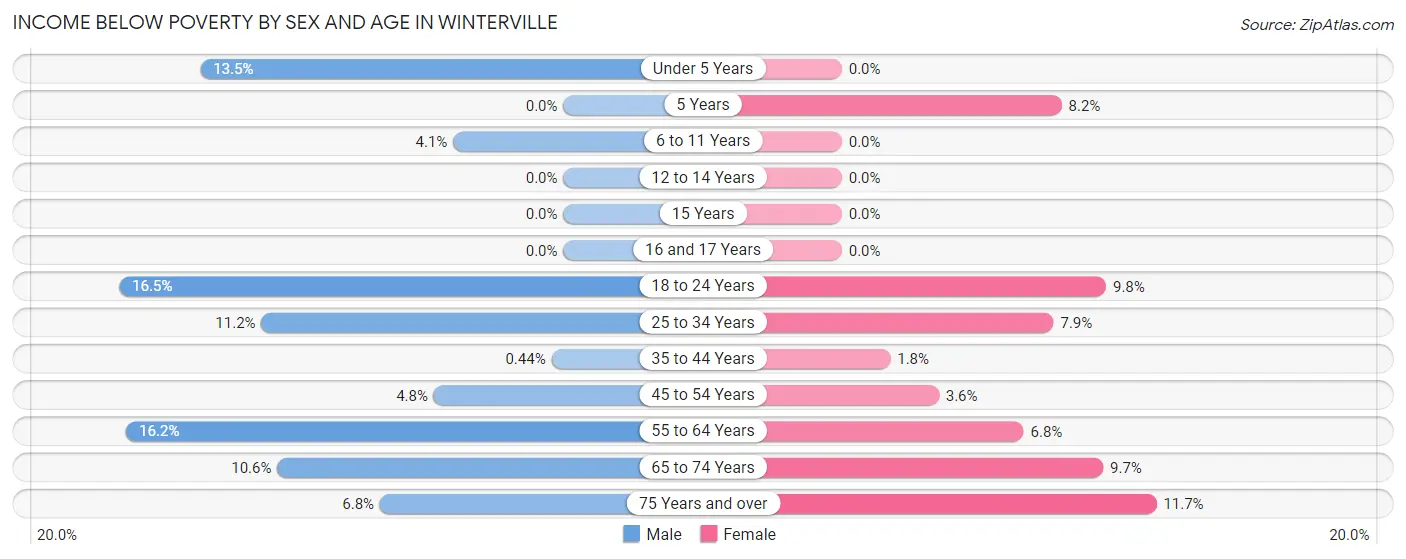
| Age Bracket | Male | Female |
| Under 5 Years | 48 (13.5%) | 0 (0.0%) |
| 5 Years | 0 (0.0%) | 8 (8.2%) |
| 6 to 11 Years | 15 (4.1%) | 0 (0.0%) |
| 12 to 14 Years | 0 (0.0%) | 0 (0.0%) |
| 15 Years | 0 (0.0%) | 0 (0.0%) |
| 16 and 17 Years | 0 (0.0%) | 0 (0.0%) |
| 18 to 24 Years | 96 (16.5%) | 78 (9.8%) |
| 25 to 34 Years | 88 (11.2%) | 36 (7.9%) |
| 35 to 44 Years | 3 (0.4%) | 15 (1.8%) |
| 45 to 54 Years | 42 (4.8%) | 25 (3.6%) |
| 55 to 64 Years | 106 (16.2%) | 49 (6.8%) |
| 65 to 74 Years | 43 (10.6%) | 45 (9.7%) |
| 75 Years and over | 16 (6.8%) | 23 (11.7%) |
| Total | 457 (8.6%) | 279 (5.5%) |
Income Above Poverty by Sex and Age in Winterville
According to the poverty statistics in Winterville, males aged 5 years and females aged under 5 years are the age groups that are most secure financially, with 100.0% of males and 100.0% of females in these age groups living above the poverty line.
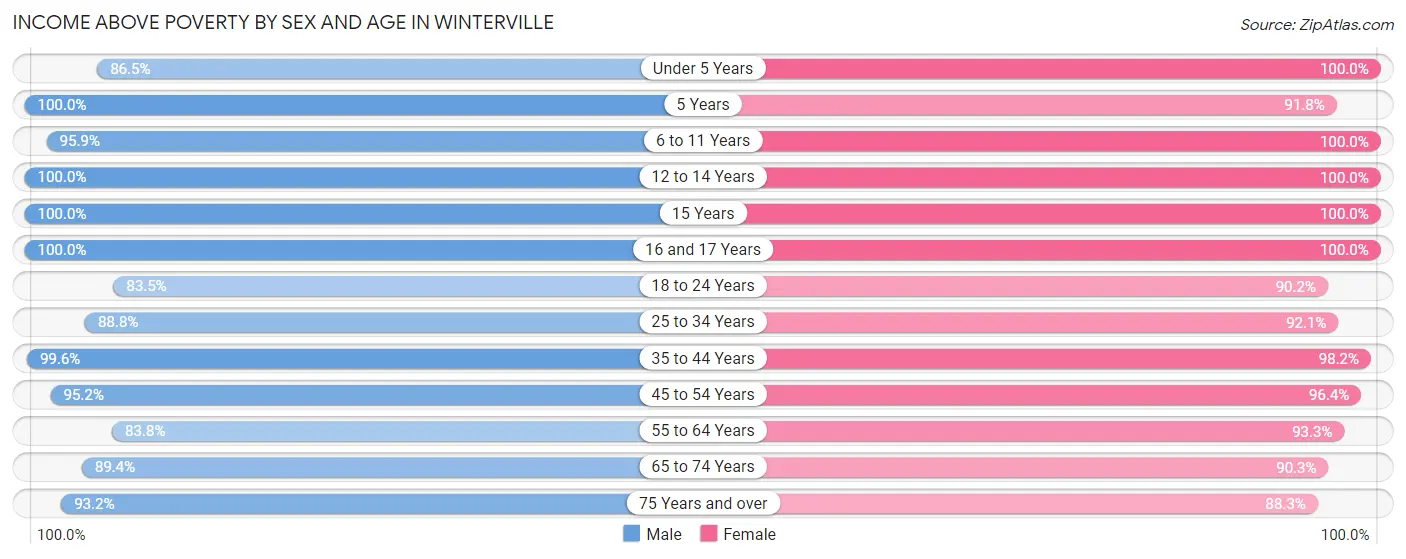
| Age Bracket | Male | Female |
| Under 5 Years | 308 (86.5%) | 159 (100.0%) |
| 5 Years | 38 (100.0%) | 90 (91.8%) |
| 6 to 11 Years | 352 (95.9%) | 226 (100.0%) |
| 12 to 14 Years | 162 (100.0%) | 242 (100.0%) |
| 15 Years | 67 (100.0%) | 59 (100.0%) |
| 16 and 17 Years | 139 (100.0%) | 105 (100.0%) |
| 18 to 24 Years | 486 (83.5%) | 717 (90.2%) |
| 25 to 34 Years | 697 (88.8%) | 422 (92.1%) |
| 35 to 44 Years | 681 (99.6%) | 819 (98.2%) |
| 45 to 54 Years | 832 (95.2%) | 670 (96.4%) |
| 55 to 64 Years | 547 (83.8%) | 677 (93.2%) |
| 65 to 74 Years | 362 (89.4%) | 419 (90.3%) |
| 75 Years and over | 219 (93.2%) | 174 (88.3%) |
| Total | 4,890 (91.4%) | 4,779 (94.5%) |
Income Below Poverty Among Married-Couple Families in Winterville
The poverty statistics for married-couple families in Winterville show that 2.4% or 49 of the total 2,012 families live below the poverty line. Families with no children have the highest poverty rate of 3.0%, comprising of 34 families. On the other hand, families with 3 or 4 children have the lowest poverty rate of 0.0%, which includes 0 families.
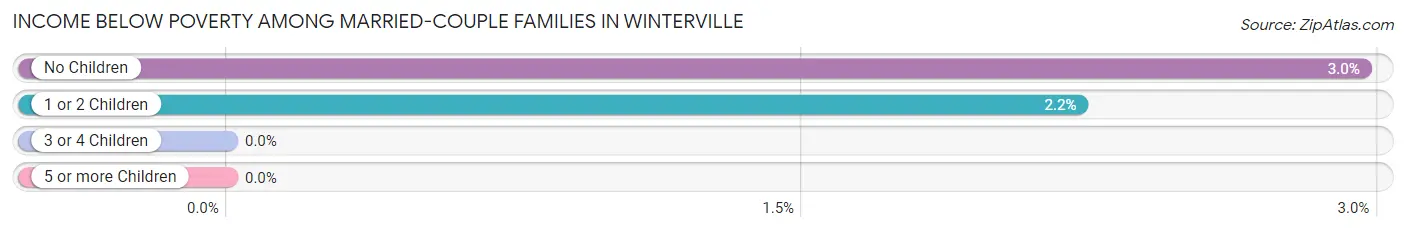
| Children | Above Poverty | Below Poverty |
| No Children | 1,114 (97.0%) | 34 (3.0%) |
| 1 or 2 Children | 660 (97.8%) | 15 (2.2%) |
| 3 or 4 Children | 189 (100.0%) | 0 (0.0%) |
| 5 or more Children | 0 (0.0%) | 0 (0.0%) |
| Total | 1,963 (97.6%) | 49 (2.4%) |
Income Below Poverty Among Single-Parent Households in Winterville
According to the poverty data in Winterville, 4.9% or 11 single-father households and 10.4% or 97 single-mother households are living below the poverty line. Among single-father households, those with 1 or 2 children have the highest poverty rate, with 11 households (20.7%) experiencing poverty. Likewise, among single-mother households, those with 1 or 2 children have the highest poverty rate, with 97 households (37.2%) falling below the poverty line.
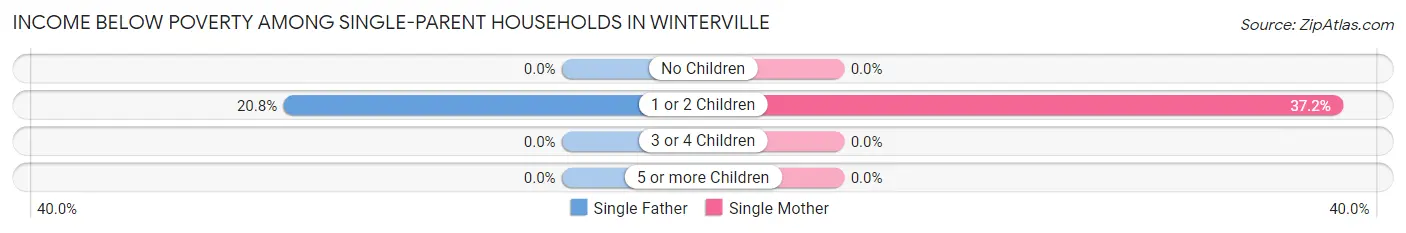
| Children | Single Father | Single Mother |
| No Children | 0 (0.0%) | 0 (0.0%) |
| 1 or 2 Children | 11 (20.7%) | 97 (37.2%) |
| 3 or 4 Children | 0 (0.0%) | 0 (0.0%) |
| 5 or more Children | 0 (0.0%) | 0 (0.0%) |
| Total | 11 (4.9%) | 97 (10.4%) |
Income Below Poverty Among Married-Couple vs Single-Parent Households in Winterville
The poverty data for Winterville shows that 49 of the married-couple family households (2.4%) and 108 of the single-parent households (9.3%) are living below the poverty level. Within the married-couple family households, those with no children have the highest poverty rate, with 34 households (3.0%) falling below the poverty line. Among the single-parent households, those with 1 or 2 children have the highest poverty rate, with 108 household (34.4%) living below poverty.
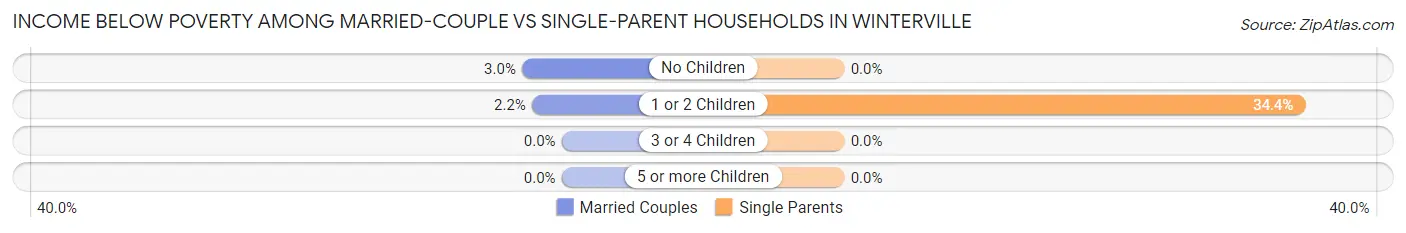
| Children | Married-Couple Families | Single-Parent Households |
| No Children | 34 (3.0%) | 0 (0.0%) |
| 1 or 2 Children | 15 (2.2%) | 108 (34.4%) |
| 3 or 4 Children | 0 (0.0%) | 0 (0.0%) |
| 5 or more Children | 0 (0.0%) | 0 (0.0%) |
| Total | 49 (2.4%) | 108 (9.3%) |
Race in Winterville
The most populous races in Winterville are White / Caucasian (5,954 | 56.7%), Black / African American (3,825 | 36.4%), and Hispanic or Latino (430 | 4.1%).
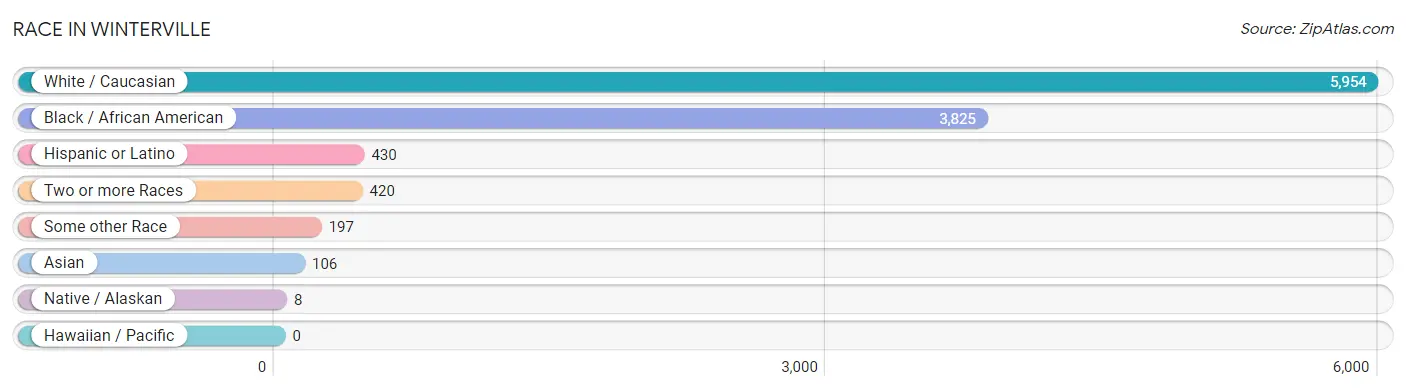
| Race | # Population | % Population |
| Asian | 106 | 1.0% |
| Black / African American | 3,825 | 36.4% |
| Hawaiian / Pacific | 0 | 0.0% |
| Hispanic or Latino | 430 | 4.1% |
| Native / Alaskan | 8 | 0.1% |
| White / Caucasian | 5,954 | 56.7% |
| Two or more Races | 420 | 4.0% |
| Some other Race | 197 | 1.9% |
| Total | 10,510 | 100.0% |
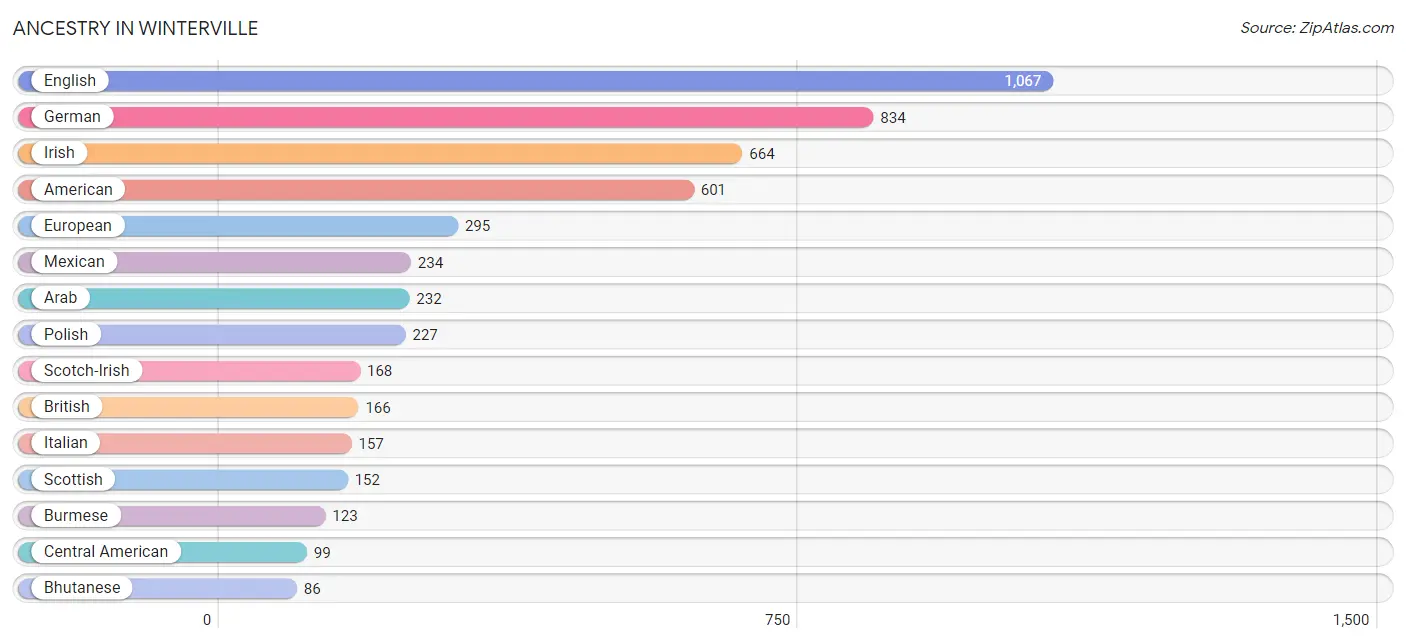
Ancestry in Winterville
The most populous ancestries reported in Winterville are English (1,067 | 10.2%), German (834 | 7.9%), Irish (664 | 6.3%), American (601 | 5.7%), and European (295 | 2.8%), together accounting for 32.9% of all Winterville residents.
| Ancestry | # Population | % Population |
| African | 49 | 0.5% |
| American | 601 | 5.7% |
| Arab | 232 | 2.2% |
| Armenian | 81 | 0.8% |
| Austrian | 27 | 0.3% |
| Bhutanese | 86 | 0.8% |
| British | 166 | 1.6% |
| Burmese | 123 | 1.2% |
| Canadian | 9 | 0.1% |
| Central American | 99 | 0.9% |
| Cherokee | 3 | 0.0% |
| Chickasaw | 7 | 0.1% |
| Colombian | 20 | 0.2% |
| Dutch | 61 | 0.6% |
| Eastern European | 16 | 0.2% |
| Egyptian | 33 | 0.3% |
| English | 1,067 | 10.2% |
| European | 295 | 2.8% |
| Filipino | 11 | 0.1% |
| French | 70 | 0.7% |
| French Canadian | 11 | 0.1% |
| German | 834 | 7.9% |
| Greek | 39 | 0.4% |
| Guatemalan | 77 | 0.7% |
| Honduran | 11 | 0.1% |
| Indian (Asian) | 31 | 0.3% |
| Irish | 664 | 6.3% |
| Italian | 157 | 1.5% |
| Korean | 65 | 0.6% |
| Lithuanian | 14 | 0.1% |
| Mexican | 234 | 2.2% |
| Nicaraguan | 11 | 0.1% |
| Norwegian | 18 | 0.2% |
| Polish | 227 | 2.2% |
| Portuguese | 10 | 0.1% |
| Puerto Rican | 28 | 0.3% |
| Scandinavian | 53 | 0.5% |
| Scotch-Irish | 168 | 1.6% |
| Scottish | 152 | 1.5% |
| Slovak | 38 | 0.4% |
| South American | 20 | 0.2% |
| Subsaharan African | 49 | 0.5% |
| Swedish | 27 | 0.3% |
| Swiss | 40 | 0.4% |
| Ukrainian | 66 | 0.6% |
| Welsh | 32 | 0.3% |
| West Indian | 36 | 0.3% | View All 47 Rows |
Immigrants in Winterville
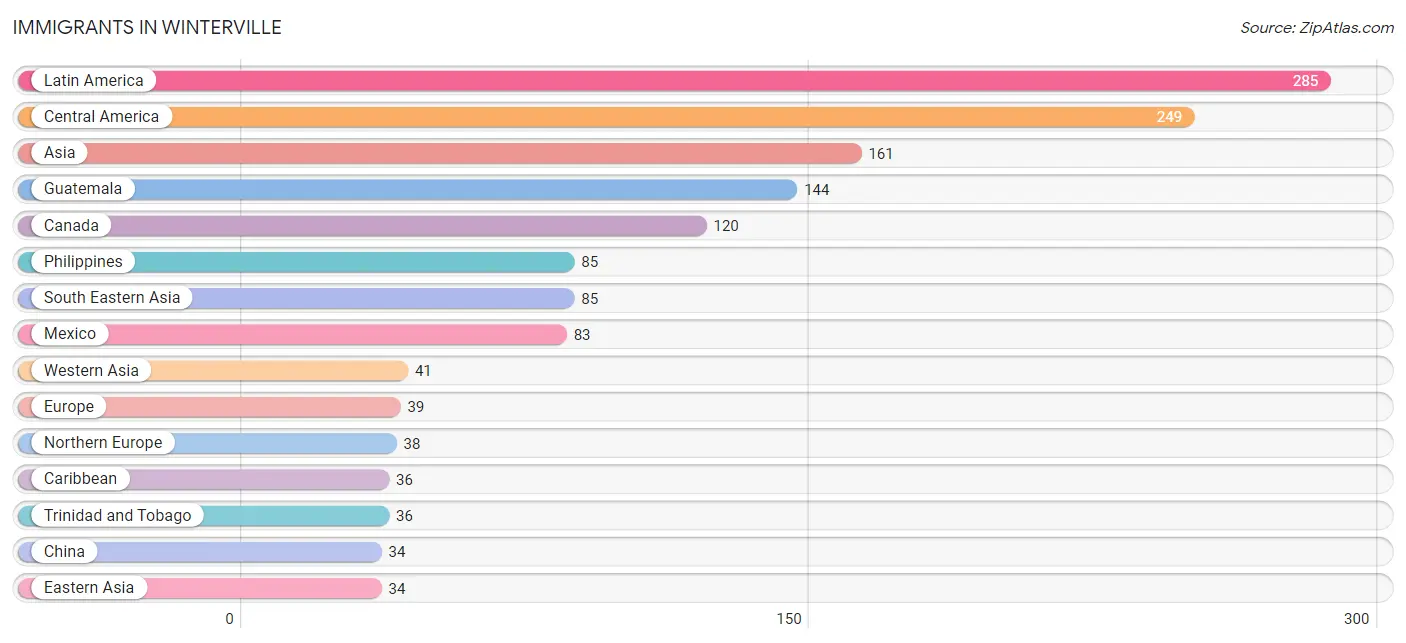
The most numerous immigrant groups reported in Winterville came from Latin America (285 | 2.7%), Central America (249 | 2.4%), Asia (161 | 1.5%), Guatemala (144 | 1.4%), and Canada (120 | 1.1%), together accounting for 9.1% of all Winterville residents.
| Immigration Origin | # Population | % Population |
| Africa | 9 | 0.1% |
| Asia | 161 | 1.5% |
| Canada | 120 | 1.1% |
| Caribbean | 36 | 0.3% |
| Central America | 249 | 2.4% |
| China | 34 | 0.3% |
| Eastern Asia | 34 | 0.3% |
| Egypt | 9 | 0.1% |
| England | 15 | 0.1% |
| Europe | 39 | 0.4% |
| Germany | 1 | 0.0% |
| Guatemala | 144 | 1.4% |
| Honduras | 11 | 0.1% |
| India | 1 | 0.0% |
| Latin America | 285 | 2.7% |
| Mexico | 83 | 0.8% |
| Nicaragua | 11 | 0.1% |
| Northern Africa | 9 | 0.1% |
| Northern Europe | 38 | 0.4% |
| Oceania | 15 | 0.1% |
| Philippines | 85 | 0.8% |
| South Central Asia | 1 | 0.0% |
| South Eastern Asia | 85 | 0.8% |
| Taiwan | 11 | 0.1% |
| Trinidad and Tobago | 36 | 0.3% |
| Western Asia | 41 | 0.4% |
| Western Europe | 1 | 0.0% |
| Yemen | 33 | 0.3% | View All 28 Rows |
Sex and Age in Winterville
Sex and Age in Winterville
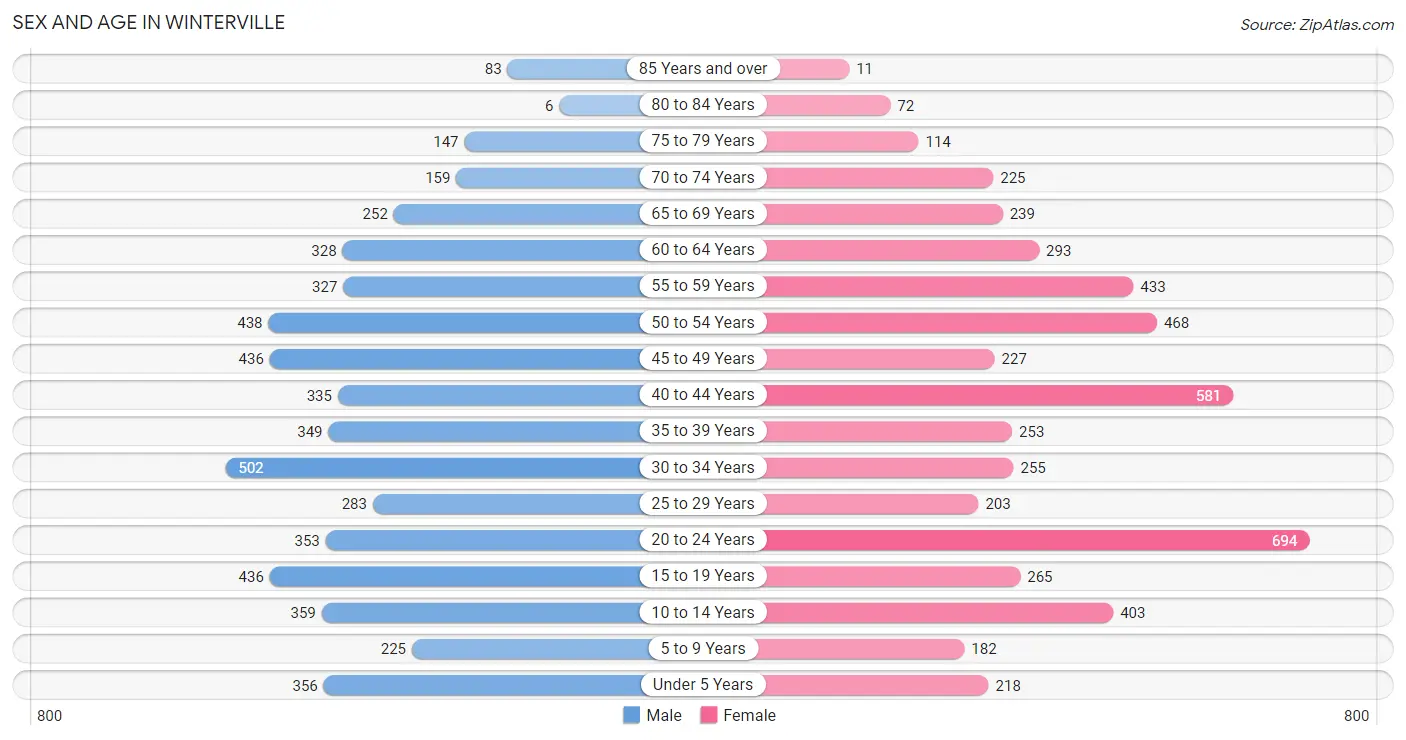
The most populous age groups in Winterville are 30 to 34 Years (502 | 9.3%) for men and 20 to 24 Years (694 | 13.5%) for women.
| Age Bracket | Male | Female |
| Under 5 Years | 356 (6.6%) | 218 (4.2%) |
| 5 to 9 Years | 225 (4.2%) | 182 (3.5%) |
| 10 to 14 Years | 359 (6.7%) | 403 (7.9%) |
| 15 to 19 Years | 436 (8.1%) | 265 (5.2%) |
| 20 to 24 Years | 353 (6.6%) | 694 (13.5%) |
| 25 to 29 Years | 283 (5.3%) | 203 (4.0%) |
| 30 to 34 Years | 502 (9.3%) | 255 (5.0%) |
| 35 to 39 Years | 349 (6.5%) | 253 (4.9%) |
| 40 to 44 Years | 335 (6.2%) | 581 (11.3%) |
| 45 to 49 Years | 436 (8.1%) | 227 (4.4%) |
| 50 to 54 Years | 438 (8.2%) | 468 (9.1%) |
| 55 to 59 Years | 327 (6.1%) | 433 (8.4%) |
| 60 to 64 Years | 328 (6.1%) | 293 (5.7%) |
| 65 to 69 Years | 252 (4.7%) | 239 (4.6%) |
| 70 to 74 Years | 159 (3.0%) | 225 (4.4%) |
| 75 to 79 Years | 147 (2.7%) | 114 (2.2%) |
| 80 to 84 Years | 6 (0.1%) | 72 (1.4%) |
| 85 Years and over | 83 (1.5%) | 11 (0.2%) |
| Total | 5,374 (100.0%) | 5,136 (100.0%) |
Families and Households in Winterville
Median Family Size in Winterville
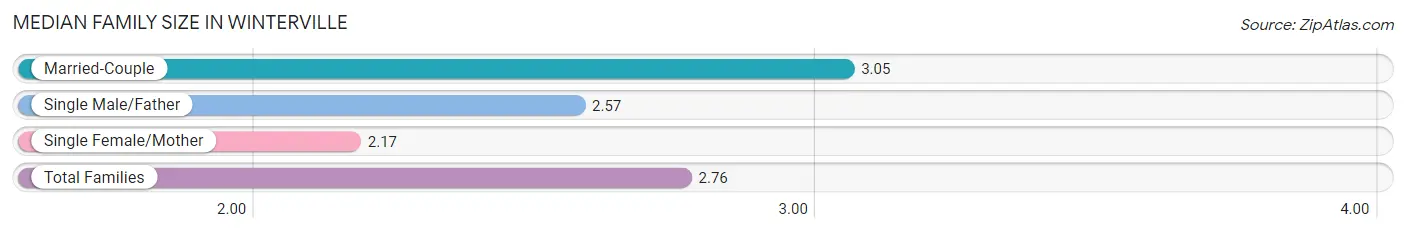
The median family size in Winterville is 2.76 persons per family, with married-couple families (2,012 | 63.4%) accounting for the largest median family size of 3.05 persons per family. On the other hand, single female/mother families (936 | 29.5%) represent the smallest median family size with 2.17 persons per family.
| Family Type | # Families | Family Size |
| Married-Couple | 2,012 (63.4%) | 3.05 |
| Single Male/Father | 227 (7.1%) | 2.57 |
| Single Female/Mother | 936 (29.5%) | 2.17 |
| Total Families | 3,175 (100.0%) | 2.76 |
Median Household Size in Winterville
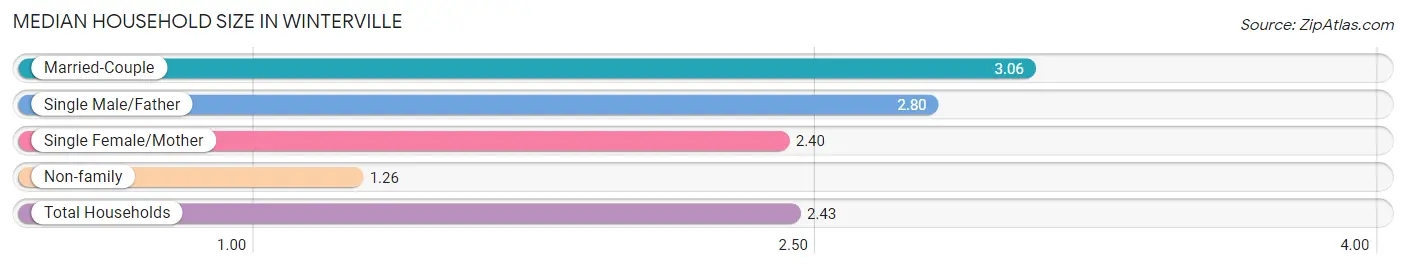
The median household size in Winterville is 2.43 persons per household, with married-couple households (2,012 | 46.7%) accounting for the largest median household size of 3.06 persons per household. non-family households (1,134 | 26.3%) represent the smallest median household size with 1.26 persons per household.
| Household Type | # Households | Household Size |
| Married-Couple | 2,012 (46.7%) | 3.06 |
| Single Male/Father | 227 (5.3%) | 2.80 |
| Single Female/Mother | 936 (21.7%) | 2.40 |
| Non-family | 1,134 (26.3%) | 1.26 |
| Total Households | 4,309 (100.0%) | 2.43 |
Household Size by Marriage Status in Winterville
Out of a total of 4,309 households in Winterville, 3,175 (73.7%) are family households, while 1,134 (26.3%) are nonfamily households. The most numerous type of family households are 2-person households, comprising 1,768, and the most common type of nonfamily households are 1-person households, comprising 938.
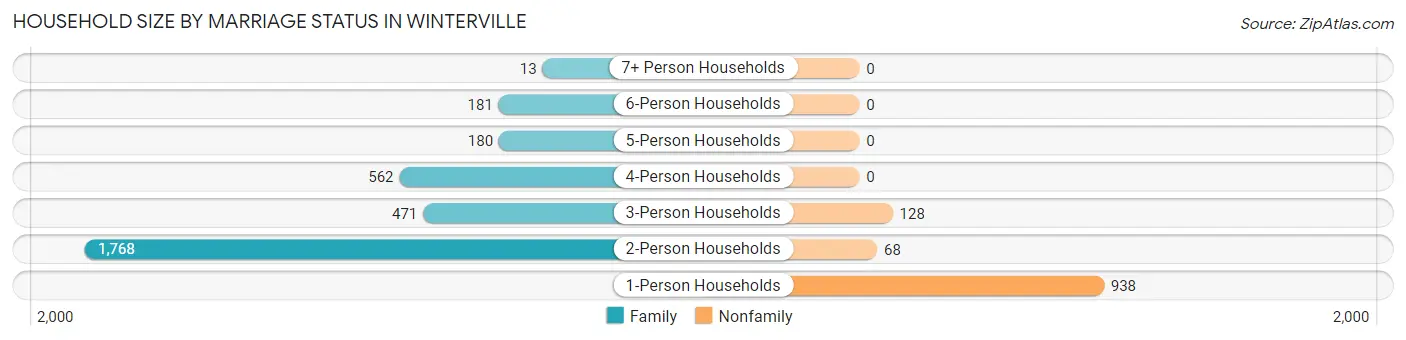
| Household Size | Family Households | Nonfamily Households |
| 1-Person Households | - | 938 (21.8%) |
| 2-Person Households | 1,768 (41.0%) | 68 (1.6%) |
| 3-Person Households | 471 (10.9%) | 128 (3.0%) |
| 4-Person Households | 562 (13.0%) | 0 (0.0%) |
| 5-Person Households | 180 (4.2%) | 0 (0.0%) |
| 6-Person Households | 181 (4.2%) | 0 (0.0%) |
| 7+ Person Households | 13 (0.3%) | 0 (0.0%) |
| Total | 3,175 (73.7%) | 1,134 (26.3%) |
Female Fertility in Winterville
Fertility by Age in Winterville
Average fertility rate in Winterville is 58.0 births per 1,000 women. Women in the age bracket of 20 to 34 years have the highest fertility rate with 127.0 births per 1,000 women. Women in the age bracket of 20 to 34 years acount for 100.0% of all women with births.
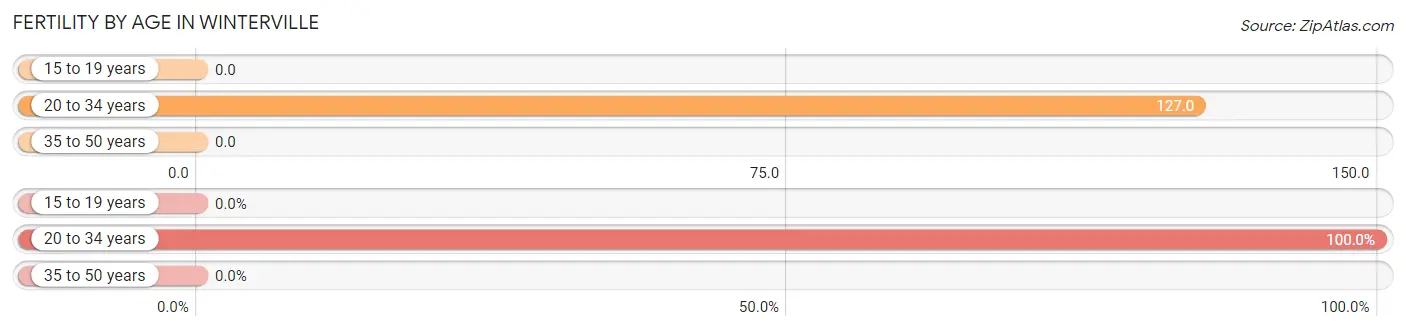
| Age Bracket | Women with Births | Births / 1,000 Women |
| 15 to 19 years | 0 (0.0%) | 0.0 |
| 20 to 34 years | 146 (100.0%) | 127.0 |
| 35 to 50 years | 0 (0.0%) | 0.0 |
| Total | 146 (100.0%) | 58.0 |
Fertility by Age by Marriage Status in Winterville
65.8% of women with births (146) in Winterville are married. The highest percentage of unmarried women with births falls into 20 to 34 years age bracket with 34.3% of them unmarried at the time of birth, while the lowest percentage of unmarried women with births belong to 20 to 34 years age bracket with 34.3% of them unmarried.
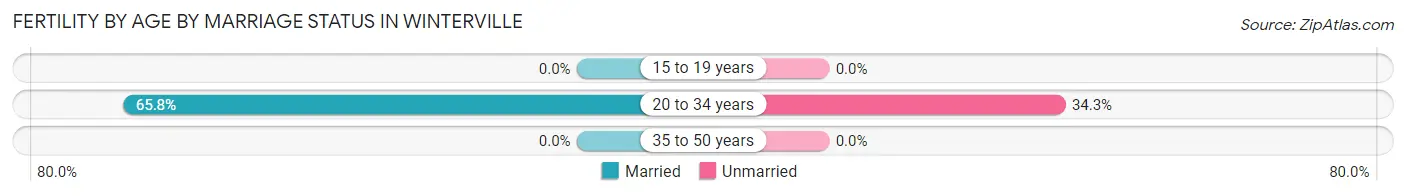
| Age Bracket | Married | Unmarried |
| 15 to 19 years | 0 (0.0%) | 0 (0.0%) |
| 20 to 34 years | 96 (65.7%) | 50 (34.3%) |
| 35 to 50 years | 0 (0.0%) | 0 (0.0%) |
| Total | 96 (65.7%) | 50 (34.3%) |
Fertility by Education in Winterville
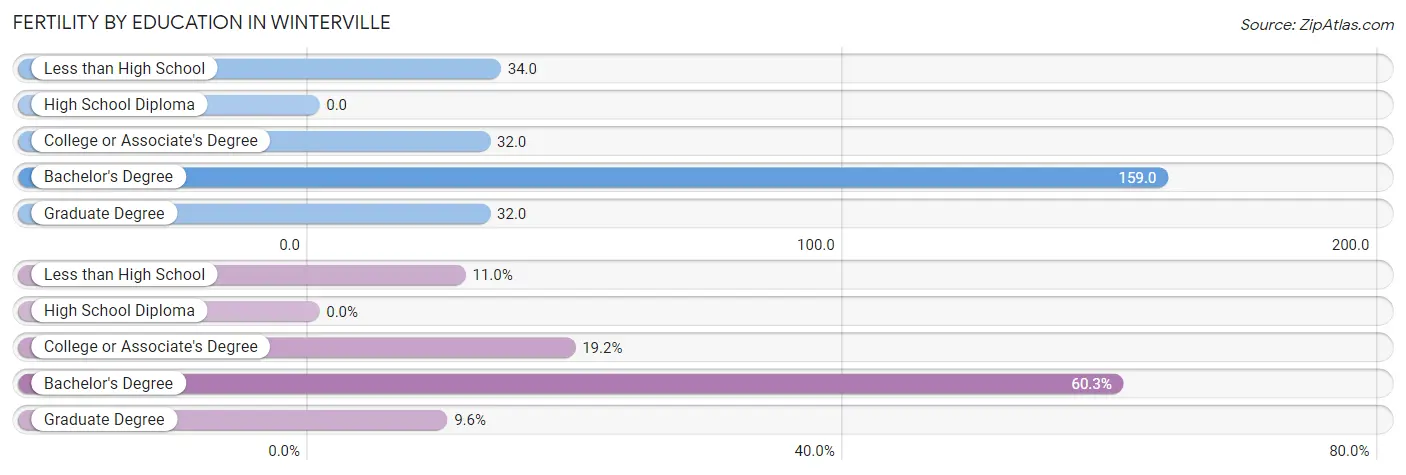
| Educational Attainment | Women with Births | Births / 1,000 Women |
| Less than High School | 16 (11.0%) | 34.0 |
| High School Diploma | 0 (0.0%) | 0.0 |
| College or Associate's Degree | 28 (19.2%) | 32.0 |
| Bachelor's Degree | 88 (60.3%) | 159.0 |
| Graduate Degree | 14 (9.6%) | 32.0 |
| Total | 146 (100.0%) | 58.0 |
Fertility by Education by Marriage Status in Winterville
34.3% of women with births in Winterville are unmarried. Women with the educational attainment of graduate degree are most likely to be married with 100.0% of them married at childbirth, while women with the educational attainment of less than high school are least likely to be married with 100.0% of them unmarried at childbirth.
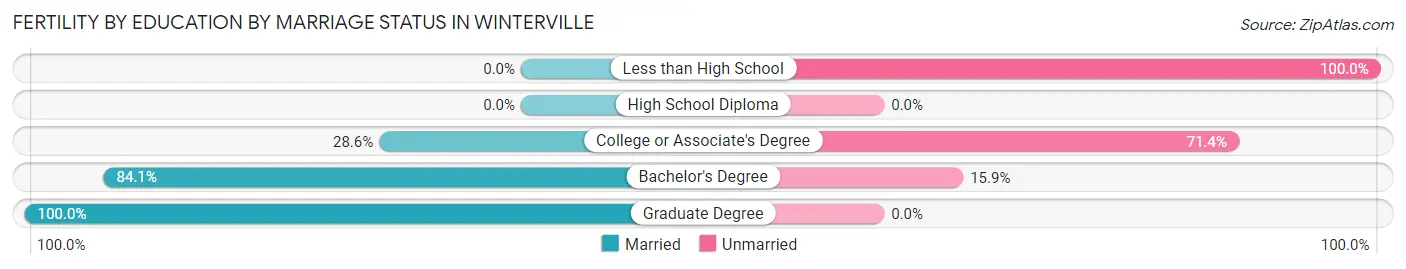
| Educational Attainment | Married | Unmarried |
| Less than High School | 0 (0.0%) | 16 (100.0%) |
| High School Diploma | 0 (0.0%) | 0 (0.0%) |
| College or Associate's Degree | 8 (28.6%) | 20 (71.4%) |
| Bachelor's Degree | 74 (84.1%) | 14 (15.9%) |
| Graduate Degree | 14 (100.0%) | 0 (0.0%) |
| Total | 96 (65.7%) | 50 (34.3%) |
Employment Characteristics in Winterville
Employment by Class of Employer in Winterville
Among the 5,628 employed individuals in Winterville, private company employees (3,173 | 56.4%), not-for-profit organizations (650 | 11.6%), and state government employees (561 | 10.0%) make up the most common classes of employment.
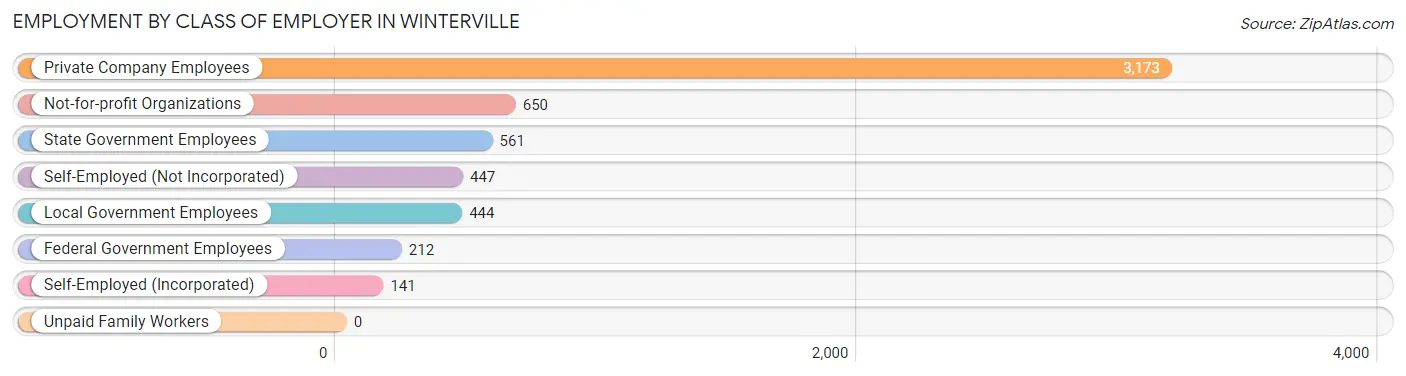
| Employer Class | # Employees | % Employees |
| Private Company Employees | 3,173 | 56.4% |
| Self-Employed (Incorporated) | 141 | 2.5% |
| Self-Employed (Not Incorporated) | 447 | 7.9% |
| Not-for-profit Organizations | 650 | 11.6% |
| Local Government Employees | 444 | 7.9% |
| State Government Employees | 561 | 10.0% |
| Federal Government Employees | 212 | 3.8% |
| Unpaid Family Workers | 0 | 0.0% |
| Total | 5,628 | 100.0% |
Employment Status by Age in Winterville
According to the labor force statistics for Winterville, out of the total population over 16 years of age (8,641), 68.7% or 5,936 individuals are in the labor force, with 4.1% or 243 of them unemployed. The age group with the highest labor force participation rate is 45 to 54 years, with 92.0% or 1,443 individuals in the labor force. Within the labor force, the 75 years and over age range has the highest percentage of unemployed individuals, with 86.1% or 93 of them being unemployed.
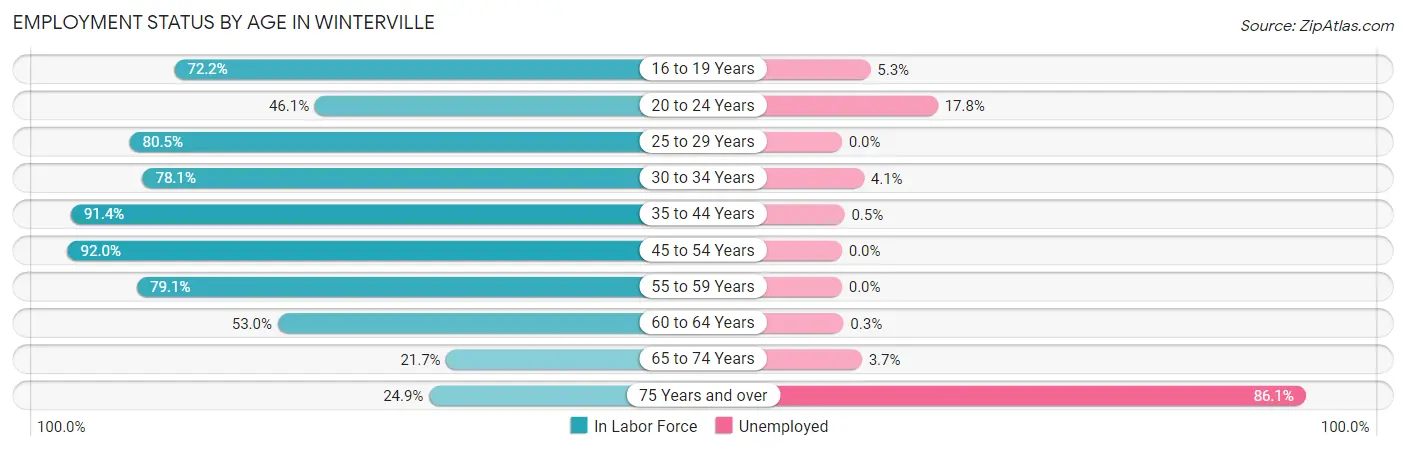
| Age Bracket | In Labor Force | Unemployed |
| 16 to 19 Years | 415 (72.2%) | 22 (5.3%) |
| 20 to 24 Years | 483 (46.1%) | 86 (17.8%) |
| 25 to 29 Years | 391 (80.5%) | 0 (0.0%) |
| 30 to 34 Years | 591 (78.1%) | 24 (4.1%) |
| 35 to 44 Years | 1,387 (91.4%) | 7 (0.5%) |
| 45 to 54 Years | 1,443 (92.0%) | 0 (0.0%) |
| 55 to 59 Years | 601 (79.1%) | 0 (0.0%) |
| 60 to 64 Years | 329 (53.0%) | 1 (0.3%) |
| 65 to 74 Years | 190 (21.7%) | 7 (3.7%) |
| 75 Years and over | 108 (24.9%) | 93 (86.1%) |
| Total | 5,936 (68.7%) | 243 (4.1%) |
Employment Status by Educational Attainment in Winterville
According to labor force statistics for Winterville, 83.1% of individuals (4,746) out of the total population between 25 and 64 years of age (5,711) are in the labor force, with 0.7% or 33 of them being unemployed. The group with the highest labor force participation rate are those with the educational attainment of bachelor's degree or higher, with 88.2% or 2,190 individuals in the labor force. Within the labor force, individuals with college / associate degree education have the highest percentage of unemployment, with 1.7% or 27 of them being unemployed.
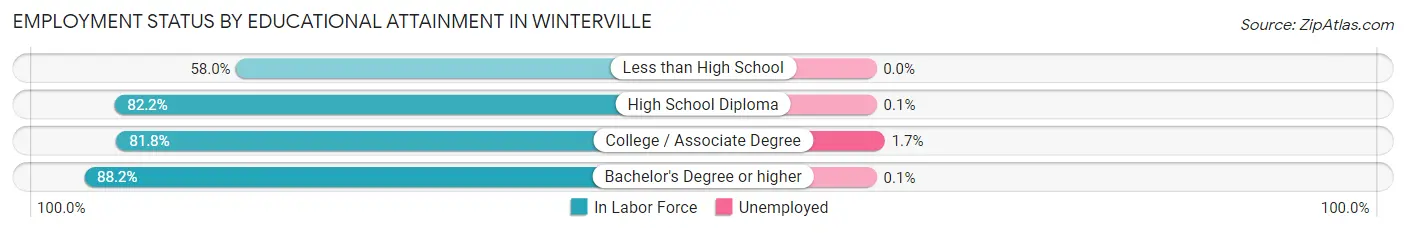
| Educational Attainment | In Labor Force | Unemployed |
| Less than High School | 218 (58.0%) | 0 (0.0%) |
| High School Diploma | 752 (82.2%) | 1 (0.1%) |
| College / Associate Degree | 1,584 (81.8%) | 33 (1.7%) |
| Bachelor's Degree or higher | 2,190 (88.2%) | 2 (0.1%) |
| Total | 4,746 (83.1%) | 40 (0.7%) |
Employment Occupations by Sex in Winterville
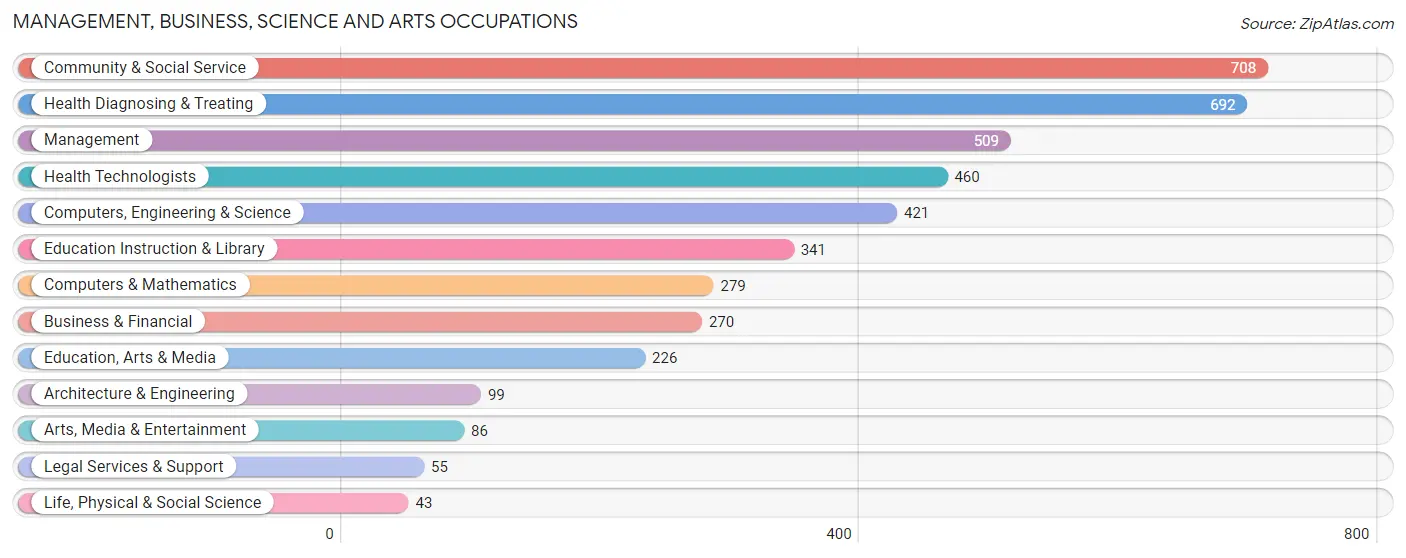
Management, Business, Science and Arts Occupations
The most common Management, Business, Science and Arts occupations in Winterville are Community & Social Service (708 | 12.7%), Health Diagnosing & Treating (692 | 12.4%), Management (509 | 9.1%), Health Technologists (460 | 8.2%), and Computers, Engineering & Science (421 | 7.5%).
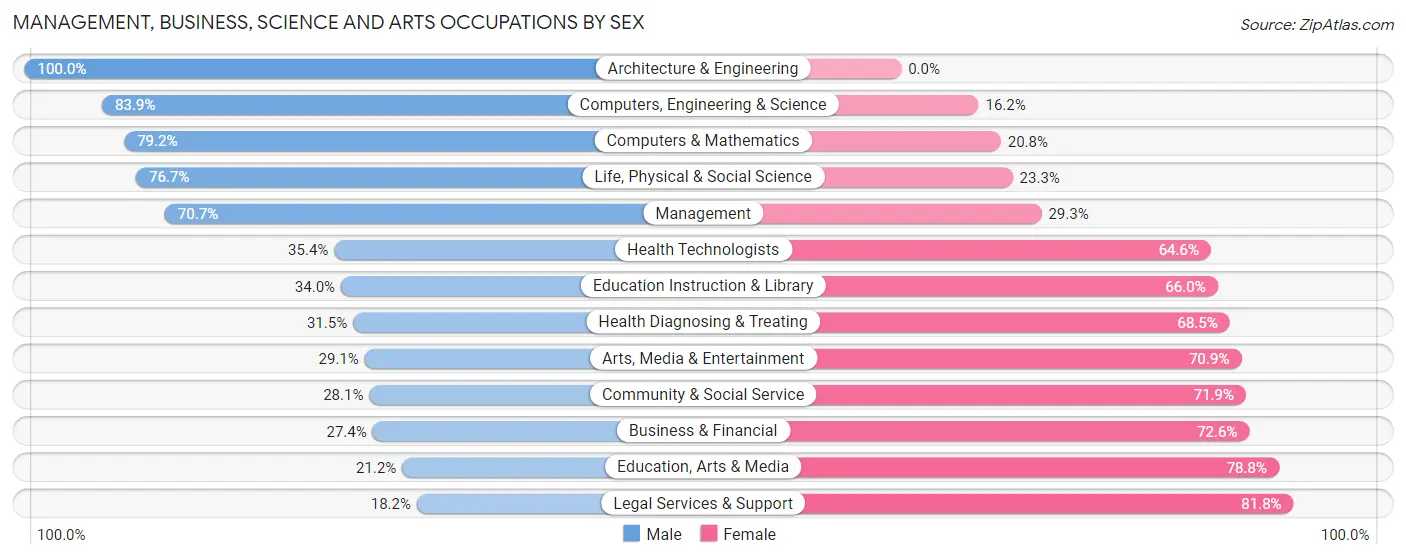
Management, Business, Science and Arts Occupations by Sex
Within the Management, Business, Science and Arts occupations in Winterville, the most male-oriented occupations are Architecture & Engineering (100.0%), Computers, Engineering & Science (83.9%), and Computers & Mathematics (79.2%), while the most female-oriented occupations are Legal Services & Support (81.8%), Education, Arts & Media (78.8%), and Business & Financial (72.6%).
| Occupation | Male | Female |
| Management | 360 (70.7%) | 149 (29.3%) |
| Business & Financial | 74 (27.4%) | 196 (72.6%) |
| Computers, Engineering & Science | 353 (83.9%) | 68 (16.2%) |
| Computers & Mathematics | 221 (79.2%) | 58 (20.8%) |
| Architecture & Engineering | 99 (100.0%) | 0 (0.0%) |
| Life, Physical & Social Science | 33 (76.7%) | 10 (23.3%) |
| Community & Social Service | 199 (28.1%) | 509 (71.9%) |
| Education, Arts & Media | 48 (21.2%) | 178 (78.8%) |
| Legal Services & Support | 10 (18.2%) | 45 (81.8%) |
| Education Instruction & Library | 116 (34.0%) | 225 (66.0%) |
| Arts, Media & Entertainment | 25 (29.1%) | 61 (70.9%) |
| Health Diagnosing & Treating | 218 (31.5%) | 474 (68.5%) |
| Health Technologists | 163 (35.4%) | 297 (64.6%) |
| Total (Category) | 1,204 (46.3%) | 1,396 (53.7%) |
| Total (Overall) | 3,069 (54.9%) | 2,516 (45.1%) |
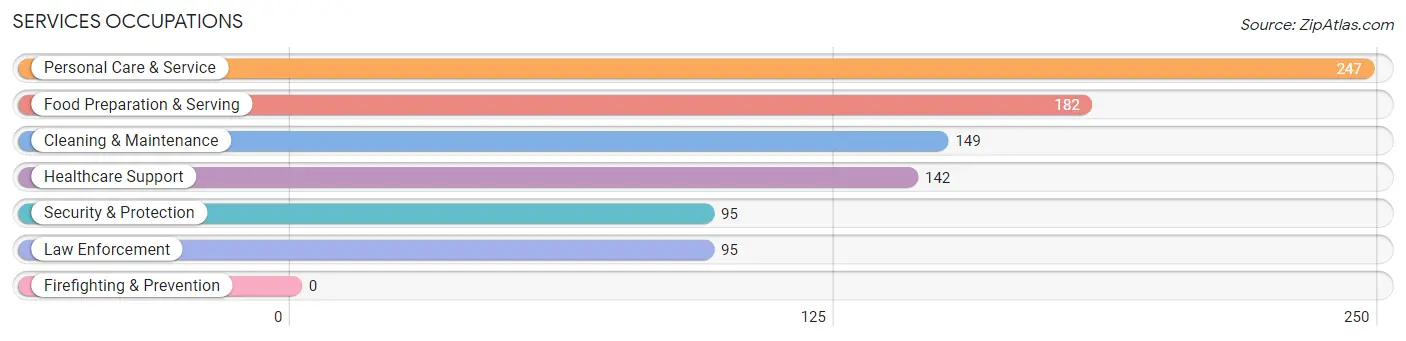
Services Occupations
The most common Services occupations in Winterville are Personal Care & Service (247 | 4.4%), Food Preparation & Serving (182 | 3.3%), Cleaning & Maintenance (149 | 2.7%), Healthcare Support (142 | 2.5%), and Security & Protection (95 | 1.7%).
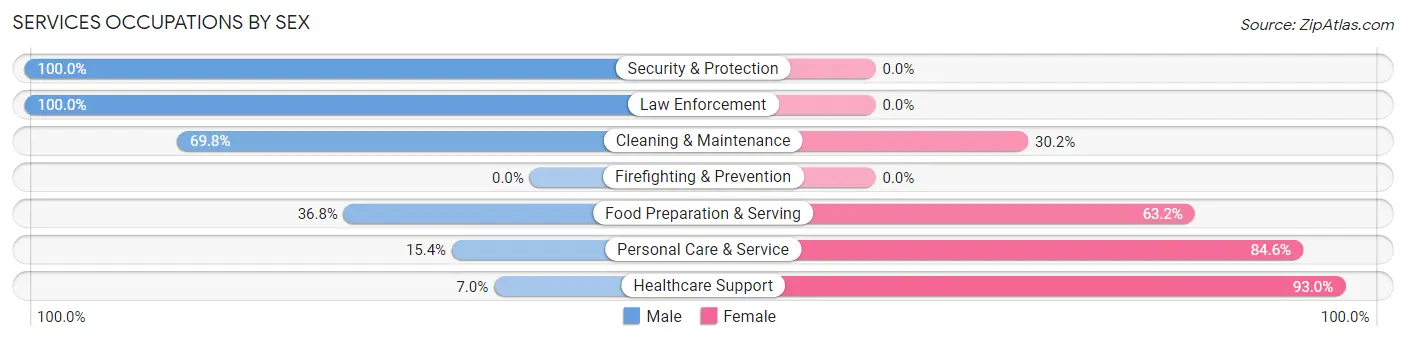
Services Occupations by Sex
Within the Services occupations in Winterville, the most male-oriented occupations are Security & Protection (100.0%), Law Enforcement (100.0%), and Cleaning & Maintenance (69.8%), while the most female-oriented occupations are Healthcare Support (93.0%), Personal Care & Service (84.6%), and Food Preparation & Serving (63.2%).
| Occupation | Male | Female |
| Healthcare Support | 10 (7.0%) | 132 (93.0%) |
| Security & Protection | 95 (100.0%) | 0 (0.0%) |
| Firefighting & Prevention | 0 (0.0%) | 0 (0.0%) |
| Law Enforcement | 95 (100.0%) | 0 (0.0%) |
| Food Preparation & Serving | 67 (36.8%) | 115 (63.2%) |
| Cleaning & Maintenance | 104 (69.8%) | 45 (30.2%) |
| Personal Care & Service | 38 (15.4%) | 209 (84.6%) |
| Total (Category) | 314 (38.5%) | 501 (61.5%) |
| Total (Overall) | 3,069 (54.9%) | 2,516 (45.1%) |
Sales and Office Occupations
The most common Sales and Office occupations in Winterville are Sales & Related (548 | 9.8%), and Office & Administration (355 | 6.4%).
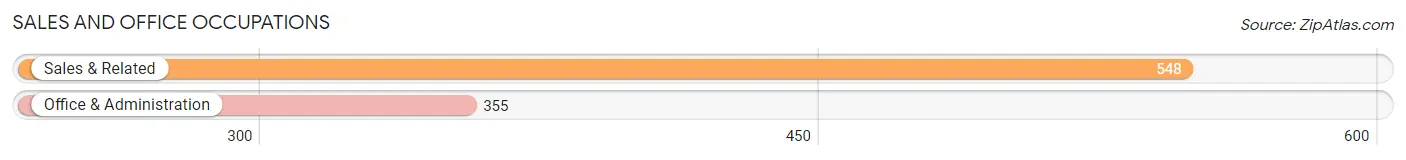
Sales and Office Occupations by Sex
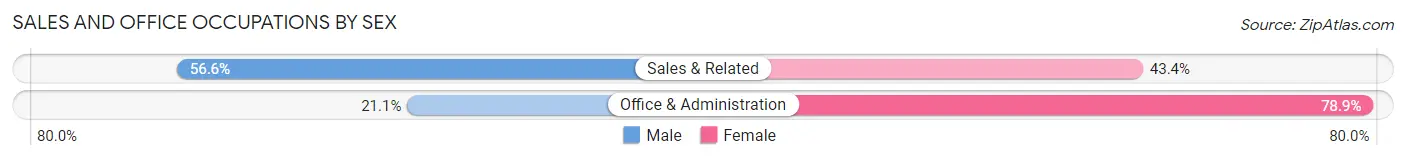
| Occupation | Male | Female |
| Sales & Related | 310 (56.6%) | 238 (43.4%) |
| Office & Administration | 75 (21.1%) | 280 (78.9%) |
| Total (Category) | 385 (42.6%) | 518 (57.4%) |
| Total (Overall) | 3,069 (54.9%) | 2,516 (45.1%) |
Natural Resources, Construction and Maintenance Occupations
The most common Natural Resources, Construction and Maintenance occupations in Winterville are Construction & Extraction (235 | 4.2%), Installation, Maintenance & Repair (217 | 3.9%), and Farming, Fishing & Forestry (32 | 0.6%).
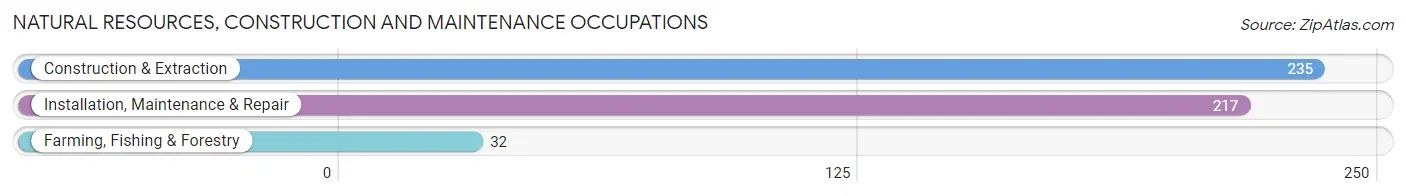
Natural Resources, Construction and Maintenance Occupations by Sex
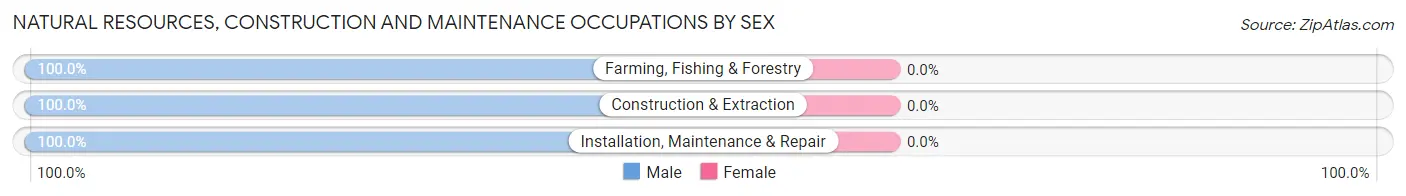
| Occupation | Male | Female |
| Farming, Fishing & Forestry | 32 (100.0%) | 0 (0.0%) |
| Construction & Extraction | 235 (100.0%) | 0 (0.0%) |
| Installation, Maintenance & Repair | 217 (100.0%) | 0 (0.0%) |
| Total (Category) | 484 (100.0%) | 0 (0.0%) |
| Total (Overall) | 3,069 (54.9%) | 2,516 (45.1%) |
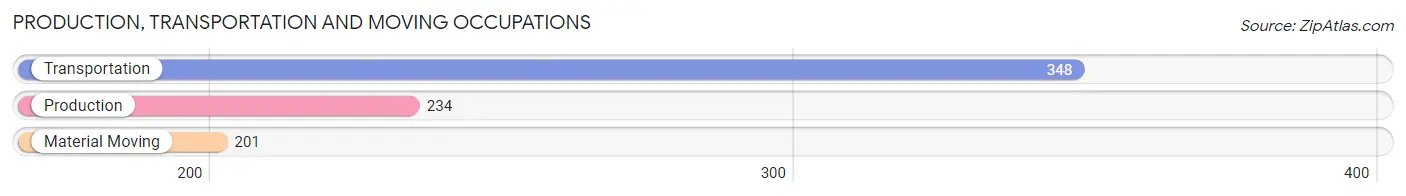
Production, Transportation and Moving Occupations
The most common Production, Transportation and Moving occupations in Winterville are Transportation (348 | 6.2%), Production (234 | 4.2%), and Material Moving (201 | 3.6%).
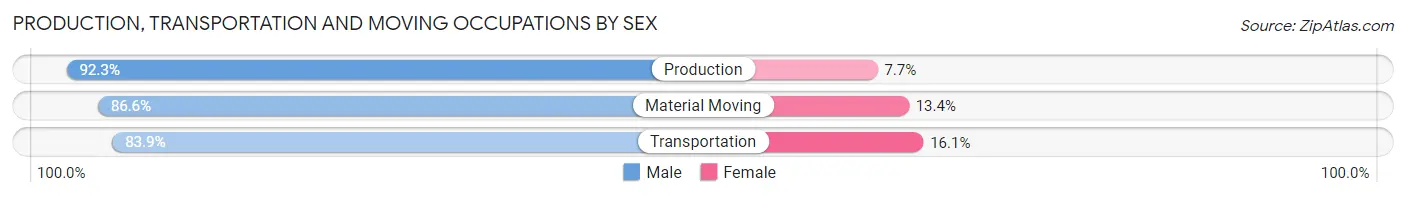
Production, Transportation and Moving Occupations by Sex
| Occupation | Male | Female |
| Production | 216 (92.3%) | 18 (7.7%) |
| Transportation | 292 (83.9%) | 56 (16.1%) |
| Material Moving | 174 (86.6%) | 27 (13.4%) |
| Total (Category) | 682 (87.1%) | 101 (12.9%) |
| Total (Overall) | 3,069 (54.9%) | 2,516 (45.1%) |
Employment Industries by Sex in Winterville
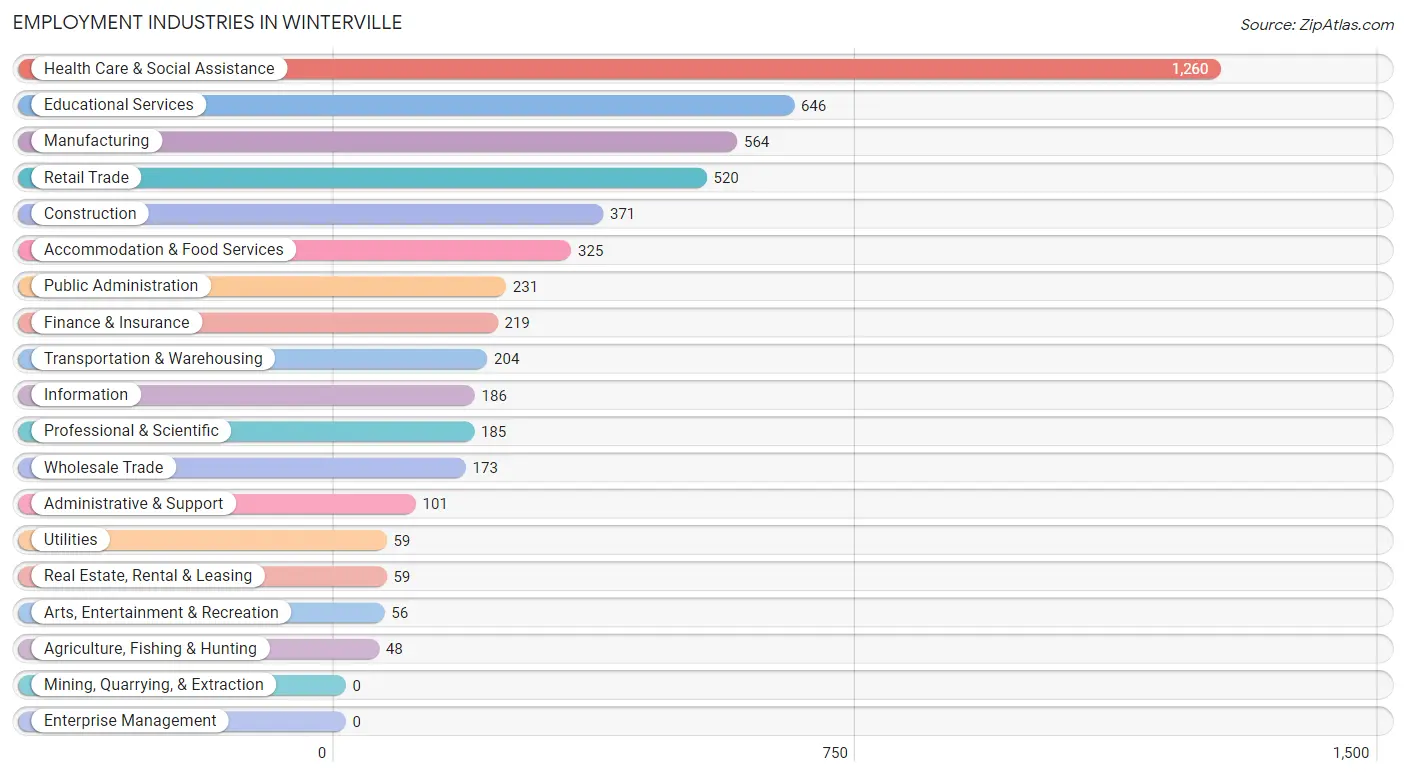
Employment Industries in Winterville
The major employment industries in Winterville include Health Care & Social Assistance (1,260 | 22.6%), Educational Services (646 | 11.6%), Manufacturing (564 | 10.1%), Retail Trade (520 | 9.3%), and Construction (371 | 6.6%).
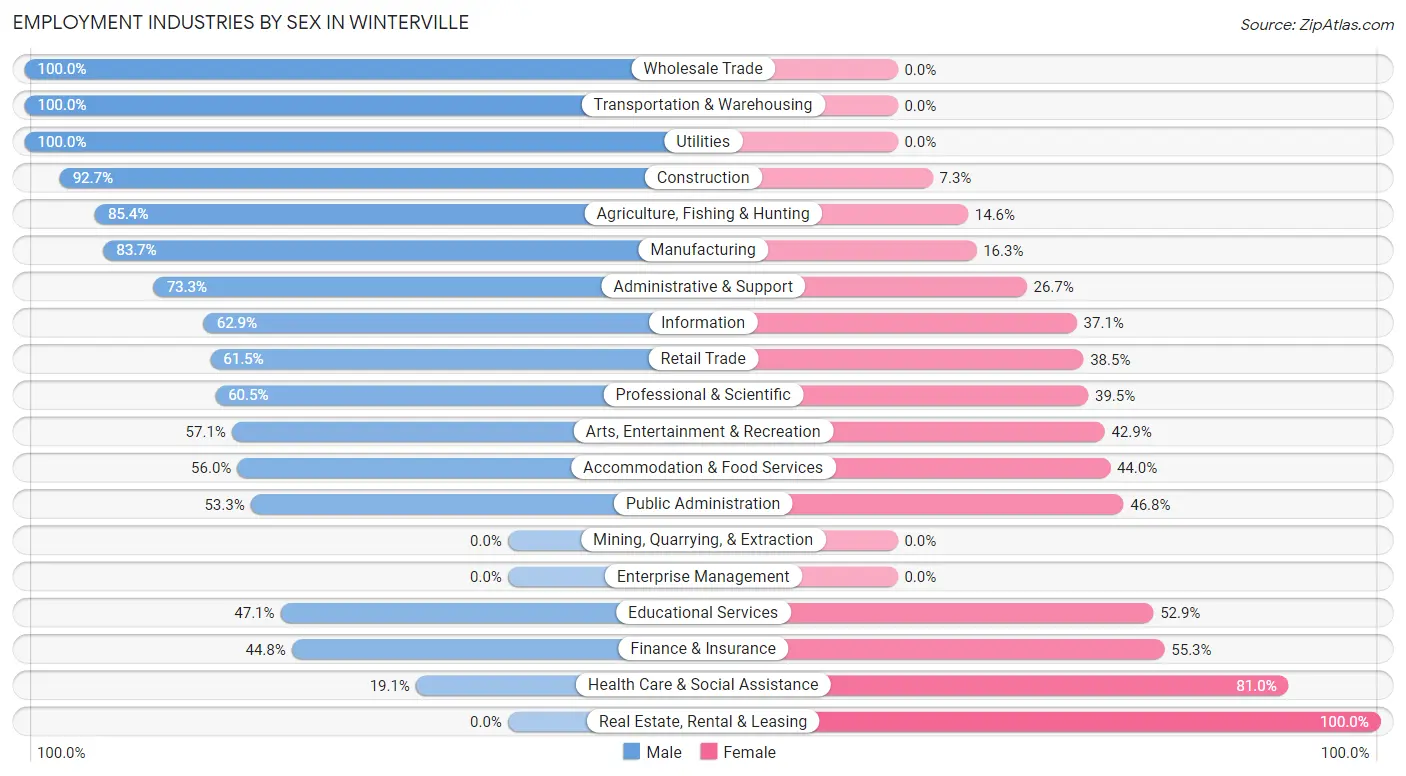
Employment Industries by Sex in Winterville
The Winterville industries that see more men than women are Wholesale Trade (100.0%), Transportation & Warehousing (100.0%), and Utilities (100.0%), whereas the industries that tend to have a higher number of women are Real Estate, Rental & Leasing (100.0%), Health Care & Social Assistance (80.9%), and Finance & Insurance (55.2%).
| Industry | Male | Female |
| Agriculture, Fishing & Hunting | 41 (85.4%) | 7 (14.6%) |
| Mining, Quarrying, & Extraction | 0 (0.0%) | 0 (0.0%) |
| Construction | 344 (92.7%) | 27 (7.3%) |
| Manufacturing | 472 (83.7%) | 92 (16.3%) |
| Wholesale Trade | 173 (100.0%) | 0 (0.0%) |
| Retail Trade | 320 (61.5%) | 200 (38.5%) |
| Transportation & Warehousing | 204 (100.0%) | 0 (0.0%) |
| Utilities | 59 (100.0%) | 0 (0.0%) |
| Information | 117 (62.9%) | 69 (37.1%) |
| Finance & Insurance | 98 (44.8%) | 121 (55.2%) |
| Real Estate, Rental & Leasing | 0 (0.0%) | 59 (100.0%) |
| Professional & Scientific | 112 (60.5%) | 73 (39.5%) |
| Enterprise Management | 0 (0.0%) | 0 (0.0%) |
| Administrative & Support | 74 (73.3%) | 27 (26.7%) |
| Educational Services | 304 (47.1%) | 342 (52.9%) |
| Health Care & Social Assistance | 240 (19.1%) | 1,020 (80.9%) |
| Arts, Entertainment & Recreation | 32 (57.1%) | 24 (42.9%) |
| Accommodation & Food Services | 182 (56.0%) | 143 (44.0%) |
| Public Administration | 123 (53.2%) | 108 (46.8%) |
| Total | 3,069 (54.9%) | 2,516 (45.1%) |
Education in Winterville
School Enrollment in Winterville
The most common levels of schooling among the 2,703 students in Winterville are college / undergraduate (701 | 25.9%), middle school (606 | 22.4%), and high school (596 | 22.1%).
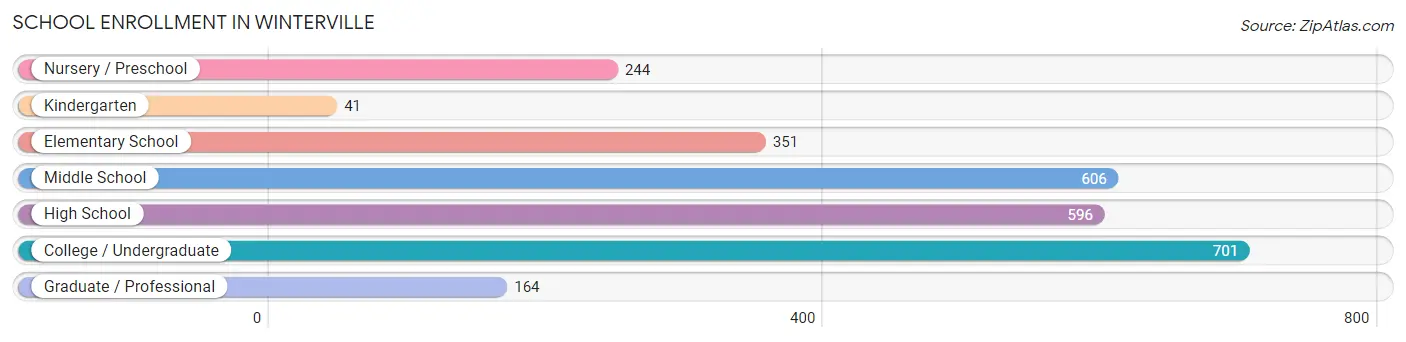
| School Level | # Students | % Students |
| Nursery / Preschool | 244 | 9.0% |
| Kindergarten | 41 | 1.5% |
| Elementary School | 351 | 13.0% |
| Middle School | 606 | 22.4% |
| High School | 596 | 22.1% |
| College / Undergraduate | 701 | 25.9% |
| Graduate / Professional | 164 | 6.1% |
| Total | 2,703 | 100.0% |
School Enrollment by Age by Funding Source in Winterville
Out of a total of 2,703 students who are enrolled in schools in Winterville, 551 (20.4%) attend a private institution, while the remaining 2,152 (79.6%) are enrolled in public schools. The age group of 3 to 4 year olds has the highest likelihood of being enrolled in private schools, with 85 (45.5% in the age bracket) enrolled. Conversely, the age group of 20 to 24 year olds has the lowest likelihood of being enrolled in a private school, with 505 (95.3% in the age bracket) attending a public institution.
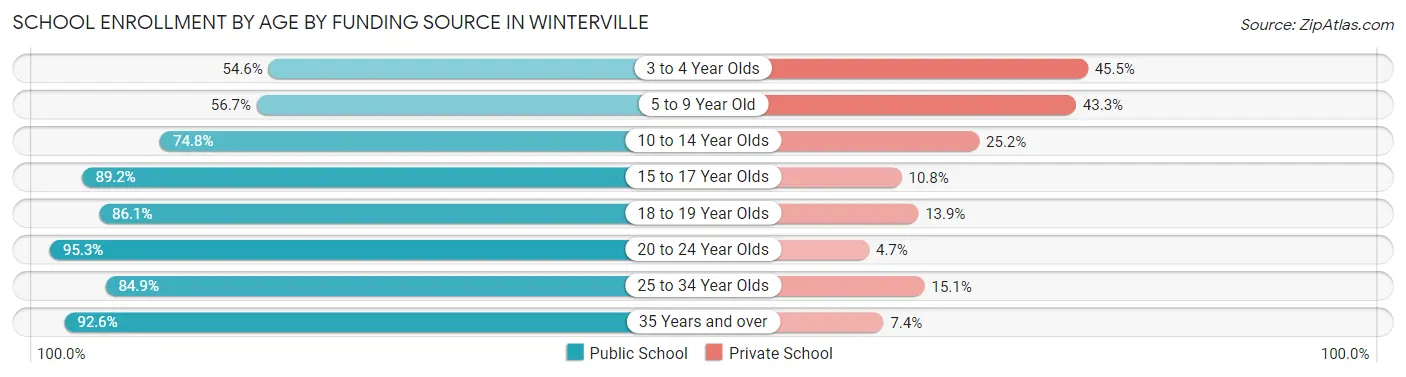
| Age Bracket | Public School | Private School |
| 3 to 4 Year Olds | 102 (54.5%) | 85 (45.5%) |
| 5 to 9 Year Old | 202 (56.7%) | 154 (43.3%) |
| 10 to 14 Year Olds | 569 (74.8%) | 192 (25.2%) |
| 15 to 17 Year Olds | 331 (89.2%) | 40 (10.8%) |
| 18 to 19 Year Olds | 180 (86.1%) | 29 (13.9%) |
| 20 to 24 Year Olds | 505 (95.3%) | 25 (4.7%) |
| 25 to 34 Year Olds | 62 (84.9%) | 11 (15.1%) |
| 35 Years and over | 200 (92.6%) | 16 (7.4%) |
| Total | 2,152 (79.6%) | 551 (20.4%) |
Educational Attainment by Field of Study in Winterville
Science & technology (544 | 17.3%), business (500 | 15.9%), education (440 | 14.0%), arts & humanities (287 | 9.1%), and liberal arts & history (224 | 7.1%) are the most common fields of study among 3,140 individuals in Winterville who have obtained a bachelor's degree or higher.
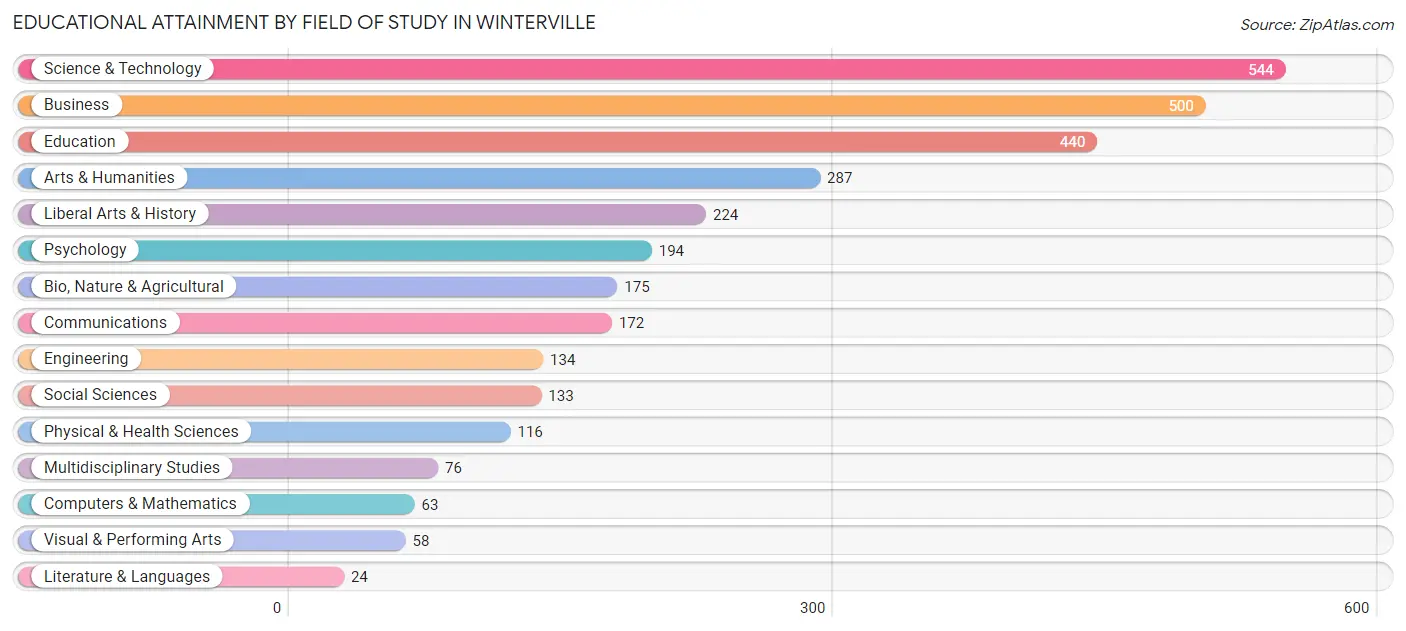
| Field of Study | # Graduates | % Graduates |
| Computers & Mathematics | 63 | 2.0% |
| Bio, Nature & Agricultural | 175 | 5.6% |
| Physical & Health Sciences | 116 | 3.7% |
| Psychology | 194 | 6.2% |
| Social Sciences | 133 | 4.2% |
| Engineering | 134 | 4.3% |
| Multidisciplinary Studies | 76 | 2.4% |
| Science & Technology | 544 | 17.3% |
| Business | 500 | 15.9% |
| Education | 440 | 14.0% |
| Literature & Languages | 24 | 0.8% |
| Liberal Arts & History | 224 | 7.1% |
| Visual & Performing Arts | 58 | 1.8% |
| Communications | 172 | 5.5% |
| Arts & Humanities | 287 | 9.1% |
| Total | 3,140 | 100.0% |
Transportation & Commute in Winterville
Vehicle Availability by Sex in Winterville
The most prevalent vehicle ownership categories in Winterville are males with 2 vehicles (1,631, accounting for 52.4%) and females with 2 vehicles (1,382, making up 65.2%).
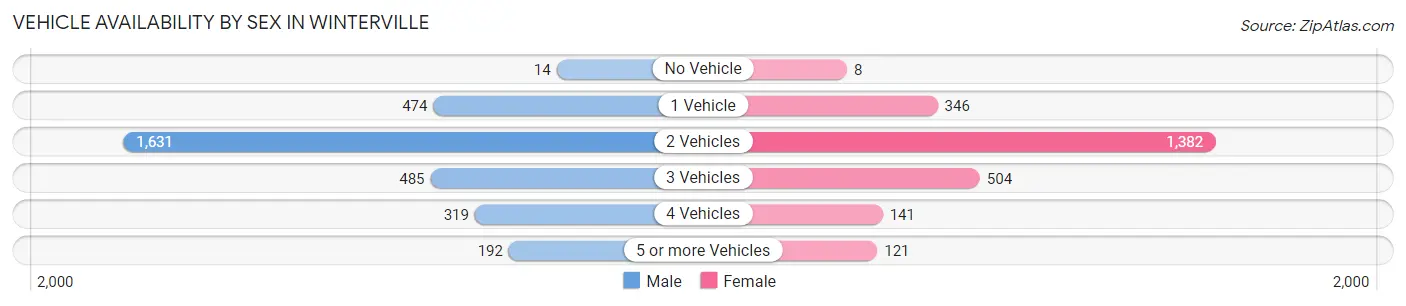
| Vehicles Available | Male | Female |
| No Vehicle | 14 (0.4%) | 8 (0.3%) |
| 1 Vehicle | 474 (15.2%) | 346 (13.8%) |
| 2 Vehicles | 1,631 (52.4%) | 1,382 (55.2%) |
| 3 Vehicles | 485 (15.6%) | 504 (20.1%) |
| 4 Vehicles | 319 (10.2%) | 141 (5.6%) |
| 5 or more Vehicles | 192 (6.2%) | 121 (4.8%) |
| Total | 3,115 (100.0%) | 2,502 (100.0%) |
Commute Time in Winterville
The most frequently occuring commute durations in Winterville are 15 to 19 minutes (1,159 commuters, 22.8%), 20 to 24 minutes (976 commuters, 19.2%), and 10 to 14 minutes (652 commuters, 12.8%).
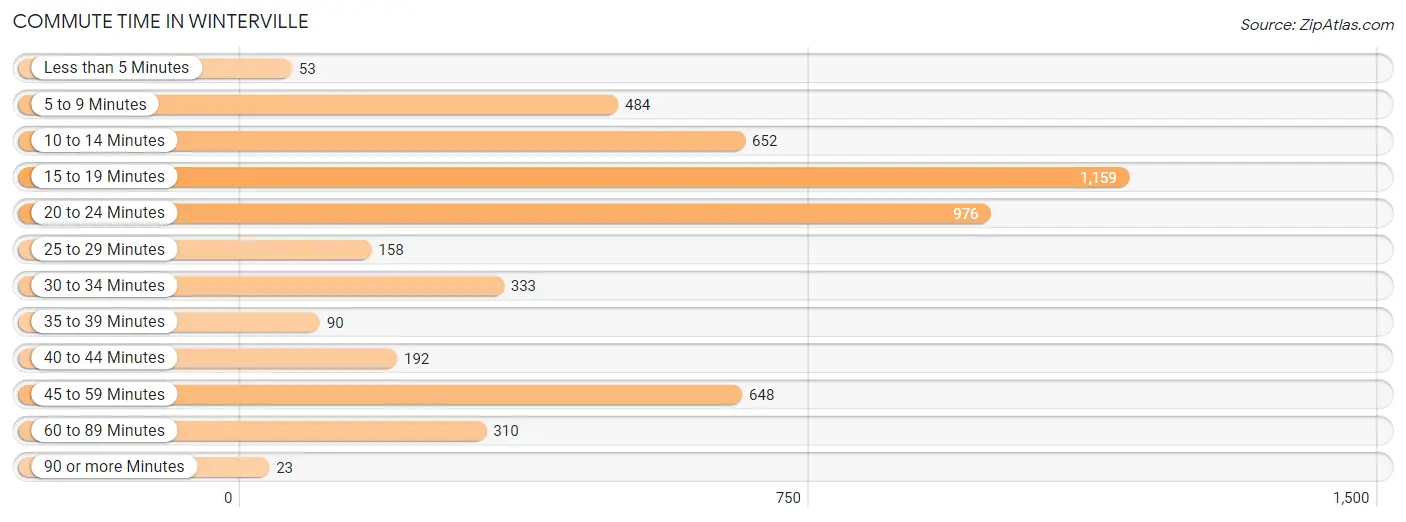
| Commute Time | # Commuters | % Commuters |
| Less than 5 Minutes | 53 | 1.0% |
| 5 to 9 Minutes | 484 | 9.5% |
| 10 to 14 Minutes | 652 | 12.8% |
| 15 to 19 Minutes | 1,159 | 22.8% |
| 20 to 24 Minutes | 976 | 19.2% |
| 25 to 29 Minutes | 158 | 3.1% |
| 30 to 34 Minutes | 333 | 6.6% |
| 35 to 39 Minutes | 90 | 1.8% |
| 40 to 44 Minutes | 192 | 3.8% |
| 45 to 59 Minutes | 648 | 12.8% |
| 60 to 89 Minutes | 310 | 6.1% |
| 90 or more Minutes | 23 | 0.4% |
Commute Time by Sex in Winterville
The most common commute times in Winterville are 15 to 19 minutes (694 commuters, 25.3%) for males and 20 to 24 minutes (507 commuters, 21.7%) for females.
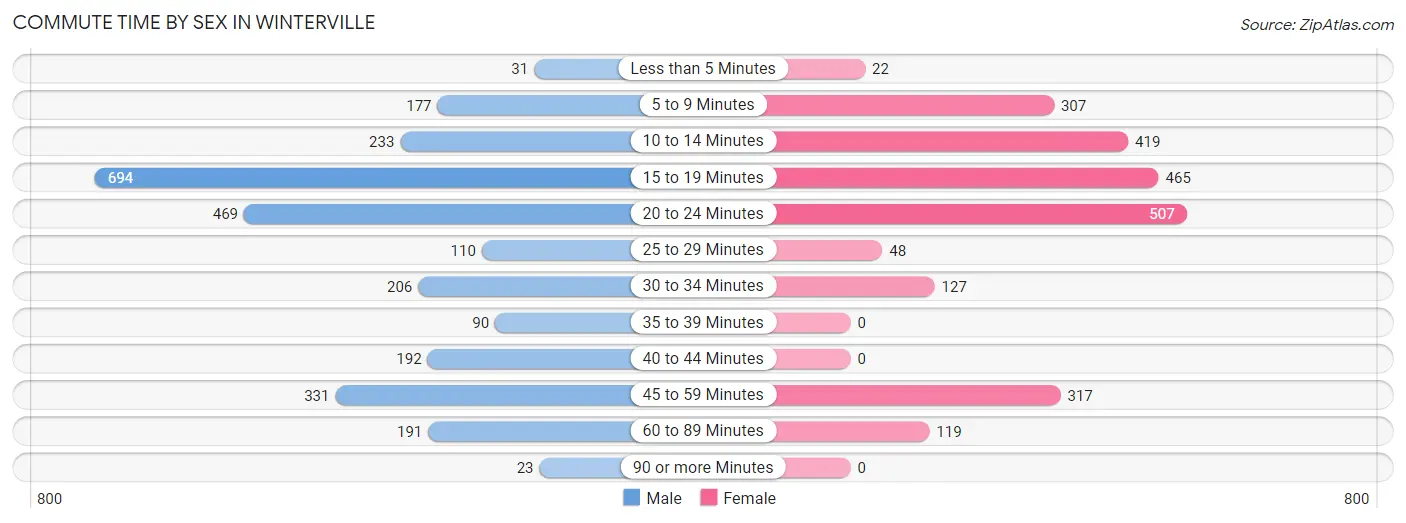
| Commute Time | Male | Female |
| Less than 5 Minutes | 31 (1.1%) | 22 (0.9%) |
| 5 to 9 Minutes | 177 (6.4%) | 307 (13.2%) |
| 10 to 14 Minutes | 233 (8.5%) | 419 (18.0%) |
| 15 to 19 Minutes | 694 (25.3%) | 465 (20.0%) |
| 20 to 24 Minutes | 469 (17.1%) | 507 (21.7%) |
| 25 to 29 Minutes | 110 (4.0%) | 48 (2.1%) |
| 30 to 34 Minutes | 206 (7.5%) | 127 (5.4%) |
| 35 to 39 Minutes | 90 (3.3%) | 0 (0.0%) |
| 40 to 44 Minutes | 192 (7.0%) | 0 (0.0%) |
| 45 to 59 Minutes | 331 (12.0%) | 317 (13.6%) |
| 60 to 89 Minutes | 191 (7.0%) | 119 (5.1%) |
| 90 or more Minutes | 23 (0.8%) | 0 (0.0%) |
Time of Departure to Work by Sex in Winterville
The most frequent times of departure to work in Winterville are 8:00 AM to 8:29 AM (444, 16.2%) for males and 7:00 AM to 7:29 AM (548, 23.5%) for females.
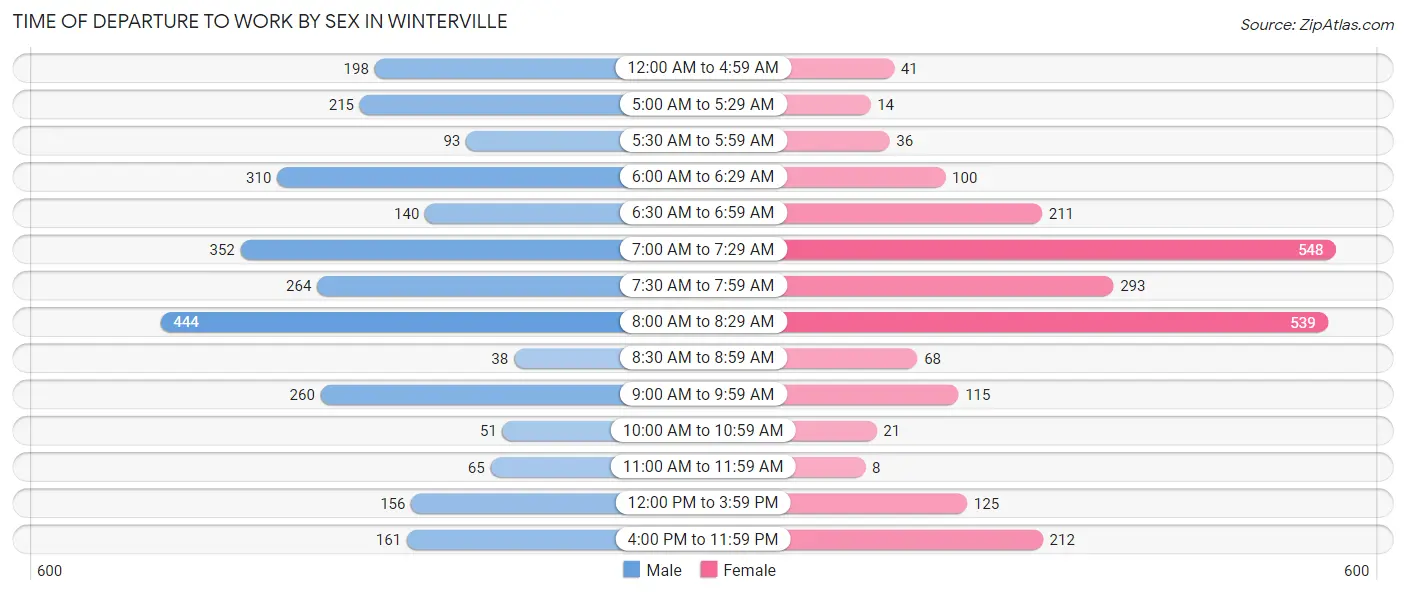
| Time of Departure | Male | Female |
| 12:00 AM to 4:59 AM | 198 (7.2%) | 41 (1.8%) |
| 5:00 AM to 5:29 AM | 215 (7.8%) | 14 (0.6%) |
| 5:30 AM to 5:59 AM | 93 (3.4%) | 36 (1.5%) |
| 6:00 AM to 6:29 AM | 310 (11.3%) | 100 (4.3%) |
| 6:30 AM to 6:59 AM | 140 (5.1%) | 211 (9.0%) |
| 7:00 AM to 7:29 AM | 352 (12.8%) | 548 (23.5%) |
| 7:30 AM to 7:59 AM | 264 (9.6%) | 293 (12.6%) |
| 8:00 AM to 8:29 AM | 444 (16.2%) | 539 (23.1%) |
| 8:30 AM to 8:59 AM | 38 (1.4%) | 68 (2.9%) |
| 9:00 AM to 9:59 AM | 260 (9.5%) | 115 (4.9%) |
| 10:00 AM to 10:59 AM | 51 (1.9%) | 21 (0.9%) |
| 11:00 AM to 11:59 AM | 65 (2.4%) | 8 (0.3%) |
| 12:00 PM to 3:59 PM | 156 (5.7%) | 125 (5.4%) |
| 4:00 PM to 11:59 PM | 161 (5.9%) | 212 (9.1%) |
| Total | 2,747 (100.0%) | 2,331 (100.0%) |
Housing Occupancy in Winterville
Occupancy by Ownership in Winterville
Of the total 4,309 dwellings in Winterville, owner-occupied units account for 3,756 (87.2%), while renter-occupied units make up 553 (12.8%).
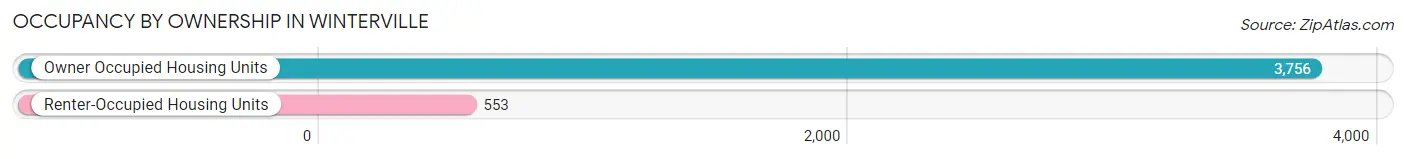
| Occupancy | # Housing Units | % Housing Units |
| Owner Occupied Housing Units | 3,756 | 87.2% |
| Renter-Occupied Housing Units | 553 | 12.8% |
| Total Occupied Housing Units | 4,309 | 100.0% |
Occupancy by Household Size in Winterville
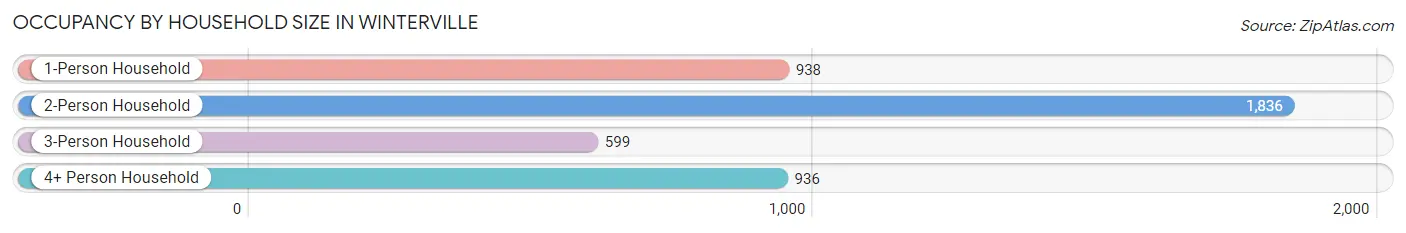
| Household Size | # Housing Units | % Housing Units |
| 1-Person Household | 938 | 21.8% |
| 2-Person Household | 1,836 | 42.6% |
| 3-Person Household | 599 | 13.9% |
| 4+ Person Household | 936 | 21.7% |
| Total Housing Units | 4,309 | 100.0% |
Occupancy by Ownership by Household Size in Winterville
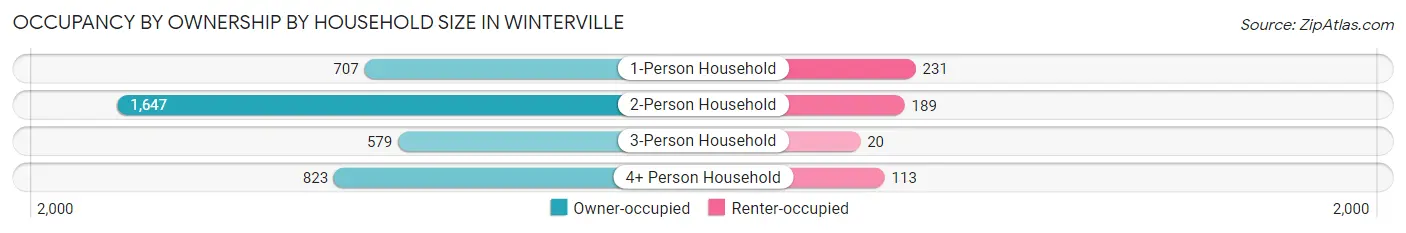
| Household Size | Owner-occupied | Renter-occupied |
| 1-Person Household | 707 (75.4%) | 231 (24.6%) |
| 2-Person Household | 1,647 (89.7%) | 189 (10.3%) |
| 3-Person Household | 579 (96.7%) | 20 (3.3%) |
| 4+ Person Household | 823 (87.9%) | 113 (12.1%) |
| Total Housing Units | 3,756 (87.2%) | 553 (12.8%) |
Occupancy by Educational Attainment in Winterville
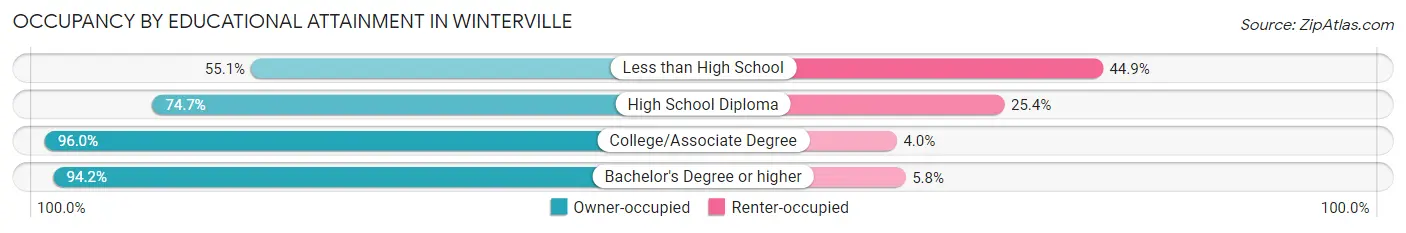
| Household Size | Owner-occupied | Renter-occupied |
| Less than High School | 247 (55.1%) | 201 (44.9%) |
| High School Diploma | 586 (74.7%) | 199 (25.4%) |
| College/Associate Degree | 1,337 (96.0%) | 56 (4.0%) |
| Bachelor's Degree or higher | 1,586 (94.2%) | 97 (5.8%) |
Occupancy by Age of Householder in Winterville
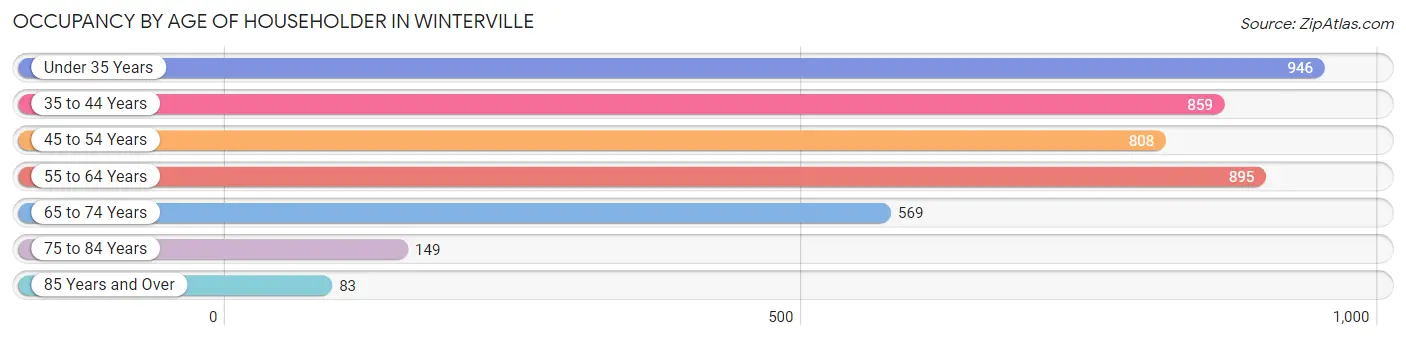
| Age Bracket | # Households | % Households |
| Under 35 Years | 946 | 22.0% |
| 35 to 44 Years | 859 | 19.9% |
| 45 to 54 Years | 808 | 18.8% |
| 55 to 64 Years | 895 | 20.8% |
| 65 to 74 Years | 569 | 13.2% |
| 75 to 84 Years | 149 | 3.5% |
| 85 Years and Over | 83 | 1.9% |
| Total | 4,309 | 100.0% |
Housing Finances in Winterville
Median Income by Occupancy in Winterville
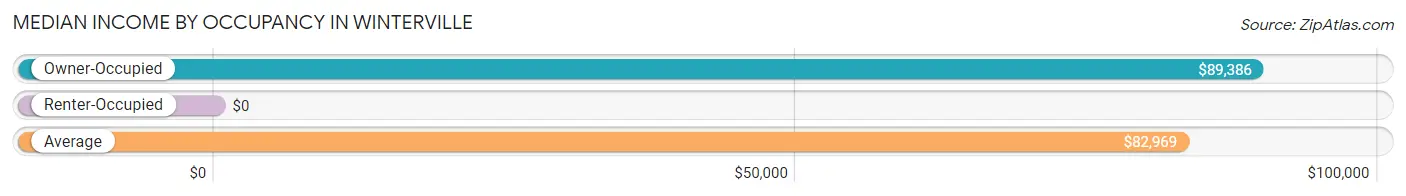
| Occupancy Type | # Households | Median Income |
| Owner-Occupied | 3,756 (87.2%) | $89,386 |
| Renter-Occupied | 553 (12.8%) | $0 |
| Average | 4,309 (100.0%) | $82,969 |
Occupancy by Householder Income Bracket in Winterville
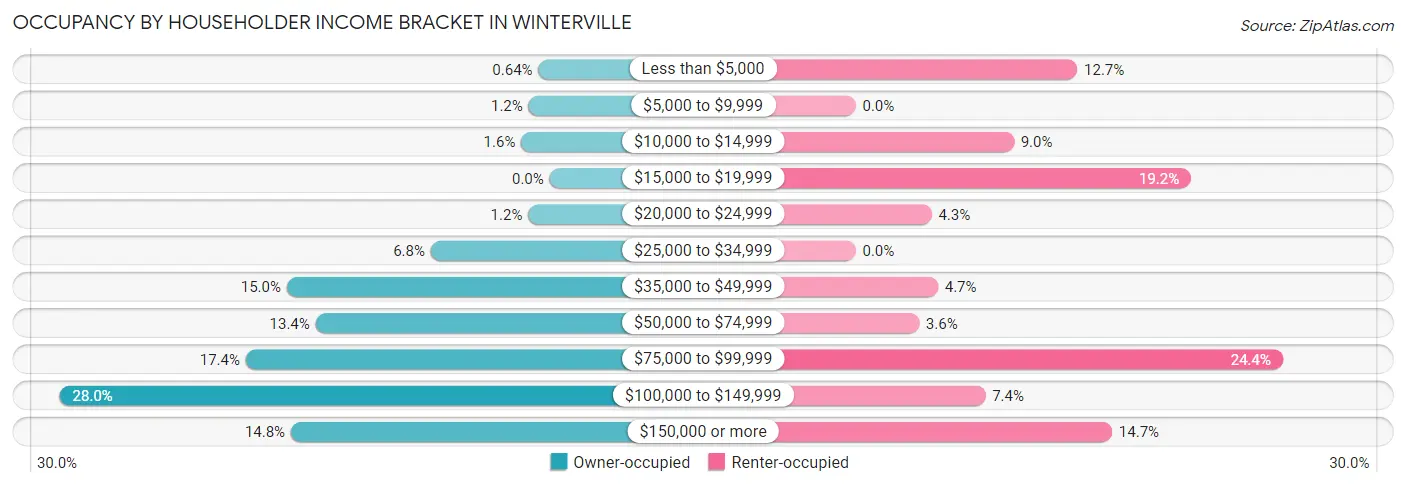
| Income Bracket | Owner-occupied | Renter-occupied |
| Less than $5,000 | 24 (0.6%) | 70 (12.7%) |
| $5,000 to $9,999 | 45 (1.2%) | 0 (0.0%) |
| $10,000 to $14,999 | 61 (1.6%) | 50 (9.0%) |
| $15,000 to $19,999 | 0 (0.0%) | 106 (19.2%) |
| $20,000 to $24,999 | 46 (1.2%) | 24 (4.3%) |
| $25,000 to $34,999 | 255 (6.8%) | 0 (0.0%) |
| $35,000 to $49,999 | 564 (15.0%) | 26 (4.7%) |
| $50,000 to $74,999 | 502 (13.4%) | 20 (3.6%) |
| $75,000 to $99,999 | 652 (17.4%) | 135 (24.4%) |
| $100,000 to $149,999 | 1,052 (28.0%) | 41 (7.4%) |
| $150,000 or more | 555 (14.8%) | 81 (14.6%) |
| Total | 3,756 (100.0%) | 553 (100.0%) |
Monthly Housing Cost Tiers in Winterville
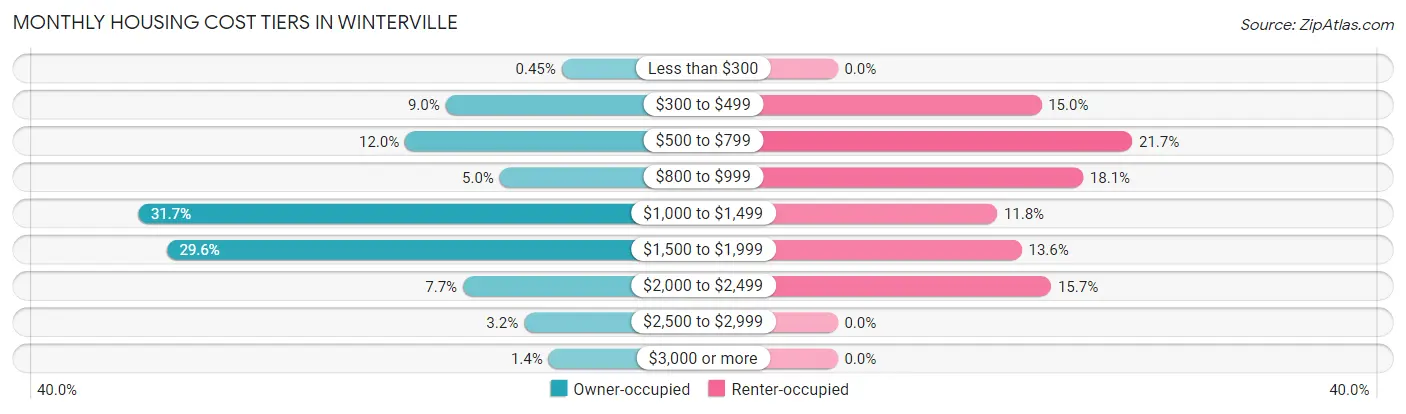
| Monthly Cost | Owner-occupied | Renter-occupied |
| Less than $300 | 17 (0.4%) | 0 (0.0%) |
| $300 to $499 | 338 (9.0%) | 83 (15.0%) |
| $500 to $799 | 450 (12.0%) | 120 (21.7%) |
| $800 to $999 | 188 (5.0%) | 100 (18.1%) |
| $1,000 to $1,499 | 1,189 (31.7%) | 65 (11.7%) |
| $1,500 to $1,999 | 1,110 (29.5%) | 75 (13.6%) |
| $2,000 to $2,499 | 290 (7.7%) | 87 (15.7%) |
| $2,500 to $2,999 | 121 (3.2%) | 0 (0.0%) |
| $3,000 or more | 53 (1.4%) | 0 (0.0%) |
| Total | 3,756 (100.0%) | 553 (100.0%) |
Physical Housing Characteristics in Winterville
Housing Structures in Winterville
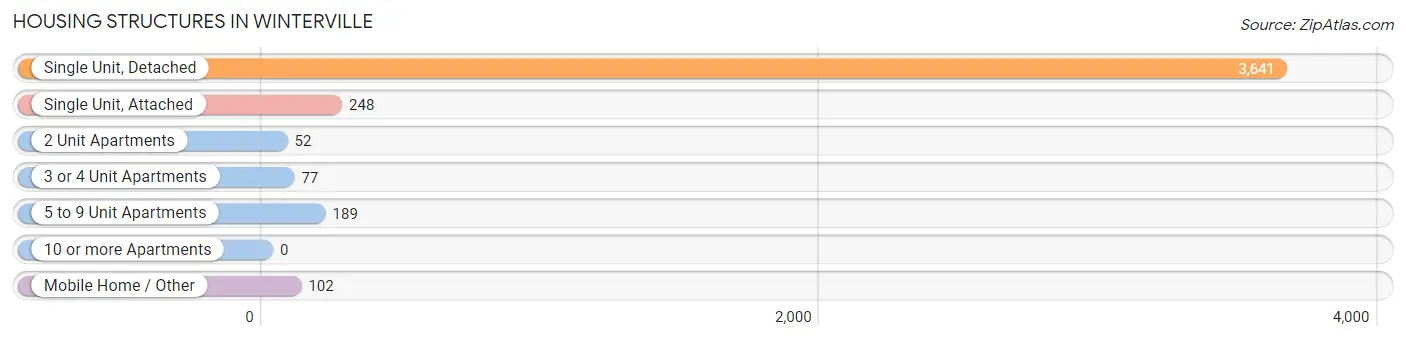
| Structure Type | # Housing Units | % Housing Units |
| Single Unit, Detached | 3,641 | 84.5% |
| Single Unit, Attached | 248 | 5.8% |
| 2 Unit Apartments | 52 | 1.2% |
| 3 or 4 Unit Apartments | 77 | 1.8% |
| 5 to 9 Unit Apartments | 189 | 4.4% |
| 10 or more Apartments | 0 | 0.0% |
| Mobile Home / Other | 102 | 2.4% |
| Total | 4,309 | 100.0% |
Housing Structures by Occupancy in Winterville
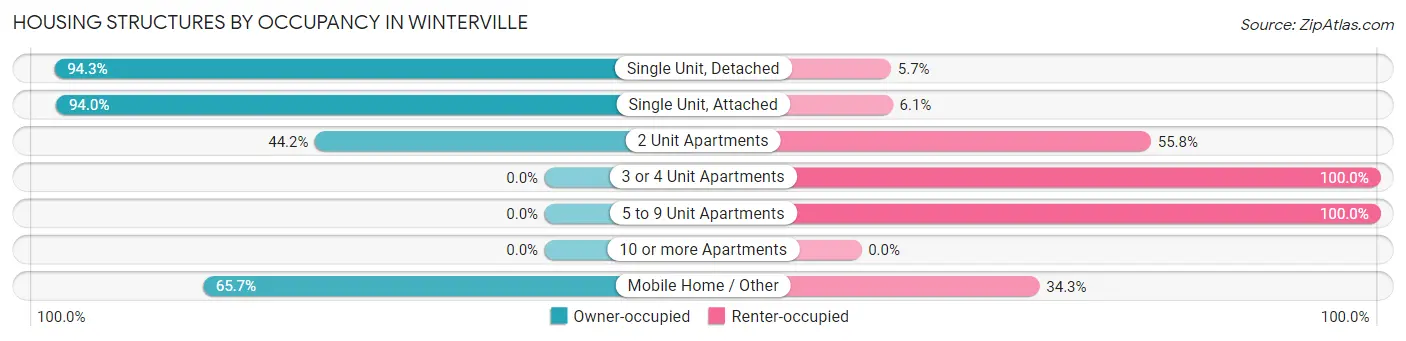
| Structure Type | Owner-occupied | Renter-occupied |
| Single Unit, Detached | 3,433 (94.3%) | 208 (5.7%) |
| Single Unit, Attached | 233 (94.0%) | 15 (6.0%) |
| 2 Unit Apartments | 23 (44.2%) | 29 (55.8%) |
| 3 or 4 Unit Apartments | 0 (0.0%) | 77 (100.0%) |
| 5 to 9 Unit Apartments | 0 (0.0%) | 189 (100.0%) |
| 10 or more Apartments | 0 (0.0%) | 0 (0.0%) |
| Mobile Home / Other | 67 (65.7%) | 35 (34.3%) |
| Total | 3,756 (87.2%) | 553 (12.8%) |
Housing Structures by Number of Rooms in Winterville
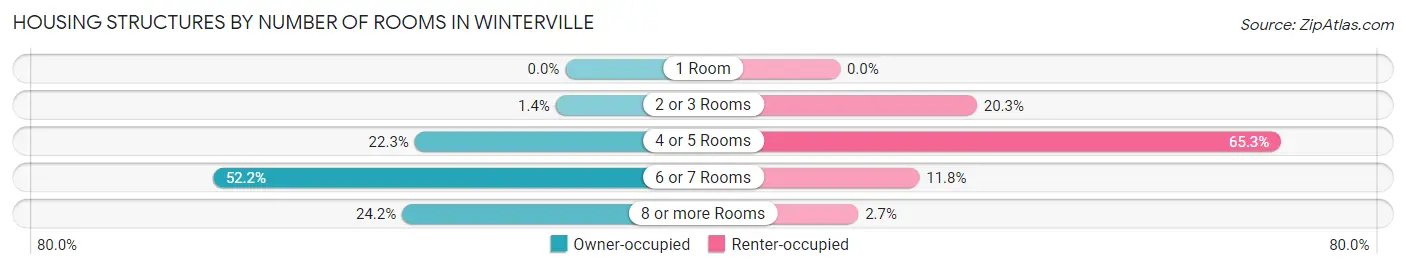
| Number of Rooms | Owner-occupied | Renter-occupied |
| 1 Room | 0 (0.0%) | 0 (0.0%) |
| 2 or 3 Rooms | 53 (1.4%) | 112 (20.3%) |
| 4 or 5 Rooms | 837 (22.3%) | 361 (65.3%) |
| 6 or 7 Rooms | 1,959 (52.2%) | 65 (11.7%) |
| 8 or more Rooms | 907 (24.1%) | 15 (2.7%) |
| Total | 3,756 (100.0%) | 553 (100.0%) |
Housing Structure by Heating Type in Winterville
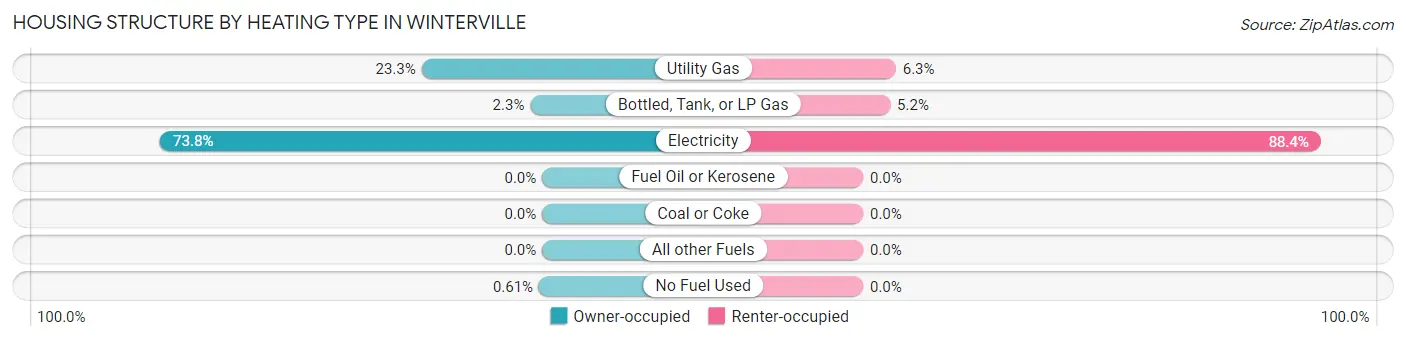
| Heating Type | Owner-occupied | Renter-occupied |
| Utility Gas | 875 (23.3%) | 35 (6.3%) |
| Bottled, Tank, or LP Gas | 86 (2.3%) | 29 (5.2%) |
| Electricity | 2,772 (73.8%) | 489 (88.4%) |
| Fuel Oil or Kerosene | 0 (0.0%) | 0 (0.0%) |
| Coal or Coke | 0 (0.0%) | 0 (0.0%) |
| All other Fuels | 0 (0.0%) | 0 (0.0%) |
| No Fuel Used | 23 (0.6%) | 0 (0.0%) |
| Total | 3,756 (100.0%) | 553 (100.0%) |
Household Vehicle Usage in Winterville
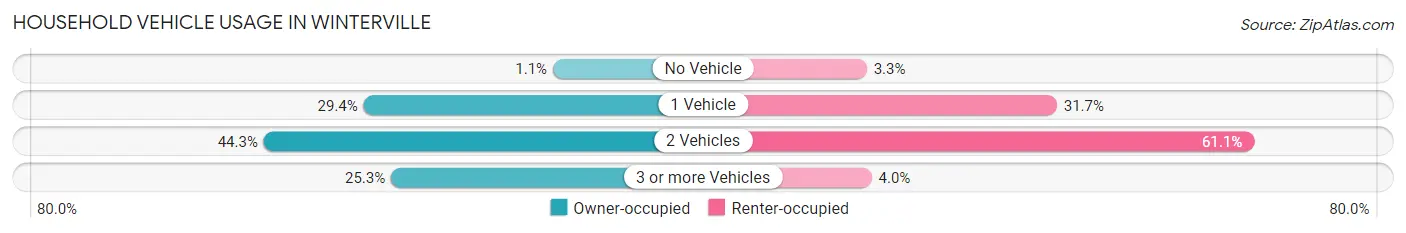
| Vehicles per Household | Owner-occupied | Renter-occupied |
| No Vehicle | 41 (1.1%) | 18 (3.3%) |
| 1 Vehicle | 1,103 (29.4%) | 175 (31.7%) |
| 2 Vehicles | 1,663 (44.3%) | 338 (61.1%) |
| 3 or more Vehicles | 949 (25.3%) | 22 (4.0%) |
| Total | 3,756 (100.0%) | 553 (100.0%) |
Real Estate & Mortgages in Winterville
Real Estate and Mortgage Overview in Winterville
| Characteristic | Without Mortgage | With Mortgage |
| Housing Units | 765 | 2,991 |
| Median Property Value | $185,900 | $199,900 |
| Median Household Income | $79,028 | $505 |
| Monthly Housing Costs | $526 | $53 |
| Real Estate Taxes | $1,394 | $35 |
Property Value by Mortgage Status in Winterville
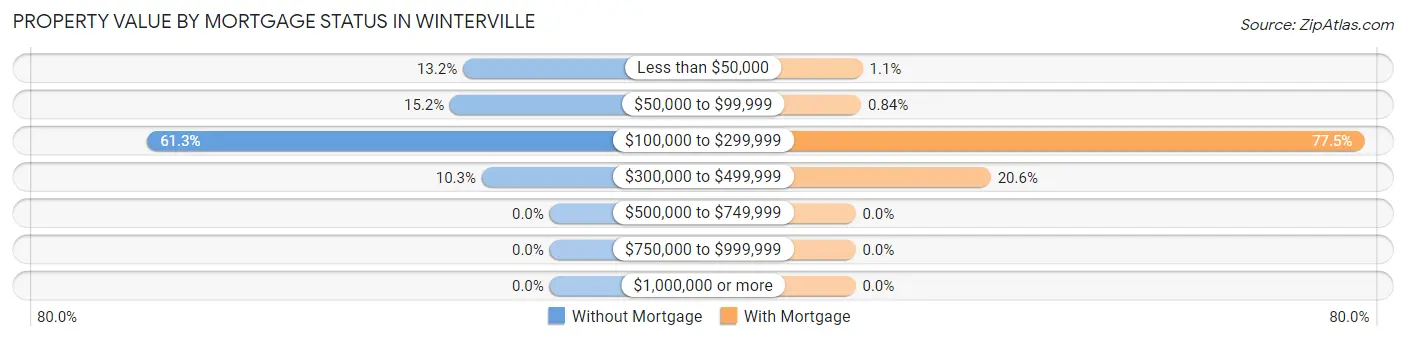
| Property Value | Without Mortgage | With Mortgage |
| Less than $50,000 | 101 (13.2%) | 32 (1.1%) |
| $50,000 to $99,999 | 116 (15.2%) | 25 (0.8%) |
| $100,000 to $299,999 | 469 (61.3%) | 2,318 (77.5%) |
| $300,000 to $499,999 | 79 (10.3%) | 616 (20.6%) |
| $500,000 to $749,999 | 0 (0.0%) | 0 (0.0%) |
| $750,000 to $999,999 | 0 (0.0%) | 0 (0.0%) |
| $1,000,000 or more | 0 (0.0%) | 0 (0.0%) |
| Total | 765 (100.0%) | 2,991 (100.0%) |
Household Income by Mortgage Status in Winterville
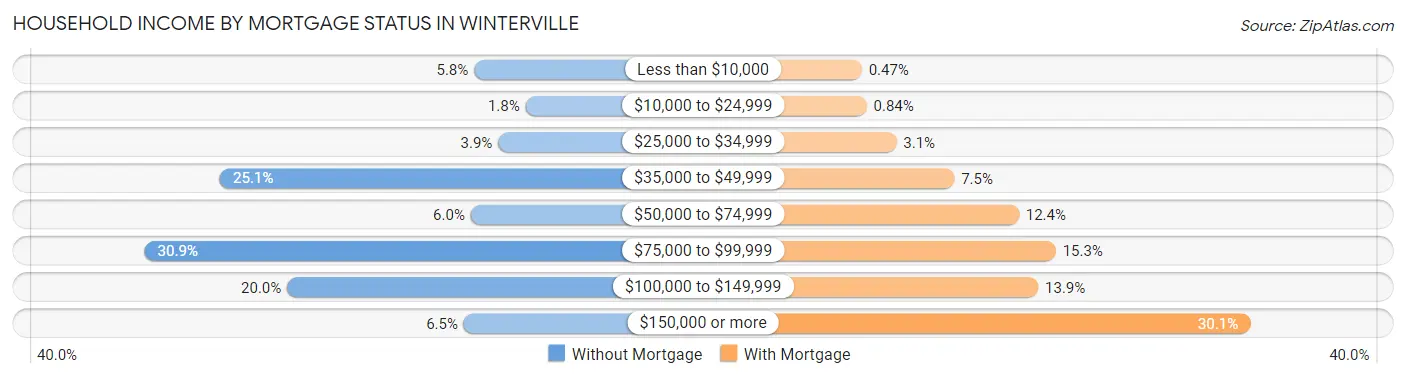
| Household Income | Without Mortgage | With Mortgage |
| Less than $10,000 | 44 (5.8%) | 14 (0.5%) |
| $10,000 to $24,999 | 14 (1.8%) | 25 (0.8%) |
| $25,000 to $34,999 | 30 (3.9%) | 93 (3.1%) |
| $35,000 to $49,999 | 192 (25.1%) | 225 (7.5%) |
| $50,000 to $74,999 | 46 (6.0%) | 372 (12.4%) |
| $75,000 to $99,999 | 236 (30.8%) | 456 (15.2%) |
| $100,000 to $149,999 | 153 (20.0%) | 416 (13.9%) |
| $150,000 or more | 50 (6.5%) | 899 (30.1%) |
| Total | 765 (100.0%) | 2,991 (100.0%) |
Property Value to Household Income Ratio in Winterville
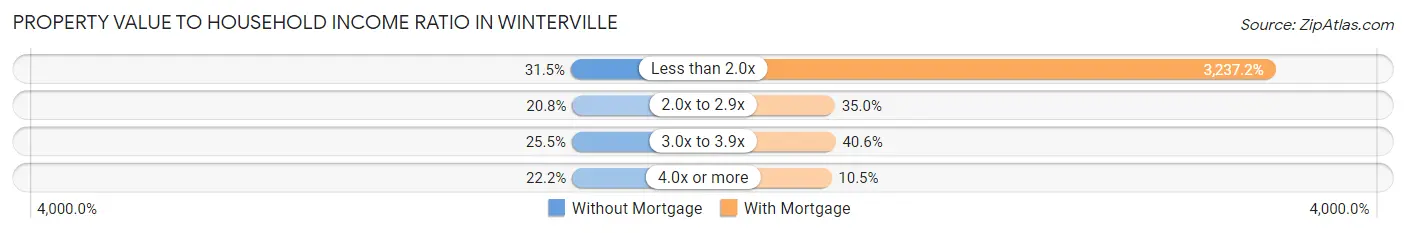
| Value-to-Income Ratio | Without Mortgage | With Mortgage |
| Less than 2.0x | 241 (31.5%) | 96,824 (3,237.2%) |
| 2.0x to 2.9x | 159 (20.8%) | 1,046 (35.0%) |
| 3.0x to 3.9x | 195 (25.5%) | 1,213 (40.6%) |
| 4.0x or more | 170 (22.2%) | 313 (10.5%) |
| Total | 765 (100.0%) | 2,991 (100.0%) |
Real Estate Taxes by Mortgage Status in Winterville
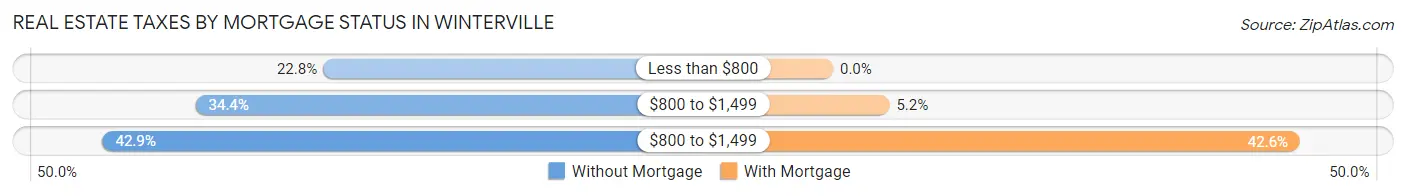
| Property Taxes | Without Mortgage | With Mortgage |
| Less than $800 | 174 (22.8%) | 0 (0.0%) |
| $800 to $1,499 | 263 (34.4%) | 154 (5.1%) |
| $800 to $1,499 | 328 (42.9%) | 1,275 (42.6%) |
| Total | 765 (100.0%) | 2,991 (100.0%) |
Health & Disability in Winterville
Health Insurance Coverage by Age in Winterville
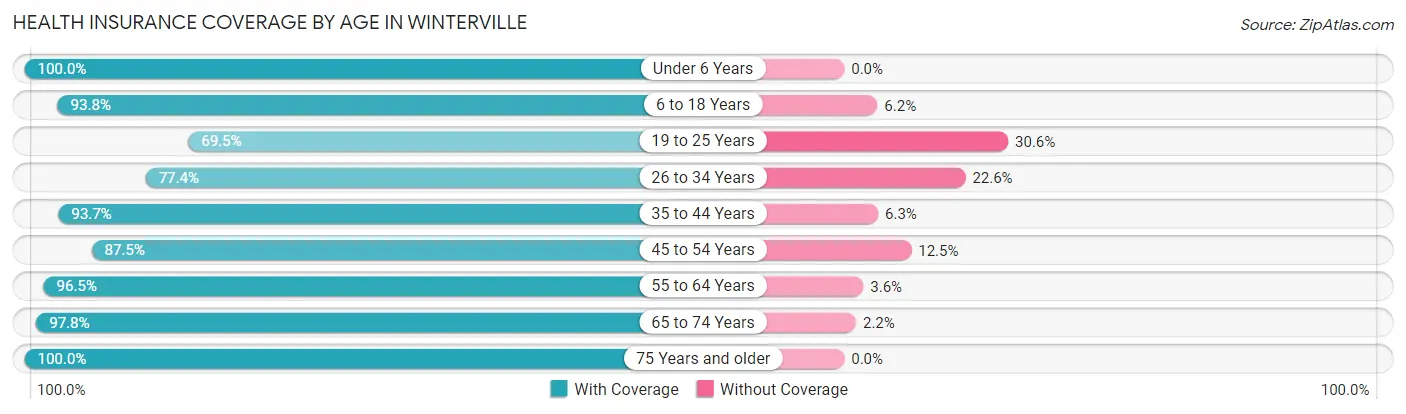
| Age Bracket | With Coverage | Without Coverage |
| Under 6 Years | 710 (100.0%) | 0 (0.0%) |
| 6 to 18 Years | 1,475 (93.8%) | 97 (6.2%) |
| 19 to 25 Years | 889 (69.5%) | 391 (30.5%) |
| 26 to 34 Years | 898 (77.4%) | 262 (22.6%) |
| 35 to 44 Years | 1,322 (93.7%) | 89 (6.3%) |
| 45 to 54 Years | 1,373 (87.5%) | 196 (12.5%) |
| 55 to 64 Years | 1,330 (96.5%) | 49 (3.5%) |
| 65 to 74 Years | 850 (97.8%) | 19 (2.2%) |
| 75 Years and older | 432 (100.0%) | 0 (0.0%) |
| Total | 9,279 (89.4%) | 1,103 (10.6%) |
Health Insurance Coverage by Citizenship Status in Winterville
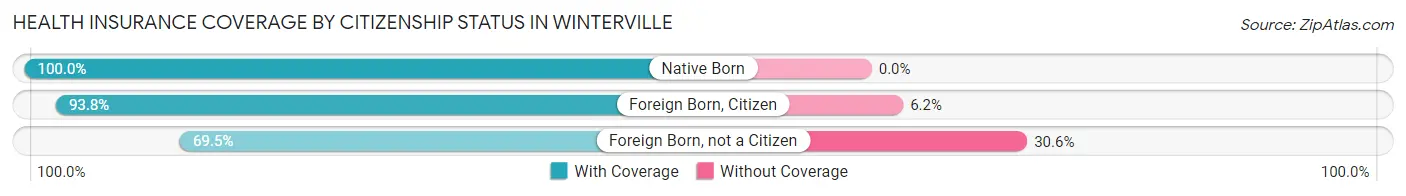
| Citizenship Status | With Coverage | Without Coverage |
| Native Born | 710 (100.0%) | 0 (0.0%) |
| Foreign Born, Citizen | 1,475 (93.8%) | 97 (6.2%) |
| Foreign Born, not a Citizen | 889 (69.5%) | 391 (30.5%) |
Health Insurance Coverage by Household Income in Winterville
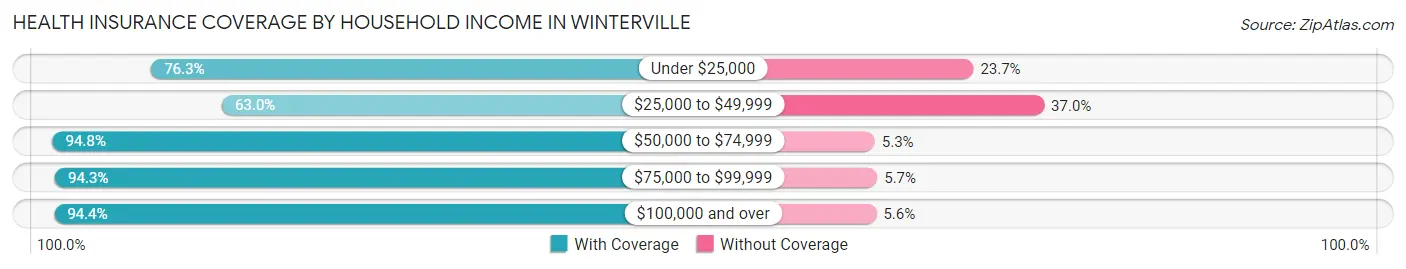
| Household Income | With Coverage | Without Coverage |
| Under $25,000 | 450 (76.3%) | 140 (23.7%) |
| $25,000 to $49,999 | 835 (63.0%) | 490 (37.0%) |
| $50,000 to $74,999 | 1,172 (94.8%) | 65 (5.2%) |
| $75,000 to $99,999 | 1,766 (94.3%) | 107 (5.7%) |
| $100,000 and over | 5,025 (94.4%) | 296 (5.6%) |
Public vs Private Health Insurance Coverage by Age in Winterville
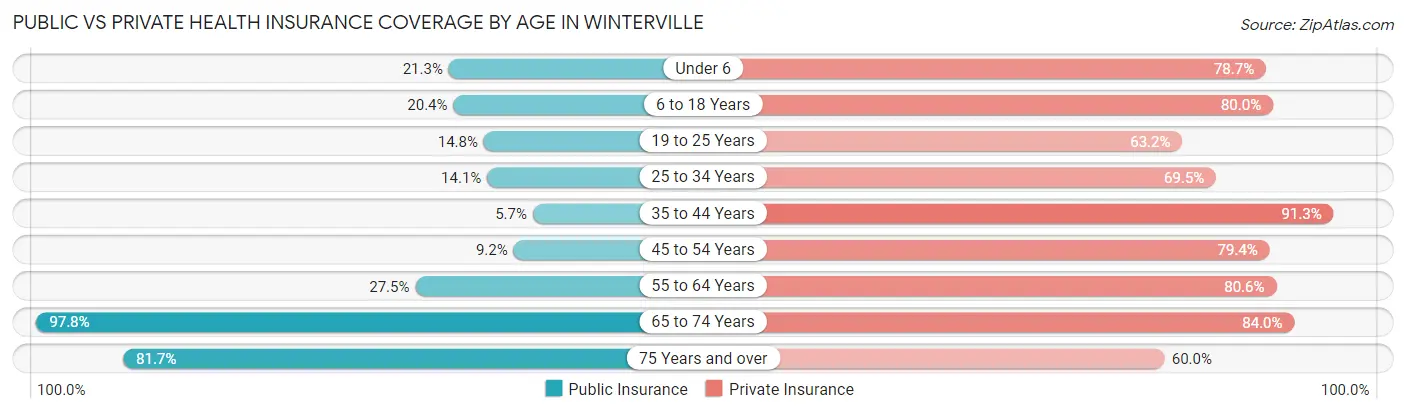
| Age Bracket | Public Insurance | Private Insurance |
| Under 6 | 151 (21.3%) | 559 (78.7%) |
| 6 to 18 Years | 321 (20.4%) | 1,258 (80.0%) |
| 19 to 25 Years | 189 (14.8%) | 809 (63.2%) |
| 25 to 34 Years | 164 (14.1%) | 806 (69.5%) |
| 35 to 44 Years | 80 (5.7%) | 1,288 (91.3%) |
| 45 to 54 Years | 145 (9.2%) | 1,246 (79.4%) |
| 55 to 64 Years | 379 (27.5%) | 1,112 (80.6%) |
| 65 to 74 Years | 850 (97.8%) | 730 (84.0%) |
| 75 Years and over | 353 (81.7%) | 259 (60.0%) |
| Total | 2,632 (25.4%) | 8,067 (77.7%) |
Disability Status by Sex by Age in Winterville
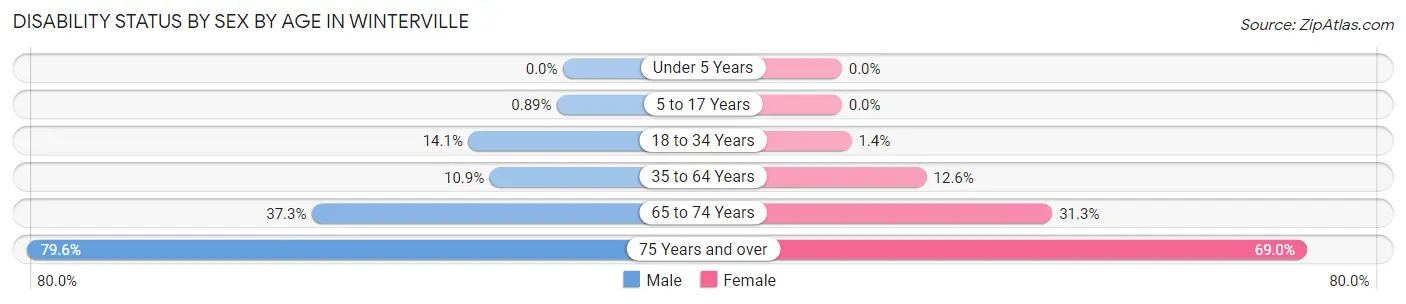
| Age Bracket | Male | Female |
| Under 5 Years | 0 (0.0%) | 0 (0.0%) |
| 5 to 17 Years | 7 (0.9%) | 0 (0.0%) |
| 18 to 34 Years | 191 (14.1%) | 18 (1.4%) |
| 35 to 64 Years | 229 (10.9%) | 284 (12.6%) |
| 65 to 74 Years | 151 (37.3%) | 145 (31.2%) |
| 75 Years and over | 187 (79.6%) | 136 (69.0%) |
Disability Class by Sex by Age in Winterville
Disability Class: Hearing Difficulty
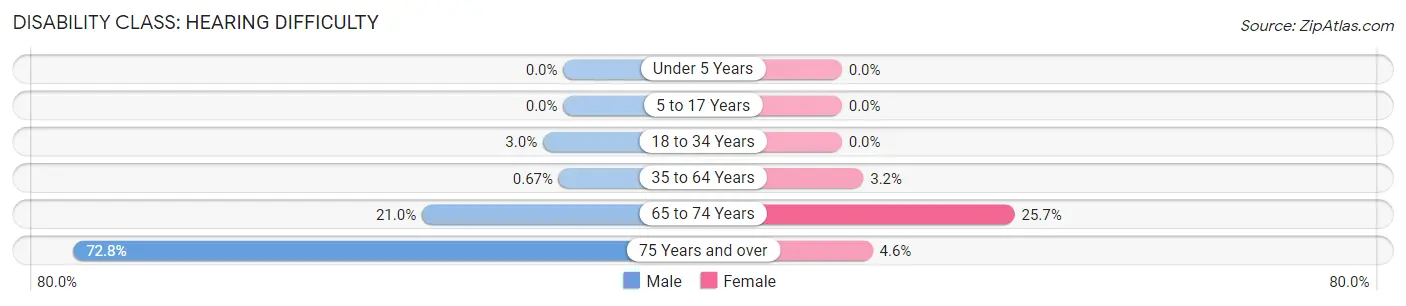
| Age Bracket | Male | Female |
| Under 5 Years | 0 (0.0%) | 0 (0.0%) |
| 5 to 17 Years | 0 (0.0%) | 0 (0.0%) |
| 18 to 34 Years | 41 (3.0%) | 0 (0.0%) |
| 35 to 64 Years | 14 (0.7%) | 72 (3.2%) |
| 65 to 74 Years | 85 (21.0%) | 119 (25.7%) |
| 75 Years and over | 171 (72.8%) | 9 (4.6%) |
Disability Class: Vision Difficulty
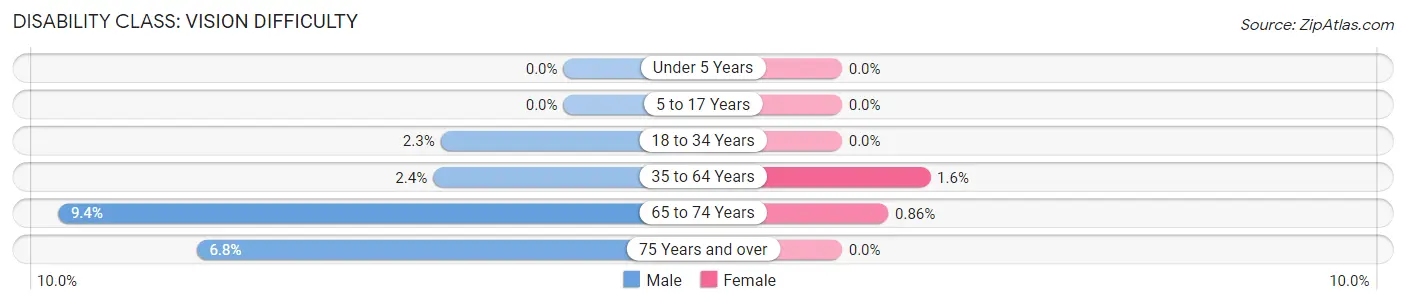
| Age Bracket | Male | Female |
| Under 5 Years | 0 (0.0%) | 0 (0.0%) |
| 5 to 17 Years | 0 (0.0%) | 0 (0.0%) |
| 18 to 34 Years | 31 (2.3%) | 0 (0.0%) |
| 35 to 64 Years | 51 (2.4%) | 37 (1.6%) |
| 65 to 74 Years | 38 (9.4%) | 4 (0.9%) |
| 75 Years and over | 16 (6.8%) | 0 (0.0%) |
Disability Class: Cognitive Difficulty
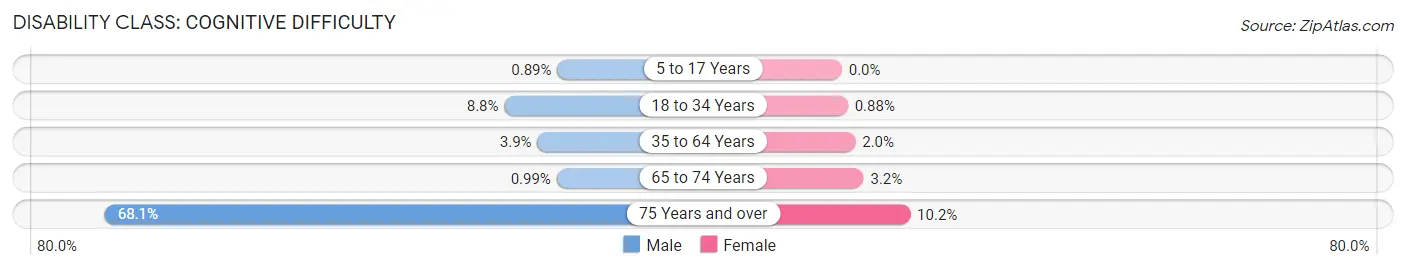
| Age Bracket | Male | Female |
| 5 to 17 Years | 7 (0.9%) | 0 (0.0%) |
| 18 to 34 Years | 119 (8.8%) | 11 (0.9%) |
| 35 to 64 Years | 81 (3.8%) | 45 (2.0%) |
| 65 to 74 Years | 4 (1.0%) | 15 (3.2%) |
| 75 Years and over | 160 (68.1%) | 20 (10.2%) |
Disability Class: Ambulatory Difficulty
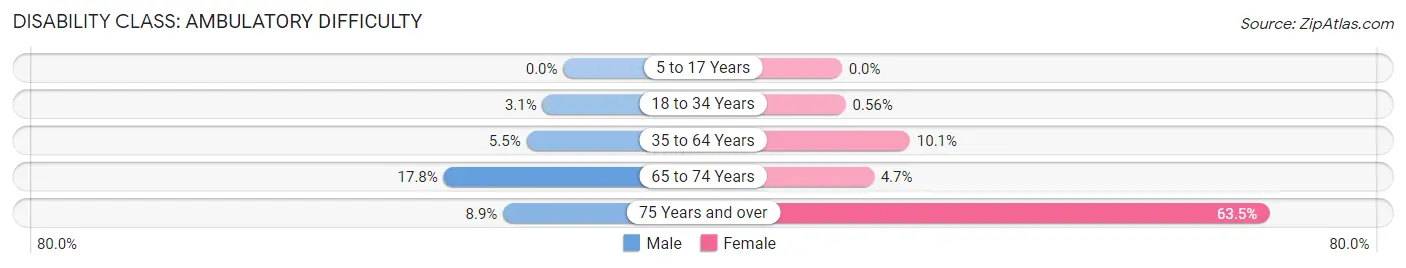
| Age Bracket | Male | Female |
| 5 to 17 Years | 0 (0.0%) | 0 (0.0%) |
| 18 to 34 Years | 42 (3.1%) | 7 (0.6%) |
| 35 to 64 Years | 115 (5.5%) | 228 (10.1%) |
| 65 to 74 Years | 72 (17.8%) | 22 (4.7%) |
| 75 Years and over | 21 (8.9%) | 125 (63.4%) |
Disability Class: Self-Care Difficulty
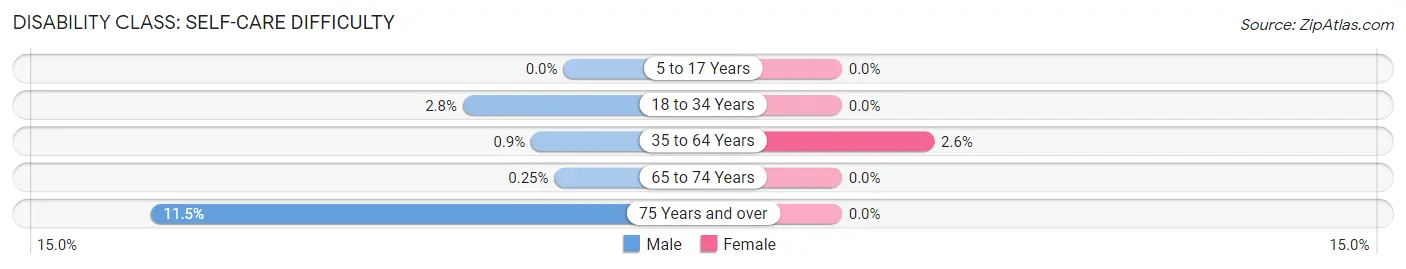
| Age Bracket | Male | Female |
| 5 to 17 Years | 0 (0.0%) | 0 (0.0%) |
| 18 to 34 Years | 38 (2.8%) | 0 (0.0%) |
| 35 to 64 Years | 19 (0.9%) | 58 (2.6%) |
| 65 to 74 Years | 1 (0.3%) | 0 (0.0%) |
| 75 Years and over | 27 (11.5%) | 0 (0.0%) |
Technology Access in Winterville
Computing Device Access in Winterville
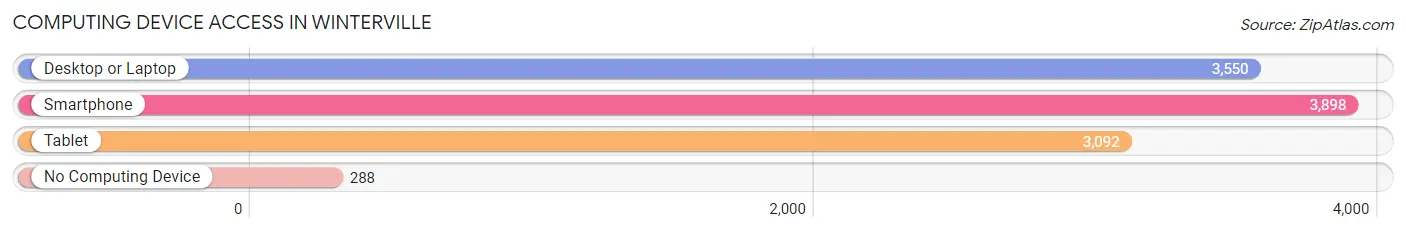
| Device Type | # Households | % Households |
| Desktop or Laptop | 3,550 | 82.4% |
| Smartphone | 3,898 | 90.5% |
| Tablet | 3,092 | 71.8% |
| No Computing Device | 288 | 6.7% |
| Total | 4,309 | 100.0% |
Internet Access in Winterville
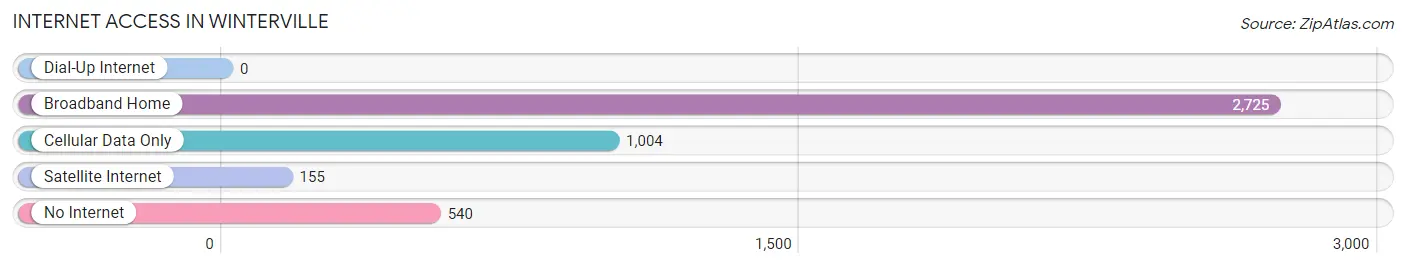
| Internet Type | # Households | % Households |
| Dial-Up Internet | 0 | 0.0% |
| Broadband Home | 2,725 | 63.2% |
| Cellular Data Only | 1,004 | 23.3% |
| Satellite Internet | 155 | 3.6% |
| No Internet | 540 | 12.5% |
| Total | 4,309 | 100.0% |
Winterville Summary
History
The town of Winterville, North Carolina is located in Pitt County, in the eastern part of the state. It is situated on the banks of the Tar River, and is part of the Greenville Metropolitan Statistical Area. The town was founded in 1887 by the Winter family, who had moved to the area from Virginia. The town was named after the family, and the Winter family still owns much of the land in the area.
The town of Winterville was originally a farming community, and the main crops grown were cotton, corn, and tobacco. The town also had a sawmill, a gristmill, and a cotton gin. In the early 1900s, the town began to grow and develop, and the first school was built in 1910. The town also had a post office, a bank, and a few stores.
In the 1920s, the town began to experience a period of growth and prosperity. The population increased, and new businesses opened up. The town also had a movie theater, a hotel, and a few restaurants. The town was also home to a number of churches, and the first library was built in 1924.
In the 1950s, the town began to experience a decline in population and businesses. The town was bypassed by the new highway system, and many of the businesses closed. The town also experienced a period of racial tension, as the town was segregated. In the 1970s, the town began to experience a period of revitalization, and the population began to increase.
Geography
Winterville is located in Pitt County, in the eastern part of North Carolina. It is situated on the banks of the Tar River, and is part of the Greenville Metropolitan Statistical Area. The town is located about 25 miles east of Greenville, and about 50 miles east of Raleigh. The town is located in a rural area, and is surrounded by farmland and forests. The town is located at an elevation of about 200 feet above sea level.
The climate in Winterville is mild and humid, with hot summers and mild winters. The average temperature in the summer is around 80 degrees Fahrenheit, and the average temperature in the winter is around 40 degrees Fahrenheit. The town receives an average of about 48 inches of rain per year.
Economy
The economy of Winterville is largely based on agriculture and manufacturing. The town is home to a number of farms, and the main crops grown are cotton, corn, and tobacco. The town also has a number of manufacturing businesses, including a furniture factory, a textile mill, and a plastics factory. The town also has a number of retail stores, restaurants, and other businesses.
The town is also home to a number of educational institutions, including Pitt Community College and East Carolina University. The town is also home to a number of medical facilities, including a hospital and a number of clinics.
Demographics
As of the 2010 census, the population of Winterville was 5,844. The population is largely white, with about 75% of the population being white. The town also has a large African American population, with about 20% of the population being African American. The town also has a small Hispanic population, with about 3% of the population being Hispanic. The median household income in the town is about $37,000, and the median home value is about $150,000.
Common Questions
What is Per Capita Income in Winterville?
Per Capita income in Winterville is $38,652.
What is the Median Family Income in Winterville?
Median Family Income in Winterville is $85,991.
What is the Median Household income in Winterville?
Median Household Income in Winterville is $82,969.
What is Income or Wage Gap in Winterville?
Income or Wage Gap in Winterville is 36.4%.
Women in Winterville earn 63.6 cents for every dollar earned by a man.
What is Inequality or Gini Index in Winterville?
Inequality or Gini Index in Winterville is 0.37.
What is the Total Population of Winterville?
Total Population of Winterville is 10,510.
What is the Total Male Population of Winterville?
Total Male Population of Winterville is 5,374.
What is the Total Female Population of Winterville?
Total Female Population of Winterville is 5,136.
What is the Ratio of Males per 100 Females in Winterville?
There are 104.63 Males per 100 Females in Winterville.
What is the Ratio of Females per 100 Males in Winterville?
There are 95.57 Females per 100 Males in Winterville.
What is the Median Population Age in Winterville?
Median Population Age in Winterville is 39.6 Years.
What is the Average Family Size in Winterville
Average Family Size in Winterville is 2.8 People.
What is the Average Household Size in Winterville
Average Household Size in Winterville is 2.4 People.
How Large is the Labor Force in Winterville?
There are 5,936 People in the Labor Forcein in Winterville.
What is the Percentage of People in the Labor Force in Winterville?
68.7% of People are in the Labor Force in Winterville.
What is the Unemployment Rate in Winterville?
Unemployment Rate in Winterville is 4.1%.