South Rosemary, NC Map & Demographics
South Rosemary Map
South Rosemary Overview
$23,935
PER CAPITA INCOME
$41,526
AVG FAMILY INCOME
$41,875
AVG HOUSEHOLD INCOME
2.9%
WAGE / INCOME GAP [ % ]
97.1¢/ $1
WAGE / INCOME GAP [ $ ]
0.45
INEQUALITY / GINI INDEX
2,877
TOTAL POPULATION
1,320
MALE POPULATION
1,557
FEMALE POPULATION
84.78
MALES / 100 FEMALES
117.95
FEMALES / 100 MALES
41.9
MEDIAN AGE
2.7
AVG FAMILY SIZE
2.5
AVG HOUSEHOLD SIZE
1,230
LABOR FORCE [ PEOPLE ]
52.8%
PERCENT IN LABOR FORCE
3.5%
UNEMPLOYMENT RATE
Income in South Rosemary
Income Overview in South Rosemary
Per Capita Income in South Rosemary is $23,935, while median incomes of families and households are $41,526 and $41,875 respectively.
| Characteristic | Number | Measure |
| Per Capita Income | 2,877 | $23,935 |
| Median Family Income | 925 | $41,526 |
| Mean Family Income | 925 | $59,995 |
| Median Household Income | 1,170 | $41,875 |
| Mean Household Income | 1,170 | $55,521 |
| Income Deficit | 925 | $0 |
| Wage / Income Gap (%) | 2,877 | 2.88% |
| Wage / Income Gap ($) | 2,877 | 97.12¢ per $1 |
| Gini / Inequality Index | 2,877 | 0.45 |
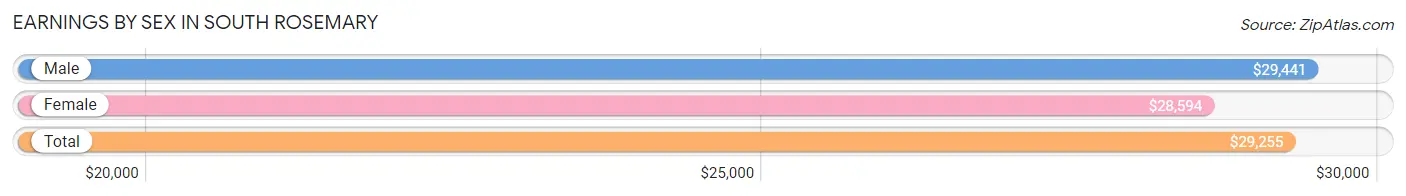
Earnings by Sex in South Rosemary
Average Earnings in South Rosemary are $29,255, $29,441 for men and $28,594 for women, a difference of 2.9%.
| Sex | Number | Average Earnings |
| Male | 522 (43.1%) | $29,441 |
| Female | 689 (56.9%) | $28,594 |
| Total | 1,211 (100.0%) | $29,255 |
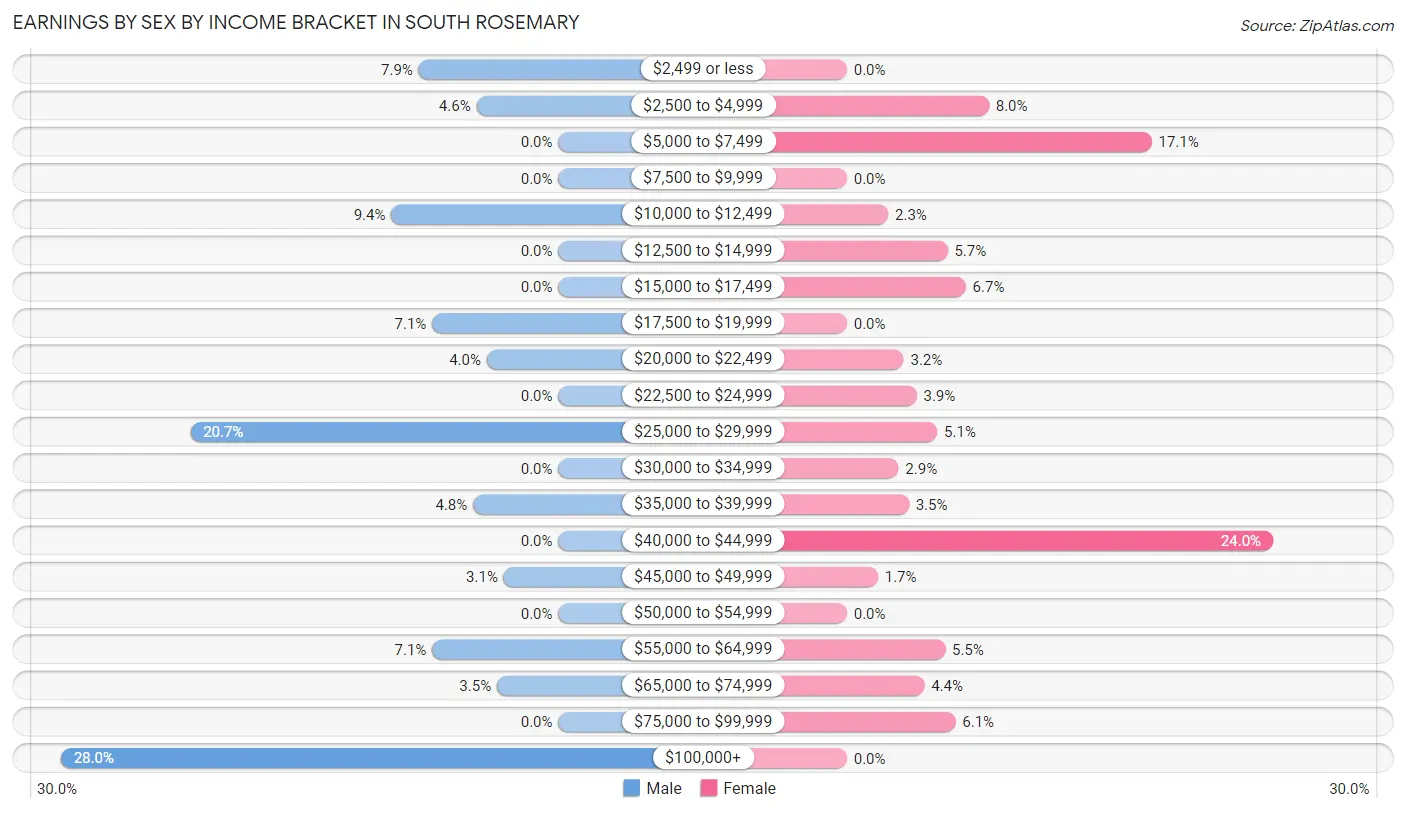
Earnings by Sex by Income Bracket in South Rosemary
The most common earnings brackets in South Rosemary are $100,000+ for men (146 | 28.0%) and $40,000 to $44,999 for women (165 | 23.9%).
| Income | Male | Female |
| $2,499 or less | 41 (7.9%) | 0 (0.0%) |
| $2,500 to $4,999 | 24 (4.6%) | 55 (8.0%) |
| $5,000 to $7,499 | 0 (0.0%) | 118 (17.1%) |
| $7,500 to $9,999 | 0 (0.0%) | 0 (0.0%) |
| $10,000 to $12,499 | 49 (9.4%) | 16 (2.3%) |
| $12,500 to $14,999 | 0 (0.0%) | 39 (5.7%) |
| $15,000 to $17,499 | 0 (0.0%) | 46 (6.7%) |
| $17,500 to $19,999 | 37 (7.1%) | 0 (0.0%) |
| $20,000 to $22,499 | 21 (4.0%) | 22 (3.2%) |
| $22,500 to $24,999 | 0 (0.0%) | 27 (3.9%) |
| $25,000 to $29,999 | 108 (20.7%) | 35 (5.1%) |
| $30,000 to $34,999 | 0 (0.0%) | 20 (2.9%) |
| $35,000 to $39,999 | 25 (4.8%) | 24 (3.5%) |
| $40,000 to $44,999 | 0 (0.0%) | 165 (23.9%) |
| $45,000 to $49,999 | 16 (3.1%) | 12 (1.7%) |
| $50,000 to $54,999 | 0 (0.0%) | 0 (0.0%) |
| $55,000 to $64,999 | 37 (7.1%) | 38 (5.5%) |
| $65,000 to $74,999 | 18 (3.5%) | 30 (4.3%) |
| $75,000 to $99,999 | 0 (0.0%) | 42 (6.1%) |
| $100,000+ | 146 (28.0%) | 0 (0.0%) |
| Total | 522 (100.0%) | 689 (100.0%) |
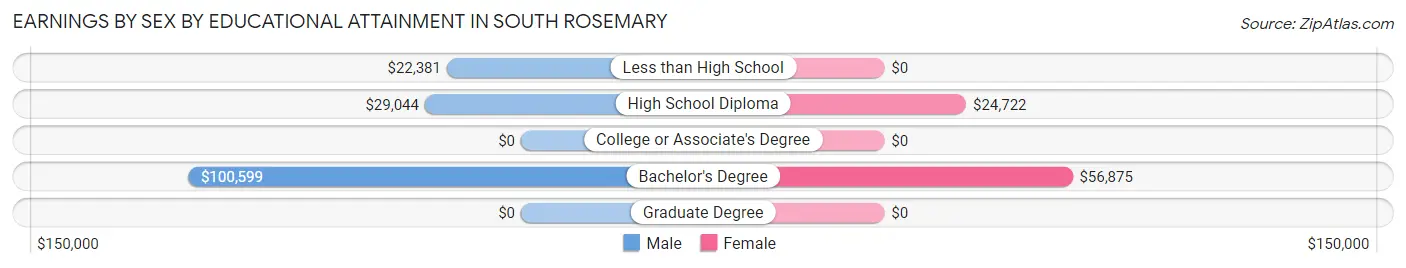
Earnings by Sex by Educational Attainment in South Rosemary
| Educational Attainment | Male Income | Female Income |
| Less than High School | $22,381 | $0 |
| High School Diploma | $29,044 | $24,722 |
| College or Associate's Degree | - | - |
| Bachelor's Degree | $100,599 | $56,875 |
| Graduate Degree | - | - |
| Total | - | - |
Family Income in South Rosemary
Family Income Brackets in South Rosemary
According to the South Rosemary family income data, there are 268 families falling into the $35,000 to $49,999 income range, which is the most common income bracket and makes up 29.0% of all families. Conversely, the $75,000 to $99,999 income bracket is the least frequent group with only 28 families (3.0%) belonging to this category.
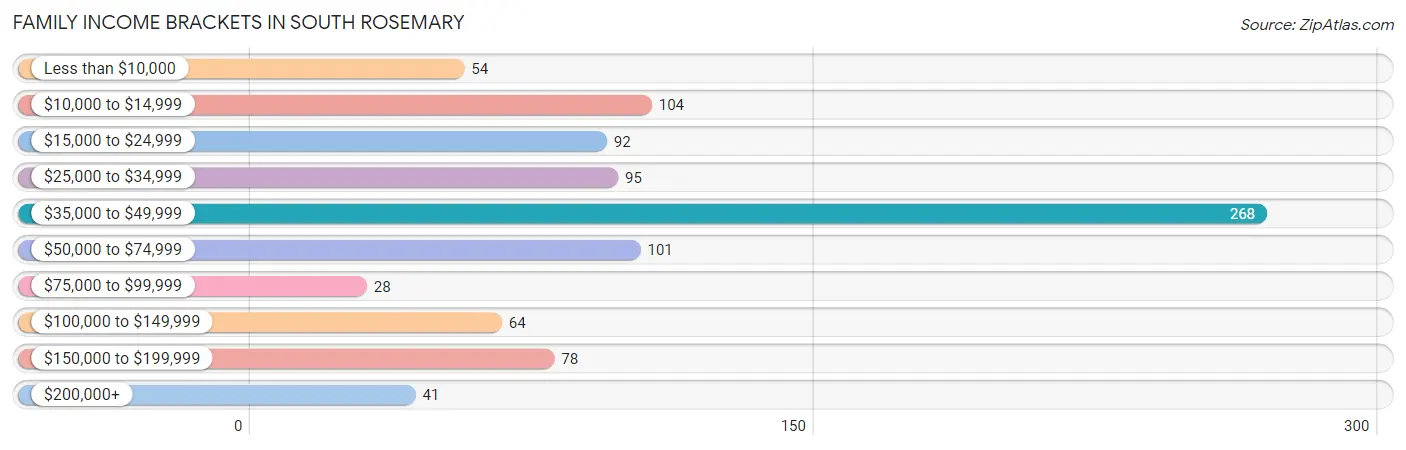
| Income Bracket | # Families | % Families |
| Less than $10,000 | 54 | 5.8% |
| $10,000 to $14,999 | 104 | 11.2% |
| $15,000 to $24,999 | 92 | 9.9% |
| $25,000 to $34,999 | 95 | 10.3% |
| $35,000 to $49,999 | 268 | 29.0% |
| $50,000 to $74,999 | 101 | 10.9% |
| $75,000 to $99,999 | 28 | 3.0% |
| $100,000 to $149,999 | 64 | 6.9% |
| $150,000 to $199,999 | 78 | 8.4% |
| $200,000+ | 41 | 4.4% |
Family Income by Famaliy Size in South Rosemary
2-person families (536 | 58.0%) account for the highest median family income in South Rosemary with $45,000 per family, while 2-person families (536 | 58.0%) have the highest median income of $22,500 per family member.
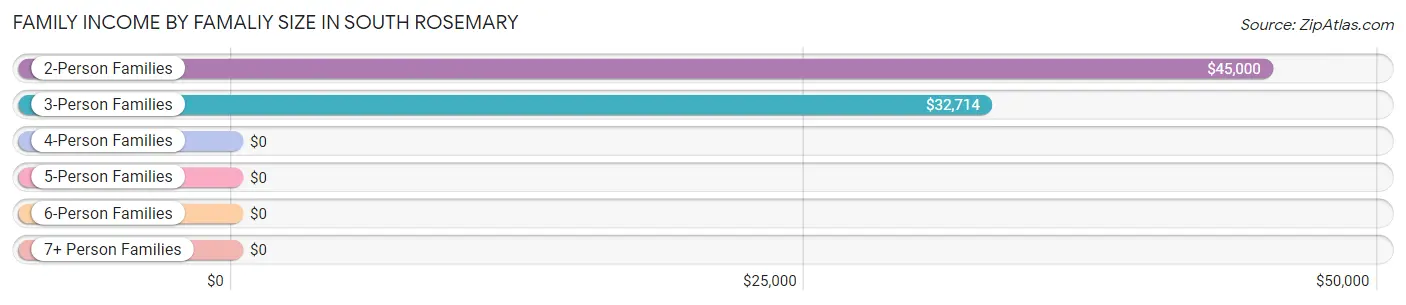
| Income Bracket | # Families | Median Income |
| 2-Person Families | 536 (58.0%) | $45,000 |
| 3-Person Families | 298 (32.2%) | $32,714 |
| 4-Person Families | 91 (9.8%) | $0 |
| 5-Person Families | 0 (0.0%) | $0 |
| 6-Person Families | 0 (0.0%) | $0 |
| 7+ Person Families | 0 (0.0%) | $0 |
| Total | 925 (100.0%) | $41,526 |
Family Income by Number of Earners in South Rosemary
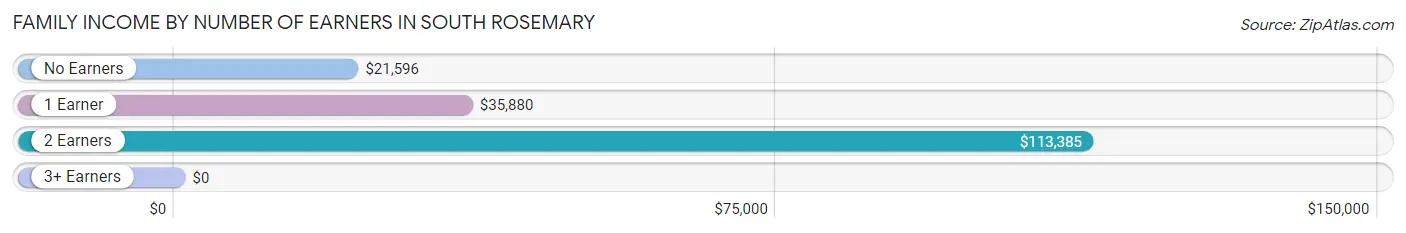
| Number of Earners | # Families | Median Income |
| No Earners | 282 (30.5%) | $21,596 |
| 1 Earner | 324 (35.0%) | $35,880 |
| 2 Earners | 305 (33.0%) | $113,385 |
| 3+ Earners | 14 (1.5%) | $0 |
| Total | 925 (100.0%) | $41,526 |
Household Income in South Rosemary
Household Income Brackets in South Rosemary
With 295 households falling in the category, the $35,000 to $49,999 income range is the most frequent in South Rosemary, accounting for 25.2% of all households. In contrast, only 40 households (3.4%) fall into the $75,000 to $99,999 income bracket, making it the least populous group.
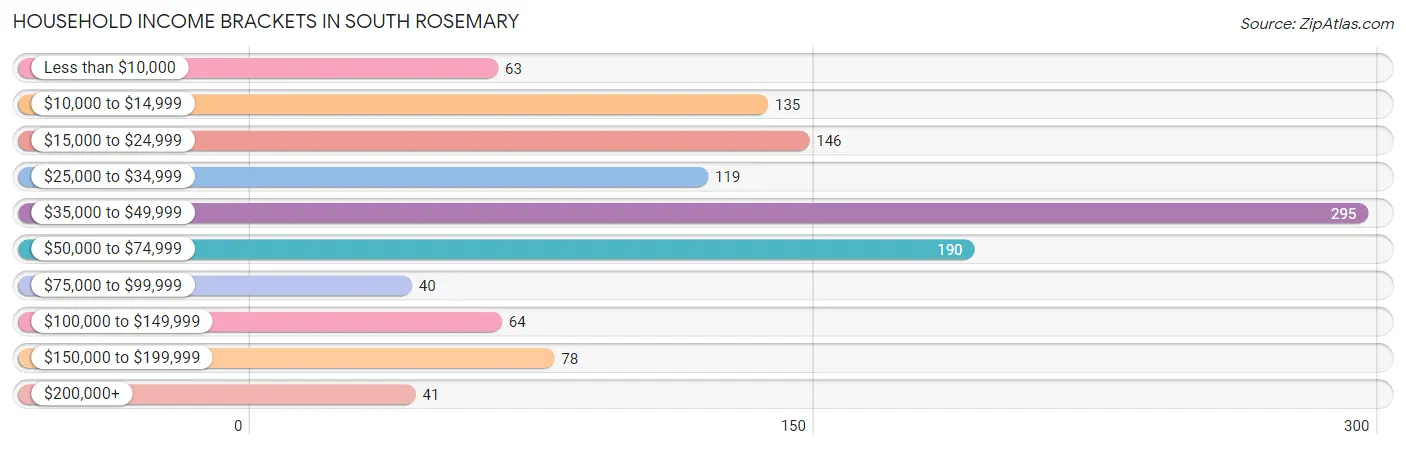
| Income Bracket | # Households | % Households |
| Less than $10,000 | 63 | 5.4% |
| $10,000 to $14,999 | 135 | 11.5% |
| $15,000 to $24,999 | 146 | 12.5% |
| $25,000 to $34,999 | 119 | 10.2% |
| $35,000 to $49,999 | 295 | 25.2% |
| $50,000 to $74,999 | 190 | 16.2% |
| $75,000 to $99,999 | 40 | 3.4% |
| $100,000 to $149,999 | 64 | 5.5% |
| $150,000 to $199,999 | 78 | 6.7% |
| $200,000+ | 41 | 3.5% |
Household Income by Householder Age in South Rosemary
The median household income in South Rosemary is $41,875, with the highest median household income of $45,670 found in the 45 to 64 years age bracket for the primary householder. A total of 469 households (40.1%) fall into this category. Meanwhile, the 15 to 24 years age bracket for the primary householder has the lowest median household income of $0, with 46 households (3.9%) in this group.
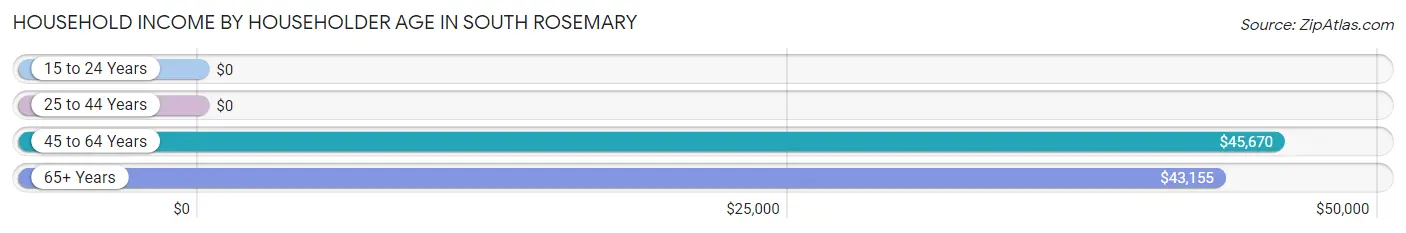
| Income Bracket | # Households | Median Income |
| 15 to 24 Years | 46 (3.9%) | $0 |
| 25 to 44 Years | 254 (21.7%) | $0 |
| 45 to 64 Years | 469 (40.1%) | $45,670 |
| 65+ Years | 401 (34.3%) | $43,155 |
| Total | 1,170 (100.0%) | $41,875 |
Poverty in South Rosemary
Income Below Poverty by Sex and Age in South Rosemary
With 19.9% poverty level for males and 29.4% for females among the residents of South Rosemary, 12 to 14 year old males and 5 year old females are the most vulnerable to poverty, with 44 males (100.0%) and 39 females (100.0%) in their respective age groups living below the poverty level.
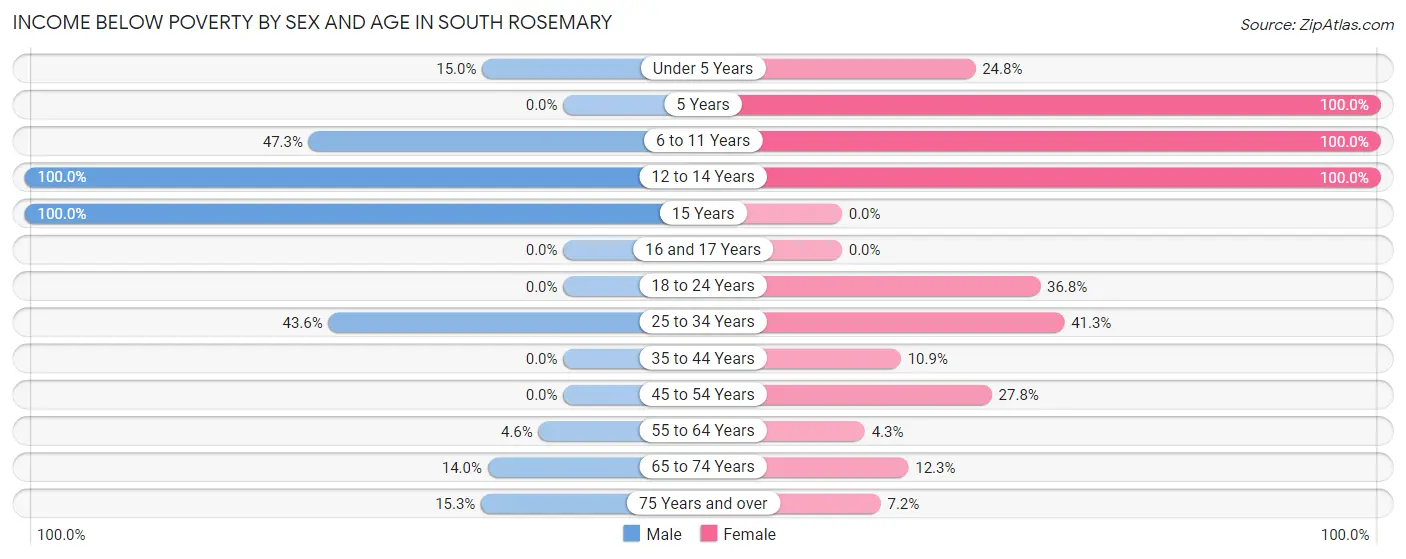
| Age Bracket | Male | Female |
| Under 5 Years | 17 (15.0%) | 27 (24.8%) |
| 5 Years | 0 (0.0%) | 39 (100.0%) |
| 6 to 11 Years | 43 (47.2%) | 57 (100.0%) |
| 12 to 14 Years | 44 (100.0%) | 40 (100.0%) |
| 15 Years | 5 (100.0%) | 0 (0.0%) |
| 16 and 17 Years | 0 (0.0%) | 0 (0.0%) |
| 18 to 24 Years | 0 (0.0%) | 39 (36.8%) |
| 25 to 34 Years | 102 (43.6%) | 123 (41.3%) |
| 35 to 44 Years | 0 (0.0%) | 7 (10.9%) |
| 45 to 54 Years | 0 (0.0%) | 79 (27.8%) |
| 55 to 64 Years | 9 (4.6%) | 9 (4.3%) |
| 65 to 74 Years | 23 (14.0%) | 19 (12.3%) |
| 75 Years and over | 18 (15.2%) | 11 (7.2%) |
| Total | 261 (19.9%) | 450 (29.4%) |
Income Above Poverty by Sex and Age in South Rosemary
According to the poverty statistics in South Rosemary, males aged 18 to 24 years and females aged 15 years are the age groups that are most secure financially, with 100.0% of males and 100.0% of females in these age groups living above the poverty line.
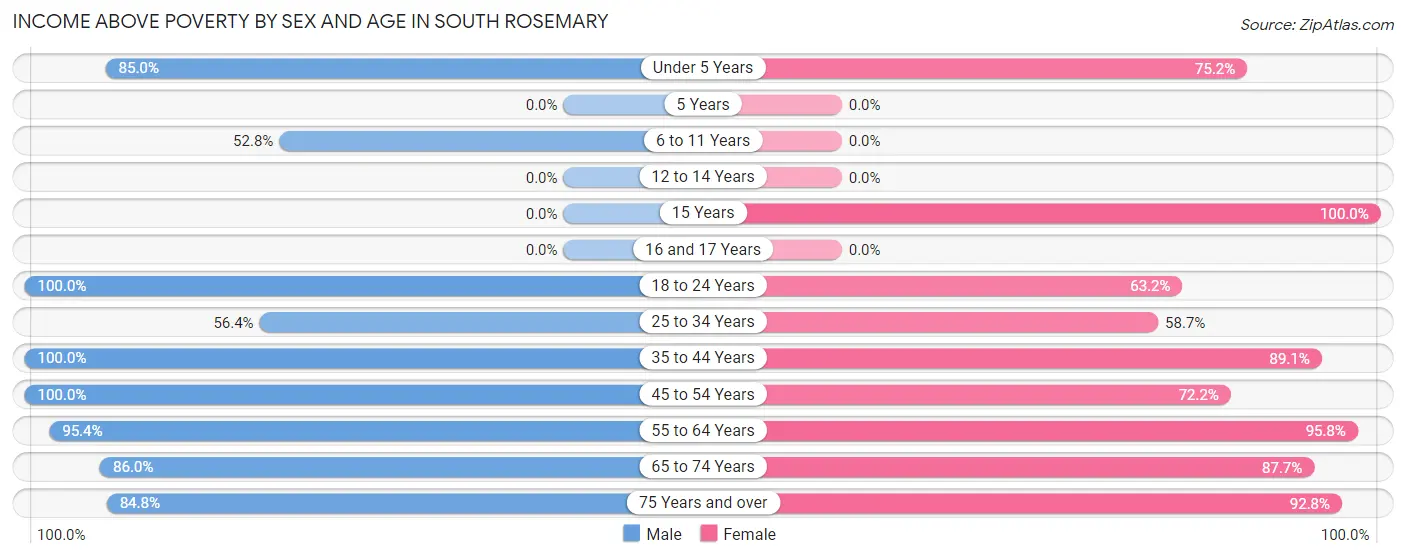
| Age Bracket | Male | Female |
| Under 5 Years | 96 (85.0%) | 82 (75.2%) |
| 5 Years | 0 (0.0%) | 0 (0.0%) |
| 6 to 11 Years | 48 (52.7%) | 0 (0.0%) |
| 12 to 14 Years | 0 (0.0%) | 0 (0.0%) |
| 15 Years | 0 (0.0%) | 15 (100.0%) |
| 16 and 17 Years | 0 (0.0%) | 0 (0.0%) |
| 18 to 24 Years | 24 (100.0%) | 67 (63.2%) |
| 25 to 34 Years | 132 (56.4%) | 175 (58.7%) |
| 35 to 44 Years | 180 (100.0%) | 57 (89.1%) |
| 45 to 54 Years | 143 (100.0%) | 205 (72.2%) |
| 55 to 64 Years | 187 (95.4%) | 203 (95.8%) |
| 65 to 74 Years | 141 (86.0%) | 135 (87.7%) |
| 75 Years and over | 100 (84.8%) | 142 (92.8%) |
| Total | 1,051 (80.1%) | 1,081 (70.6%) |
Income Below Poverty Among Married-Couple Families in South Rosemary
The poverty statistics for married-couple families in South Rosemary show that 4.9% or 23 of the total 474 families live below the poverty line. Families with 1 or 2 children have the highest poverty rate of 18.2%, comprising of 14 families. On the other hand, families with no children have the lowest poverty rate of 2.3%, which includes 9 families.
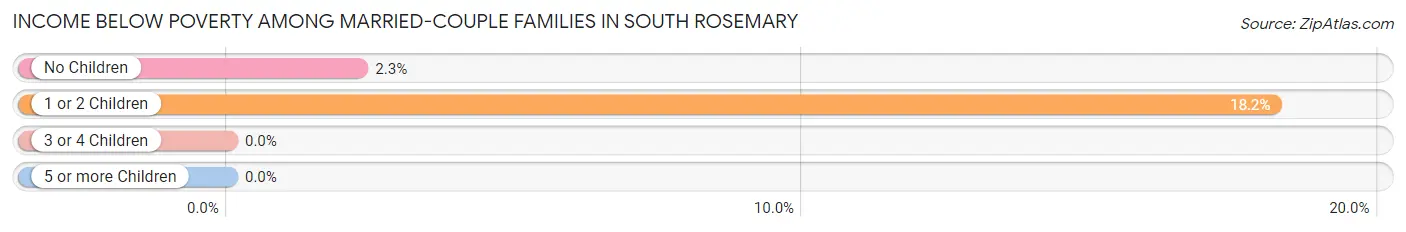
| Children | Above Poverty | Below Poverty |
| No Children | 388 (97.7%) | 9 (2.3%) |
| 1 or 2 Children | 63 (81.8%) | 14 (18.2%) |
| 3 or 4 Children | 0 (0.0%) | 0 (0.0%) |
| 5 or more Children | 0 (0.0%) | 0 (0.0%) |
| Total | 451 (95.2%) | 23 (4.9%) |
Income Below Poverty Among Single-Parent Households in South Rosemary
According to the poverty data in South Rosemary, 45.5% or 25 single-father households and 41.9% or 166 single-mother households are living below the poverty line. Among single-father households, those with 1 or 2 children have the highest poverty rate, with 25 households (100.0%) experiencing poverty. Likewise, among single-mother households, those with 1 or 2 children have the highest poverty rate, with 126 households (59.2%) falling below the poverty line.
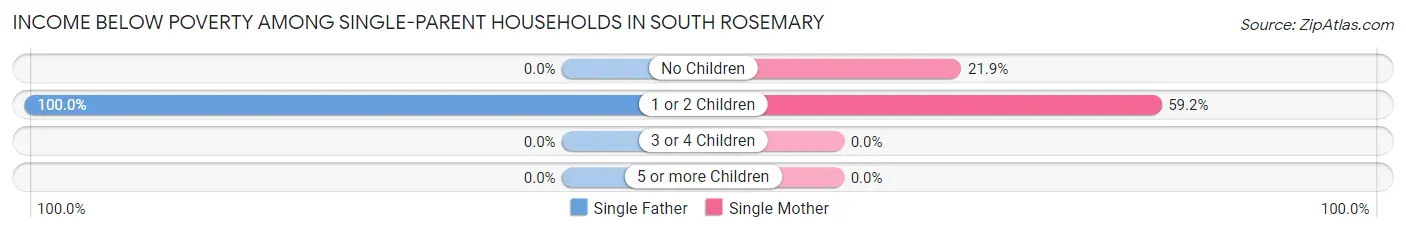
| Children | Single Father | Single Mother |
| No Children | 0 (0.0%) | 40 (21.9%) |
| 1 or 2 Children | 25 (100.0%) | 126 (59.2%) |
| 3 or 4 Children | 0 (0.0%) | 0 (0.0%) |
| 5 or more Children | 0 (0.0%) | 0 (0.0%) |
| Total | 25 (45.5%) | 166 (41.9%) |
Income Below Poverty Among Married-Couple vs Single-Parent Households in South Rosemary
The poverty data for South Rosemary shows that 23 of the married-couple family households (4.9%) and 191 of the single-parent households (42.3%) are living below the poverty level. Within the married-couple family households, those with 1 or 2 children have the highest poverty rate, with 14 households (18.2%) falling below the poverty line. Among the single-parent households, those with 1 or 2 children have the highest poverty rate, with 151 household (63.4%) living below poverty.
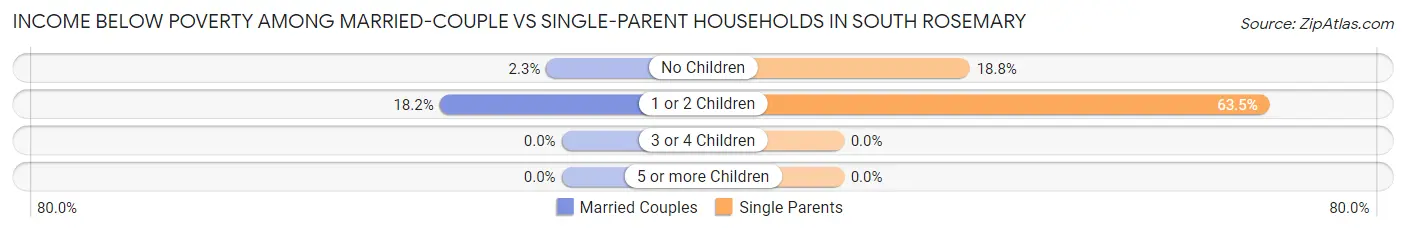
| Children | Married-Couple Families | Single-Parent Households |
| No Children | 9 (2.3%) | 40 (18.8%) |
| 1 or 2 Children | 14 (18.2%) | 151 (63.4%) |
| 3 or 4 Children | 0 (0.0%) | 0 (0.0%) |
| 5 or more Children | 0 (0.0%) | 0 (0.0%) |
| Total | 23 (4.9%) | 191 (42.3%) |
Race in South Rosemary
The most populous races in South Rosemary are Black / African American (2,017 | 70.1%), White / Caucasian (789 | 27.4%), and Two or more Races (71 | 2.5%).
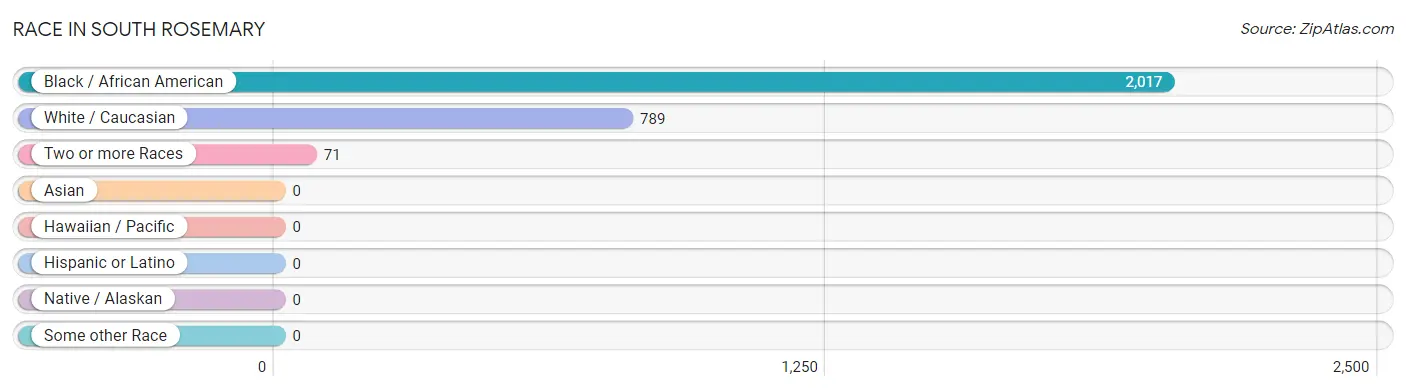
| Race | # Population | % Population |
| Asian | 0 | 0.0% |
| Black / African American | 2,017 | 70.1% |
| Hawaiian / Pacific | 0 | 0.0% |
| Hispanic or Latino | 0 | 0.0% |
| Native / Alaskan | 0 | 0.0% |
| White / Caucasian | 789 | 27.4% |
| Two or more Races | 71 | 2.5% |
| Some other Race | 0 | 0.0% |
| Total | 2,877 | 100.0% |
Ancestry in South Rosemary
The most populous ancestries reported in South Rosemary are American (230 | 8.0%), English (125 | 4.3%), Scotch-Irish (56 | 1.9%), Portuguese (52 | 1.8%), and African (26 | 0.9%), together accounting for 17.0% of all South Rosemary residents.
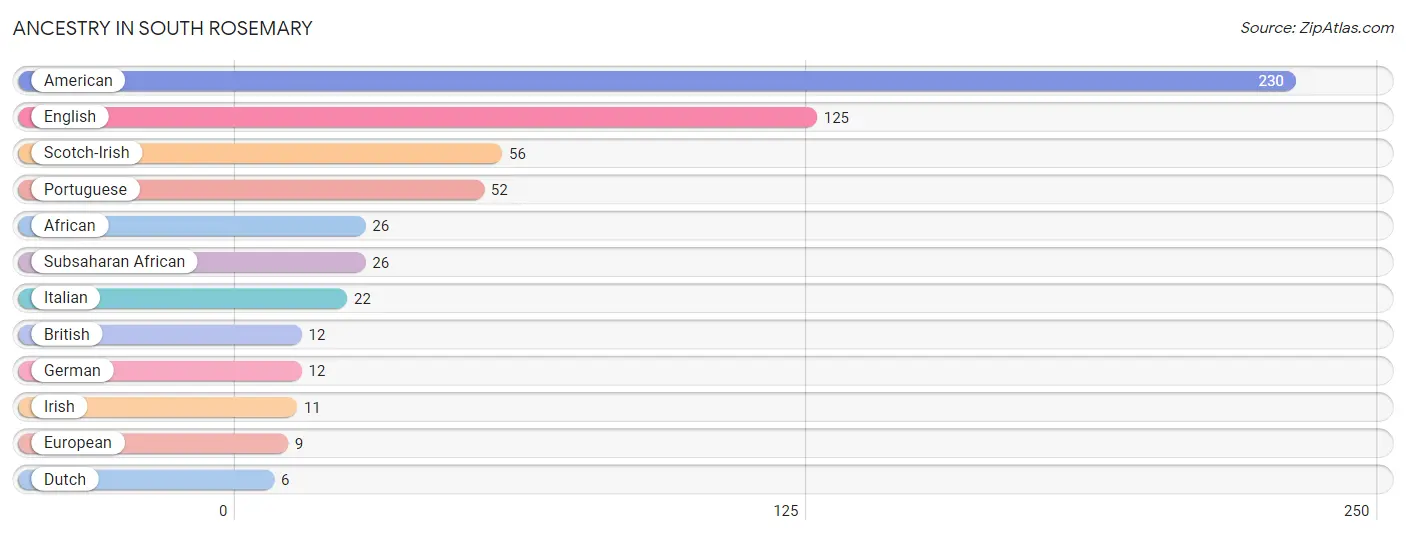
| Ancestry | # Population | % Population |
| African | 26 | 0.9% |
| American | 230 | 8.0% |
| British | 12 | 0.4% |
| Dutch | 6 | 0.2% |
| English | 125 | 4.3% |
| European | 9 | 0.3% |
| German | 12 | 0.4% |
| Irish | 11 | 0.4% |
| Italian | 22 | 0.8% |
| Portuguese | 52 | 1.8% |
| Scotch-Irish | 56 | 1.9% |
| Subsaharan African | 26 | 0.9% | View All 12 Rows |
Immigrants in South Rosemary

| Immigration Origin | # Population | % Population | View All 0 Rows |
Sex and Age in South Rosemary
Sex and Age in South Rosemary
The most populous age groups in South Rosemary are 25 to 29 Years (173 | 13.1%) for men and 25 to 29 Years (161 | 10.3%) for women.
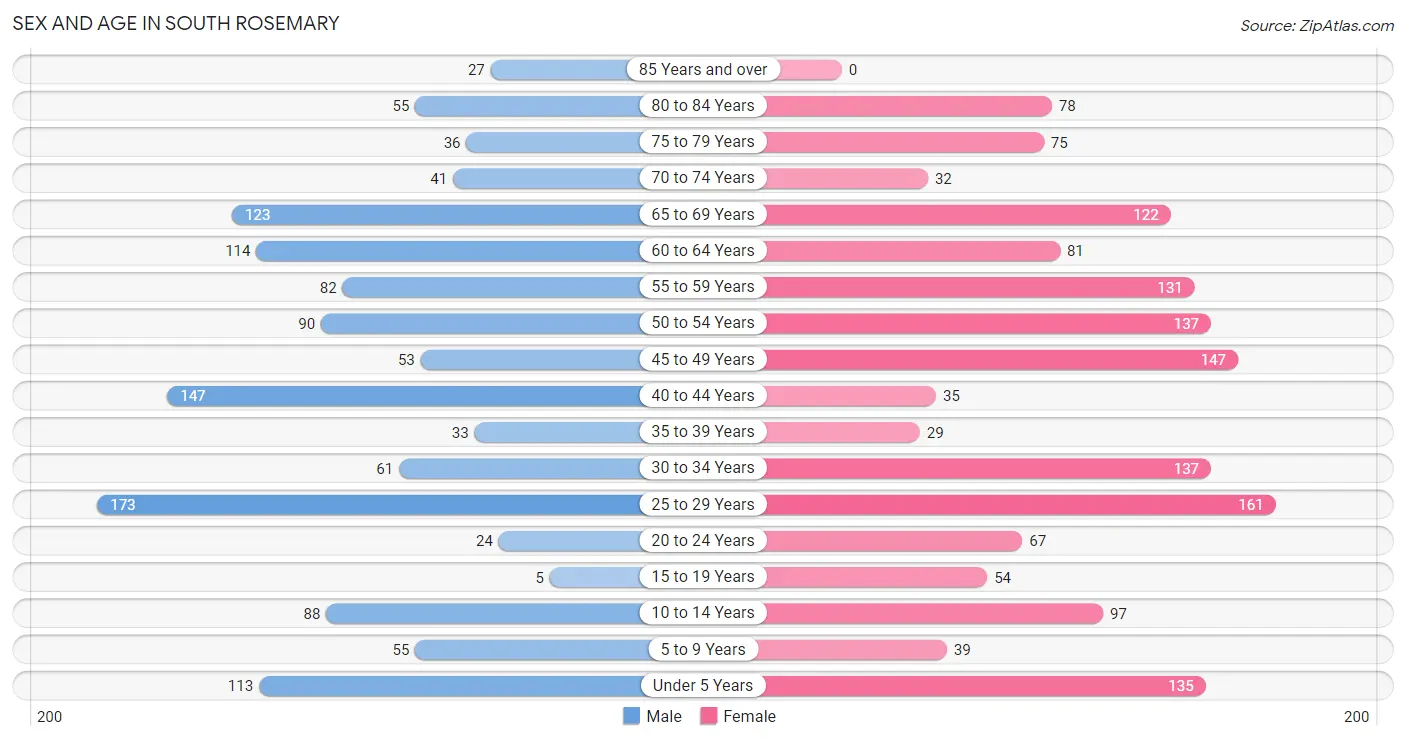
| Age Bracket | Male | Female |
| Under 5 Years | 113 (8.6%) | 135 (8.7%) |
| 5 to 9 Years | 55 (4.2%) | 39 (2.5%) |
| 10 to 14 Years | 88 (6.7%) | 97 (6.2%) |
| 15 to 19 Years | 5 (0.4%) | 54 (3.5%) |
| 20 to 24 Years | 24 (1.8%) | 67 (4.3%) |
| 25 to 29 Years | 173 (13.1%) | 161 (10.3%) |
| 30 to 34 Years | 61 (4.6%) | 137 (8.8%) |
| 35 to 39 Years | 33 (2.5%) | 29 (1.9%) |
| 40 to 44 Years | 147 (11.1%) | 35 (2.2%) |
| 45 to 49 Years | 53 (4.0%) | 147 (9.4%) |
| 50 to 54 Years | 90 (6.8%) | 137 (8.8%) |
| 55 to 59 Years | 82 (6.2%) | 131 (8.4%) |
| 60 to 64 Years | 114 (8.6%) | 81 (5.2%) |
| 65 to 69 Years | 123 (9.3%) | 122 (7.8%) |
| 70 to 74 Years | 41 (3.1%) | 32 (2.1%) |
| 75 to 79 Years | 36 (2.7%) | 75 (4.8%) |
| 80 to 84 Years | 55 (4.2%) | 78 (5.0%) |
| 85 Years and over | 27 (2.1%) | 0 (0.0%) |
| Total | 1,320 (100.0%) | 1,557 (100.0%) |
Families and Households in South Rosemary
Median Family Size in South Rosemary
The median family size in South Rosemary is 2.68 persons per family, with single female/mother families (396 | 42.8%) accounting for the largest median family size of 3.05 persons per family. On the other hand, single male/father families (55 | 5.9%) represent the smallest median family size with 2.00 persons per family.
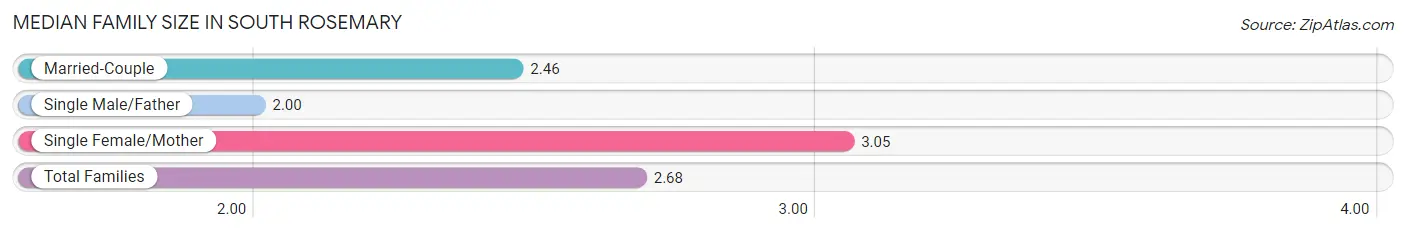
| Family Type | # Families | Family Size |
| Married-Couple | 474 (51.2%) | 2.46 |
| Single Male/Father | 55 (5.9%) | 2.00 |
| Single Female/Mother | 396 (42.8%) | 3.05 |
| Total Families | 925 (100.0%) | 2.68 |
Median Household Size in South Rosemary
The median household size in South Rosemary is 2.46 persons per household, with single female/mother households (396 | 33.9%) accounting for the largest median household size of 3.17 persons per household. non-family households (245 | 20.9%) represent the smallest median household size with 1.14 persons per household.
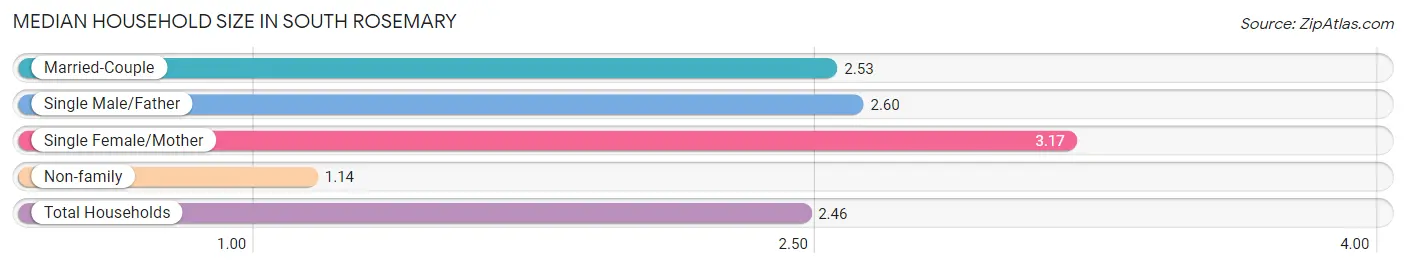
| Household Type | # Households | Household Size |
| Married-Couple | 474 (40.5%) | 2.53 |
| Single Male/Father | 55 (4.7%) | 2.60 |
| Single Female/Mother | 396 (33.9%) | 3.17 |
| Non-family | 245 (20.9%) | 1.14 |
| Total Households | 1,170 (100.0%) | 2.46 |
Household Size by Marriage Status in South Rosemary
Out of a total of 1,170 households in South Rosemary, 925 (79.1%) are family households, while 245 (20.9%) are nonfamily households. The most numerous type of family households are 2-person households, comprising 479, and the most common type of nonfamily households are 1-person households, comprising 215.
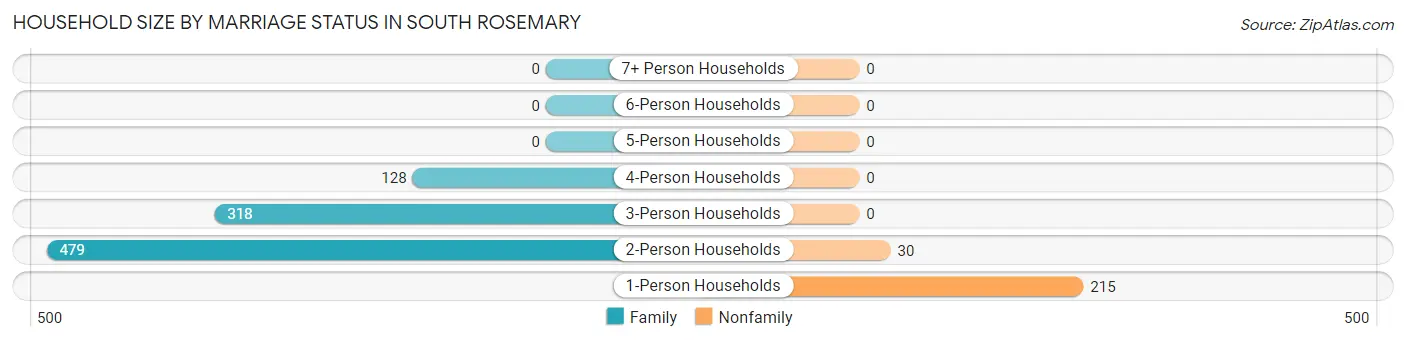
| Household Size | Family Households | Nonfamily Households |
| 1-Person Households | - | 215 (18.4%) |
| 2-Person Households | 479 (40.9%) | 30 (2.6%) |
| 3-Person Households | 318 (27.2%) | 0 (0.0%) |
| 4-Person Households | 128 (10.9%) | 0 (0.0%) |
| 5-Person Households | 0 (0.0%) | 0 (0.0%) |
| 6-Person Households | 0 (0.0%) | 0 (0.0%) |
| 7+ Person Households | 0 (0.0%) | 0 (0.0%) |
| Total | 925 (79.1%) | 245 (20.9%) |
Female Fertility in South Rosemary
Fertility by Age in South Rosemary
Average fertility rate in South Rosemary is 33.0 births per 1,000 women. Women in the age bracket of 20 to 34 years have the highest fertility rate with 58.0 births per 1,000 women. Women in the age bracket of 20 to 34 years acount for 100.0% of all women with births.
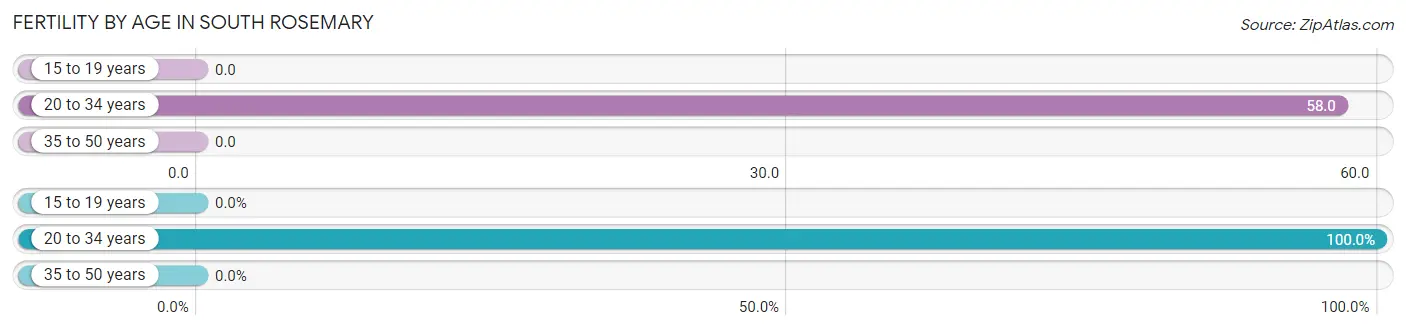
| Age Bracket | Women with Births | Births / 1,000 Women |
| 15 to 19 years | 0 (0.0%) | 0.0 |
| 20 to 34 years | 21 (100.0%) | 58.0 |
| 35 to 50 years | 0 (0.0%) | 0.0 |
| Total | 21 (100.0%) | 33.0 |
Fertility by Age by Marriage Status in South Rosemary
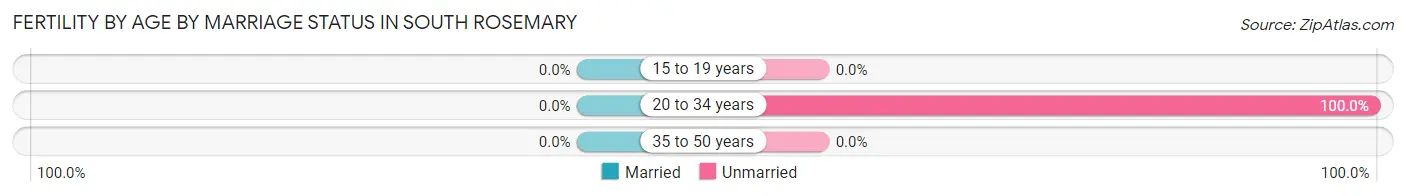
| Age Bracket | Married | Unmarried |
| 15 to 19 years | 0 (0.0%) | 0 (0.0%) |
| 20 to 34 years | 0 (0.0%) | 21 (100.0%) |
| 35 to 50 years | 0 (0.0%) | 0 (0.0%) |
| Total | 0 (0.0%) | 21 (100.0%) |
Fertility by Education in South Rosemary
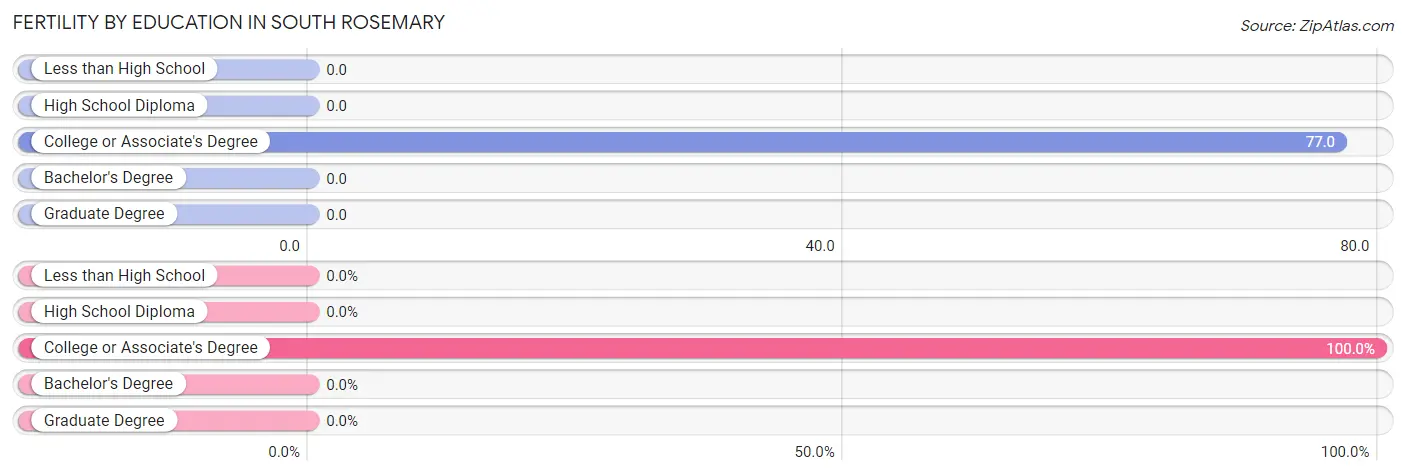
| Educational Attainment | Women with Births | Births / 1,000 Women |
| Less than High School | 0 (0.0%) | 0.0 |
| High School Diploma | 0 (0.0%) | 0.0 |
| College or Associate's Degree | 21 (100.0%) | 77.0 |
| Bachelor's Degree | 0 (0.0%) | 0.0 |
| Graduate Degree | 0 (0.0%) | 0.0 |
| Total | 21 (100.0%) | 33.0 |
Fertility by Education by Marriage Status in South Rosemary
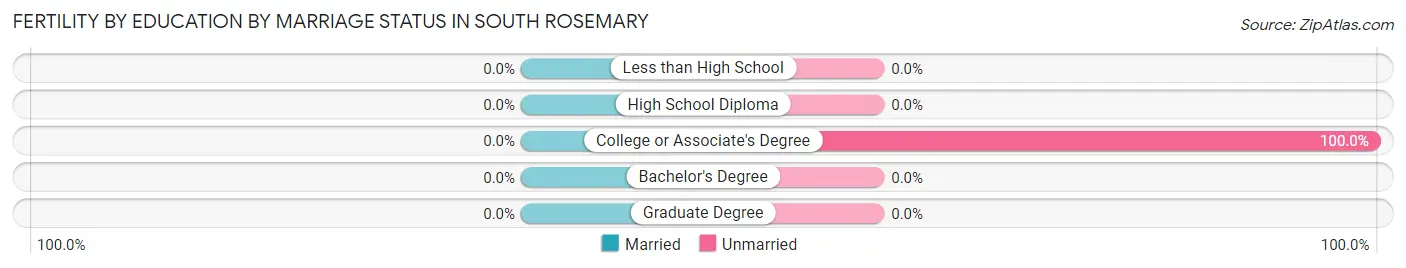
| Educational Attainment | Married | Unmarried |
| Less than High School | 0 (0.0%) | 0 (0.0%) |
| High School Diploma | 0 (0.0%) | 0 (0.0%) |
| College or Associate's Degree | 0 (0.0%) | 21 (100.0%) |
| Bachelor's Degree | 0 (0.0%) | 0 (0.0%) |
| Graduate Degree | 0 (0.0%) | 0 (0.0%) |
| Total | 0 (0.0%) | 21 (100.0%) |
Employment Characteristics in South Rosemary
Employment by Class of Employer in South Rosemary
Among the 1,187 employed individuals in South Rosemary, private company employees (668 | 56.3%), state government employees (269 | 22.7%), and local government employees (103 | 8.7%) make up the most common classes of employment.
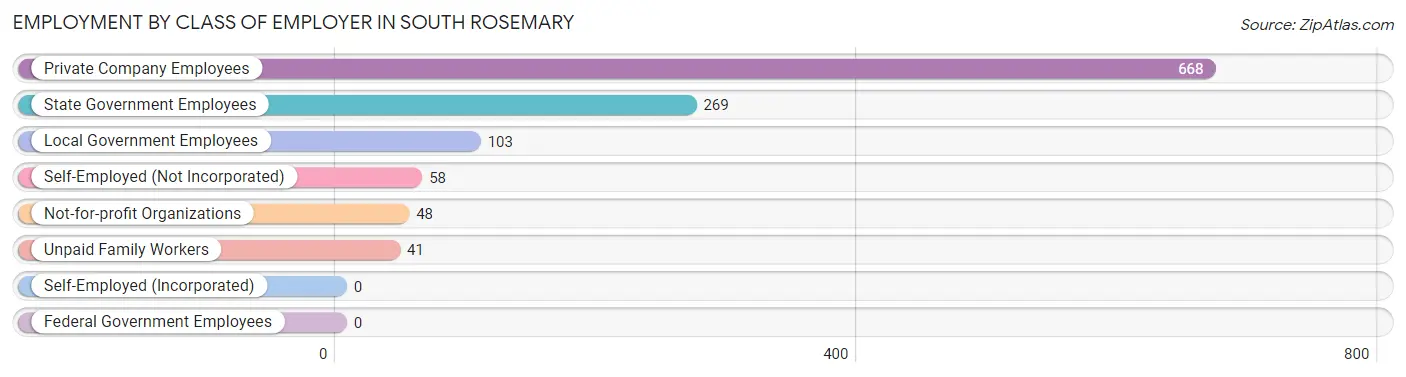
| Employer Class | # Employees | % Employees |
| Private Company Employees | 668 | 56.3% |
| Self-Employed (Incorporated) | 0 | 0.0% |
| Self-Employed (Not Incorporated) | 58 | 4.9% |
| Not-for-profit Organizations | 48 | 4.0% |
| Local Government Employees | 103 | 8.7% |
| State Government Employees | 269 | 22.7% |
| Federal Government Employees | 0 | 0.0% |
| Unpaid Family Workers | 41 | 3.5% |
| Total | 1,187 | 100.0% |
Employment Status by Age in South Rosemary
According to the labor force statistics for South Rosemary, out of the total population over 16 years of age (2,330), 52.8% or 1,230 individuals are in the labor force, with 3.5% or 43 of them unemployed. The age group with the highest labor force participation rate is 30 to 34 years, with 100.0% or 198 individuals in the labor force. Within the labor force, the 30 to 34 years age range has the highest percentage of unemployed individuals, with 21.7% or 43 of them being unemployed.
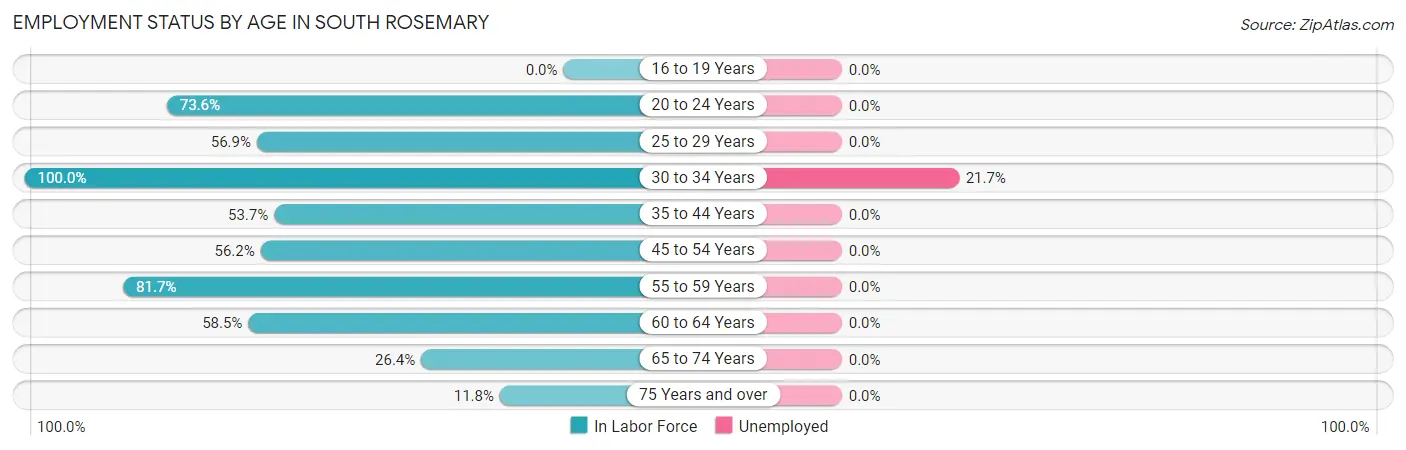
| Age Bracket | In Labor Force | Unemployed |
| 16 to 19 Years | 0 (0.0%) | 0 (0.0%) |
| 20 to 24 Years | 67 (73.6%) | 0 (0.0%) |
| 25 to 29 Years | 190 (56.9%) | 0 (0.0%) |
| 30 to 34 Years | 198 (100.0%) | 43 (21.7%) |
| 35 to 44 Years | 131 (53.7%) | 0 (0.0%) |
| 45 to 54 Years | 240 (56.2%) | 0 (0.0%) |
| 55 to 59 Years | 174 (81.7%) | 0 (0.0%) |
| 60 to 64 Years | 114 (58.5%) | 0 (0.0%) |
| 65 to 74 Years | 84 (26.4%) | 0 (0.0%) |
| 75 Years and over | 32 (11.8%) | 0 (0.0%) |
| Total | 1,230 (52.8%) | 43 (3.5%) |
Employment Status by Educational Attainment in South Rosemary
According to labor force statistics for South Rosemary, 65.0% of individuals (1,047) out of the total population between 25 and 64 years of age (1,611) are in the labor force, with 4.1% or 43 of them being unemployed. The group with the highest labor force participation rate are those with the educational attainment of college / associate degree, with 91.7% or 463 individuals in the labor force. Within the labor force, individuals with college / associate degree education have the highest percentage of unemployment, with 9.3% or 43 of them being unemployed.
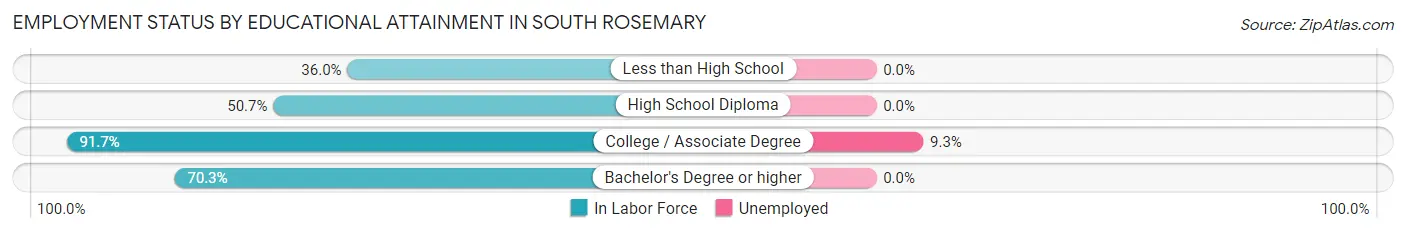
| Educational Attainment | In Labor Force | Unemployed |
| Less than High School | 80 (36.0%) | 0 (0.0%) |
| High School Diploma | 305 (50.7%) | 0 (0.0%) |
| College / Associate Degree | 463 (91.7%) | 47 (9.3%) |
| Bachelor's Degree or higher | 199 (70.3%) | 0 (0.0%) |
| Total | 1,047 (65.0%) | 66 (4.1%) |
Employment Occupations by Sex in South Rosemary
Management, Business, Science and Arts Occupations
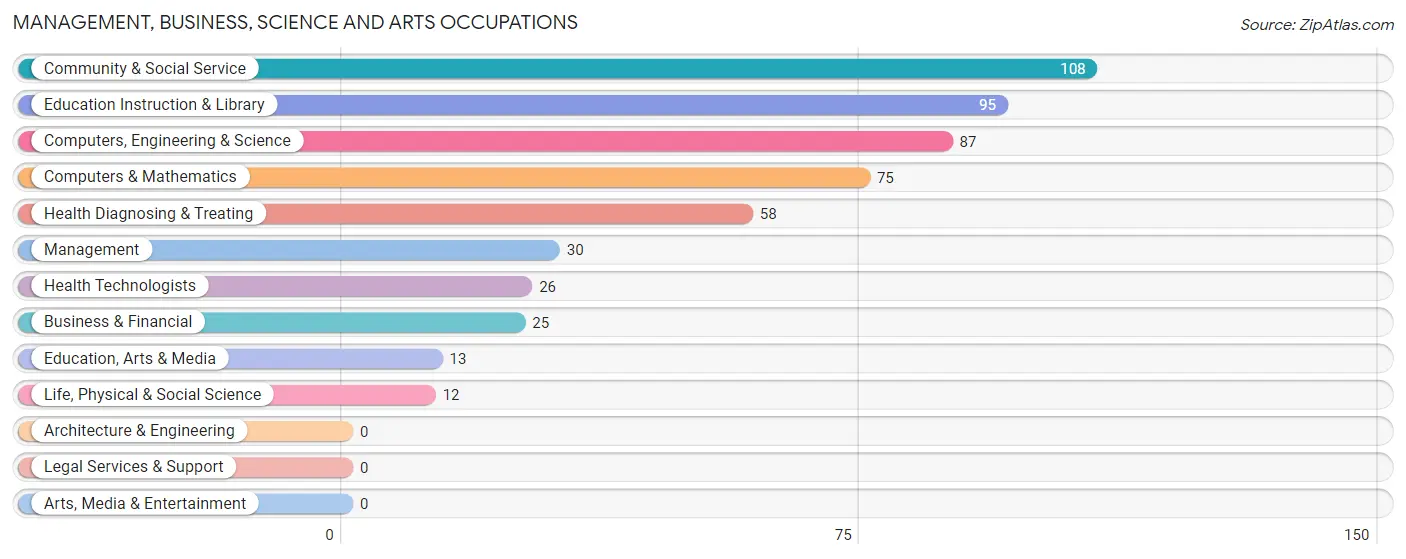
The most common Management, Business, Science and Arts occupations in South Rosemary are Community & Social Service (108 | 9.1%), Education Instruction & Library (95 | 8.0%), Computers, Engineering & Science (87 | 7.3%), Computers & Mathematics (75 | 6.3%), and Health Diagnosing & Treating (58 | 4.9%).
Management, Business, Science and Arts Occupations by Sex
Within the Management, Business, Science and Arts occupations in South Rosemary, the most male-oriented occupations are Education Instruction & Library (100.0%), Community & Social Service (88.0%), and Computers & Mathematics (49.3%), while the most female-oriented occupations are Business & Financial (100.0%), Life, Physical & Social Science (100.0%), and Education, Arts & Media (100.0%).
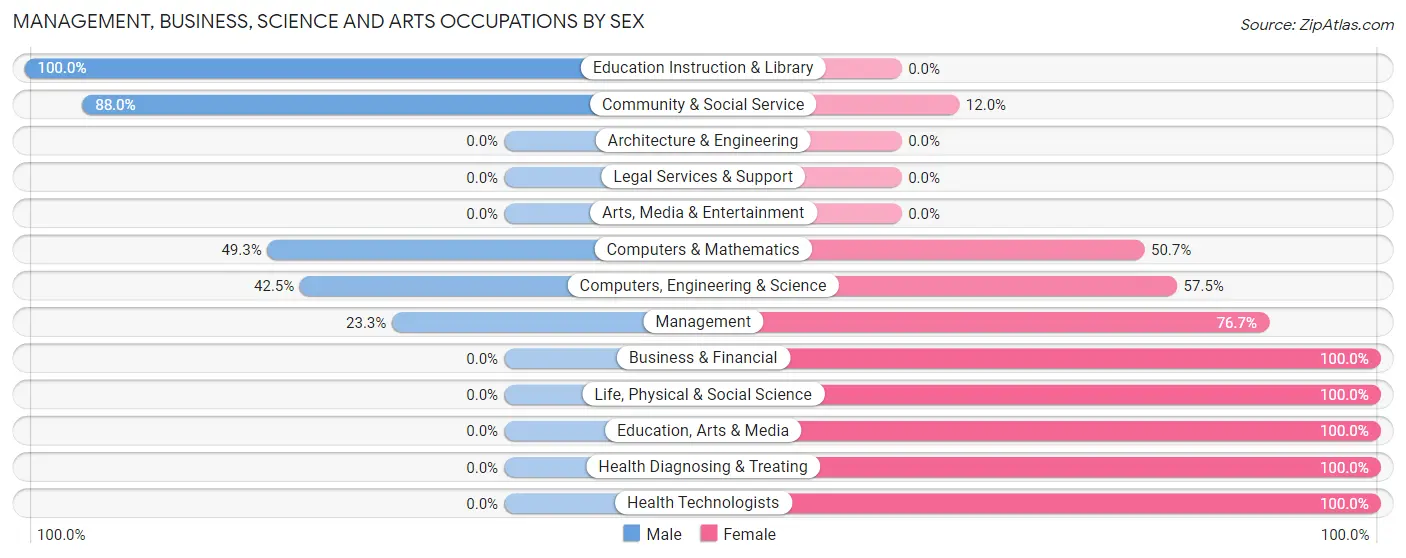
| Occupation | Male | Female |
| Management | 7 (23.3%) | 23 (76.7%) |
| Business & Financial | 0 (0.0%) | 25 (100.0%) |
| Computers, Engineering & Science | 37 (42.5%) | 50 (57.5%) |
| Computers & Mathematics | 37 (49.3%) | 38 (50.7%) |
| Architecture & Engineering | 0 (0.0%) | 0 (0.0%) |
| Life, Physical & Social Science | 0 (0.0%) | 12 (100.0%) |
| Community & Social Service | 95 (88.0%) | 13 (12.0%) |
| Education, Arts & Media | 0 (0.0%) | 13 (100.0%) |
| Legal Services & Support | 0 (0.0%) | 0 (0.0%) |
| Education Instruction & Library | 95 (100.0%) | 0 (0.0%) |
| Arts, Media & Entertainment | 0 (0.0%) | 0 (0.0%) |
| Health Diagnosing & Treating | 0 (0.0%) | 58 (100.0%) |
| Health Technologists | 0 (0.0%) | 26 (100.0%) |
| Total (Category) | 139 (45.1%) | 169 (54.9%) |
| Total (Overall) | 498 (41.9%) | 689 (58.1%) |
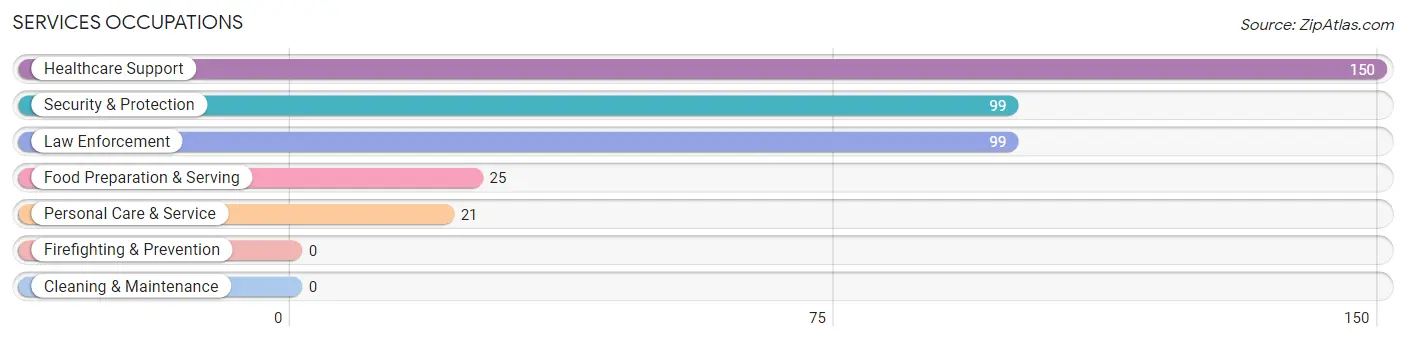
Services Occupations
The most common Services occupations in South Rosemary are Healthcare Support (150 | 12.6%), Security & Protection (99 | 8.3%), Law Enforcement (99 | 8.3%), Food Preparation & Serving (25 | 2.1%), and Personal Care & Service (21 | 1.8%).
Services Occupations by Sex
Within the Services occupations in South Rosemary, the most male-oriented occupations are Food Preparation & Serving (100.0%), and Personal Care & Service (100.0%), while the most female-oriented occupations are Healthcare Support (100.0%), Security & Protection (100.0%), and Law Enforcement (100.0%).
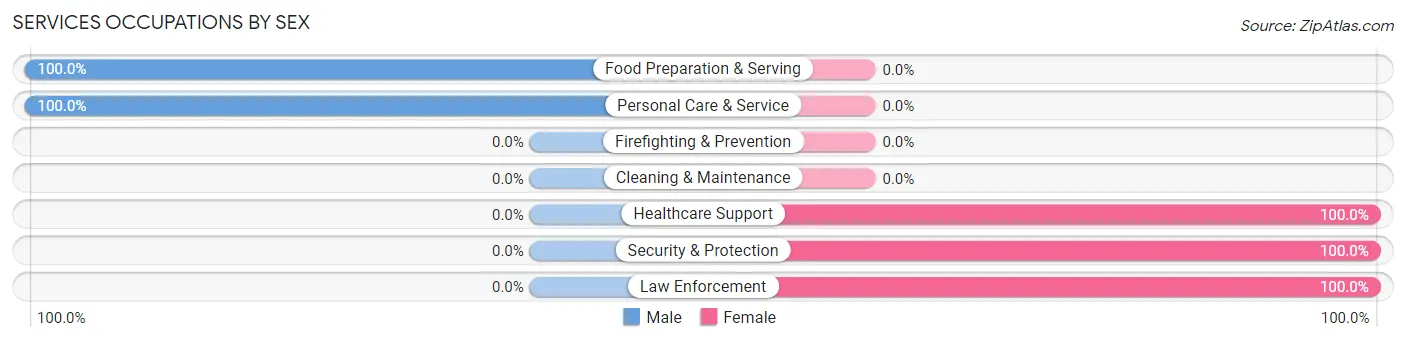
| Occupation | Male | Female |
| Healthcare Support | 0 (0.0%) | 150 (100.0%) |
| Security & Protection | 0 (0.0%) | 99 (100.0%) |
| Firefighting & Prevention | 0 (0.0%) | 0 (0.0%) |
| Law Enforcement | 0 (0.0%) | 99 (100.0%) |
| Food Preparation & Serving | 25 (100.0%) | 0 (0.0%) |
| Cleaning & Maintenance | 0 (0.0%) | 0 (0.0%) |
| Personal Care & Service | 21 (100.0%) | 0 (0.0%) |
| Total (Category) | 46 (15.6%) | 249 (84.4%) |
| Total (Overall) | 498 (41.9%) | 689 (58.1%) |
Sales and Office Occupations
The most common Sales and Office occupations in South Rosemary are Office & Administration (138 | 11.6%), and Sales & Related (109 | 9.2%).
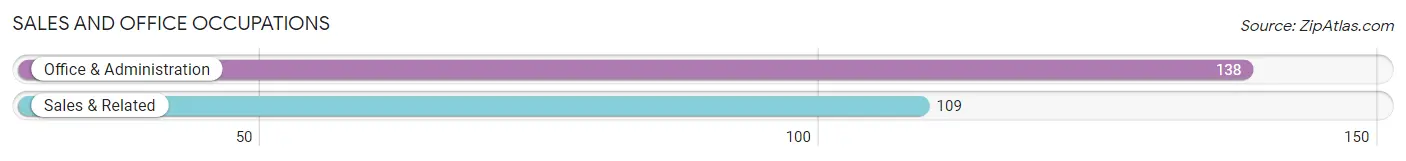
Sales and Office Occupations by Sex
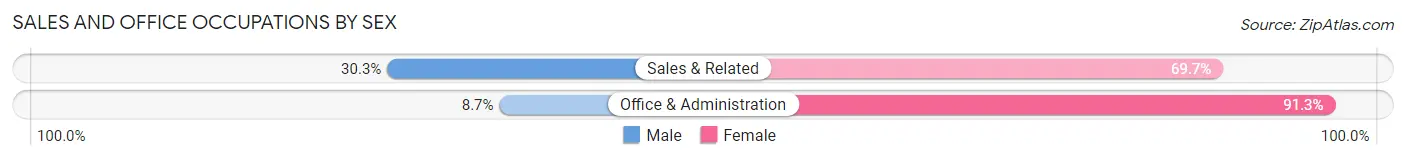
| Occupation | Male | Female |
| Sales & Related | 33 (30.3%) | 76 (69.7%) |
| Office & Administration | 12 (8.7%) | 126 (91.3%) |
| Total (Category) | 45 (18.2%) | 202 (81.8%) |
| Total (Overall) | 498 (41.9%) | 689 (58.1%) |
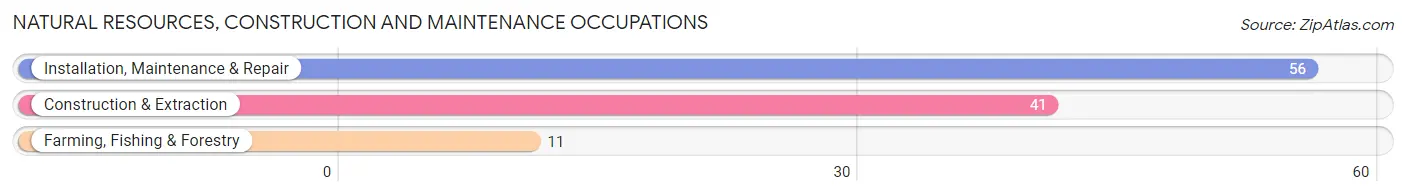
Natural Resources, Construction and Maintenance Occupations
The most common Natural Resources, Construction and Maintenance occupations in South Rosemary are Installation, Maintenance & Repair (56 | 4.7%), Construction & Extraction (41 | 3.5%), and Farming, Fishing & Forestry (11 | 0.9%).
Natural Resources, Construction and Maintenance Occupations by Sex
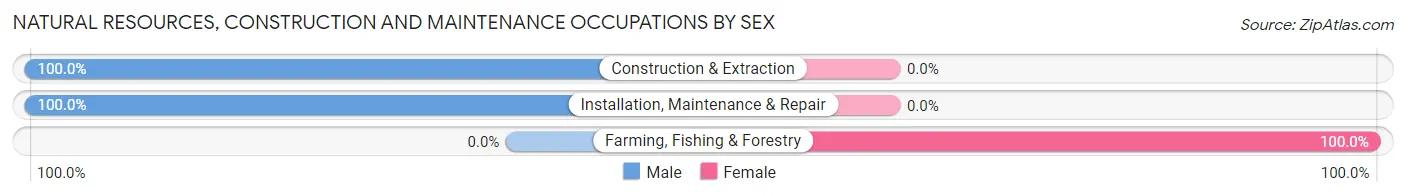
| Occupation | Male | Female |
| Farming, Fishing & Forestry | 0 (0.0%) | 11 (100.0%) |
| Construction & Extraction | 41 (100.0%) | 0 (0.0%) |
| Installation, Maintenance & Repair | 56 (100.0%) | 0 (0.0%) |
| Total (Category) | 97 (89.8%) | 11 (10.2%) |
| Total (Overall) | 498 (41.9%) | 689 (58.1%) |
Production, Transportation and Moving Occupations
The most common Production, Transportation and Moving occupations in South Rosemary are Transportation (167 | 14.1%), Production (51 | 4.3%), and Material Moving (11 | 0.9%).
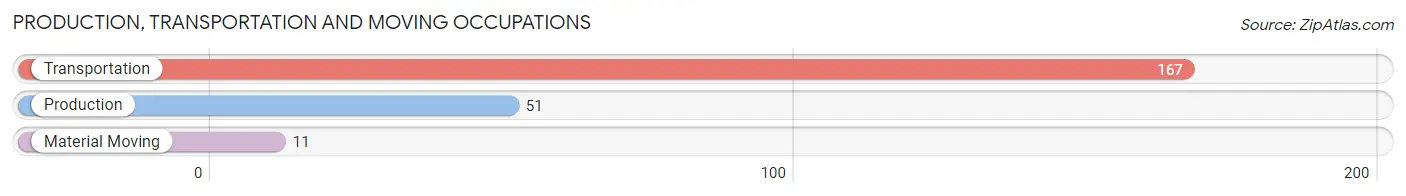
Production, Transportation and Moving Occupations by Sex
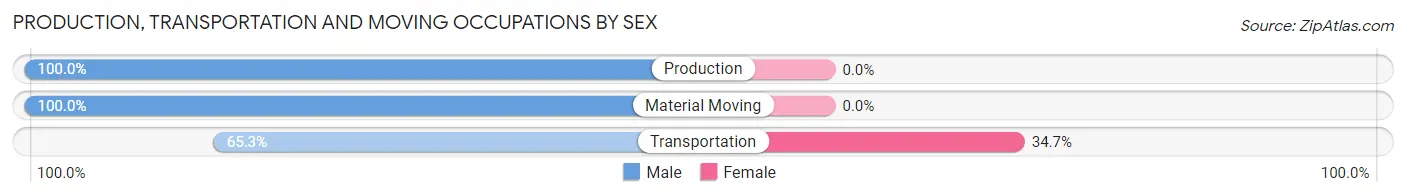
| Occupation | Male | Female |
| Production | 51 (100.0%) | 0 (0.0%) |
| Transportation | 109 (65.3%) | 58 (34.7%) |
| Material Moving | 11 (100.0%) | 0 (0.0%) |
| Total (Category) | 171 (74.7%) | 58 (25.3%) |
| Total (Overall) | 498 (41.9%) | 689 (58.1%) |
Employment Industries by Sex in South Rosemary
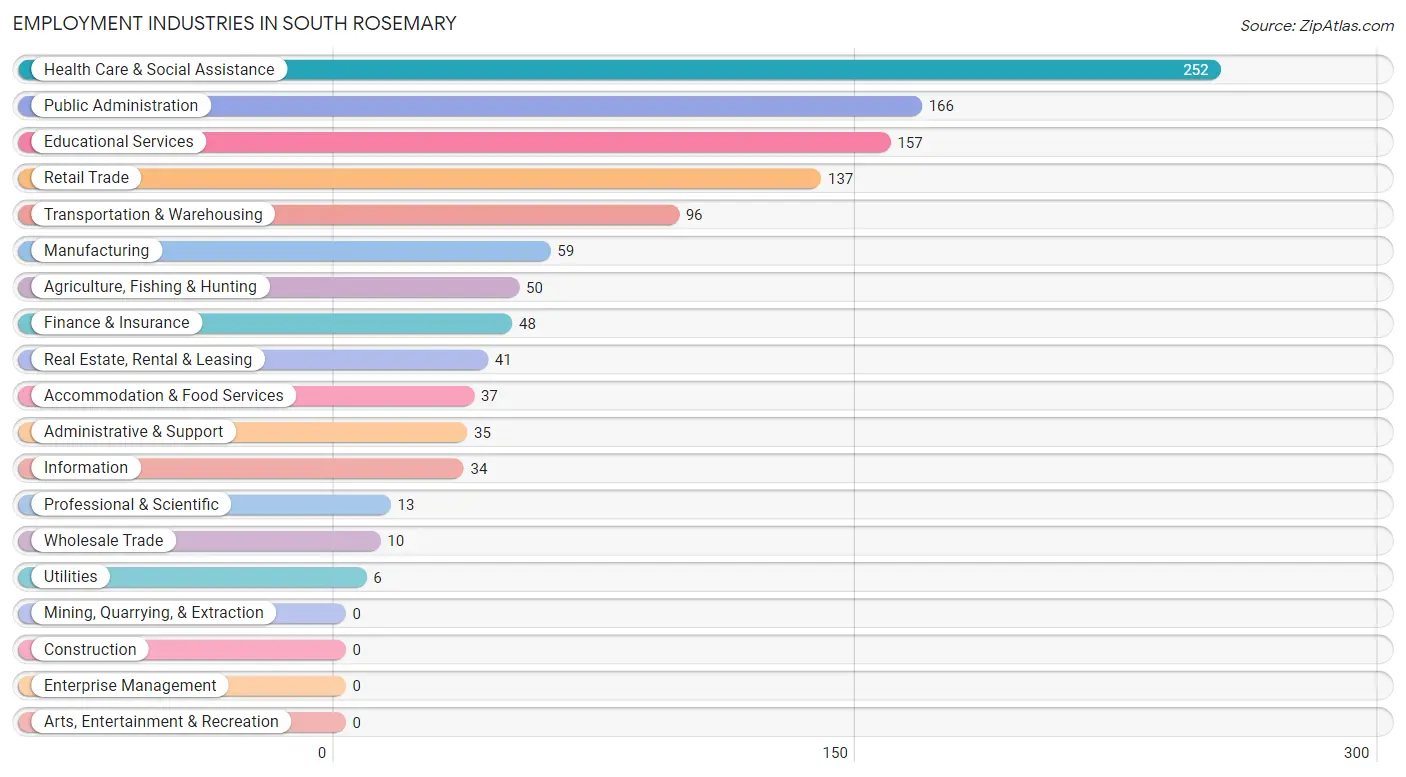
Employment Industries in South Rosemary
The major employment industries in South Rosemary include Health Care & Social Assistance (252 | 21.2%), Public Administration (166 | 14.0%), Educational Services (157 | 13.2%), Retail Trade (137 | 11.5%), and Transportation & Warehousing (96 | 8.1%).
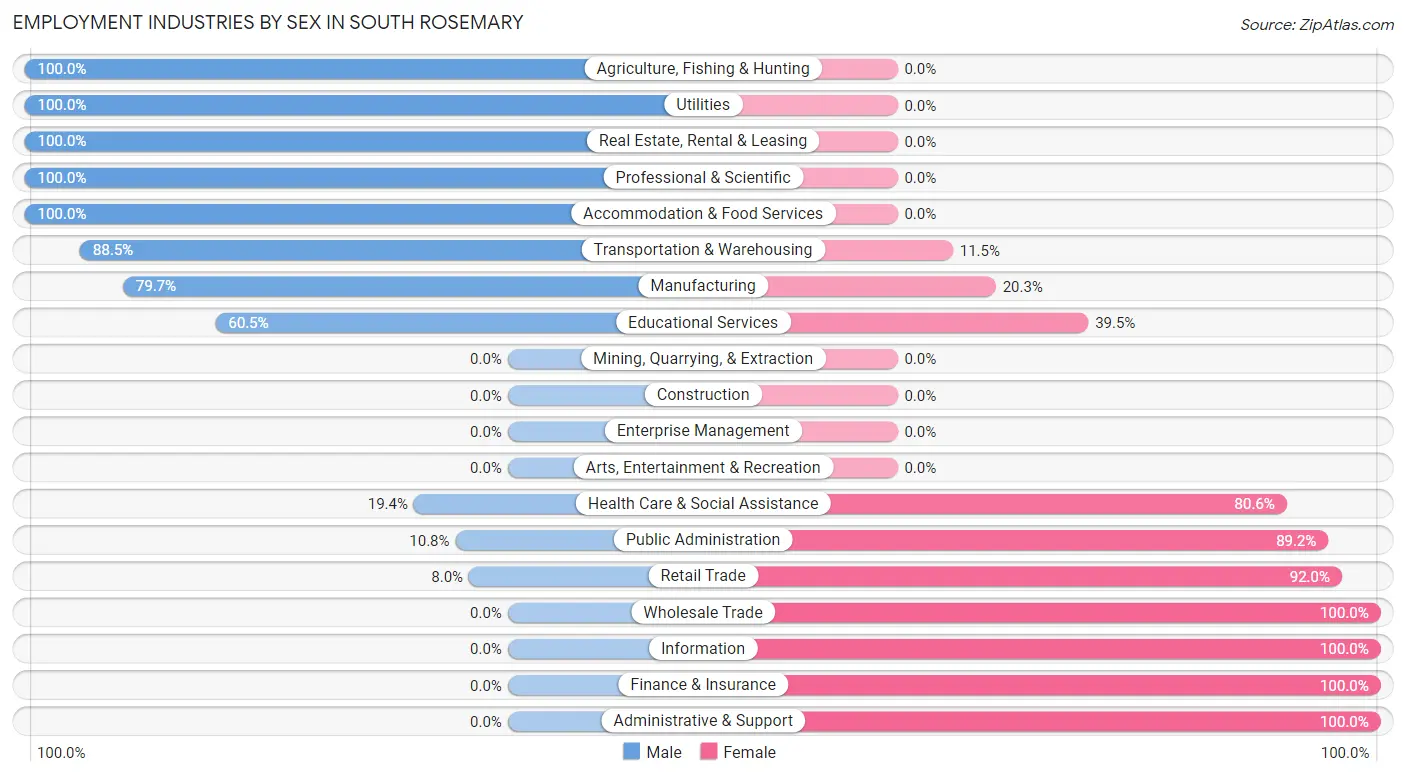
Employment Industries by Sex in South Rosemary
The South Rosemary industries that see more men than women are Agriculture, Fishing & Hunting (100.0%), Utilities (100.0%), and Real Estate, Rental & Leasing (100.0%), whereas the industries that tend to have a higher number of women are Wholesale Trade (100.0%), Information (100.0%), and Finance & Insurance (100.0%).
| Industry | Male | Female |
| Agriculture, Fishing & Hunting | 50 (100.0%) | 0 (0.0%) |
| Mining, Quarrying, & Extraction | 0 (0.0%) | 0 (0.0%) |
| Construction | 0 (0.0%) | 0 (0.0%) |
| Manufacturing | 47 (79.7%) | 12 (20.3%) |
| Wholesale Trade | 0 (0.0%) | 10 (100.0%) |
| Retail Trade | 11 (8.0%) | 126 (92.0%) |
| Transportation & Warehousing | 85 (88.5%) | 11 (11.5%) |
| Utilities | 6 (100.0%) | 0 (0.0%) |
| Information | 0 (0.0%) | 34 (100.0%) |
| Finance & Insurance | 0 (0.0%) | 48 (100.0%) |
| Real Estate, Rental & Leasing | 41 (100.0%) | 0 (0.0%) |
| Professional & Scientific | 13 (100.0%) | 0 (0.0%) |
| Enterprise Management | 0 (0.0%) | 0 (0.0%) |
| Administrative & Support | 0 (0.0%) | 35 (100.0%) |
| Educational Services | 95 (60.5%) | 62 (39.5%) |
| Health Care & Social Assistance | 49 (19.4%) | 203 (80.6%) |
| Arts, Entertainment & Recreation | 0 (0.0%) | 0 (0.0%) |
| Accommodation & Food Services | 37 (100.0%) | 0 (0.0%) |
| Public Administration | 18 (10.8%) | 148 (89.2%) |
| Total | 498 (41.9%) | 689 (58.1%) |
Education in South Rosemary
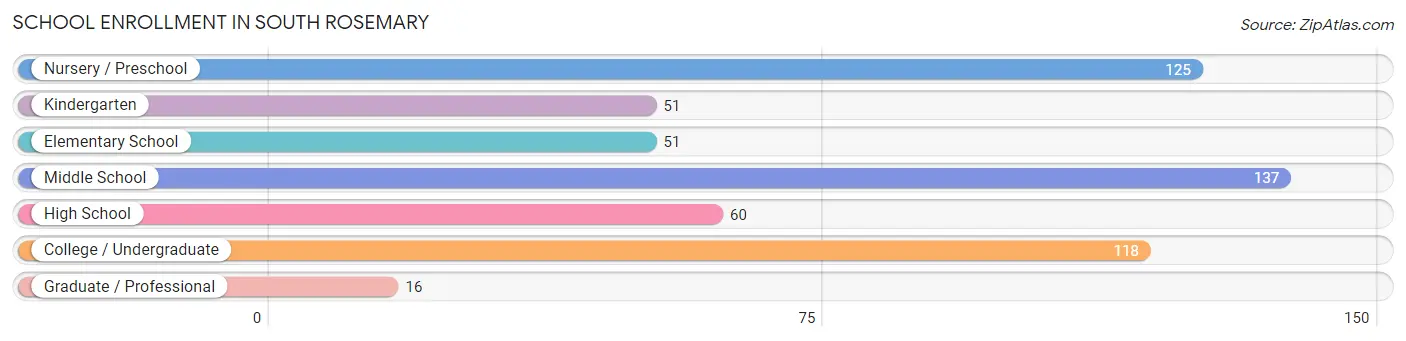
School Enrollment in South Rosemary
The most common levels of schooling among the 558 students in South Rosemary are middle school (137 | 24.5%), nursery / preschool (125 | 22.4%), and college / undergraduate (118 | 21.1%).
| School Level | # Students | % Students |
| Nursery / Preschool | 125 | 22.4% |
| Kindergarten | 51 | 9.1% |
| Elementary School | 51 | 9.1% |
| Middle School | 137 | 24.5% |
| High School | 60 | 10.7% |
| College / Undergraduate | 118 | 21.1% |
| Graduate / Professional | 16 | 2.9% |
| Total | 558 | 100.0% |
School Enrollment by Age by Funding Source in South Rosemary
Out of a total of 558 students who are enrolled in schools in South Rosemary, 46 (8.2%) attend a private institution, while the remaining 512 (91.8%) are enrolled in public schools. The age group of 15 to 17 year olds has the highest likelihood of being enrolled in private schools, with 15 (75.0% in the age bracket) enrolled. Conversely, the age group of 3 to 4 year olds has the lowest likelihood of being enrolled in a private school, with 125 (100.0% in the age bracket) attending a public institution.
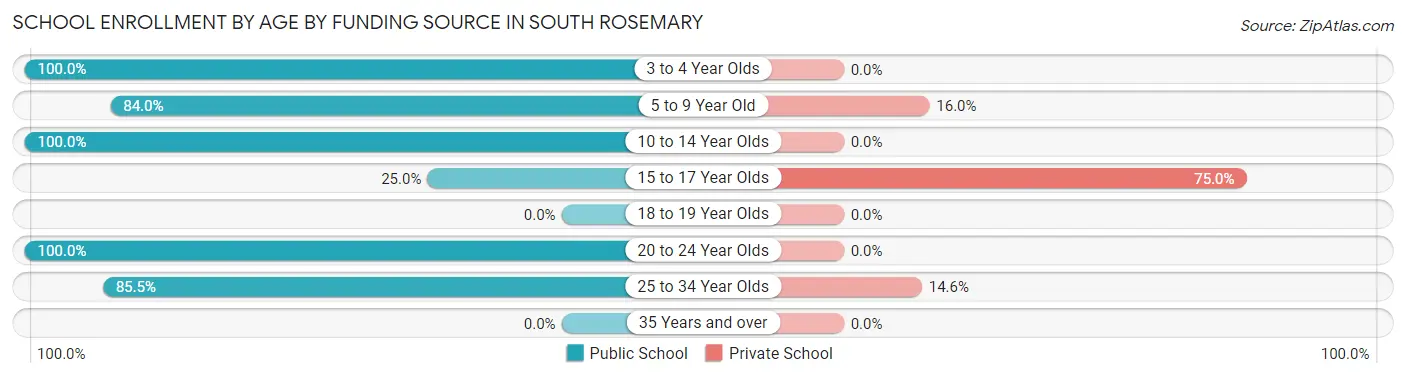
| Age Bracket | Public School | Private School |
| 3 to 4 Year Olds | 125 (100.0%) | 0 (0.0%) |
| 5 to 9 Year Old | 79 (84.0%) | 15 (16.0%) |
| 10 to 14 Year Olds | 185 (100.0%) | 0 (0.0%) |
| 15 to 17 Year Olds | 5 (25.0%) | 15 (75.0%) |
| 18 to 19 Year Olds | 0 (0.0%) | 0 (0.0%) |
| 20 to 24 Year Olds | 24 (100.0%) | 0 (0.0%) |
| 25 to 34 Year Olds | 94 (85.5%) | 16 (14.5%) |
| 35 Years and over | 0 (0.0%) | 0 (0.0%) |
| Total | 512 (91.8%) | 46 (8.2%) |
Educational Attainment by Field of Study in South Rosemary
Multidisciplinary studies (77 | 25.0%), visual & performing arts (71 | 23.1%), social sciences (38 | 12.3%), science & technology (35 | 11.4%), and business (25 | 8.1%) are the most common fields of study among 308 individuals in South Rosemary who have obtained a bachelor's degree or higher.
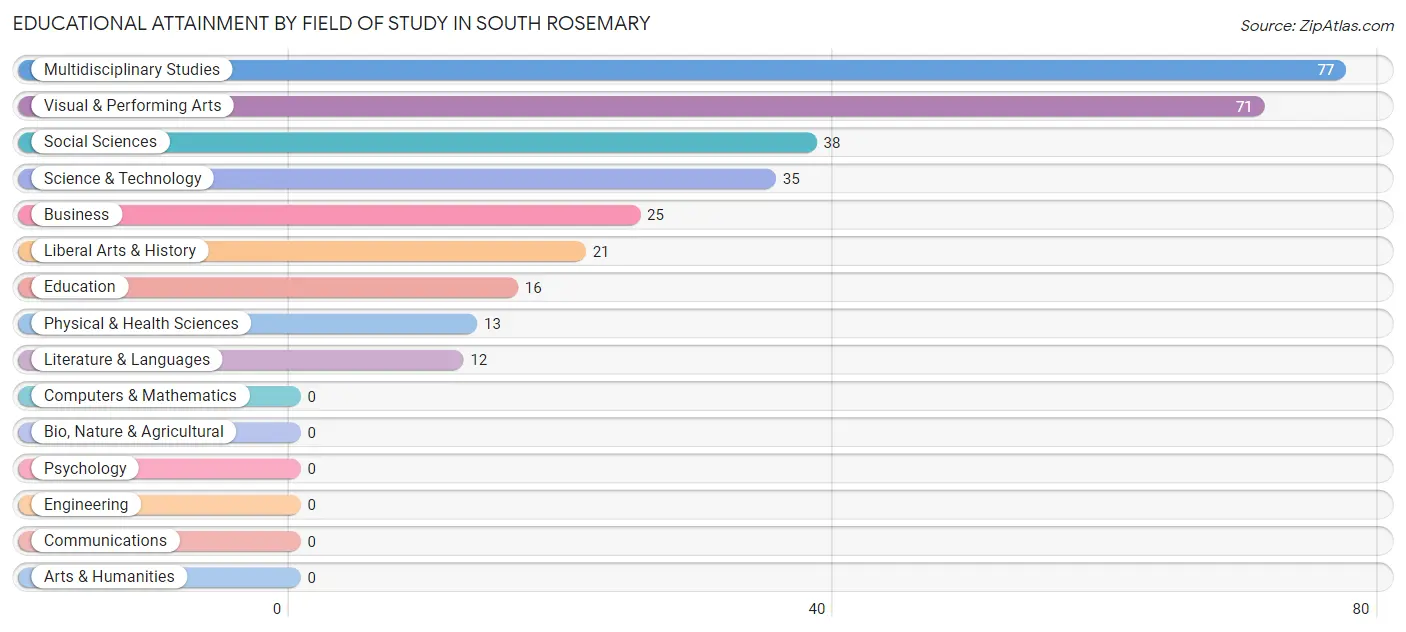
| Field of Study | # Graduates | % Graduates |
| Computers & Mathematics | 0 | 0.0% |
| Bio, Nature & Agricultural | 0 | 0.0% |
| Physical & Health Sciences | 13 | 4.2% |
| Psychology | 0 | 0.0% |
| Social Sciences | 38 | 12.3% |
| Engineering | 0 | 0.0% |
| Multidisciplinary Studies | 77 | 25.0% |
| Science & Technology | 35 | 11.4% |
| Business | 25 | 8.1% |
| Education | 16 | 5.2% |
| Literature & Languages | 12 | 3.9% |
| Liberal Arts & History | 21 | 6.8% |
| Visual & Performing Arts | 71 | 23.1% |
| Communications | 0 | 0.0% |
| Arts & Humanities | 0 | 0.0% |
| Total | 308 | 100.0% |
Transportation & Commute in South Rosemary
Vehicle Availability by Sex in South Rosemary
The most prevalent vehicle ownership categories in South Rosemary are males with 2 vehicles (195, accounting for 39.2%) and females with 2 vehicles (314, making up 28.3%).
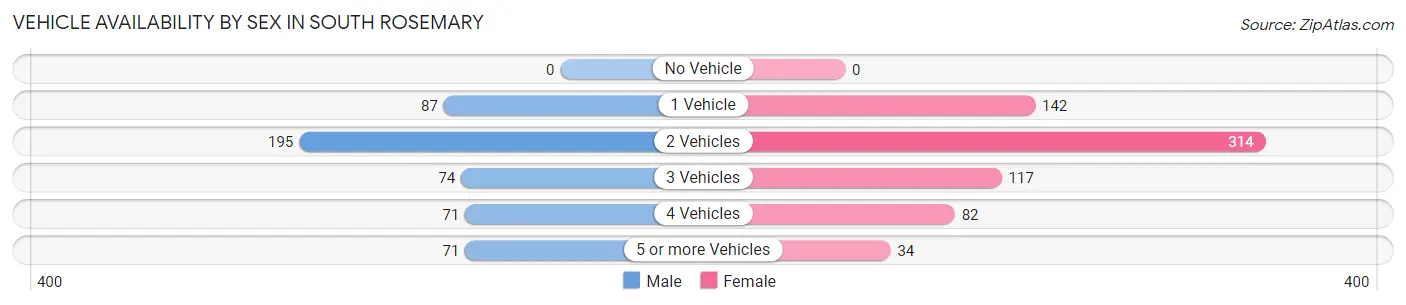
| Vehicles Available | Male | Female |
| No Vehicle | 0 (0.0%) | 0 (0.0%) |
| 1 Vehicle | 87 (17.5%) | 142 (20.6%) |
| 2 Vehicles | 195 (39.2%) | 314 (45.6%) |
| 3 Vehicles | 74 (14.9%) | 117 (17.0%) |
| 4 Vehicles | 71 (14.3%) | 82 (11.9%) |
| 5 or more Vehicles | 71 (14.3%) | 34 (4.9%) |
| Total | 498 (100.0%) | 689 (100.0%) |
Commute Time in South Rosemary
The most frequently occuring commute durations in South Rosemary are 10 to 14 minutes (194 commuters, 19.5%), 15 to 19 minutes (164 commuters, 16.5%), and less than 5 minutes (130 commuters, 13.1%).
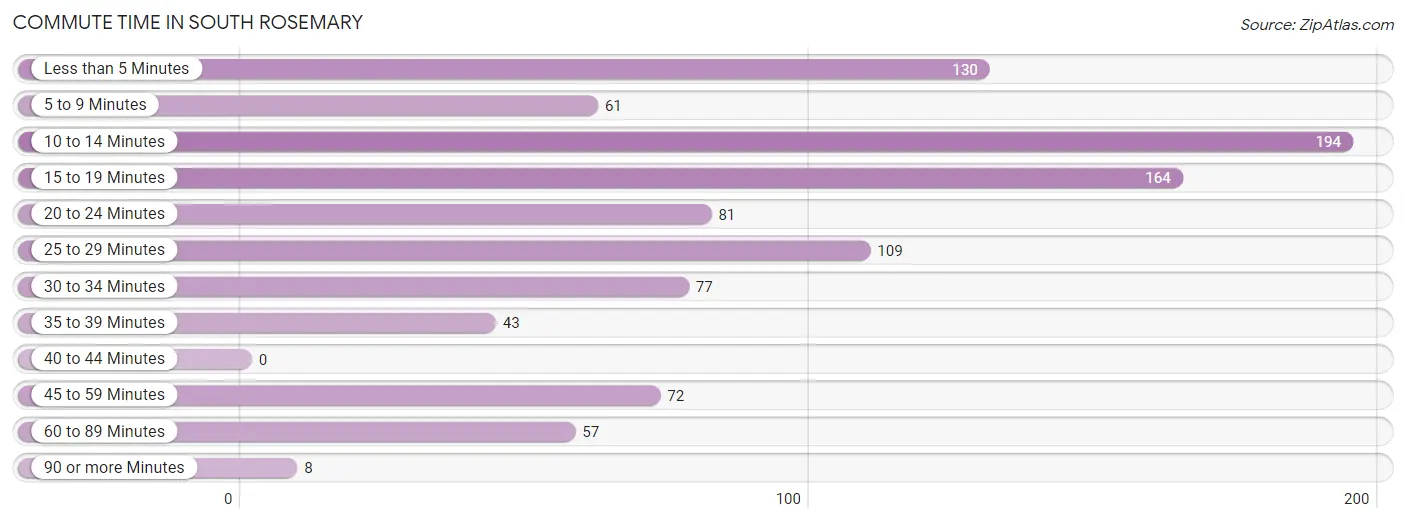
| Commute Time | # Commuters | % Commuters |
| Less than 5 Minutes | 130 | 13.1% |
| 5 to 9 Minutes | 61 | 6.1% |
| 10 to 14 Minutes | 194 | 19.5% |
| 15 to 19 Minutes | 164 | 16.5% |
| 20 to 24 Minutes | 81 | 8.1% |
| 25 to 29 Minutes | 109 | 10.9% |
| 30 to 34 Minutes | 77 | 7.7% |
| 35 to 39 Minutes | 43 | 4.3% |
| 40 to 44 Minutes | 0 | 0.0% |
| 45 to 59 Minutes | 72 | 7.2% |
| 60 to 89 Minutes | 57 | 5.7% |
| 90 or more Minutes | 8 | 0.8% |
Commute Time by Sex in South Rosemary
The most common commute times in South Rosemary are 15 to 19 minutes (117 commuters, 25.9%) for males and 10 to 14 minutes (114 commuters, 21.0%) for females.
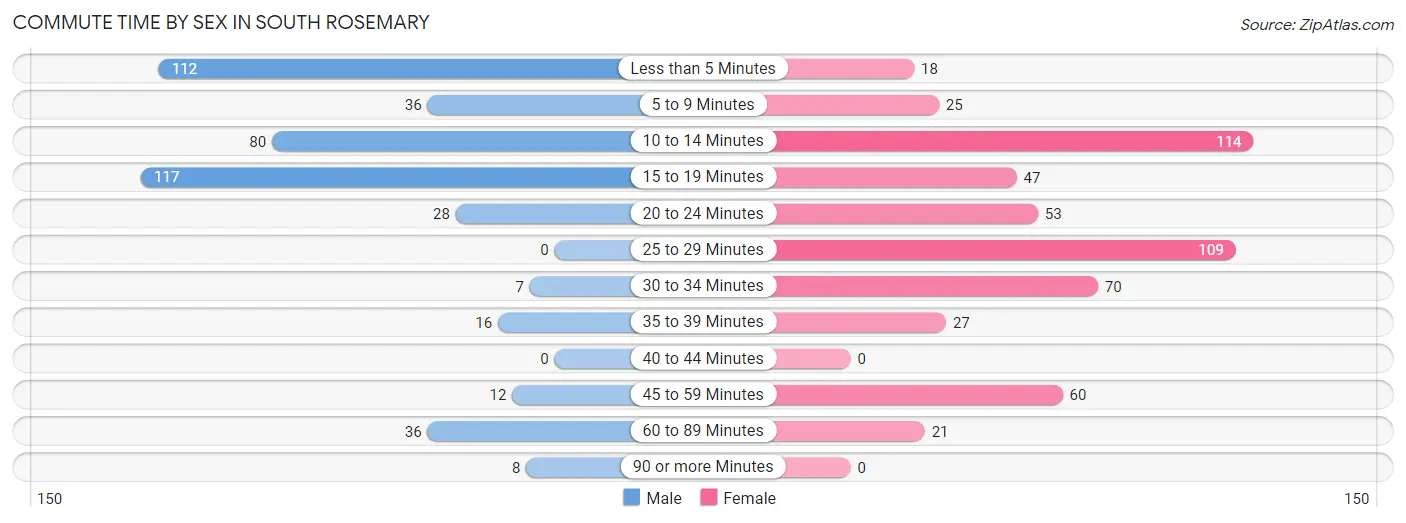
| Commute Time | Male | Female |
| Less than 5 Minutes | 112 (24.8%) | 18 (3.3%) |
| 5 to 9 Minutes | 36 (8.0%) | 25 (4.6%) |
| 10 to 14 Minutes | 80 (17.7%) | 114 (21.0%) |
| 15 to 19 Minutes | 117 (25.9%) | 47 (8.6%) |
| 20 to 24 Minutes | 28 (6.2%) | 53 (9.7%) |
| 25 to 29 Minutes | 0 (0.0%) | 109 (20.0%) |
| 30 to 34 Minutes | 7 (1.5%) | 70 (12.9%) |
| 35 to 39 Minutes | 16 (3.5%) | 27 (5.0%) |
| 40 to 44 Minutes | 0 (0.0%) | 0 (0.0%) |
| 45 to 59 Minutes | 12 (2.6%) | 60 (11.0%) |
| 60 to 89 Minutes | 36 (8.0%) | 21 (3.9%) |
| 90 or more Minutes | 8 (1.8%) | 0 (0.0%) |
Time of Departure to Work by Sex in South Rosemary
The most frequent times of departure to work in South Rosemary are 6:30 AM to 6:59 AM (128, 28.3%) for males and 7:30 AM to 7:59 AM (96, 17.6%) for females.
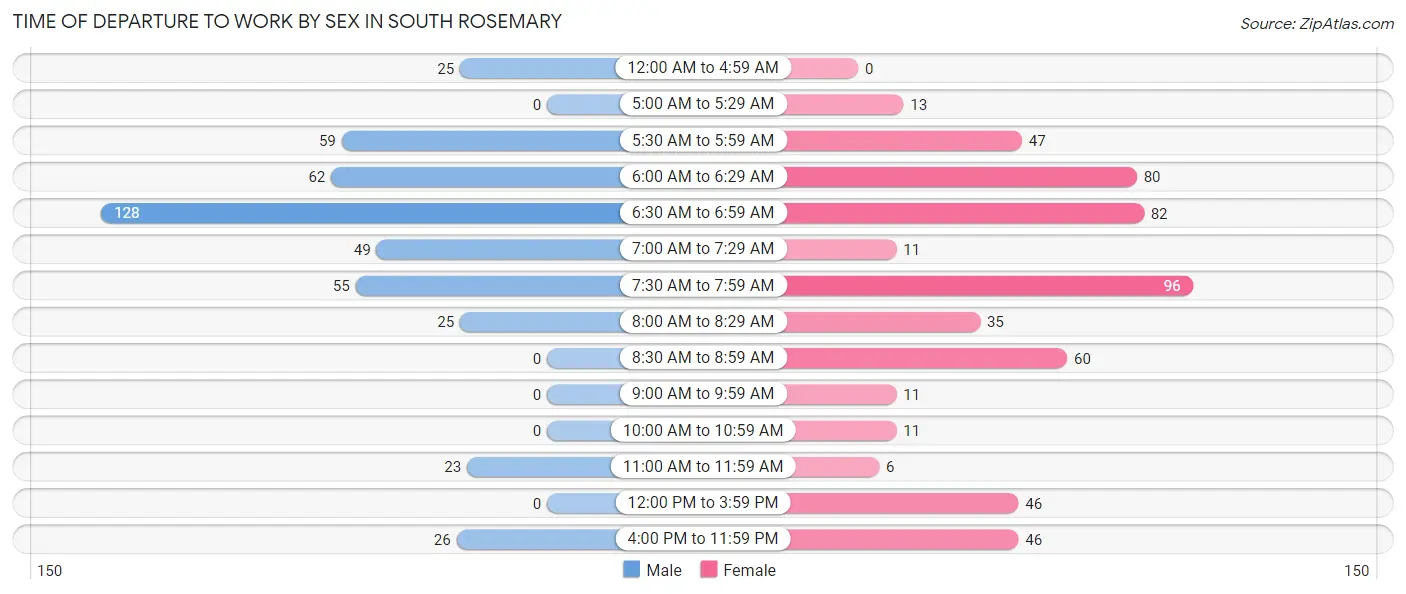
| Time of Departure | Male | Female |
| 12:00 AM to 4:59 AM | 25 (5.5%) | 0 (0.0%) |
| 5:00 AM to 5:29 AM | 0 (0.0%) | 13 (2.4%) |
| 5:30 AM to 5:59 AM | 59 (13.1%) | 47 (8.6%) |
| 6:00 AM to 6:29 AM | 62 (13.7%) | 80 (14.7%) |
| 6:30 AM to 6:59 AM | 128 (28.3%) | 82 (15.1%) |
| 7:00 AM to 7:29 AM | 49 (10.8%) | 11 (2.0%) |
| 7:30 AM to 7:59 AM | 55 (12.2%) | 96 (17.6%) |
| 8:00 AM to 8:29 AM | 25 (5.5%) | 35 (6.4%) |
| 8:30 AM to 8:59 AM | 0 (0.0%) | 60 (11.0%) |
| 9:00 AM to 9:59 AM | 0 (0.0%) | 11 (2.0%) |
| 10:00 AM to 10:59 AM | 0 (0.0%) | 11 (2.0%) |
| 11:00 AM to 11:59 AM | 23 (5.1%) | 6 (1.1%) |
| 12:00 PM to 3:59 PM | 0 (0.0%) | 46 (8.5%) |
| 4:00 PM to 11:59 PM | 26 (5.8%) | 46 (8.5%) |
| Total | 452 (100.0%) | 544 (100.0%) |
Housing Occupancy in South Rosemary
Occupancy by Ownership in South Rosemary
Of the total 1,170 dwellings in South Rosemary, owner-occupied units account for 831 (71.0%), while renter-occupied units make up 339 (29.0%).
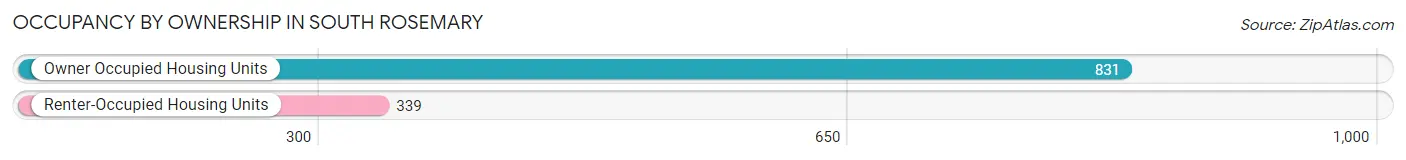
| Occupancy | # Housing Units | % Housing Units |
| Owner Occupied Housing Units | 831 | 71.0% |
| Renter-Occupied Housing Units | 339 | 29.0% |
| Total Occupied Housing Units | 1,170 | 100.0% |
Occupancy by Household Size in South Rosemary
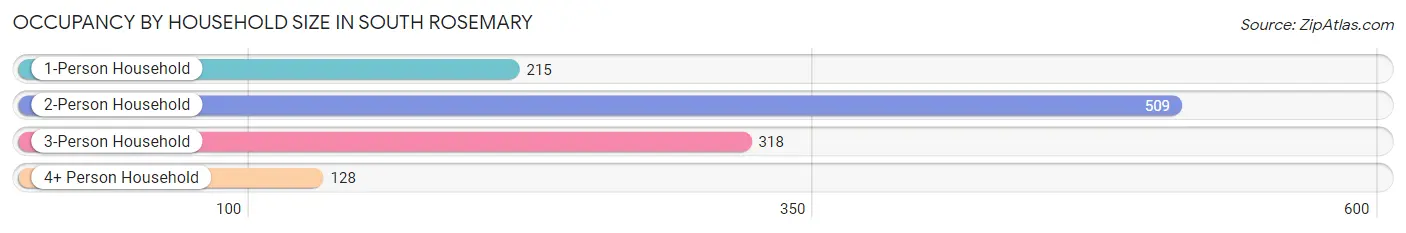
| Household Size | # Housing Units | % Housing Units |
| 1-Person Household | 215 | 18.4% |
| 2-Person Household | 509 | 43.5% |
| 3-Person Household | 318 | 27.2% |
| 4+ Person Household | 128 | 10.9% |
| Total Housing Units | 1,170 | 100.0% |
Occupancy by Ownership by Household Size in South Rosemary
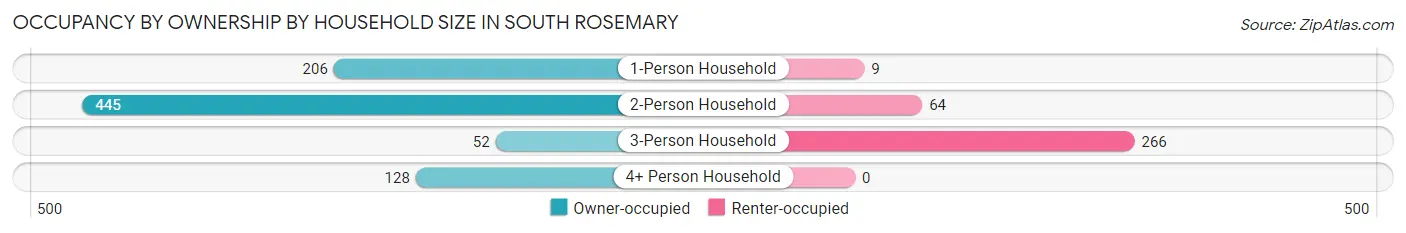
| Household Size | Owner-occupied | Renter-occupied |
| 1-Person Household | 206 (95.8%) | 9 (4.2%) |
| 2-Person Household | 445 (87.4%) | 64 (12.6%) |
| 3-Person Household | 52 (16.4%) | 266 (83.7%) |
| 4+ Person Household | 128 (100.0%) | 0 (0.0%) |
| Total Housing Units | 831 (71.0%) | 339 (29.0%) |
Occupancy by Educational Attainment in South Rosemary
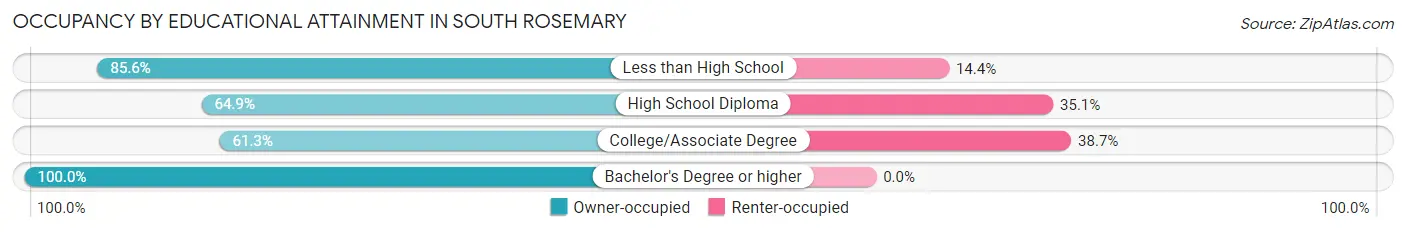
| Household Size | Owner-occupied | Renter-occupied |
| Less than High School | 237 (85.6%) | 40 (14.4%) |
| High School Diploma | 298 (64.9%) | 161 (35.1%) |
| College/Associate Degree | 219 (61.3%) | 138 (38.7%) |
| Bachelor's Degree or higher | 77 (100.0%) | 0 (0.0%) |
Occupancy by Age of Householder in South Rosemary
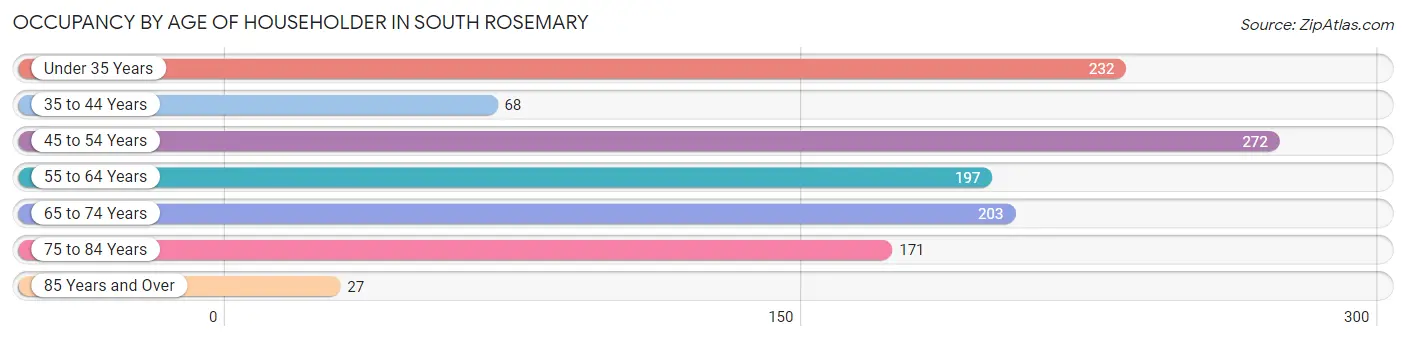
| Age Bracket | # Households | % Households |
| Under 35 Years | 232 | 19.8% |
| 35 to 44 Years | 68 | 5.8% |
| 45 to 54 Years | 272 | 23.3% |
| 55 to 64 Years | 197 | 16.8% |
| 65 to 74 Years | 203 | 17.3% |
| 75 to 84 Years | 171 | 14.6% |
| 85 Years and Over | 27 | 2.3% |
| Total | 1,170 | 100.0% |
Housing Finances in South Rosemary
Median Income by Occupancy in South Rosemary
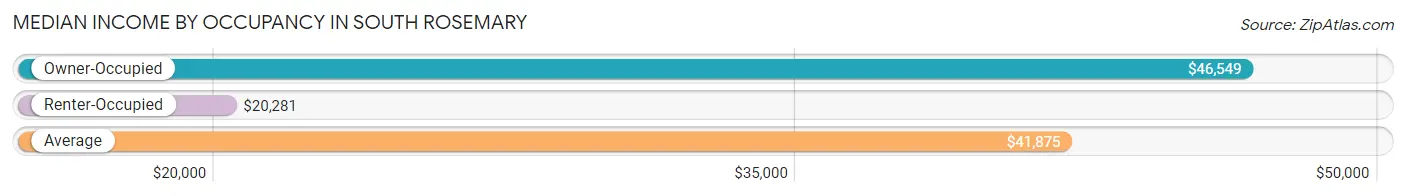
| Occupancy Type | # Households | Median Income |
| Owner-Occupied | 831 (71.0%) | $46,549 |
| Renter-Occupied | 339 (29.0%) | $20,281 |
| Average | 1,170 (100.0%) | $41,875 |
Occupancy by Householder Income Bracket in South Rosemary
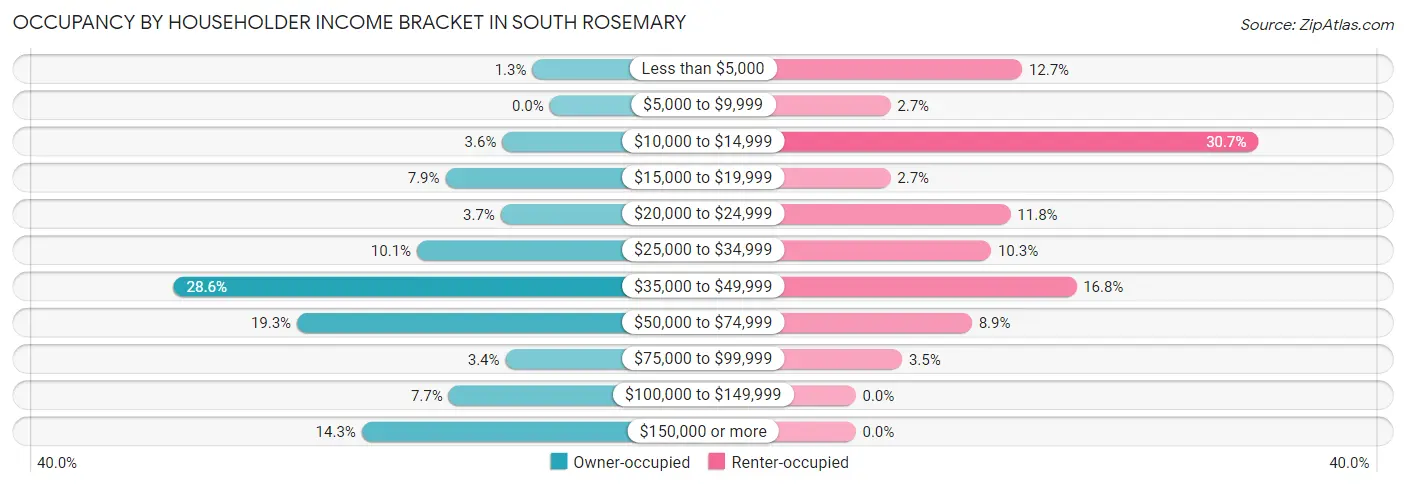
| Income Bracket | Owner-occupied | Renter-occupied |
| Less than $5,000 | 11 (1.3%) | 43 (12.7%) |
| $5,000 to $9,999 | 0 (0.0%) | 9 (2.6%) |
| $10,000 to $14,999 | 30 (3.6%) | 104 (30.7%) |
| $15,000 to $19,999 | 66 (7.9%) | 9 (2.6%) |
| $20,000 to $24,999 | 31 (3.7%) | 40 (11.8%) |
| $25,000 to $34,999 | 84 (10.1%) | 35 (10.3%) |
| $35,000 to $49,999 | 238 (28.6%) | 57 (16.8%) |
| $50,000 to $74,999 | 160 (19.3%) | 30 (8.8%) |
| $75,000 to $99,999 | 28 (3.4%) | 12 (3.5%) |
| $100,000 to $149,999 | 64 (7.7%) | 0 (0.0%) |
| $150,000 or more | 119 (14.3%) | 0 (0.0%) |
| Total | 831 (100.0%) | 339 (100.0%) |
Monthly Housing Cost Tiers in South Rosemary
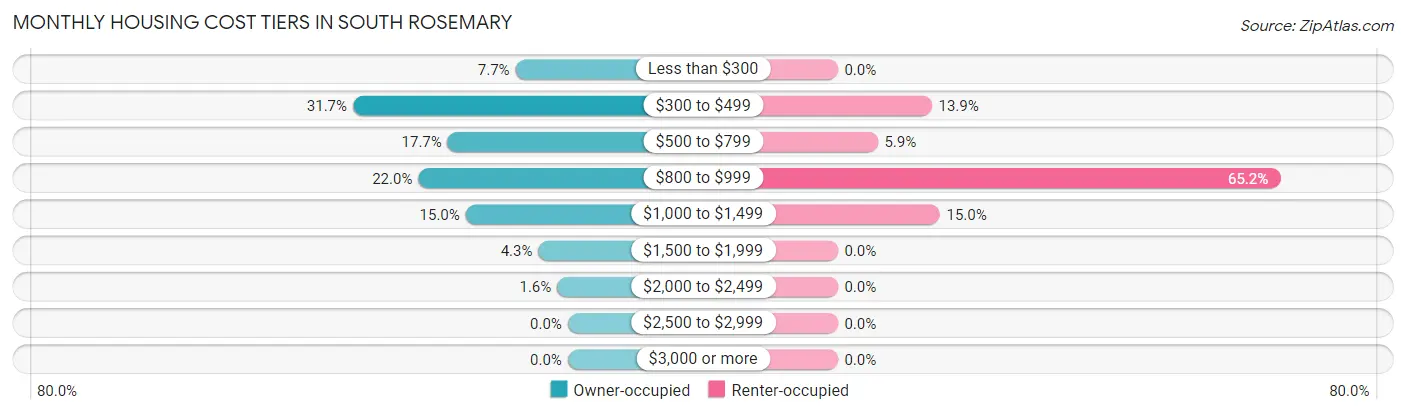
| Monthly Cost | Owner-occupied | Renter-occupied |
| Less than $300 | 64 (7.7%) | 0 (0.0%) |
| $300 to $499 | 263 (31.7%) | 47 (13.9%) |
| $500 to $799 | 147 (17.7%) | 20 (5.9%) |
| $800 to $999 | 183 (22.0%) | 221 (65.2%) |
| $1,000 to $1,499 | 125 (15.0%) | 51 (15.0%) |
| $1,500 to $1,999 | 36 (4.3%) | 0 (0.0%) |
| $2,000 to $2,499 | 13 (1.6%) | 0 (0.0%) |
| $2,500 to $2,999 | 0 (0.0%) | 0 (0.0%) |
| $3,000 or more | 0 (0.0%) | 0 (0.0%) |
| Total | 831 (100.0%) | 339 (100.0%) |
Physical Housing Characteristics in South Rosemary
Housing Structures in South Rosemary
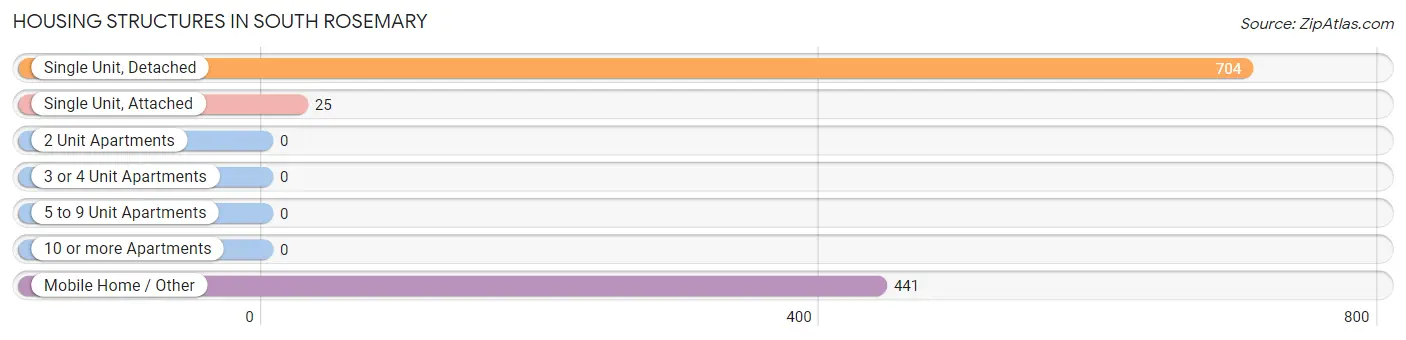
| Structure Type | # Housing Units | % Housing Units |
| Single Unit, Detached | 704 | 60.2% |
| Single Unit, Attached | 25 | 2.1% |
| 2 Unit Apartments | 0 | 0.0% |
| 3 or 4 Unit Apartments | 0 | 0.0% |
| 5 to 9 Unit Apartments | 0 | 0.0% |
| 10 or more Apartments | 0 | 0.0% |
| Mobile Home / Other | 441 | 37.7% |
| Total | 1,170 | 100.0% |
Housing Structures by Occupancy in South Rosemary
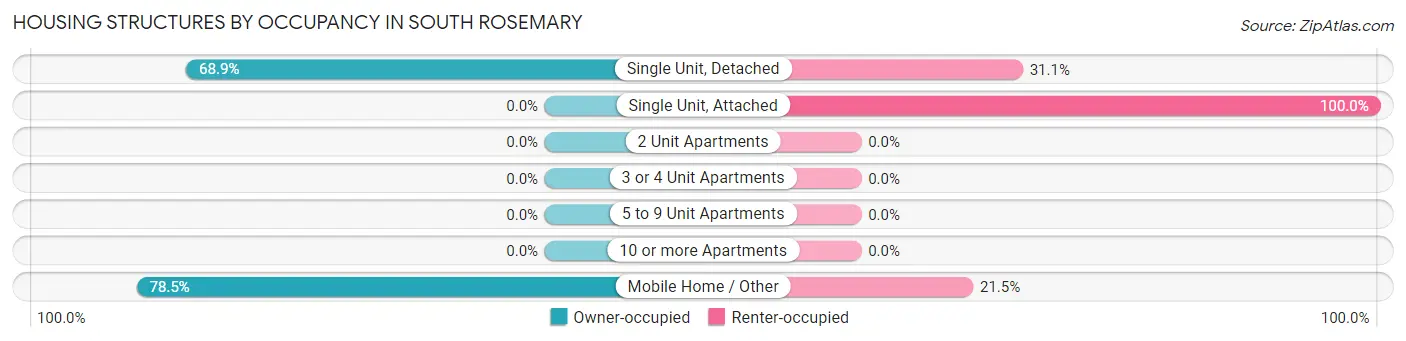
| Structure Type | Owner-occupied | Renter-occupied |
| Single Unit, Detached | 485 (68.9%) | 219 (31.1%) |
| Single Unit, Attached | 0 (0.0%) | 25 (100.0%) |
| 2 Unit Apartments | 0 (0.0%) | 0 (0.0%) |
| 3 or 4 Unit Apartments | 0 (0.0%) | 0 (0.0%) |
| 5 to 9 Unit Apartments | 0 (0.0%) | 0 (0.0%) |
| 10 or more Apartments | 0 (0.0%) | 0 (0.0%) |
| Mobile Home / Other | 346 (78.5%) | 95 (21.5%) |
| Total | 831 (71.0%) | 339 (29.0%) |
Housing Structures by Number of Rooms in South Rosemary
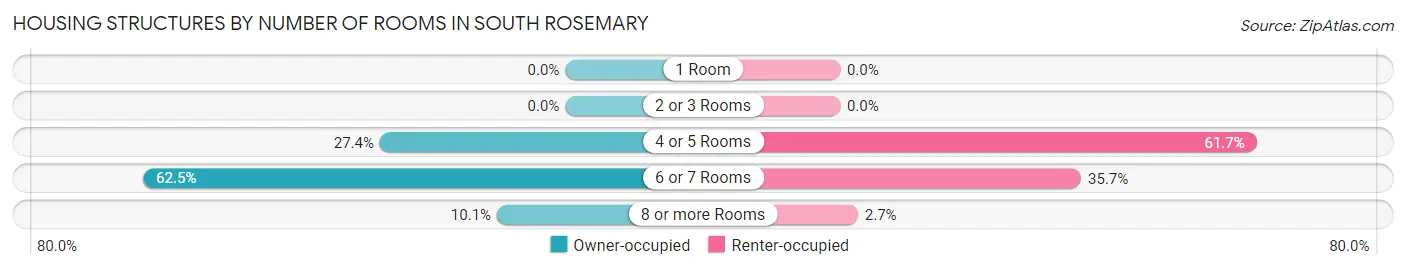
| Number of Rooms | Owner-occupied | Renter-occupied |
| 1 Room | 0 (0.0%) | 0 (0.0%) |
| 2 or 3 Rooms | 0 (0.0%) | 0 (0.0%) |
| 4 or 5 Rooms | 228 (27.4%) | 209 (61.7%) |
| 6 or 7 Rooms | 519 (62.5%) | 121 (35.7%) |
| 8 or more Rooms | 84 (10.1%) | 9 (2.6%) |
| Total | 831 (100.0%) | 339 (100.0%) |
Housing Structure by Heating Type in South Rosemary
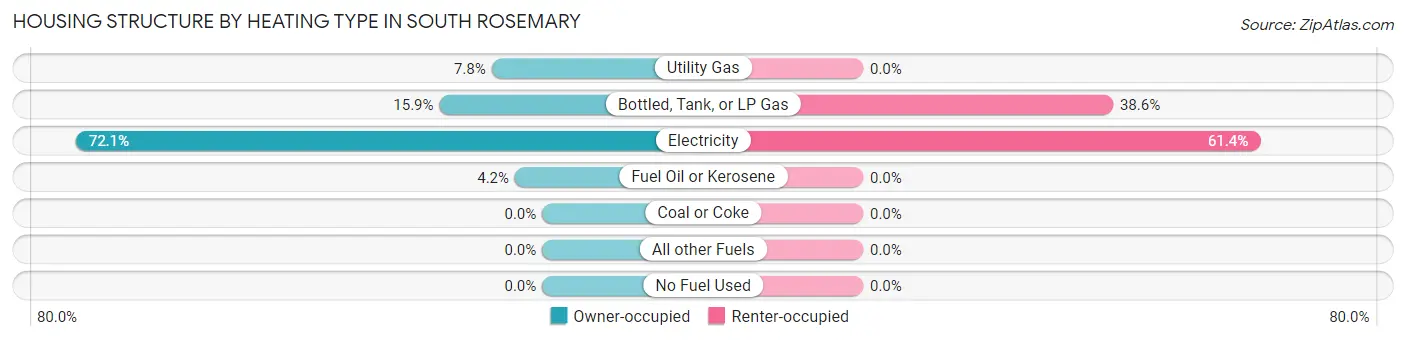
| Heating Type | Owner-occupied | Renter-occupied |
| Utility Gas | 65 (7.8%) | 0 (0.0%) |
| Bottled, Tank, or LP Gas | 132 (15.9%) | 131 (38.6%) |
| Electricity | 599 (72.1%) | 208 (61.4%) |
| Fuel Oil or Kerosene | 35 (4.2%) | 0 (0.0%) |
| Coal or Coke | 0 (0.0%) | 0 (0.0%) |
| All other Fuels | 0 (0.0%) | 0 (0.0%) |
| No Fuel Used | 0 (0.0%) | 0 (0.0%) |
| Total | 831 (100.0%) | 339 (100.0%) |
Household Vehicle Usage in South Rosemary
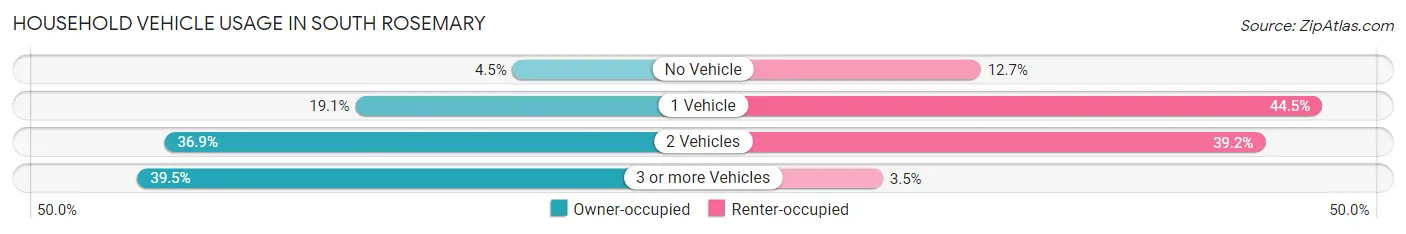
| Vehicles per Household | Owner-occupied | Renter-occupied |
| No Vehicle | 37 (4.4%) | 43 (12.7%) |
| 1 Vehicle | 159 (19.1%) | 151 (44.5%) |
| 2 Vehicles | 307 (36.9%) | 133 (39.2%) |
| 3 or more Vehicles | 328 (39.5%) | 12 (3.5%) |
| Total | 831 (100.0%) | 339 (100.0%) |
Real Estate & Mortgages in South Rosemary
Real Estate and Mortgage Overview in South Rosemary
| Characteristic | Without Mortgage | With Mortgage |
| Housing Units | 408 | 423 |
| Median Property Value | $74,100 | $95,000 |
| Median Household Income | $53,750 | $27 |
| Monthly Housing Costs | $383 | $0 |
| Real Estate Taxes | $883 | $0 |
Property Value by Mortgage Status in South Rosemary
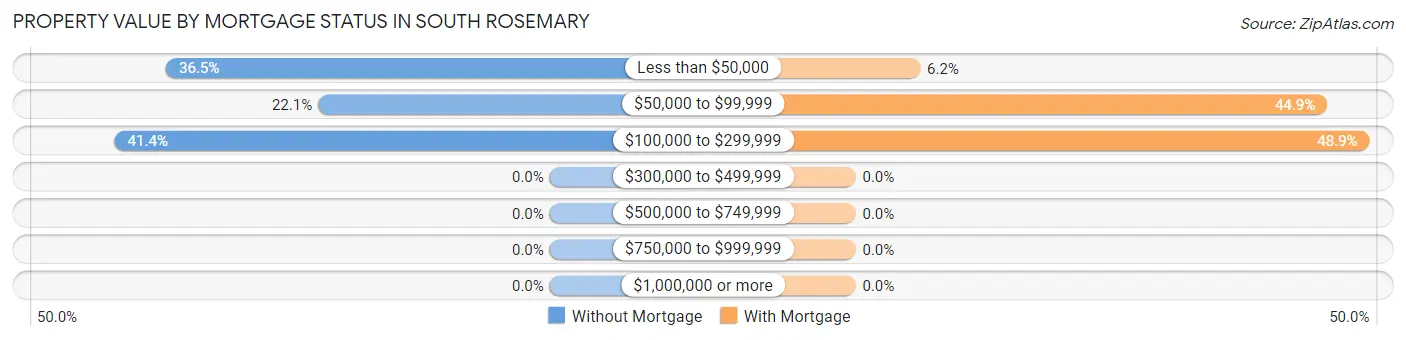
| Property Value | Without Mortgage | With Mortgage |
| Less than $50,000 | 149 (36.5%) | 26 (6.1%) |
| $50,000 to $99,999 | 90 (22.1%) | 190 (44.9%) |
| $100,000 to $299,999 | 169 (41.4%) | 207 (48.9%) |
| $300,000 to $499,999 | 0 (0.0%) | 0 (0.0%) |
| $500,000 to $749,999 | 0 (0.0%) | 0 (0.0%) |
| $750,000 to $999,999 | 0 (0.0%) | 0 (0.0%) |
| $1,000,000 or more | 0 (0.0%) | 0 (0.0%) |
| Total | 408 (100.0%) | 423 (100.0%) |
Household Income by Mortgage Status in South Rosemary
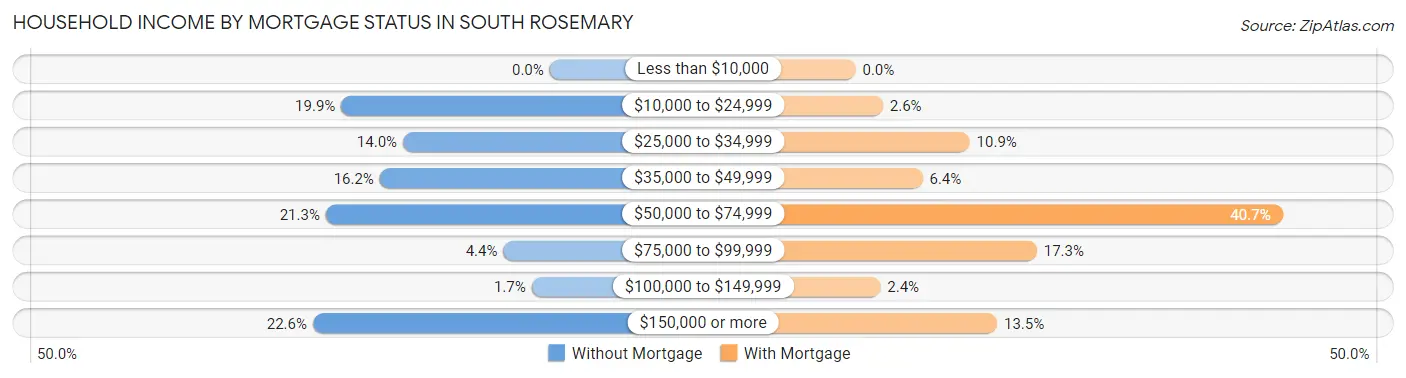
| Household Income | Without Mortgage | With Mortgage |
| Less than $10,000 | 0 (0.0%) | 0 (0.0%) |
| $10,000 to $24,999 | 81 (19.9%) | 11 (2.6%) |
| $25,000 to $34,999 | 57 (14.0%) | 46 (10.9%) |
| $35,000 to $49,999 | 66 (16.2%) | 27 (6.4%) |
| $50,000 to $74,999 | 87 (21.3%) | 172 (40.7%) |
| $75,000 to $99,999 | 18 (4.4%) | 73 (17.3%) |
| $100,000 to $149,999 | 7 (1.7%) | 10 (2.4%) |
| $150,000 or more | 92 (22.6%) | 57 (13.5%) |
| Total | 408 (100.0%) | 423 (100.0%) |
Property Value to Household Income Ratio in South Rosemary
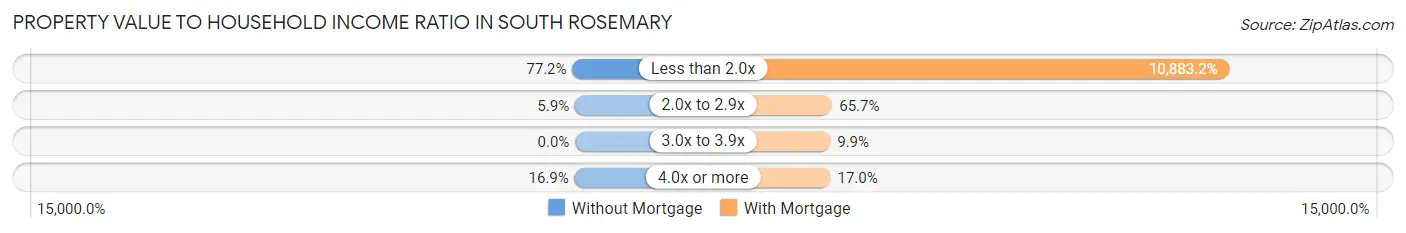
| Value-to-Income Ratio | Without Mortgage | With Mortgage |
| Less than 2.0x | 315 (77.2%) | 46,036 (10,883.2%) |
| 2.0x to 2.9x | 24 (5.9%) | 278 (65.7%) |
| 3.0x to 3.9x | 0 (0.0%) | 42 (9.9%) |
| 4.0x or more | 69 (16.9%) | 72 (17.0%) |
| Total | 408 (100.0%) | 423 (100.0%) |
Real Estate Taxes by Mortgage Status in South Rosemary
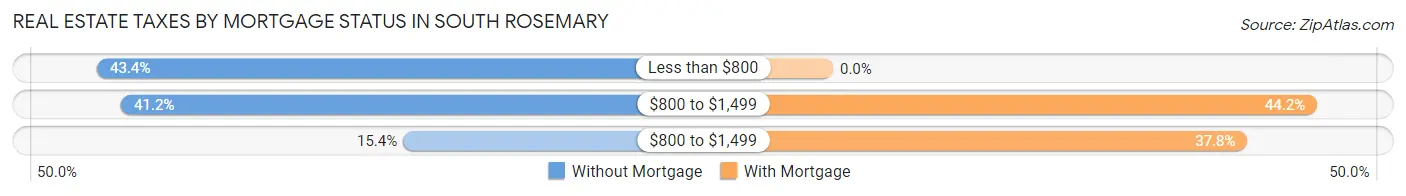
| Property Taxes | Without Mortgage | With Mortgage |
| Less than $800 | 177 (43.4%) | 0 (0.0%) |
| $800 to $1,499 | 168 (41.2%) | 187 (44.2%) |
| $800 to $1,499 | 63 (15.4%) | 160 (37.8%) |
| Total | 408 (100.0%) | 423 (100.0%) |
Health & Disability in South Rosemary
Health Insurance Coverage by Age in South Rosemary
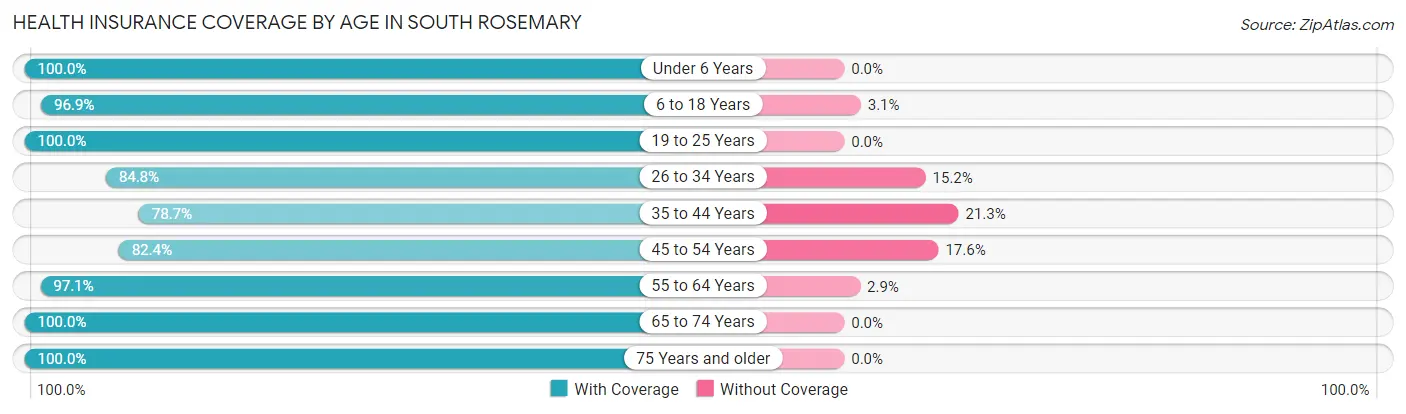
| Age Bracket | With Coverage | Without Coverage |
| Under 6 Years | 287 (100.0%) | 0 (0.0%) |
| 6 to 18 Years | 252 (96.9%) | 8 (3.1%) |
| 19 to 25 Years | 207 (100.0%) | 0 (0.0%) |
| 26 to 34 Years | 386 (84.8%) | 69 (15.2%) |
| 35 to 44 Years | 192 (78.7%) | 52 (21.3%) |
| 45 to 54 Years | 352 (82.4%) | 75 (17.6%) |
| 55 to 64 Years | 396 (97.1%) | 12 (2.9%) |
| 65 to 74 Years | 318 (100.0%) | 0 (0.0%) |
| 75 Years and older | 271 (100.0%) | 0 (0.0%) |
| Total | 2,661 (92.5%) | 216 (7.5%) |
Health Insurance Coverage by Citizenship Status in South Rosemary
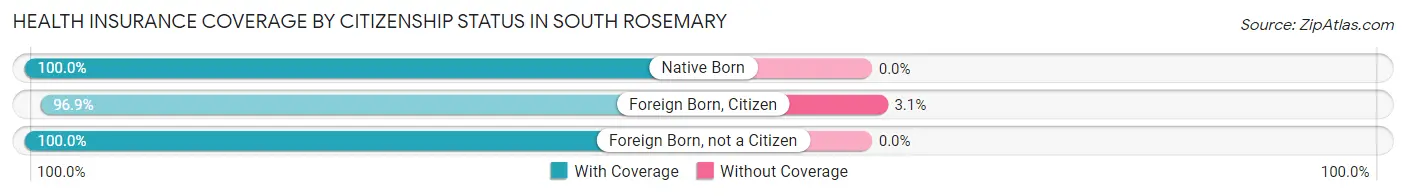
| Citizenship Status | With Coverage | Without Coverage |
| Native Born | 287 (100.0%) | 0 (0.0%) |
| Foreign Born, Citizen | 252 (96.9%) | 8 (3.1%) |
| Foreign Born, not a Citizen | 207 (100.0%) | 0 (0.0%) |
Health Insurance Coverage by Household Income in South Rosemary
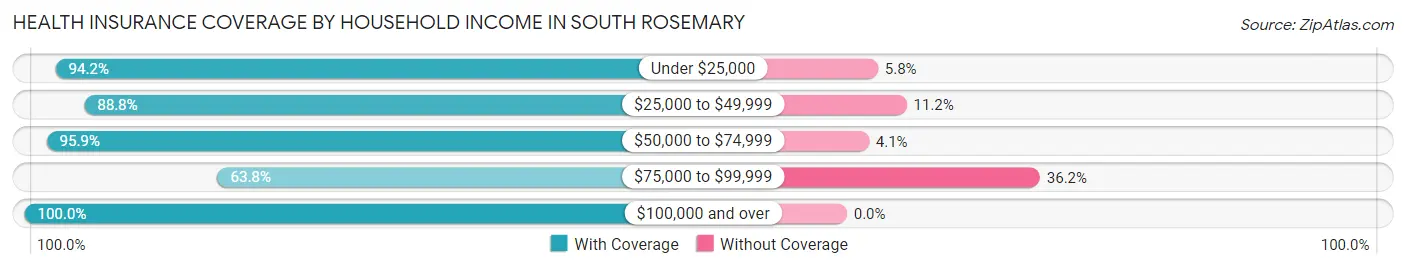
| Household Income | With Coverage | Without Coverage |
| Under $25,000 | 760 (94.2%) | 47 (5.8%) |
| $25,000 to $49,999 | 936 (88.8%) | 118 (11.2%) |
| $50,000 to $74,999 | 395 (95.9%) | 17 (4.1%) |
| $75,000 to $99,999 | 60 (63.8%) | 34 (36.2%) |
| $100,000 and over | 510 (100.0%) | 0 (0.0%) |
Public vs Private Health Insurance Coverage by Age in South Rosemary
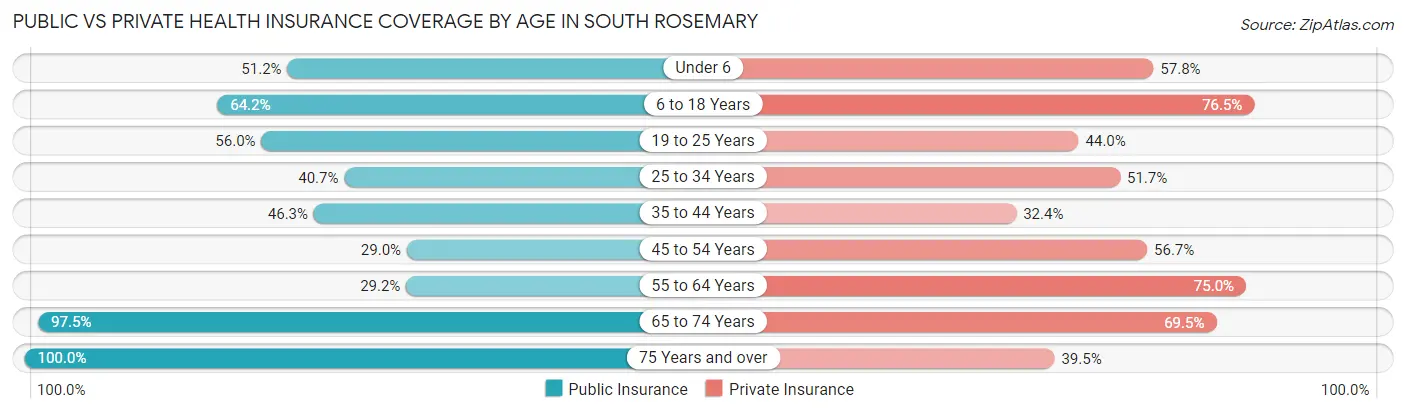
| Age Bracket | Public Insurance | Private Insurance |
| Under 6 | 147 (51.2%) | 166 (57.8%) |
| 6 to 18 Years | 167 (64.2%) | 199 (76.5%) |
| 19 to 25 Years | 116 (56.0%) | 91 (44.0%) |
| 25 to 34 Years | 185 (40.7%) | 235 (51.6%) |
| 35 to 44 Years | 113 (46.3%) | 79 (32.4%) |
| 45 to 54 Years | 124 (29.0%) | 242 (56.7%) |
| 55 to 64 Years | 119 (29.2%) | 306 (75.0%) |
| 65 to 74 Years | 310 (97.5%) | 221 (69.5%) |
| 75 Years and over | 271 (100.0%) | 107 (39.5%) |
| Total | 1,552 (53.9%) | 1,646 (57.2%) |
Disability Status by Sex by Age in South Rosemary
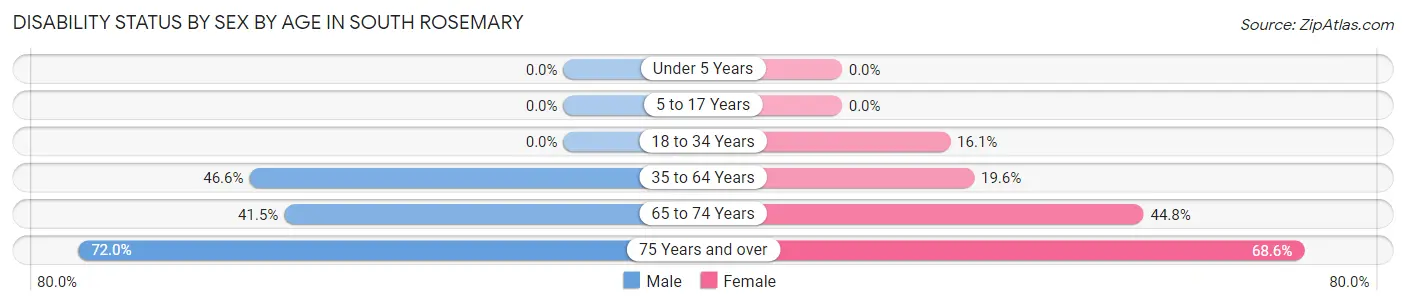
| Age Bracket | Male | Female |
| Under 5 Years | 0 (0.0%) | 0 (0.0%) |
| 5 to 17 Years | 0 (0.0%) | 0 (0.0%) |
| 18 to 34 Years | 0 (0.0%) | 65 (16.1%) |
| 35 to 64 Years | 242 (46.6%) | 110 (19.6%) |
| 65 to 74 Years | 68 (41.5%) | 69 (44.8%) |
| 75 Years and over | 85 (72.0%) | 105 (68.6%) |
Disability Class by Sex by Age in South Rosemary
Disability Class: Hearing Difficulty
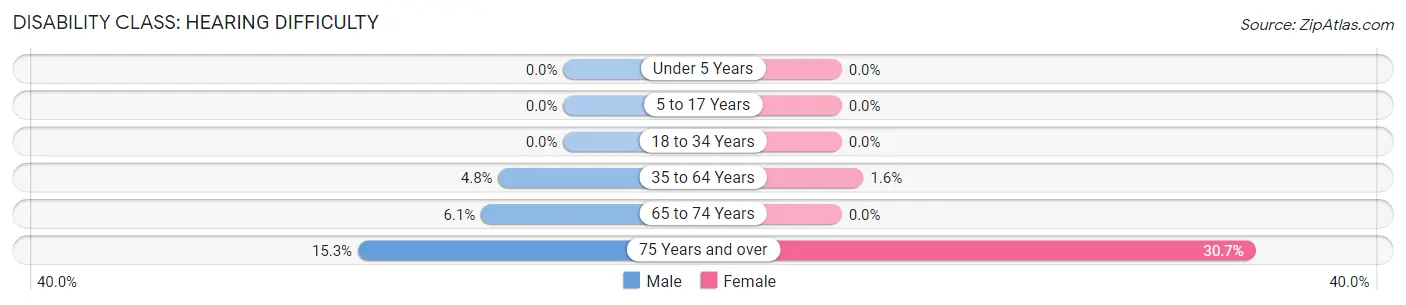
| Age Bracket | Male | Female |
| Under 5 Years | 0 (0.0%) | 0 (0.0%) |
| 5 to 17 Years | 0 (0.0%) | 0 (0.0%) |
| 18 to 34 Years | 0 (0.0%) | 0 (0.0%) |
| 35 to 64 Years | 25 (4.8%) | 9 (1.6%) |
| 65 to 74 Years | 10 (6.1%) | 0 (0.0%) |
| 75 Years and over | 18 (15.2%) | 47 (30.7%) |
Disability Class: Vision Difficulty
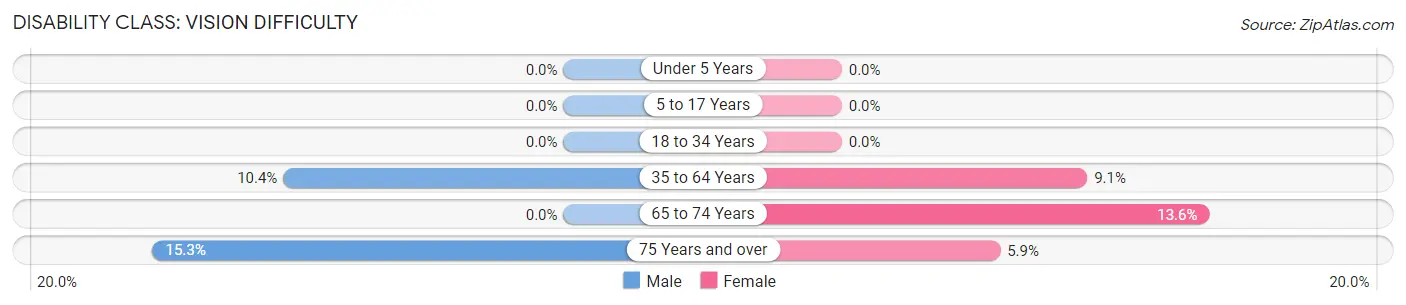
| Age Bracket | Male | Female |
| Under 5 Years | 0 (0.0%) | 0 (0.0%) |
| 5 to 17 Years | 0 (0.0%) | 0 (0.0%) |
| 18 to 34 Years | 0 (0.0%) | 0 (0.0%) |
| 35 to 64 Years | 54 (10.4%) | 51 (9.1%) |
| 65 to 74 Years | 0 (0.0%) | 21 (13.6%) |
| 75 Years and over | 18 (15.2%) | 9 (5.9%) |
Disability Class: Cognitive Difficulty
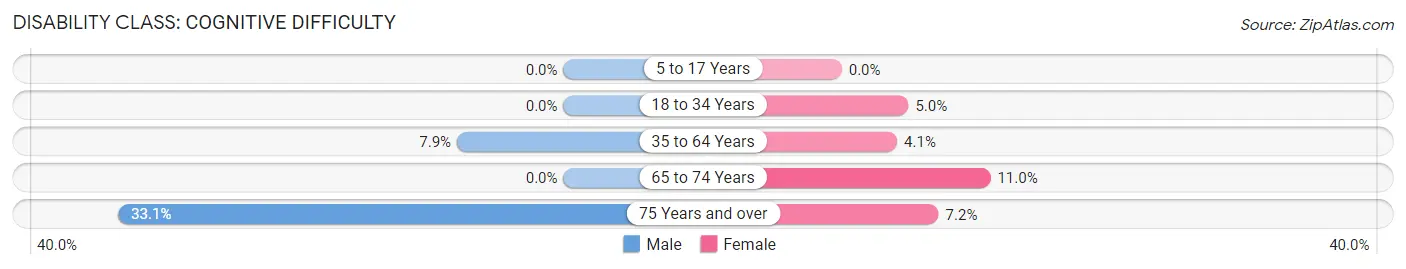
| Age Bracket | Male | Female |
| 5 to 17 Years | 0 (0.0%) | 0 (0.0%) |
| 18 to 34 Years | 0 (0.0%) | 20 (5.0%) |
| 35 to 64 Years | 41 (7.9%) | 23 (4.1%) |
| 65 to 74 Years | 0 (0.0%) | 17 (11.0%) |
| 75 Years and over | 39 (33.1%) | 11 (7.2%) |
Disability Class: Ambulatory Difficulty
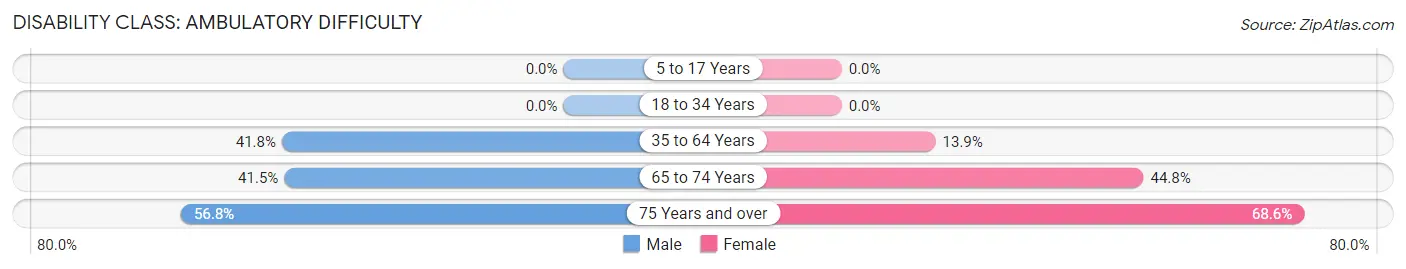
| Age Bracket | Male | Female |
| 5 to 17 Years | 0 (0.0%) | 0 (0.0%) |
| 18 to 34 Years | 0 (0.0%) | 0 (0.0%) |
| 35 to 64 Years | 217 (41.8%) | 78 (13.9%) |
| 65 to 74 Years | 68 (41.5%) | 69 (44.8%) |
| 75 Years and over | 67 (56.8%) | 105 (68.6%) |
Disability Class: Self-Care Difficulty
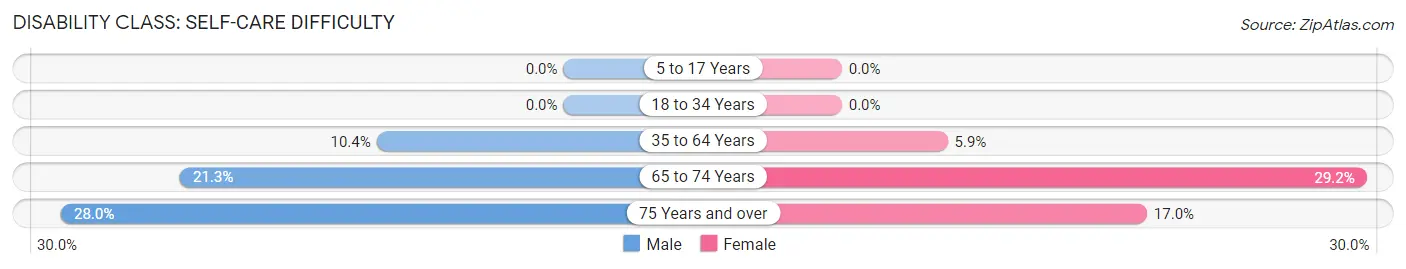
| Age Bracket | Male | Female |
| 5 to 17 Years | 0 (0.0%) | 0 (0.0%) |
| 18 to 34 Years | 0 (0.0%) | 0 (0.0%) |
| 35 to 64 Years | 54 (10.4%) | 33 (5.9%) |
| 65 to 74 Years | 35 (21.3%) | 45 (29.2%) |
| 75 Years and over | 33 (28.0%) | 26 (17.0%) |
Technology Access in South Rosemary
Computing Device Access in South Rosemary
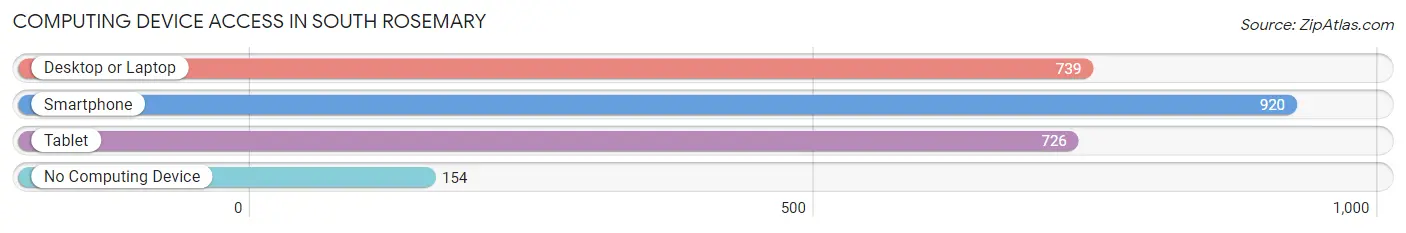
| Device Type | # Households | % Households |
| Desktop or Laptop | 739 | 63.2% |
| Smartphone | 920 | 78.6% |
| Tablet | 726 | 62.1% |
| No Computing Device | 154 | 13.2% |
| Total | 1,170 | 100.0% |
Internet Access in South Rosemary
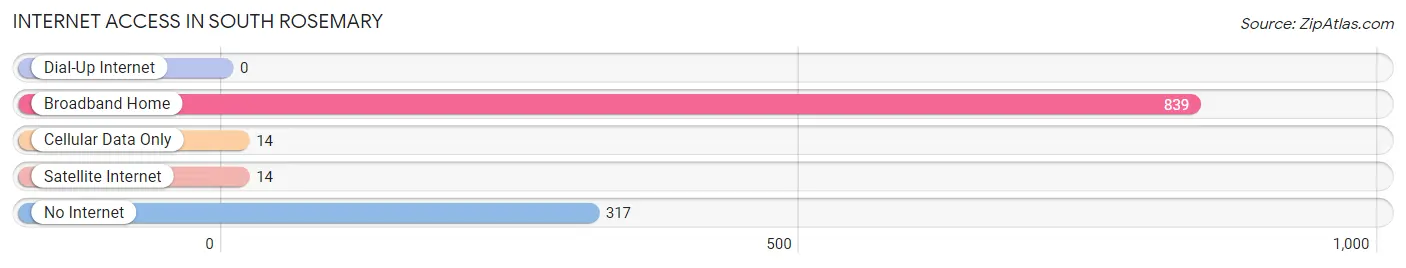
| Internet Type | # Households | % Households |
| Dial-Up Internet | 0 | 0.0% |
| Broadband Home | 839 | 71.7% |
| Cellular Data Only | 14 | 1.2% |
| Satellite Internet | 14 | 1.2% |
| No Internet | 317 | 27.1% |
| Total | 1,170 | 100.0% |
South Rosemary Summary
Rosemary, North Carolina is a small town located in the northeastern part of the state. It is situated in the foothills of the Blue Ridge Mountains and is part of the larger metropolitan area of Charlotte. The town has a population of just over 1,000 people and is known for its rural charm and small-town atmosphere.
Geography
Rosemary is located in the foothills of the Blue Ridge Mountains, about 25 miles northeast of Charlotte. The town is situated in a valley surrounded by rolling hills and is bordered by the Catawba River to the east. The town is located at an elevation of 890 feet and has a total area of 1.2 square miles.
Climate
Rosemary has a humid subtropical climate, with hot, humid summers and mild winters. The average annual temperature is around 60 degrees Fahrenheit, with temperatures ranging from the mid-30s in the winter to the mid-80s in the summer. The town receives an average of 48 inches of precipitation per year, with most of it falling in the form of rain.
Demographics
As of the 2010 census, Rosemary had a population of 1,072 people. The racial makeup of the town was 94.3% White, 2.7% African American, 0.3% Native American, 0.7% Asian, and 1.9% from other races. The median household income was $37,917, and the median family income was $45,625.
Economy
Rosemary’s economy is largely based on agriculture and tourism. The town is home to several farms, which produce a variety of crops, including corn, soybeans, and tobacco. The town also has several small businesses, including a grocery store, a hardware store, and a few restaurants. Tourism is also an important part of the local economy, with visitors coming to the area to enjoy the scenic beauty of the Blue Ridge Mountains.
History
Rosemary was founded in 1845 by a group of settlers from Pennsylvania. The town was named after the wild rosemary plant that grew in the area. The town grew slowly over the years, and by the early 1900s, it had become a popular destination for tourists. The town was incorporated in 1911 and has remained relatively unchanged since then.
Rosemary is a small town with a rich history and a unique atmosphere. It is a great place to visit for those looking to experience the beauty of the Blue Ridge Mountains and the charm of a small town. The town has a strong agricultural base and is home to several small businesses, making it a great place to live and work.
Common Questions
What is Per Capita Income in South Rosemary?
Per Capita income in South Rosemary is $23,935.
What is the Median Family Income in South Rosemary?
Median Family Income in South Rosemary is $41,526.
What is the Median Household income in South Rosemary?
Median Household Income in South Rosemary is $41,875.
What is Income or Wage Gap in South Rosemary?
Income or Wage Gap in South Rosemary is 2.9%.
Women in South Rosemary earn 97.1 cents for every dollar earned by a man.
What is Inequality or Gini Index in South Rosemary?
Inequality or Gini Index in South Rosemary is 0.45.
What is the Total Population of South Rosemary?
Total Population of South Rosemary is 2,877.
What is the Total Male Population of South Rosemary?
Total Male Population of South Rosemary is 1,320.
What is the Total Female Population of South Rosemary?
Total Female Population of South Rosemary is 1,557.
What is the Ratio of Males per 100 Females in South Rosemary?
There are 84.78 Males per 100 Females in South Rosemary.
What is the Ratio of Females per 100 Males in South Rosemary?
There are 117.95 Females per 100 Males in South Rosemary.
What is the Median Population Age in South Rosemary?
Median Population Age in South Rosemary is 41.9 Years.
What is the Average Family Size in South Rosemary
Average Family Size in South Rosemary is 2.7 People.
What is the Average Household Size in South Rosemary
Average Household Size in South Rosemary is 2.5 People.
How Large is the Labor Force in South Rosemary?
There are 1,230 People in the Labor Forcein in South Rosemary.
What is the Percentage of People in the Labor Force in South Rosemary?
52.8% of People are in the Labor Force in South Rosemary.
What is the Unemployment Rate in South Rosemary?
Unemployment Rate in South Rosemary is 3.5%.