Laurel Park, NC Map & Demographics
Laurel Park Map
Laurel Park Overview
$50,560
PER CAPITA INCOME
$111,042
AVG FAMILY INCOME
$90,855
AVG HOUSEHOLD INCOME
26.4%
WAGE / INCOME GAP [ % ]
73.6¢/ $1
WAGE / INCOME GAP [ $ ]
0.43
INEQUALITY / GINI INDEX
2,615
TOTAL POPULATION
1,229
MALE POPULATION
1,386
FEMALE POPULATION
88.67
MALES / 100 FEMALES
112.77
FEMALES / 100 MALES
57.2
MEDIAN AGE
2.8
AVG FAMILY SIZE
2.2
AVG HOUSEHOLD SIZE
1,082
LABOR FORCE [ PEOPLE ]
47.1%
PERCENT IN LABOR FORCE
3.0%
UNEMPLOYMENT RATE
Laurel Park Area Codes
Income in Laurel Park
Income Overview in Laurel Park
Per Capita Income in Laurel Park is $50,560, while median incomes of families and households are $111,042 and $90,855 respectively.
| Characteristic | Number | Measure |
| Per Capita Income | 2,615 | $50,560 |
| Median Family Income | 763 | $111,042 |
| Mean Family Income | 763 | $138,334 |
| Median Household Income | 1,113 | $90,855 |
| Mean Household Income | 1,113 | $117,258 |
| Income Deficit | 763 | $0 |
| Wage / Income Gap (%) | 2,615 | 26.39% |
| Wage / Income Gap ($) | 2,615 | 73.61¢ per $1 |
| Gini / Inequality Index | 2,615 | 0.43 |
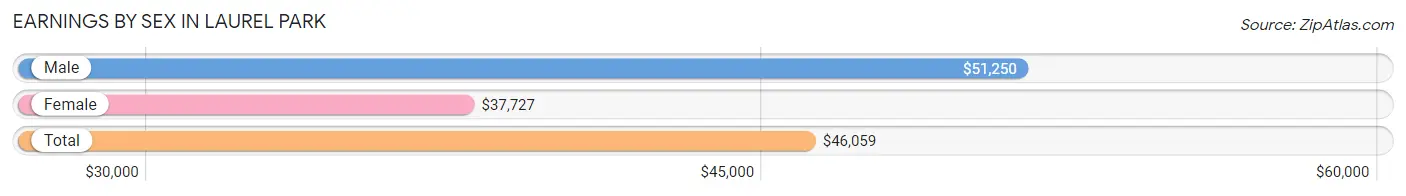
Earnings by Sex in Laurel Park
Average Earnings in Laurel Park are $46,059, $51,250 for men and $37,727 for women, a difference of 26.4%.
| Sex | Number | Average Earnings |
| Male | 626 (54.2%) | $51,250 |
| Female | 528 (45.8%) | $37,727 |
| Total | 1,154 (100.0%) | $46,059 |
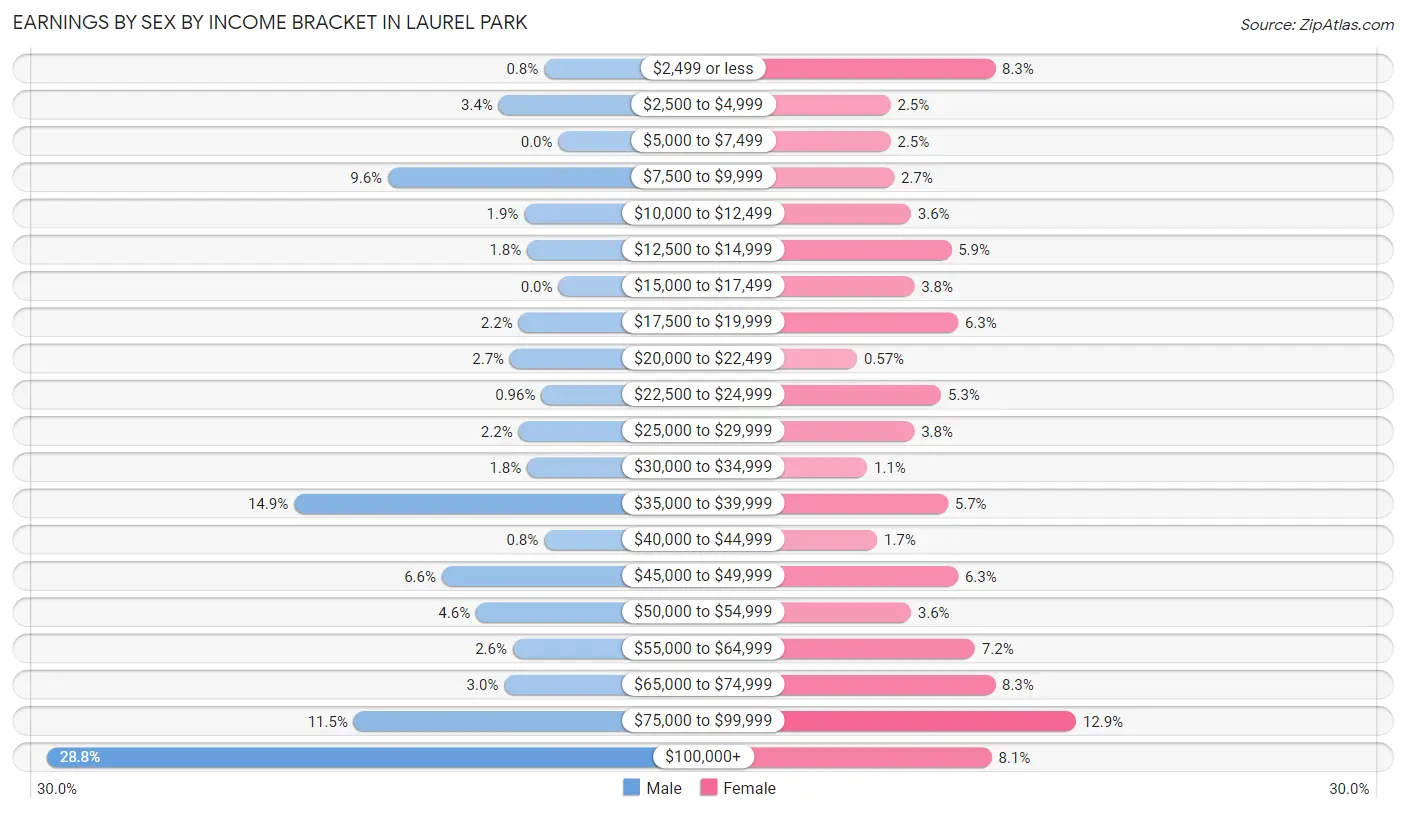
Earnings by Sex by Income Bracket in Laurel Park
The most common earnings brackets in Laurel Park are $100,000+ for men (180 | 28.7%) and $75,000 to $99,999 for women (68 | 12.9%).
| Income | Male | Female |
| $2,499 or less | 5 (0.8%) | 44 (8.3%) |
| $2,500 to $4,999 | 21 (3.4%) | 13 (2.5%) |
| $5,000 to $7,499 | 0 (0.0%) | 13 (2.5%) |
| $7,500 to $9,999 | 60 (9.6%) | 14 (2.6%) |
| $10,000 to $12,499 | 12 (1.9%) | 19 (3.6%) |
| $12,500 to $14,999 | 11 (1.8%) | 31 (5.9%) |
| $15,000 to $17,499 | 0 (0.0%) | 20 (3.8%) |
| $17,500 to $19,999 | 14 (2.2%) | 33 (6.2%) |
| $20,000 to $22,499 | 17 (2.7%) | 3 (0.6%) |
| $22,500 to $24,999 | 6 (1.0%) | 28 (5.3%) |
| $25,000 to $29,999 | 14 (2.2%) | 20 (3.8%) |
| $30,000 to $34,999 | 11 (1.8%) | 6 (1.1%) |
| $35,000 to $39,999 | 93 (14.9%) | 30 (5.7%) |
| $40,000 to $44,999 | 5 (0.8%) | 9 (1.7%) |
| $45,000 to $49,999 | 41 (6.6%) | 33 (6.2%) |
| $50,000 to $54,999 | 29 (4.6%) | 19 (3.6%) |
| $55,000 to $64,999 | 16 (2.6%) | 38 (7.2%) |
| $65,000 to $74,999 | 19 (3.0%) | 44 (8.3%) |
| $75,000 to $99,999 | 72 (11.5%) | 68 (12.9%) |
| $100,000+ | 180 (28.7%) | 43 (8.1%) |
| Total | 626 (100.0%) | 528 (100.0%) |
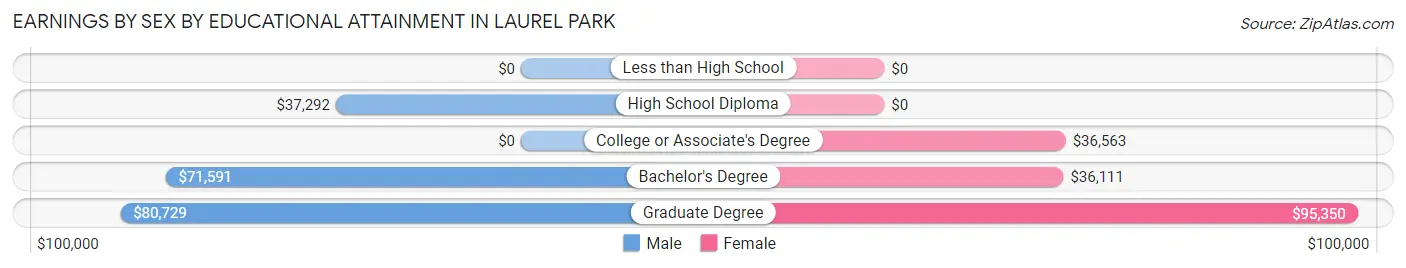
Earnings by Sex by Educational Attainment in Laurel Park
Average earnings in Laurel Park are $57,589 for men and $46,417 for women, a difference of 19.4%. Men with an educational attainment of graduate degree enjoy the highest average annual earnings of $80,729, while those with high school diploma education earn the least with $37,292. Women with an educational attainment of graduate degree earn the most with the average annual earnings of $95,350, while those with bachelor's degree education have the smallest earnings of $36,111.
| Educational Attainment | Male Income | Female Income |
| Less than High School | - | - |
| High School Diploma | $37,292 | $0 |
| College or Associate's Degree | - | - |
| Bachelor's Degree | $71,591 | $36,111 |
| Graduate Degree | $80,729 | $95,350 |
| Total | $57,589 | $46,417 |
Family Income in Laurel Park
Family Income Brackets in Laurel Park
According to the Laurel Park family income data, there are 204 families falling into the $100,000 to $149,999 income range, which is the most common income bracket and makes up 26.7% of all families. Conversely, the $25,000 to $34,999 income bracket is the least frequent group with only 5 families (0.7%) belonging to this category.
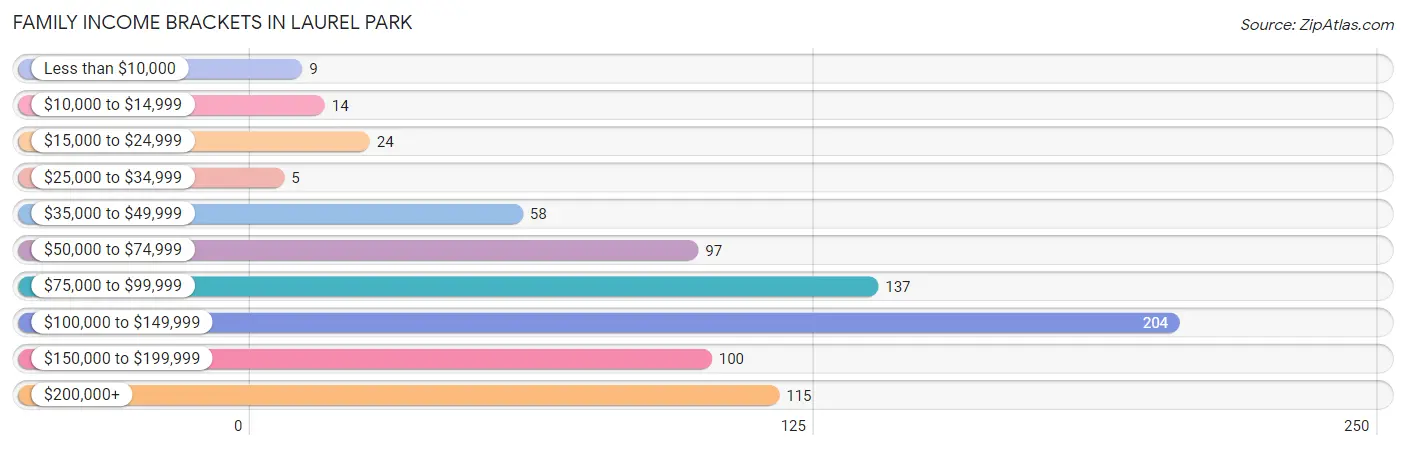
| Income Bracket | # Families | % Families |
| Less than $10,000 | 9 | 1.2% |
| $10,000 to $14,999 | 14 | 1.8% |
| $15,000 to $24,999 | 24 | 3.1% |
| $25,000 to $34,999 | 5 | 0.7% |
| $35,000 to $49,999 | 58 | 7.6% |
| $50,000 to $74,999 | 97 | 12.7% |
| $75,000 to $99,999 | 137 | 18.0% |
| $100,000 to $149,999 | 204 | 26.7% |
| $150,000 to $199,999 | 100 | 13.1% |
| $200,000+ | 115 | 15.1% |
Family Income by Famaliy Size in Laurel Park
4-person families (79 | 10.3%) account for the highest median family income in Laurel Park with $164,583 per family, while 2-person families (530 | 69.5%) have the highest median income of $51,500 per family member.
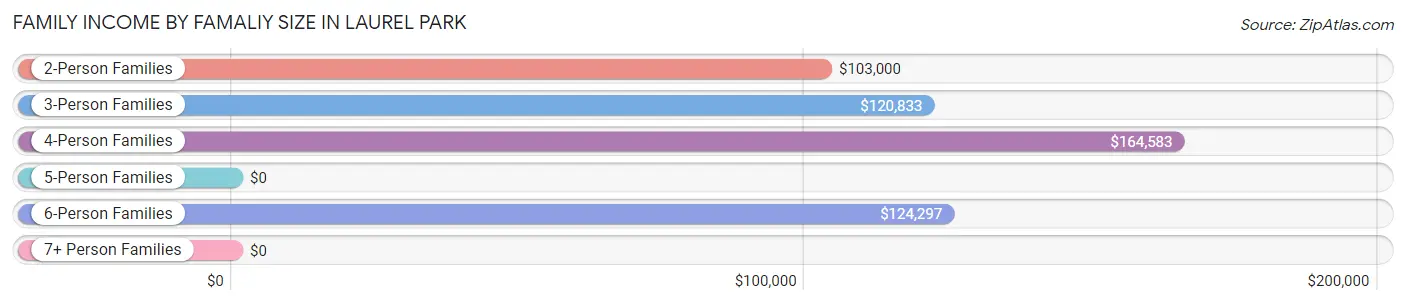
| Income Bracket | # Families | Median Income |
| 2-Person Families | 530 (69.5%) | $103,000 |
| 3-Person Families | 98 (12.8%) | $120,833 |
| 4-Person Families | 79 (10.3%) | $164,583 |
| 5-Person Families | 28 (3.7%) | $0 |
| 6-Person Families | 23 (3.0%) | $124,297 |
| 7+ Person Families | 5 (0.7%) | $0 |
| Total | 763 (100.0%) | $111,042 |
Family Income by Number of Earners in Laurel Park
The median family income in Laurel Park is $111,042, with families comprising 3+ earners (53) having the highest median family income of $168,162, while families with no earners (255) have the lowest median family income of $86,406, accounting for 7.0% and 33.4% of families, respectively.
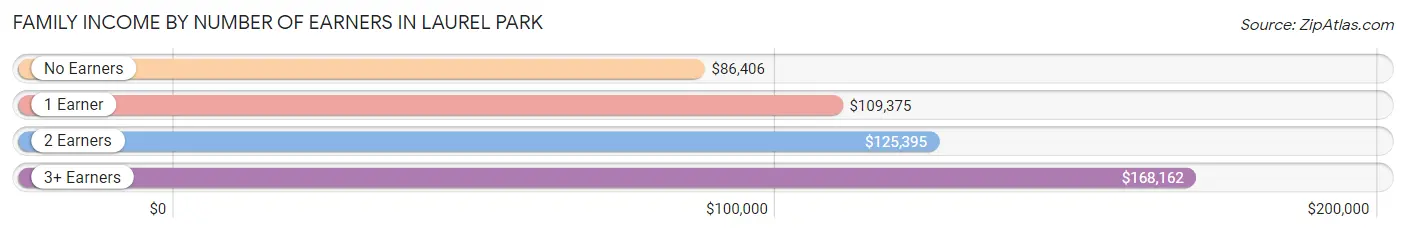
| Number of Earners | # Families | Median Income |
| No Earners | 255 (33.4%) | $86,406 |
| 1 Earner | 183 (24.0%) | $109,375 |
| 2 Earners | 272 (35.6%) | $125,395 |
| 3+ Earners | 53 (7.0%) | $168,162 |
| Total | 763 (100.0%) | $111,042 |
Household Income in Laurel Park
Household Income Brackets in Laurel Park
With 255 households falling in the category, the $100,000 to $149,999 income range is the most frequent in Laurel Park, accounting for 22.9% of all households. In contrast, only 14 households (1.3%) fall into the $10,000 to $14,999 income bracket, making it the least populous group.
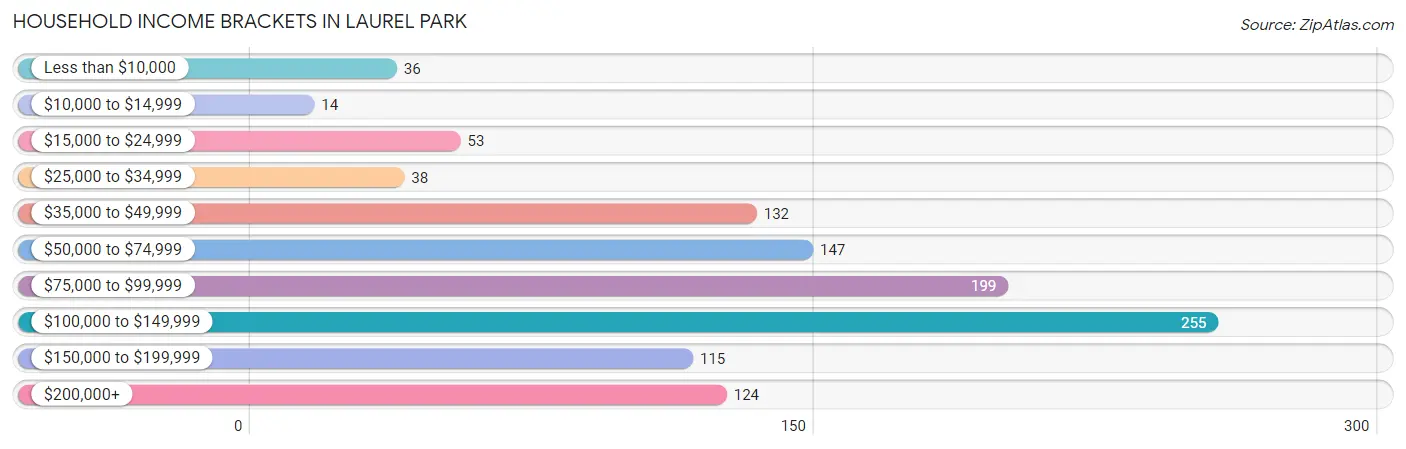
| Income Bracket | # Households | % Households |
| Less than $10,000 | 36 | 3.2% |
| $10,000 to $14,999 | 14 | 1.3% |
| $15,000 to $24,999 | 53 | 4.8% |
| $25,000 to $34,999 | 38 | 3.4% |
| $35,000 to $49,999 | 132 | 11.9% |
| $50,000 to $74,999 | 147 | 13.2% |
| $75,000 to $99,999 | 199 | 17.9% |
| $100,000 to $149,999 | 255 | 22.9% |
| $150,000 to $199,999 | 115 | 10.3% |
| $200,000+ | 124 | 11.1% |
Household Income by Householder Age in Laurel Park
The median household income in Laurel Park is $90,855, with the highest median household income of $122,891 found in the 25 to 44 years age bracket for the primary householder. A total of 143 households (12.9%) fall into this category.
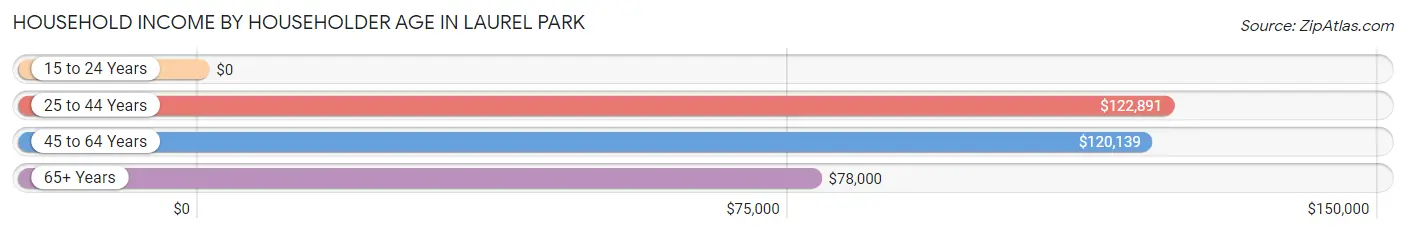
| Income Bracket | # Households | Median Income |
| 15 to 24 Years | 0 (0.0%) | $0 |
| 25 to 44 Years | 143 (12.9%) | $122,891 |
| 45 to 64 Years | 388 (34.9%) | $120,139 |
| 65+ Years | 582 (52.3%) | $78,000 |
| Total | 1,113 (100.0%) | $90,855 |
Poverty in Laurel Park
Income Below Poverty by Sex and Age in Laurel Park
With 6.7% poverty level for males and 5.4% for females among the residents of Laurel Park, 16 and 17 year old males and 35 to 44 year old females are the most vulnerable to poverty, with 7 males (43.8%) and 20 females (19.2%) in their respective age groups living below the poverty level.
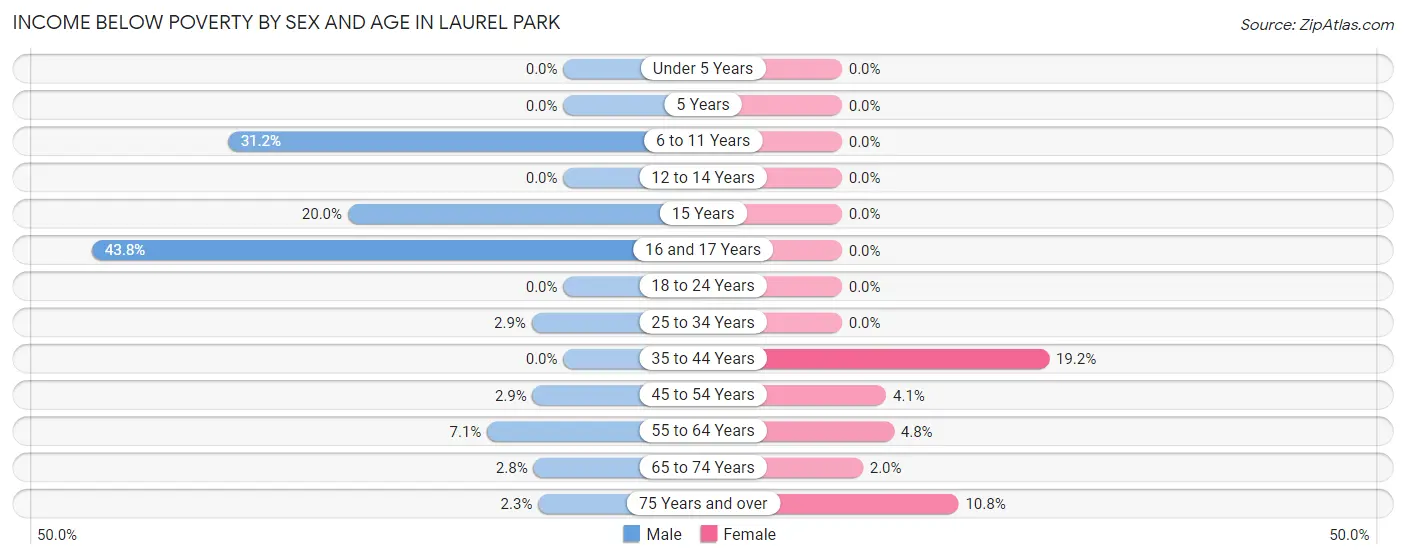
| Age Bracket | Male | Female |
| Under 5 Years | 0 (0.0%) | 0 (0.0%) |
| 5 Years | 0 (0.0%) | 0 (0.0%) |
| 6 to 11 Years | 38 (31.1%) | 0 (0.0%) |
| 12 to 14 Years | 0 (0.0%) | 0 (0.0%) |
| 15 Years | 6 (20.0%) | 0 (0.0%) |
| 16 and 17 Years | 7 (43.8%) | 0 (0.0%) |
| 18 to 24 Years | 0 (0.0%) | 0 (0.0%) |
| 25 to 34 Years | 2 (2.9%) | 0 (0.0%) |
| 35 to 44 Years | 0 (0.0%) | 20 (19.2%) |
| 45 to 54 Years | 4 (2.9%) | 9 (4.1%) |
| 55 to 64 Years | 13 (7.1%) | 10 (4.8%) |
| 65 to 74 Years | 7 (2.8%) | 5 (1.9%) |
| 75 Years and over | 4 (2.3%) | 26 (10.8%) |
| Total | 81 (6.7%) | 70 (5.4%) |
Income Above Poverty by Sex and Age in Laurel Park
According to the poverty statistics in Laurel Park, males aged under 5 years and females aged under 5 years are the age groups that are most secure financially, with 100.0% of males and 100.0% of females in these age groups living above the poverty line.
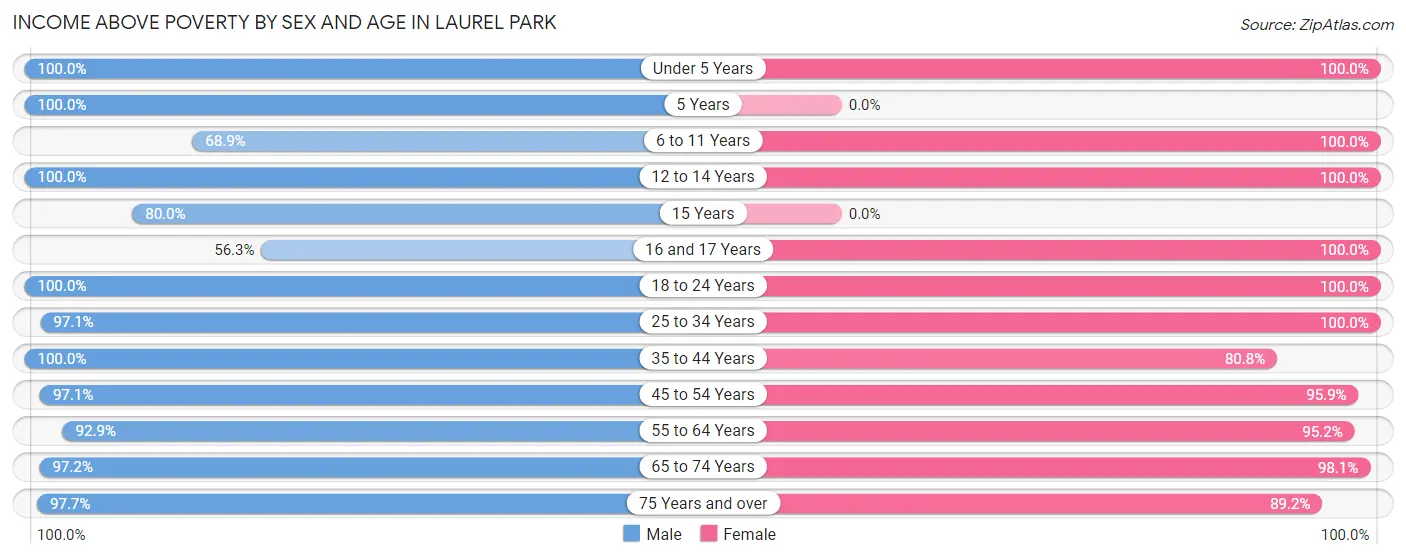
| Age Bracket | Male | Female |
| Under 5 Years | 4 (100.0%) | 47 (100.0%) |
| 5 Years | 18 (100.0%) | 0 (0.0%) |
| 6 to 11 Years | 84 (68.9%) | 44 (100.0%) |
| 12 to 14 Years | 25 (100.0%) | 27 (100.0%) |
| 15 Years | 24 (80.0%) | 0 (0.0%) |
| 16 and 17 Years | 9 (56.2%) | 29 (100.0%) |
| 18 to 24 Years | 57 (100.0%) | 57 (100.0%) |
| 25 to 34 Years | 66 (97.1%) | 72 (100.0%) |
| 35 to 44 Years | 117 (100.0%) | 84 (80.8%) |
| 45 to 54 Years | 136 (97.1%) | 210 (95.9%) |
| 55 to 64 Years | 171 (92.9%) | 197 (95.2%) |
| 65 to 74 Years | 246 (97.2%) | 252 (98.1%) |
| 75 Years and over | 168 (97.7%) | 214 (89.2%) |
| Total | 1,125 (93.3%) | 1,233 (94.6%) |
Income Below Poverty Among Married-Couple Families in Laurel Park
The poverty statistics for married-couple families in Laurel Park show that 2.4% or 17 of the total 696 families live below the poverty line. Families with no children have the highest poverty rate of 3.0%, comprising of 17 families. On the other hand, families with 1 or 2 children have the lowest poverty rate of 0.0%, which includes 0 families.
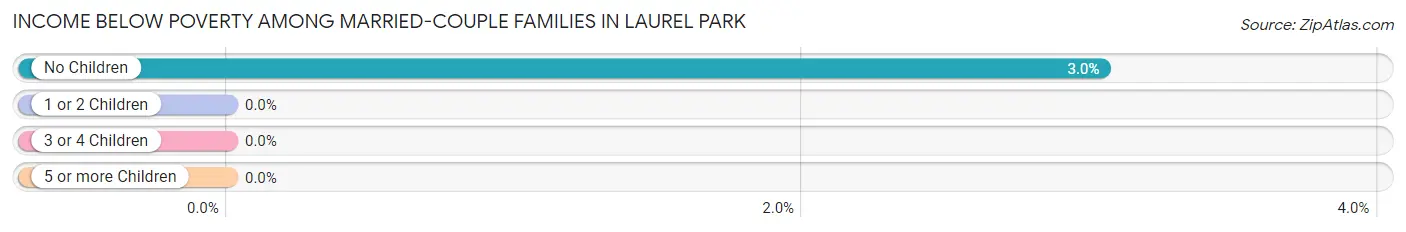
| Children | Above Poverty | Below Poverty |
| No Children | 542 (97.0%) | 17 (3.0%) |
| 1 or 2 Children | 107 (100.0%) | 0 (0.0%) |
| 3 or 4 Children | 30 (100.0%) | 0 (0.0%) |
| 5 or more Children | 0 (0.0%) | 0 (0.0%) |
| Total | 679 (97.6%) | 17 (2.4%) |
Income Below Poverty Among Single-Parent Households in Laurel Park
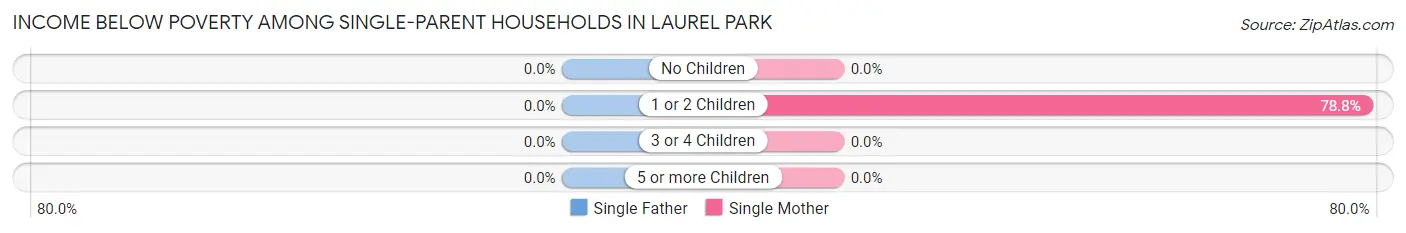
| Children | Single Father | Single Mother |
| No Children | 0 (0.0%) | 0 (0.0%) |
| 1 or 2 Children | 0 (0.0%) | 26 (78.8%) |
| 3 or 4 Children | 0 (0.0%) | 0 (0.0%) |
| 5 or more Children | 0 (0.0%) | 0 (0.0%) |
| Total | 0 (0.0%) | 26 (41.3%) |
Income Below Poverty Among Married-Couple vs Single-Parent Households in Laurel Park
The poverty data for Laurel Park shows that 17 of the married-couple family households (2.4%) and 26 of the single-parent households (38.8%) are living below the poverty level. Within the married-couple family households, those with no children have the highest poverty rate, with 17 households (3.0%) falling below the poverty line. Among the single-parent households, those with 1 or 2 children have the highest poverty rate, with 26 household (78.8%) living below poverty.
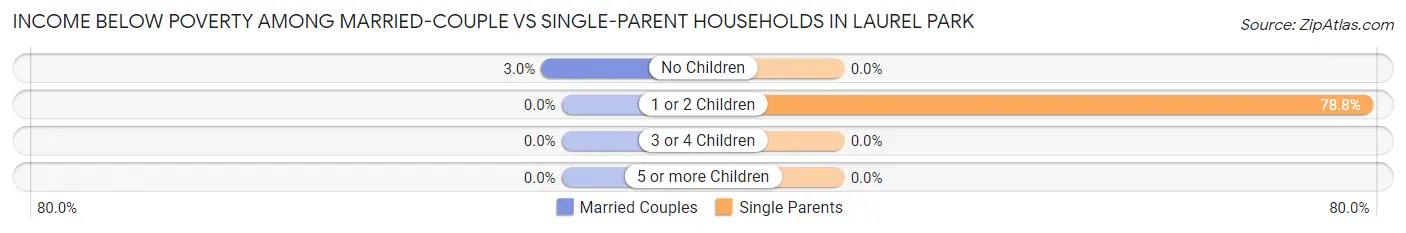
| Children | Married-Couple Families | Single-Parent Households |
| No Children | 17 (3.0%) | 0 (0.0%) |
| 1 or 2 Children | 0 (0.0%) | 26 (78.8%) |
| 3 or 4 Children | 0 (0.0%) | 0 (0.0%) |
| 5 or more Children | 0 (0.0%) | 0 (0.0%) |
| Total | 17 (2.4%) | 26 (38.8%) |
Race in Laurel Park
The most populous races in Laurel Park are White / Caucasian (2,485 | 95.0%), Two or more Races (62 | 2.4%), and Asian (33 | 1.3%).
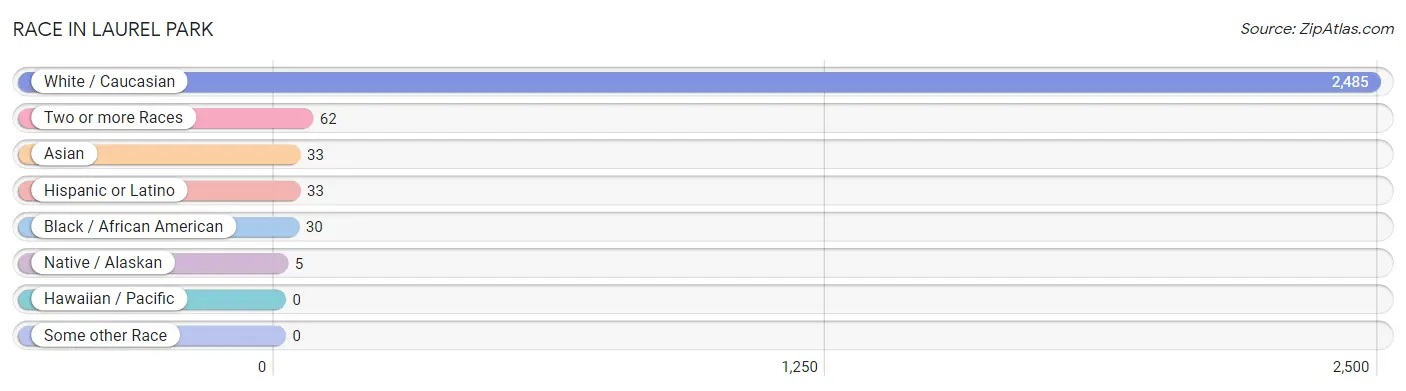
| Race | # Population | % Population |
| Asian | 33 | 1.3% |
| Black / African American | 30 | 1.1% |
| Hawaiian / Pacific | 0 | 0.0% |
| Hispanic or Latino | 33 | 1.3% |
| Native / Alaskan | 5 | 0.2% |
| White / Caucasian | 2,485 | 95.0% |
| Two or more Races | 62 | 2.4% |
| Some other Race | 0 | 0.0% |
| Total | 2,615 | 100.0% |
Ancestry in Laurel Park
The most populous ancestries reported in Laurel Park are English (587 | 22.5%), German (440 | 16.8%), Irish (306 | 11.7%), Italian (155 | 5.9%), and Scottish (144 | 5.5%), together accounting for 62.4% of all Laurel Park residents.
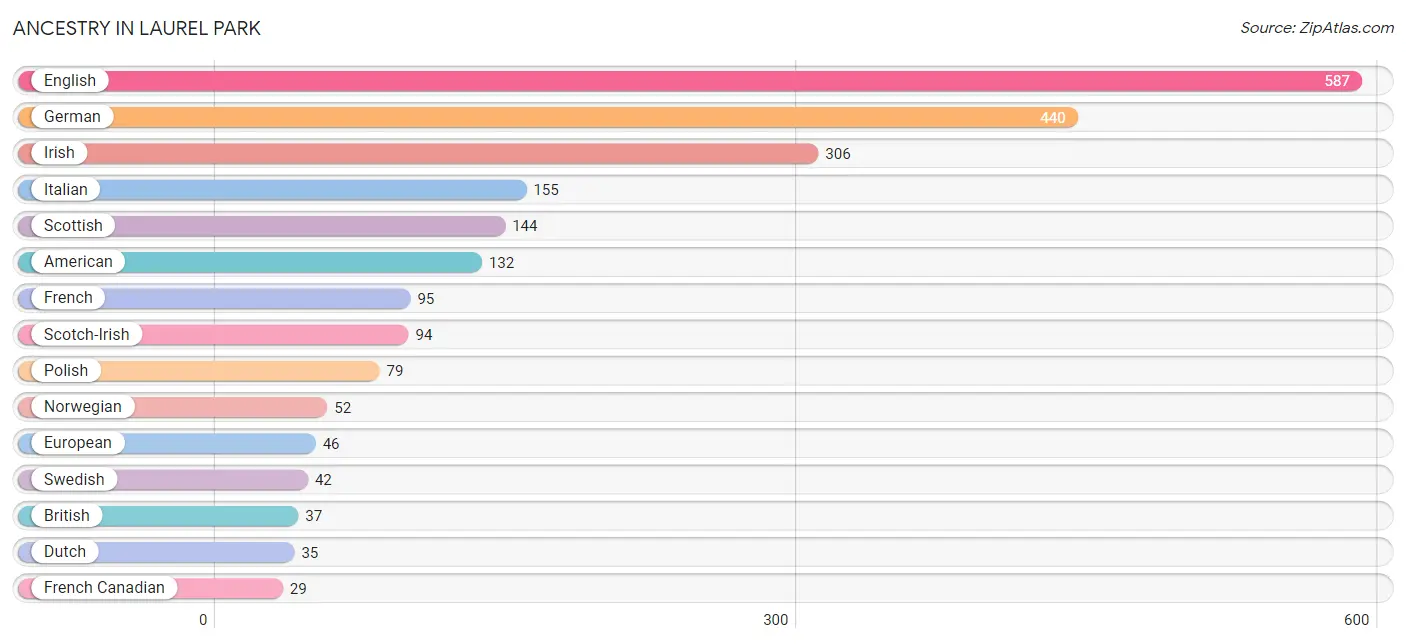
| Ancestry | # Population | % Population |
| American | 132 | 5.1% |
| Argentinean | 6 | 0.2% |
| Australian | 5 | 0.2% |
| Austrian | 15 | 0.6% |
| Bhutanese | 3 | 0.1% |
| British | 37 | 1.4% |
| Burmese | 2 | 0.1% |
| Canadian | 1 | 0.0% |
| Central American | 16 | 0.6% |
| Creek | 5 | 0.2% |
| Croatian | 5 | 0.2% |
| Czech | 9 | 0.3% |
| Czechoslovakian | 3 | 0.1% |
| Danish | 14 | 0.5% |
| Dutch | 35 | 1.3% |
| Eastern European | 16 | 0.6% |
| English | 587 | 22.5% |
| European | 46 | 1.8% |
| Finnish | 6 | 0.2% |
| French | 95 | 3.6% |
| French Canadian | 29 | 1.1% |
| German | 440 | 16.8% |
| Greek | 10 | 0.4% |
| Guatemalan | 16 | 0.6% |
| Hungarian | 5 | 0.2% |
| Indian (Asian) | 13 | 0.5% |
| Iranian | 3 | 0.1% |
| Irish | 306 | 11.7% |
| Italian | 155 | 5.9% |
| Korean | 28 | 1.1% |
| Lithuanian | 8 | 0.3% |
| Mexican | 5 | 0.2% |
| Northern European | 9 | 0.3% |
| Norwegian | 52 | 2.0% |
| Polish | 79 | 3.0% |
| Portuguese | 5 | 0.2% |
| Scandinavian | 16 | 0.6% |
| Scotch-Irish | 94 | 3.6% |
| Scottish | 144 | 5.5% |
| Serbian | 8 | 0.3% |
| Slovak | 4 | 0.2% |
| South American | 6 | 0.2% |
| Swedish | 42 | 1.6% |
| Swiss | 17 | 0.6% |
| Ukrainian | 10 | 0.4% |
| Welsh | 26 | 1.0% | View All 46 Rows |
Immigrants in Laurel Park
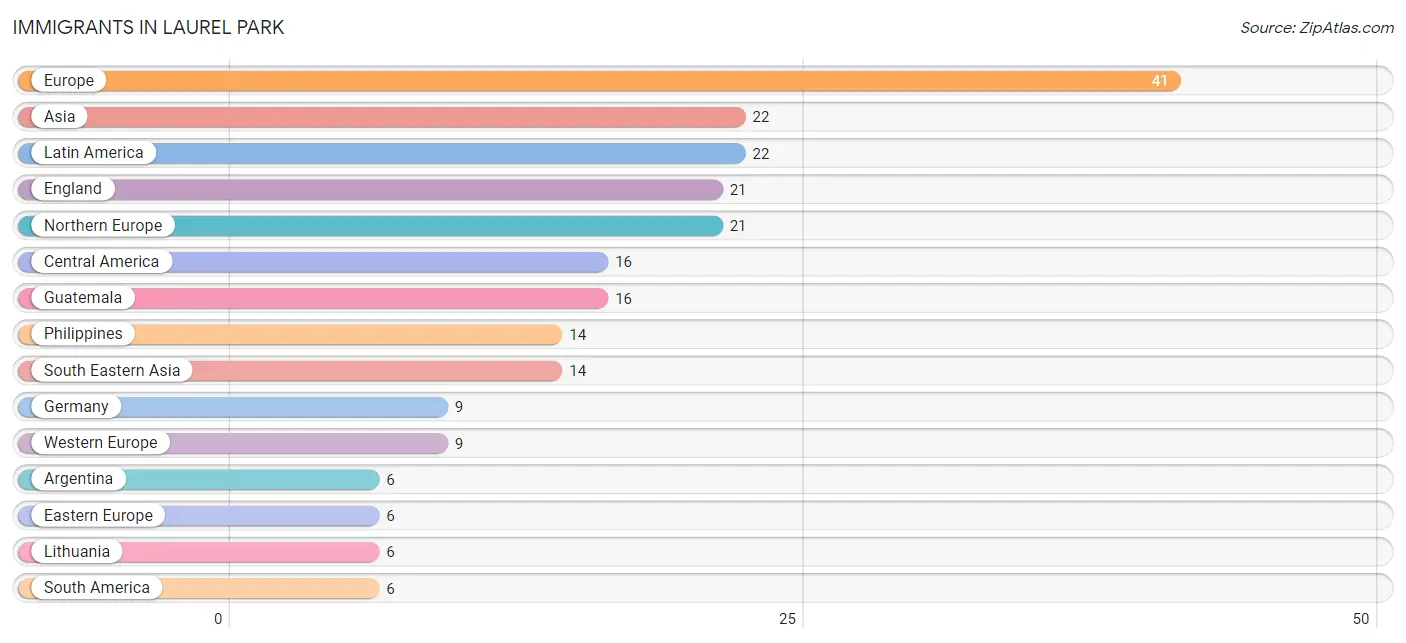
The most numerous immigrant groups reported in Laurel Park came from Europe (41 | 1.6%), Asia (22 | 0.8%), Latin America (22 | 0.8%), England (21 | 0.8%), and Northern Europe (21 | 0.8%), together accounting for 4.8% of all Laurel Park residents.
| Immigration Origin | # Population | % Population |
| Argentina | 6 | 0.2% |
| Asia | 22 | 0.8% |
| Canada | 3 | 0.1% |
| Central America | 16 | 0.6% |
| Eastern Asia | 5 | 0.2% |
| Eastern Europe | 6 | 0.2% |
| England | 21 | 0.8% |
| Europe | 41 | 1.6% |
| Germany | 9 | 0.3% |
| Guatemala | 16 | 0.6% |
| Iran | 3 | 0.1% |
| Italy | 5 | 0.2% |
| Japan | 3 | 0.1% |
| Korea | 2 | 0.1% |
| Latin America | 22 | 0.8% |
| Lithuania | 6 | 0.2% |
| Northern Europe | 21 | 0.8% |
| Philippines | 14 | 0.5% |
| South America | 6 | 0.2% |
| South Central Asia | 3 | 0.1% |
| South Eastern Asia | 14 | 0.5% |
| Southern Europe | 5 | 0.2% |
| Western Europe | 9 | 0.3% | View All 23 Rows |
Sex and Age in Laurel Park
Sex and Age in Laurel Park
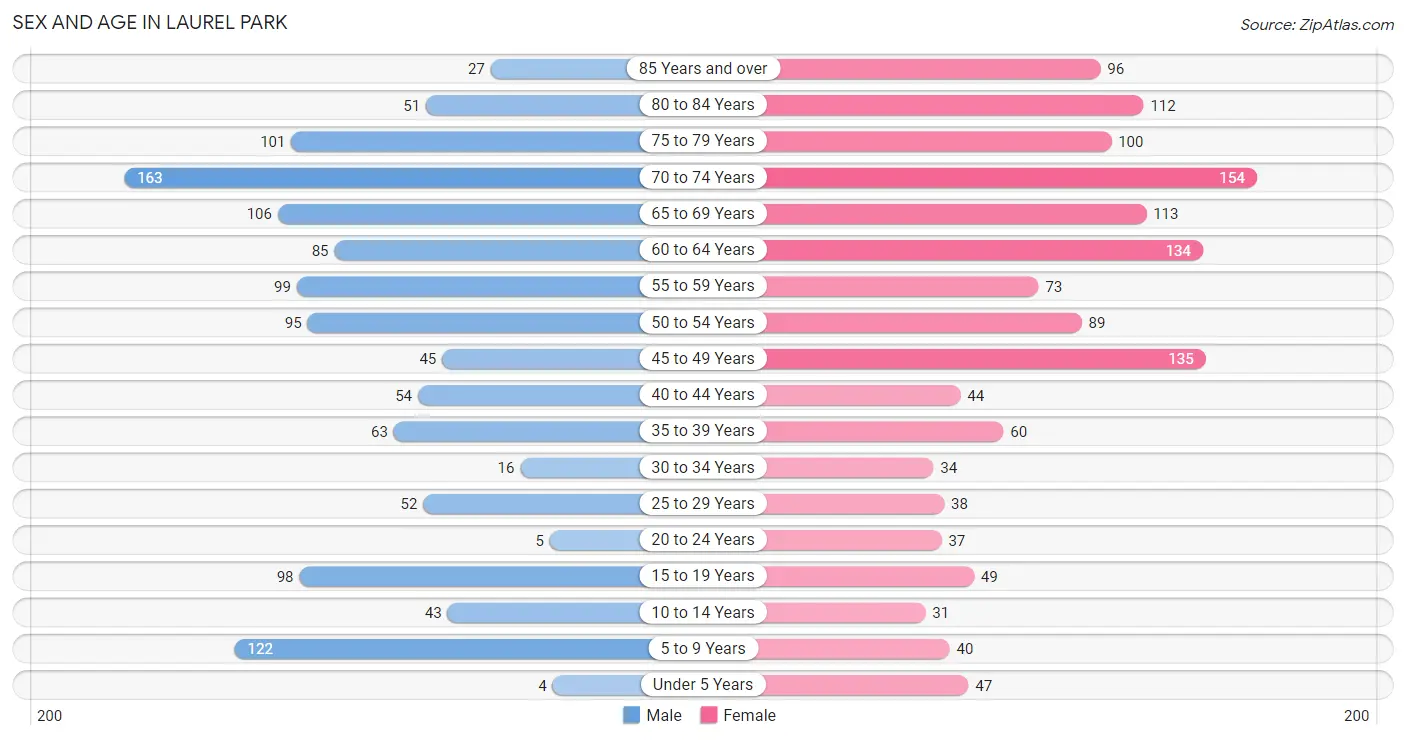
The most populous age groups in Laurel Park are 70 to 74 Years (163 | 13.3%) for men and 70 to 74 Years (154 | 11.1%) for women.
| Age Bracket | Male | Female |
| Under 5 Years | 4 (0.3%) | 47 (3.4%) |
| 5 to 9 Years | 122 (9.9%) | 40 (2.9%) |
| 10 to 14 Years | 43 (3.5%) | 31 (2.2%) |
| 15 to 19 Years | 98 (8.0%) | 49 (3.5%) |
| 20 to 24 Years | 5 (0.4%) | 37 (2.7%) |
| 25 to 29 Years | 52 (4.2%) | 38 (2.7%) |
| 30 to 34 Years | 16 (1.3%) | 34 (2.5%) |
| 35 to 39 Years | 63 (5.1%) | 60 (4.3%) |
| 40 to 44 Years | 54 (4.4%) | 44 (3.2%) |
| 45 to 49 Years | 45 (3.7%) | 135 (9.7%) |
| 50 to 54 Years | 95 (7.7%) | 89 (6.4%) |
| 55 to 59 Years | 99 (8.1%) | 73 (5.3%) |
| 60 to 64 Years | 85 (6.9%) | 134 (9.7%) |
| 65 to 69 Years | 106 (8.6%) | 113 (8.2%) |
| 70 to 74 Years | 163 (13.3%) | 154 (11.1%) |
| 75 to 79 Years | 101 (8.2%) | 100 (7.2%) |
| 80 to 84 Years | 51 (4.2%) | 112 (8.1%) |
| 85 Years and over | 27 (2.2%) | 96 (6.9%) |
| Total | 1,229 (100.0%) | 1,386 (100.0%) |
Families and Households in Laurel Park
Median Family Size in Laurel Park
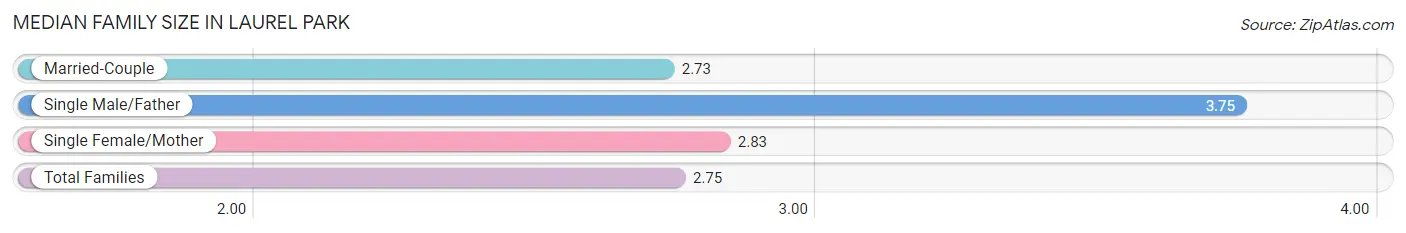
The median family size in Laurel Park is 2.75 persons per family, with single male/father families (4 | 0.5%) accounting for the largest median family size of 3.75 persons per family. On the other hand, married-couple families (696 | 91.2%) represent the smallest median family size with 2.73 persons per family.
| Family Type | # Families | Family Size |
| Married-Couple | 696 (91.2%) | 2.73 |
| Single Male/Father | 4 (0.5%) | 3.75 |
| Single Female/Mother | 63 (8.3%) | 2.83 |
| Total Families | 763 (100.0%) | 2.75 |
Median Household Size in Laurel Park
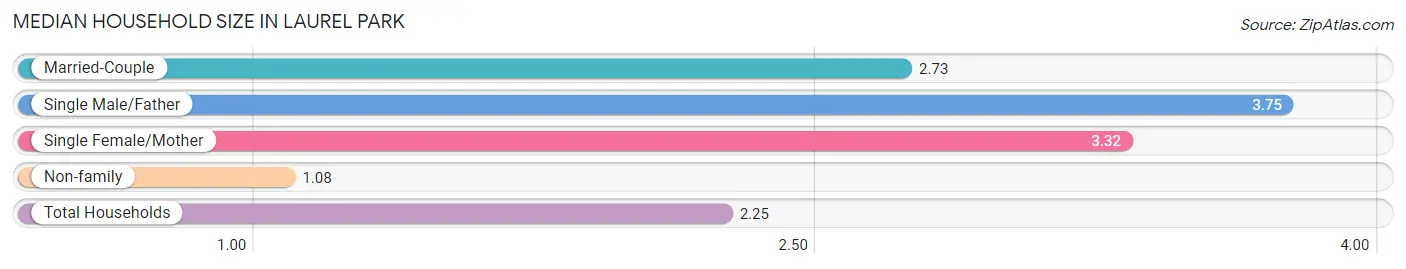
The median household size in Laurel Park is 2.25 persons per household, with single male/father households (4 | 0.4%) accounting for the largest median household size of 3.75 persons per household. non-family households (350 | 31.5%) represent the smallest median household size with 1.08 persons per household.
| Household Type | # Households | Household Size |
| Married-Couple | 696 (62.5%) | 2.73 |
| Single Male/Father | 4 (0.4%) | 3.75 |
| Single Female/Mother | 63 (5.7%) | 3.32 |
| Non-family | 350 (31.5%) | 1.08 |
| Total Households | 1,113 (100.0%) | 2.25 |
Household Size by Marriage Status in Laurel Park
Out of a total of 1,113 households in Laurel Park, 763 (68.5%) are family households, while 350 (31.5%) are nonfamily households. The most numerous type of family households are 2-person households, comprising 516, and the most common type of nonfamily households are 1-person households, comprising 325.
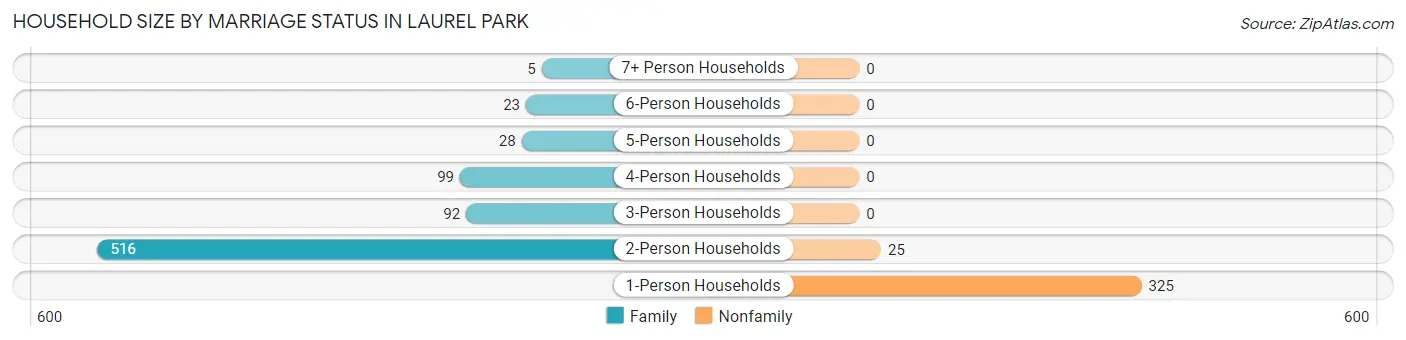
| Household Size | Family Households | Nonfamily Households |
| 1-Person Households | - | 325 (29.2%) |
| 2-Person Households | 516 (46.4%) | 25 (2.2%) |
| 3-Person Households | 92 (8.3%) | 0 (0.0%) |
| 4-Person Households | 99 (8.9%) | 0 (0.0%) |
| 5-Person Households | 28 (2.5%) | 0 (0.0%) |
| 6-Person Households | 23 (2.1%) | 0 (0.0%) |
| 7+ Person Households | 5 (0.4%) | 0 (0.0%) |
| Total | 763 (68.5%) | 350 (31.5%) |
Female Fertility in Laurel Park
Fertility by Age in Laurel Park
| Age Bracket | Women with Births | Births / 1,000 Women |
| 15 to 19 years | 0 (0.0%) | 0.0 |
| 20 to 34 years | 0 (0.0%) | 0.0 |
| 35 to 50 years | 0 (0.0%) | 0.0 |
| Total | 0 (0.0%) | 0.0 |
Fertility by Age by Marriage Status in Laurel Park
| Age Bracket | Married | Unmarried |
| 15 to 19 years | 0 (0.0%) | 0 (0.0%) |
| 20 to 34 years | 0 (0.0%) | 0 (0.0%) |
| 35 to 50 years | 0 (0.0%) | 0 (0.0%) |
| Total | 0 (0.0%) | 0 (0.0%) |
Fertility by Education in Laurel Park
| Educational Attainment | Women with Births | Births / 1,000 Women |
| Less than High School | 0 (0.0%) | 0.0 |
| High School Diploma | 0 (0.0%) | 0.0 |
| College or Associate's Degree | 0 (0.0%) | 0.0 |
| Bachelor's Degree | 0 (0.0%) | 0.0 |
| Graduate Degree | 0 (0.0%) | 0.0 |
| Total | 0 (0.0%) | 0.0 |
Fertility by Education by Marriage Status in Laurel Park
| Educational Attainment | Married | Unmarried |
| Less than High School | 0 (0.0%) | 0 (0.0%) |
| High School Diploma | 0 (0.0%) | 0 (0.0%) |
| College or Associate's Degree | 0 (0.0%) | 0 (0.0%) |
| Bachelor's Degree | 0 (0.0%) | 0 (0.0%) |
| Graduate Degree | 0 (0.0%) | 0 (0.0%) |
| Total | 0 (0.0%) | 0 (0.0%) |
Employment Characteristics in Laurel Park
Employment by Class of Employer in Laurel Park
Among the 1,036 employed individuals in Laurel Park, private company employees (692 | 66.8%), not-for-profit organizations (92 | 8.9%), and self-employed (not incorporated) (80 | 7.7%) make up the most common classes of employment.
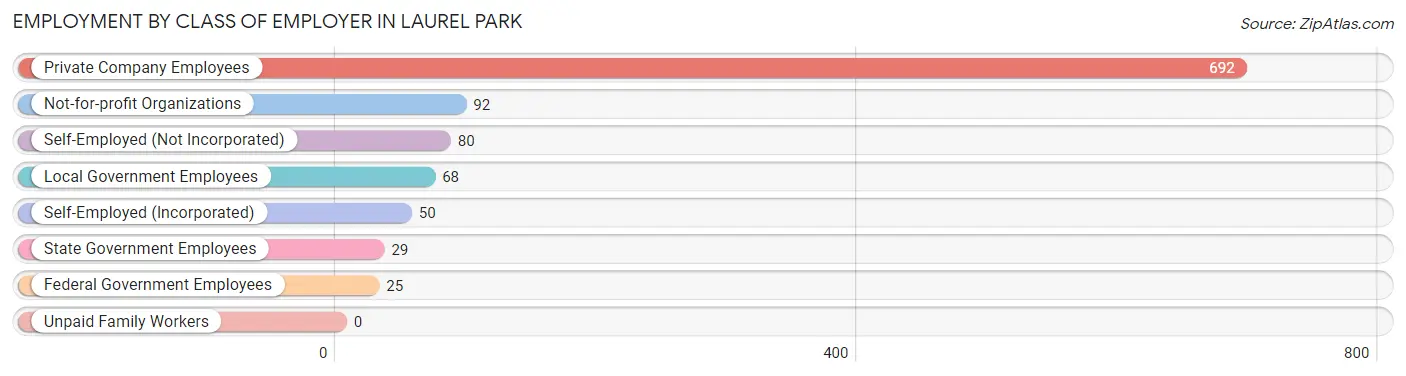
| Employer Class | # Employees | % Employees |
| Private Company Employees | 692 | 66.8% |
| Self-Employed (Incorporated) | 50 | 4.8% |
| Self-Employed (Not Incorporated) | 80 | 7.7% |
| Not-for-profit Organizations | 92 | 8.9% |
| Local Government Employees | 68 | 6.6% |
| State Government Employees | 29 | 2.8% |
| Federal Government Employees | 25 | 2.4% |
| Unpaid Family Workers | 0 | 0.0% |
| Total | 1,036 | 100.0% |
Employment Status by Age in Laurel Park
According to the labor force statistics for Laurel Park, out of the total population over 16 years of age (2,298), 47.1% or 1,082 individuals are in the labor force, with 3.0% or 32 of them unemployed. The age group with the highest labor force participation rate is 25 to 29 years, with 87.8% or 79 individuals in the labor force. Within the labor force, the 55 to 59 years age range has the highest percentage of unemployed individuals, with 8.5% or 10 of them being unemployed.
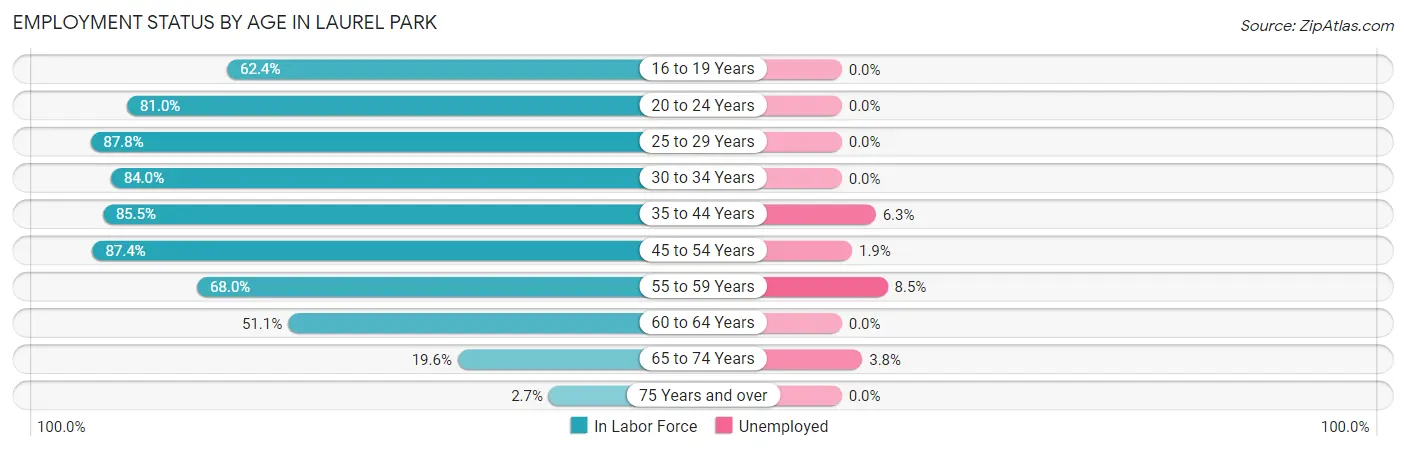
| Age Bracket | In Labor Force | Unemployed |
| 16 to 19 Years | 73 (62.4%) | 0 (0.0%) |
| 20 to 24 Years | 34 (81.0%) | 0 (0.0%) |
| 25 to 29 Years | 79 (87.8%) | 0 (0.0%) |
| 30 to 34 Years | 42 (84.0%) | 0 (0.0%) |
| 35 to 44 Years | 189 (85.5%) | 12 (6.3%) |
| 45 to 54 Years | 318 (87.4%) | 6 (1.9%) |
| 55 to 59 Years | 117 (68.0%) | 10 (8.5%) |
| 60 to 64 Years | 112 (51.1%) | 0 (0.0%) |
| 65 to 74 Years | 105 (19.6%) | 4 (3.8%) |
| 75 Years and over | 13 (2.7%) | 0 (0.0%) |
| Total | 1,082 (47.1%) | 32 (3.0%) |
Employment Status by Educational Attainment in Laurel Park
According to labor force statistics for Laurel Park, 76.8% of individuals (857) out of the total population between 25 and 64 years of age (1,116) are in the labor force, with 3.3% or 28 of them being unemployed. The group with the highest labor force participation rate are those with the educational attainment of college / associate degree, with 88.6% or 287 individuals in the labor force. Within the labor force, individuals with bachelor's degree or higher education have the highest percentage of unemployment, with 5.8% or 28 of them being unemployed.
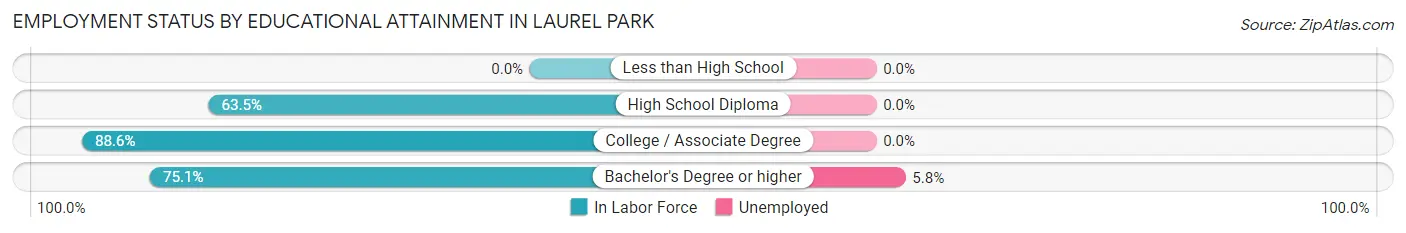
| Educational Attainment | In Labor Force | Unemployed |
| Less than High School | 0 (0.0%) | 0 (0.0%) |
| High School Diploma | 87 (63.5%) | 0 (0.0%) |
| College / Associate Degree | 287 (88.6%) | 0 (0.0%) |
| Bachelor's Degree or higher | 483 (75.1%) | 37 (5.8%) |
| Total | 857 (76.8%) | 37 (3.3%) |
Employment Occupations by Sex in Laurel Park
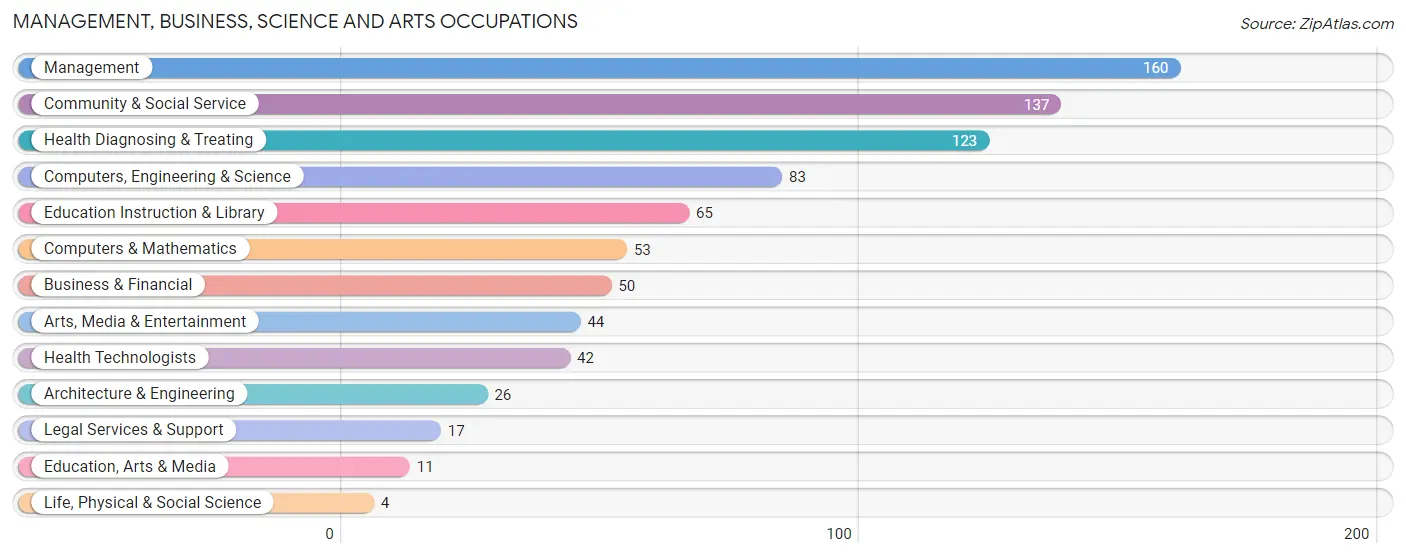
Management, Business, Science and Arts Occupations
The most common Management, Business, Science and Arts occupations in Laurel Park are Management (160 | 15.2%), Community & Social Service (137 | 13.1%), Health Diagnosing & Treating (123 | 11.7%), Computers, Engineering & Science (83 | 7.9%), and Education Instruction & Library (65 | 6.2%).
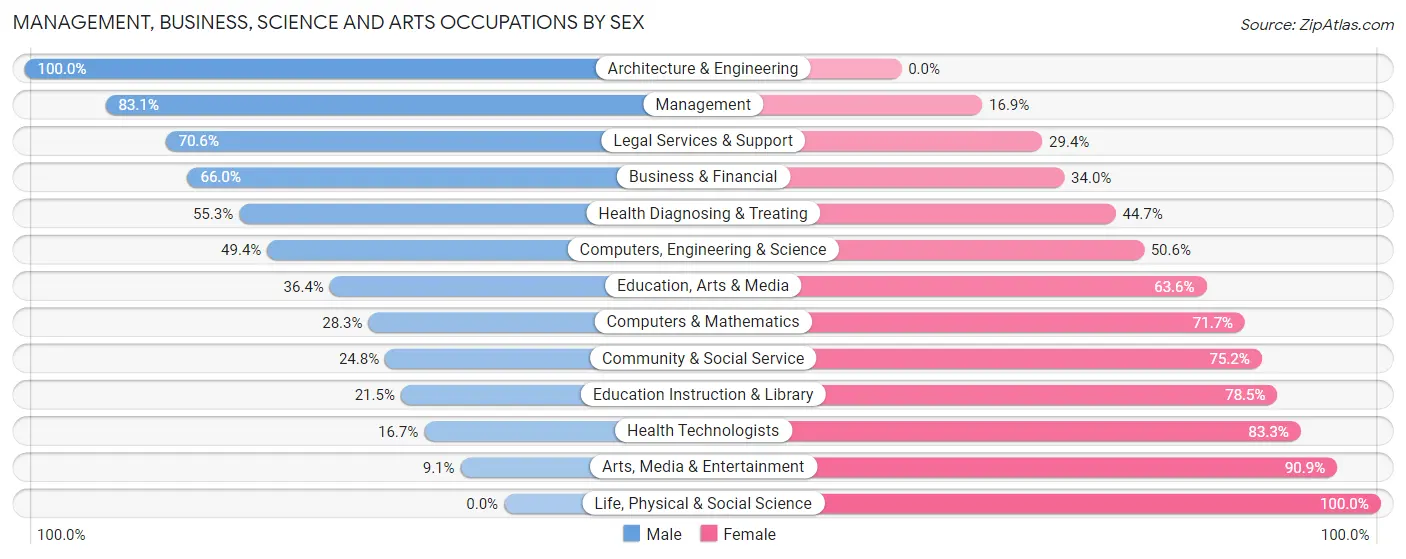
Management, Business, Science and Arts Occupations by Sex
Within the Management, Business, Science and Arts occupations in Laurel Park, the most male-oriented occupations are Architecture & Engineering (100.0%), Management (83.1%), and Legal Services & Support (70.6%), while the most female-oriented occupations are Life, Physical & Social Science (100.0%), Arts, Media & Entertainment (90.9%), and Health Technologists (83.3%).
| Occupation | Male | Female |
| Management | 133 (83.1%) | 27 (16.9%) |
| Business & Financial | 33 (66.0%) | 17 (34.0%) |
| Computers, Engineering & Science | 41 (49.4%) | 42 (50.6%) |
| Computers & Mathematics | 15 (28.3%) | 38 (71.7%) |
| Architecture & Engineering | 26 (100.0%) | 0 (0.0%) |
| Life, Physical & Social Science | 0 (0.0%) | 4 (100.0%) |
| Community & Social Service | 34 (24.8%) | 103 (75.2%) |
| Education, Arts & Media | 4 (36.4%) | 7 (63.6%) |
| Legal Services & Support | 12 (70.6%) | 5 (29.4%) |
| Education Instruction & Library | 14 (21.5%) | 51 (78.5%) |
| Arts, Media & Entertainment | 4 (9.1%) | 40 (90.9%) |
| Health Diagnosing & Treating | 68 (55.3%) | 55 (44.7%) |
| Health Technologists | 7 (16.7%) | 35 (83.3%) |
| Total (Category) | 309 (55.9%) | 244 (44.1%) |
| Total (Overall) | 563 (53.6%) | 487 (46.4%) |
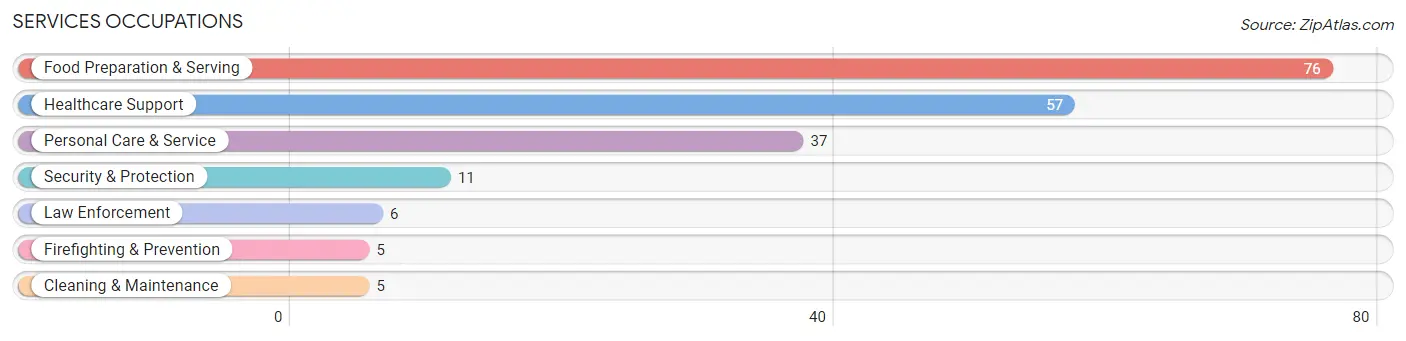
Services Occupations
The most common Services occupations in Laurel Park are Food Preparation & Serving (76 | 7.2%), Healthcare Support (57 | 5.4%), Personal Care & Service (37 | 3.5%), Security & Protection (11 | 1.1%), and Law Enforcement (6 | 0.6%).
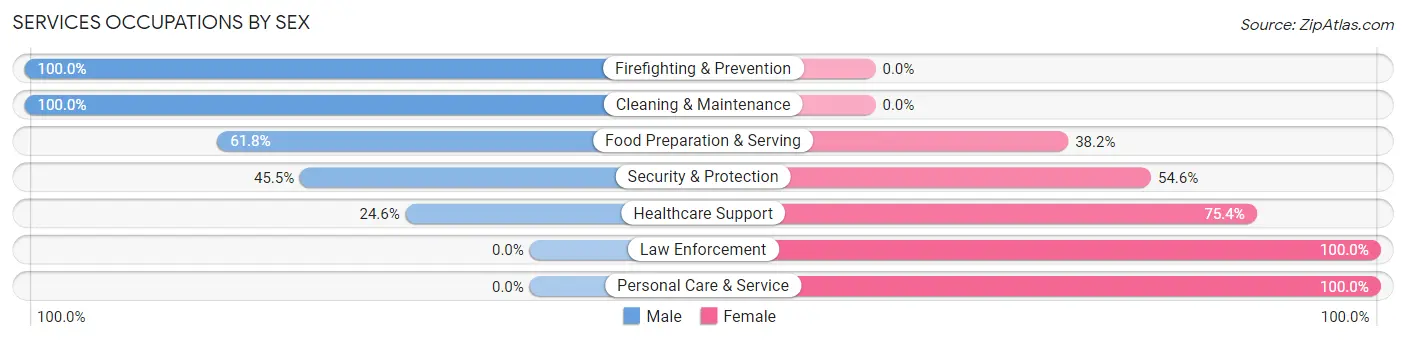
Services Occupations by Sex
Within the Services occupations in Laurel Park, the most male-oriented occupations are Firefighting & Prevention (100.0%), Cleaning & Maintenance (100.0%), and Food Preparation & Serving (61.8%), while the most female-oriented occupations are Law Enforcement (100.0%), Personal Care & Service (100.0%), and Healthcare Support (75.4%).
| Occupation | Male | Female |
| Healthcare Support | 14 (24.6%) | 43 (75.4%) |
| Security & Protection | 5 (45.5%) | 6 (54.5%) |
| Firefighting & Prevention | 5 (100.0%) | 0 (0.0%) |
| Law Enforcement | 0 (0.0%) | 6 (100.0%) |
| Food Preparation & Serving | 47 (61.8%) | 29 (38.2%) |
| Cleaning & Maintenance | 5 (100.0%) | 0 (0.0%) |
| Personal Care & Service | 0 (0.0%) | 37 (100.0%) |
| Total (Category) | 71 (38.2%) | 115 (61.8%) |
| Total (Overall) | 563 (53.6%) | 487 (46.4%) |
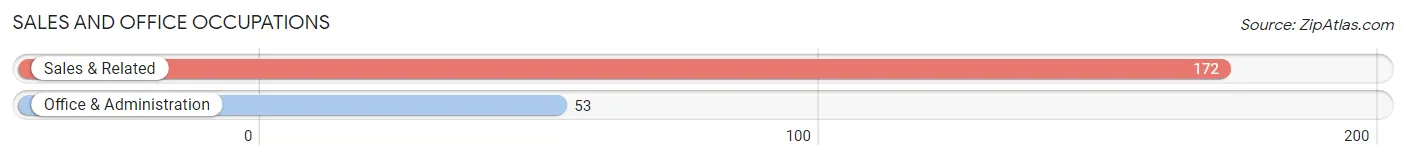
Sales and Office Occupations
The most common Sales and Office occupations in Laurel Park are Sales & Related (172 | 16.4%), and Office & Administration (53 | 5.1%).
Sales and Office Occupations by Sex
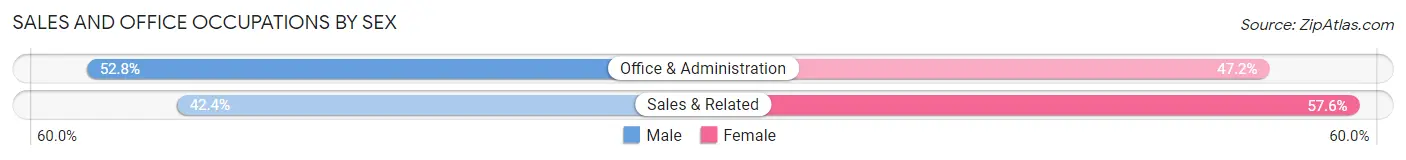
| Occupation | Male | Female |
| Sales & Related | 73 (42.4%) | 99 (57.6%) |
| Office & Administration | 28 (52.8%) | 25 (47.2%) |
| Total (Category) | 101 (44.9%) | 124 (55.1%) |
| Total (Overall) | 563 (53.6%) | 487 (46.4%) |
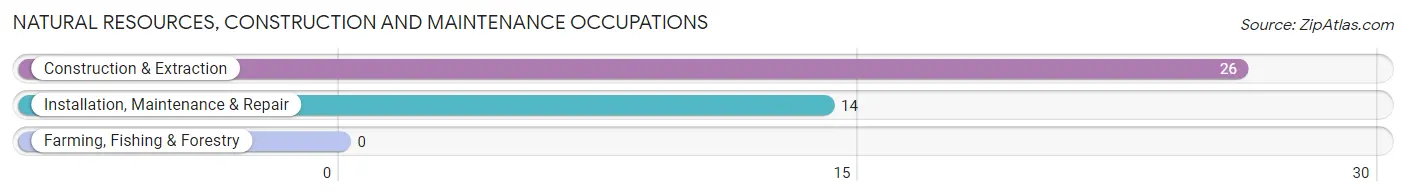
Natural Resources, Construction and Maintenance Occupations
The most common Natural Resources, Construction and Maintenance occupations in Laurel Park are Construction & Extraction (26 | 2.5%), and Installation, Maintenance & Repair (14 | 1.3%).
Natural Resources, Construction and Maintenance Occupations by Sex
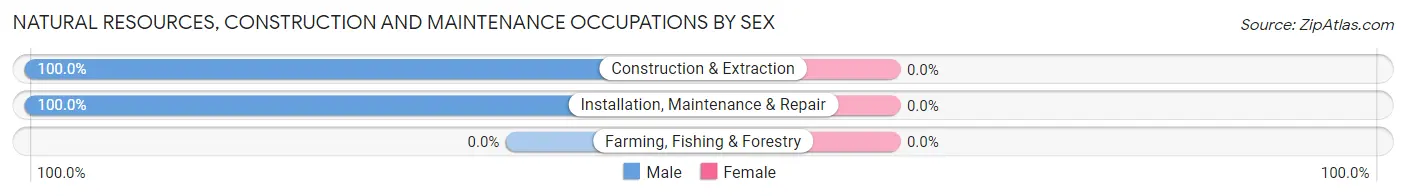
| Occupation | Male | Female |
| Farming, Fishing & Forestry | 0 (0.0%) | 0 (0.0%) |
| Construction & Extraction | 26 (100.0%) | 0 (0.0%) |
| Installation, Maintenance & Repair | 14 (100.0%) | 0 (0.0%) |
| Total (Category) | 40 (100.0%) | 0 (0.0%) |
| Total (Overall) | 563 (53.6%) | 487 (46.4%) |
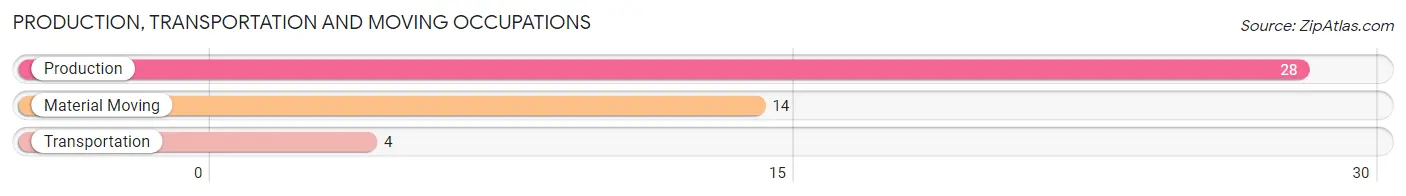
Production, Transportation and Moving Occupations
The most common Production, Transportation and Moving occupations in Laurel Park are Production (28 | 2.7%), Material Moving (14 | 1.3%), and Transportation (4 | 0.4%).
Production, Transportation and Moving Occupations by Sex
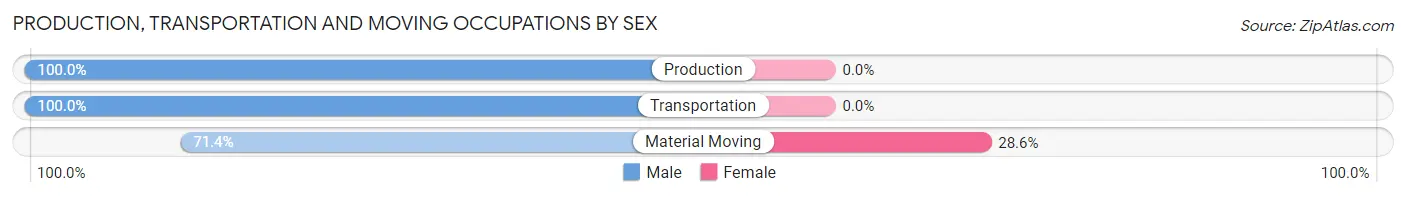
| Occupation | Male | Female |
| Production | 28 (100.0%) | 0 (0.0%) |
| Transportation | 4 (100.0%) | 0 (0.0%) |
| Material Moving | 10 (71.4%) | 4 (28.6%) |
| Total (Category) | 42 (91.3%) | 4 (8.7%) |
| Total (Overall) | 563 (53.6%) | 487 (46.4%) |
Employment Industries by Sex in Laurel Park
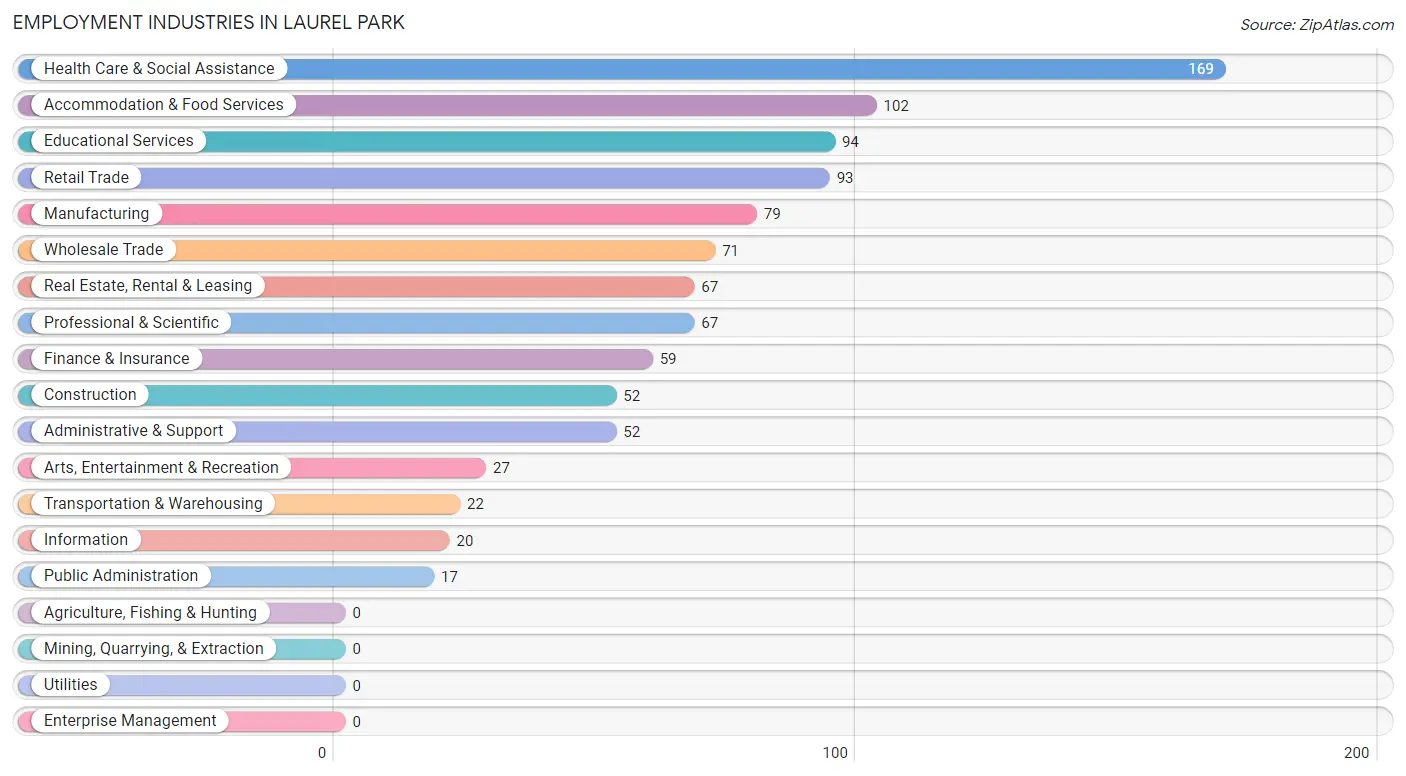
Employment Industries in Laurel Park
The major employment industries in Laurel Park include Health Care & Social Assistance (169 | 16.1%), Accommodation & Food Services (102 | 9.7%), Educational Services (94 | 8.9%), Retail Trade (93 | 8.9%), and Manufacturing (79 | 7.5%).
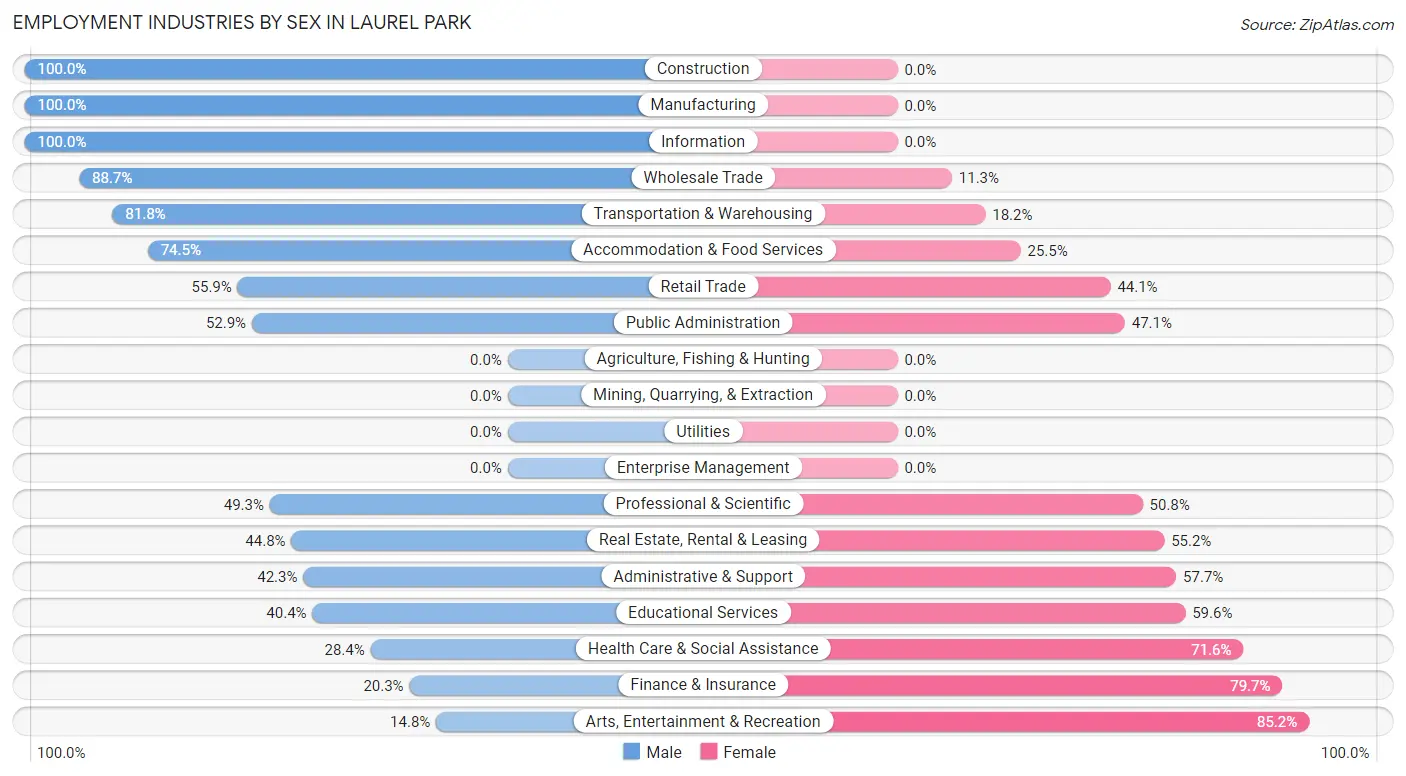
Employment Industries by Sex in Laurel Park
The Laurel Park industries that see more men than women are Construction (100.0%), Manufacturing (100.0%), and Information (100.0%), whereas the industries that tend to have a higher number of women are Arts, Entertainment & Recreation (85.2%), Finance & Insurance (79.7%), and Health Care & Social Assistance (71.6%).
| Industry | Male | Female |
| Agriculture, Fishing & Hunting | 0 (0.0%) | 0 (0.0%) |
| Mining, Quarrying, & Extraction | 0 (0.0%) | 0 (0.0%) |
| Construction | 52 (100.0%) | 0 (0.0%) |
| Manufacturing | 79 (100.0%) | 0 (0.0%) |
| Wholesale Trade | 63 (88.7%) | 8 (11.3%) |
| Retail Trade | 52 (55.9%) | 41 (44.1%) |
| Transportation & Warehousing | 18 (81.8%) | 4 (18.2%) |
| Utilities | 0 (0.0%) | 0 (0.0%) |
| Information | 20 (100.0%) | 0 (0.0%) |
| Finance & Insurance | 12 (20.3%) | 47 (79.7%) |
| Real Estate, Rental & Leasing | 30 (44.8%) | 37 (55.2%) |
| Professional & Scientific | 33 (49.2%) | 34 (50.7%) |
| Enterprise Management | 0 (0.0%) | 0 (0.0%) |
| Administrative & Support | 22 (42.3%) | 30 (57.7%) |
| Educational Services | 38 (40.4%) | 56 (59.6%) |
| Health Care & Social Assistance | 48 (28.4%) | 121 (71.6%) |
| Arts, Entertainment & Recreation | 4 (14.8%) | 23 (85.2%) |
| Accommodation & Food Services | 76 (74.5%) | 26 (25.5%) |
| Public Administration | 9 (52.9%) | 8 (47.1%) |
| Total | 563 (53.6%) | 487 (46.4%) |
Education in Laurel Park
School Enrollment in Laurel Park
The most common levels of schooling among the 471 students in Laurel Park are high school (154 | 32.7%), elementary school (145 | 30.8%), and college / undergraduate (63 | 13.4%).
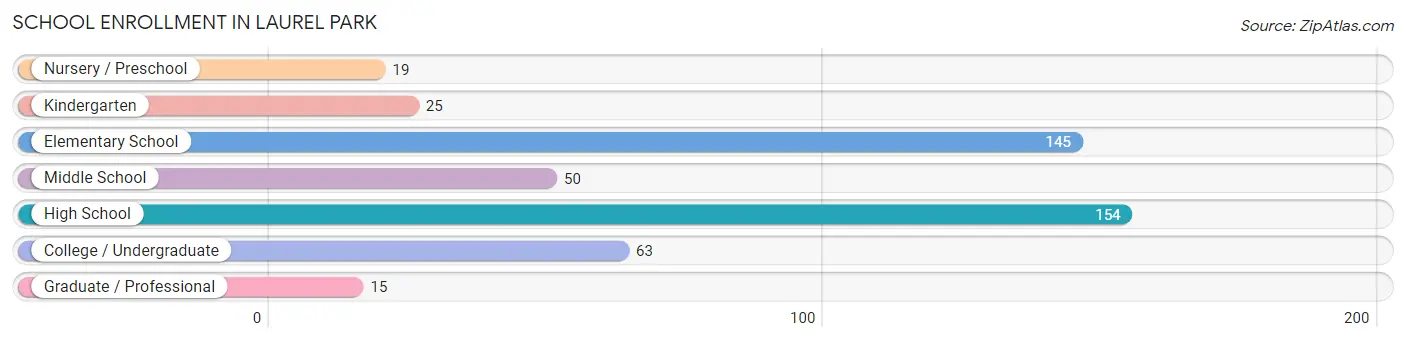
| School Level | # Students | % Students |
| Nursery / Preschool | 19 | 4.0% |
| Kindergarten | 25 | 5.3% |
| Elementary School | 145 | 30.8% |
| Middle School | 50 | 10.6% |
| High School | 154 | 32.7% |
| College / Undergraduate | 63 | 13.4% |
| Graduate / Professional | 15 | 3.2% |
| Total | 471 | 100.0% |
School Enrollment by Age by Funding Source in Laurel Park
Out of a total of 471 students who are enrolled in schools in Laurel Park, 45 (9.6%) attend a private institution, while the remaining 426 (90.4%) are enrolled in public schools. The age group of 3 to 4 year olds has the highest likelihood of being enrolled in private schools, with 13 (100.0% in the age bracket) enrolled. Conversely, the age group of 10 to 14 year olds has the lowest likelihood of being enrolled in a private school, with 74 (100.0% in the age bracket) attending a public institution.
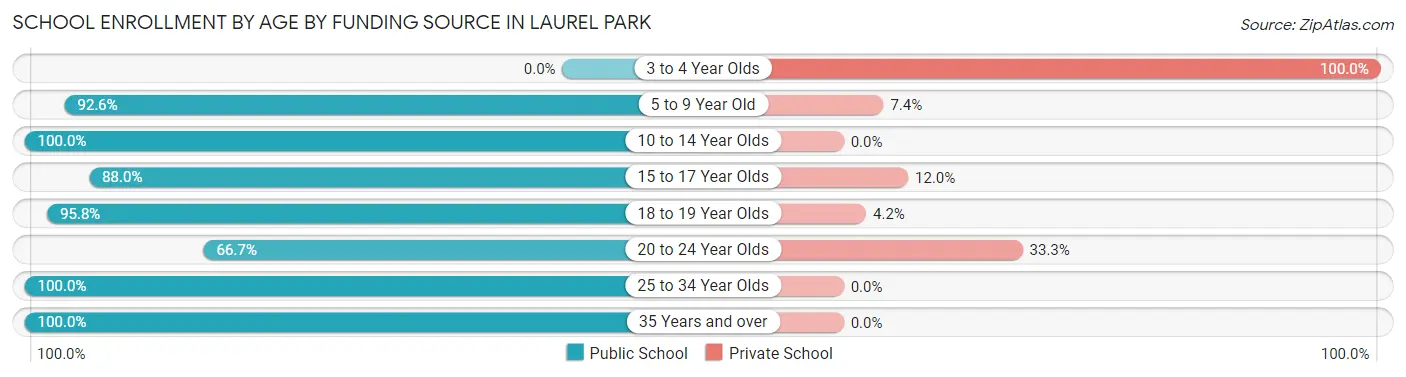
| Age Bracket | Public School | Private School |
| 3 to 4 Year Olds | 0 (0.0%) | 13 (100.0%) |
| 5 to 9 Year Old | 150 (92.6%) | 12 (7.4%) |
| 10 to 14 Year Olds | 74 (100.0%) | 0 (0.0%) |
| 15 to 17 Year Olds | 66 (88.0%) | 9 (12.0%) |
| 18 to 19 Year Olds | 69 (95.8%) | 3 (4.2%) |
| 20 to 24 Year Olds | 16 (66.7%) | 8 (33.3%) |
| 25 to 34 Year Olds | 21 (100.0%) | 0 (0.0%) |
| 35 Years and over | 30 (100.0%) | 0 (0.0%) |
| Total | 426 (90.4%) | 45 (9.6%) |
Educational Attainment by Field of Study in Laurel Park
Education (225 | 16.1%), business (197 | 14.1%), science & technology (133 | 9.5%), literature & languages (118 | 8.5%), and arts & humanities (111 | 8.0%) are the most common fields of study among 1,394 individuals in Laurel Park who have obtained a bachelor's degree or higher.
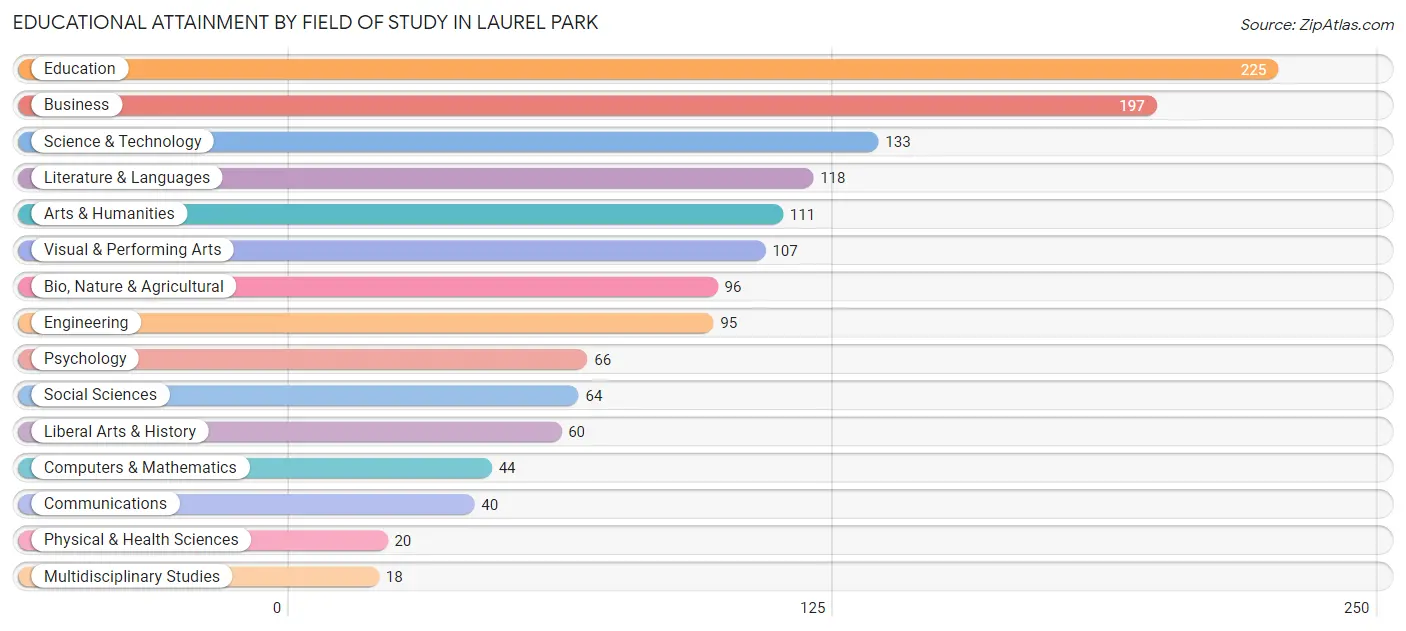
| Field of Study | # Graduates | % Graduates |
| Computers & Mathematics | 44 | 3.2% |
| Bio, Nature & Agricultural | 96 | 6.9% |
| Physical & Health Sciences | 20 | 1.4% |
| Psychology | 66 | 4.7% |
| Social Sciences | 64 | 4.6% |
| Engineering | 95 | 6.8% |
| Multidisciplinary Studies | 18 | 1.3% |
| Science & Technology | 133 | 9.5% |
| Business | 197 | 14.1% |
| Education | 225 | 16.1% |
| Literature & Languages | 118 | 8.5% |
| Liberal Arts & History | 60 | 4.3% |
| Visual & Performing Arts | 107 | 7.7% |
| Communications | 40 | 2.9% |
| Arts & Humanities | 111 | 8.0% |
| Total | 1,394 | 100.0% |
Transportation & Commute in Laurel Park
Vehicle Availability by Sex in Laurel Park
The most prevalent vehicle ownership categories in Laurel Park are males with 2 vehicles (252, accounting for 45.9%) and females with 2 vehicles (253, making up 51.7%).
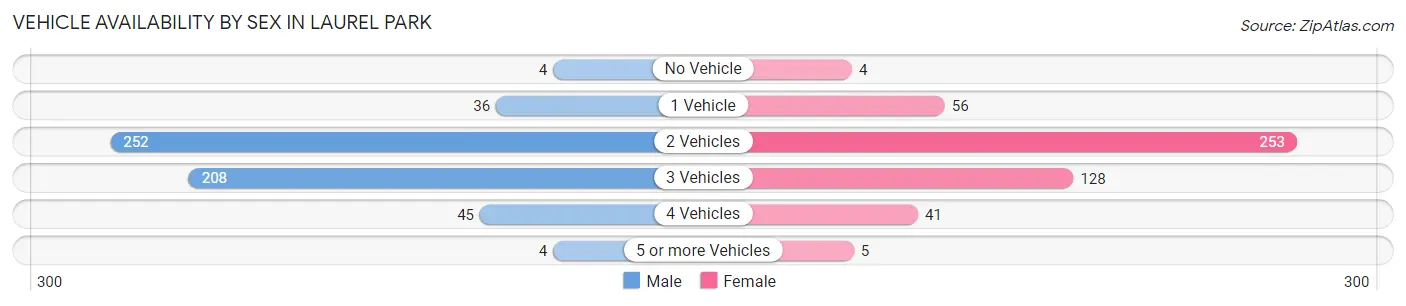
| Vehicles Available | Male | Female |
| No Vehicle | 4 (0.7%) | 4 (0.8%) |
| 1 Vehicle | 36 (6.6%) | 56 (11.5%) |
| 2 Vehicles | 252 (45.9%) | 253 (51.9%) |
| 3 Vehicles | 208 (37.9%) | 128 (26.3%) |
| 4 Vehicles | 45 (8.2%) | 41 (8.4%) |
| 5 or more Vehicles | 4 (0.7%) | 5 (1.0%) |
| Total | 549 (100.0%) | 487 (100.0%) |
Commute Time in Laurel Park
The most frequently occuring commute durations in Laurel Park are 5 to 9 minutes (219 commuters, 23.5%), 10 to 14 minutes (208 commuters, 22.3%), and 20 to 24 minutes (143 commuters, 15.4%).
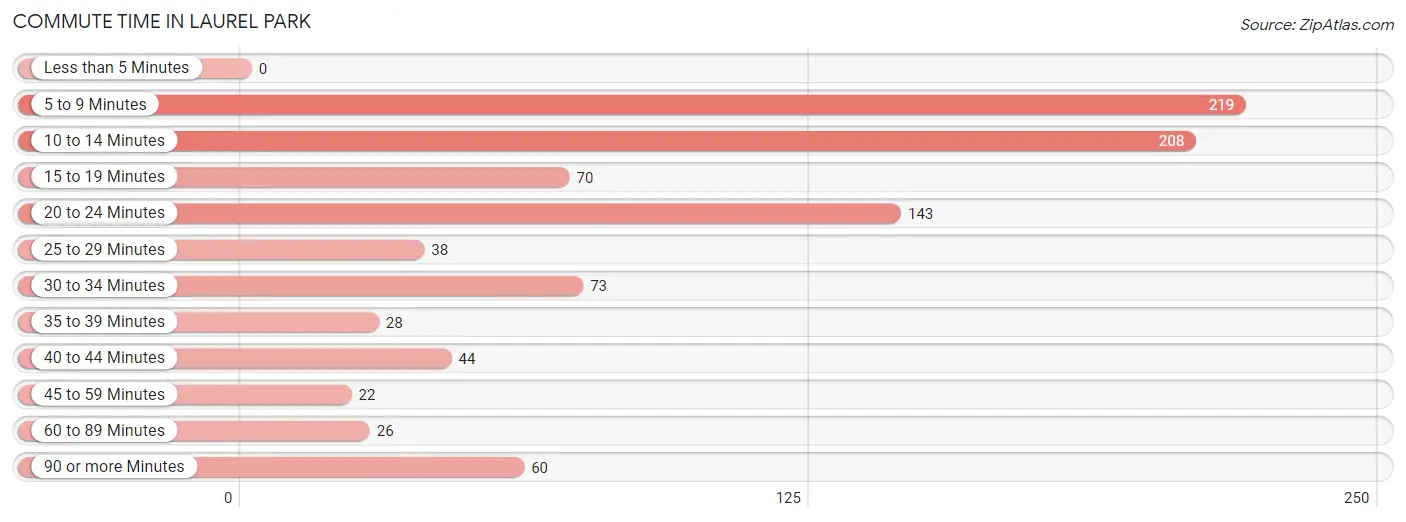
| Commute Time | # Commuters | % Commuters |
| Less than 5 Minutes | 0 | 0.0% |
| 5 to 9 Minutes | 219 | 23.5% |
| 10 to 14 Minutes | 208 | 22.3% |
| 15 to 19 Minutes | 70 | 7.5% |
| 20 to 24 Minutes | 143 | 15.4% |
| 25 to 29 Minutes | 38 | 4.1% |
| 30 to 34 Minutes | 73 | 7.8% |
| 35 to 39 Minutes | 28 | 3.0% |
| 40 to 44 Minutes | 44 | 4.7% |
| 45 to 59 Minutes | 22 | 2.4% |
| 60 to 89 Minutes | 26 | 2.8% |
| 90 or more Minutes | 60 | 6.4% |
Commute Time by Sex in Laurel Park
The most common commute times in Laurel Park are 5 to 9 minutes (128 commuters, 25.3%) for males and 5 to 9 minutes (91 commuters, 21.5%) for females.
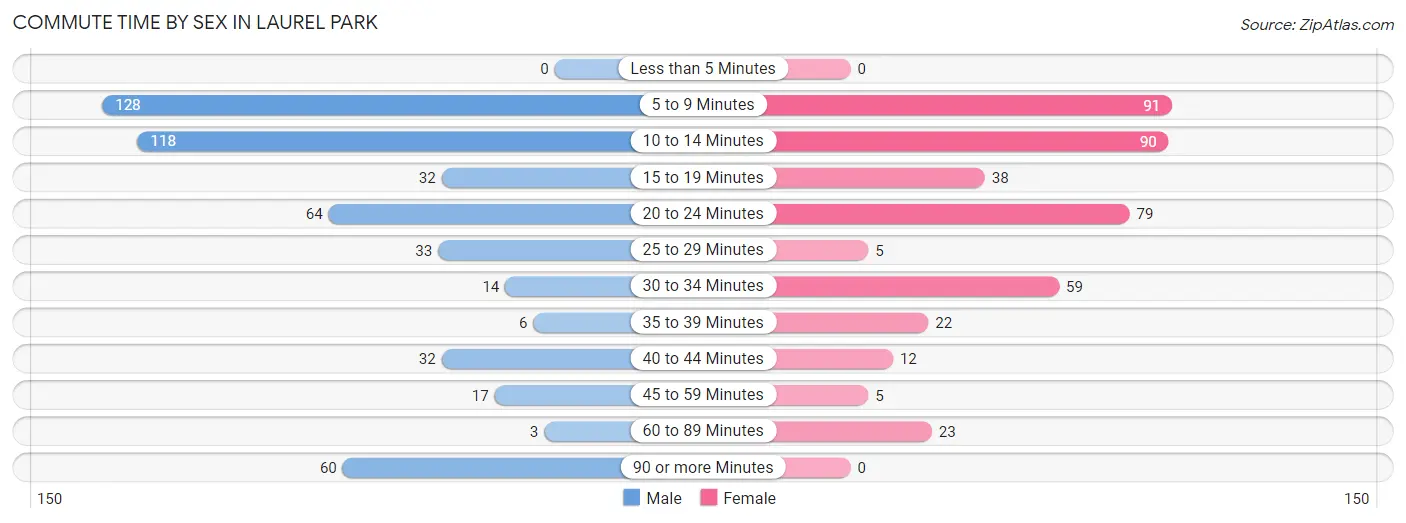
| Commute Time | Male | Female |
| Less than 5 Minutes | 0 (0.0%) | 0 (0.0%) |
| 5 to 9 Minutes | 128 (25.3%) | 91 (21.5%) |
| 10 to 14 Minutes | 118 (23.3%) | 90 (21.2%) |
| 15 to 19 Minutes | 32 (6.3%) | 38 (9.0%) |
| 20 to 24 Minutes | 64 (12.6%) | 79 (18.6%) |
| 25 to 29 Minutes | 33 (6.5%) | 5 (1.2%) |
| 30 to 34 Minutes | 14 (2.8%) | 59 (13.9%) |
| 35 to 39 Minutes | 6 (1.2%) | 22 (5.2%) |
| 40 to 44 Minutes | 32 (6.3%) | 12 (2.8%) |
| 45 to 59 Minutes | 17 (3.4%) | 5 (1.2%) |
| 60 to 89 Minutes | 3 (0.6%) | 23 (5.4%) |
| 90 or more Minutes | 60 (11.8%) | 0 (0.0%) |
Time of Departure to Work by Sex in Laurel Park
The most frequent times of departure to work in Laurel Park are 8:00 AM to 8:29 AM (167, 32.9%) for males and 9:00 AM to 9:59 AM (92, 21.7%) for females.
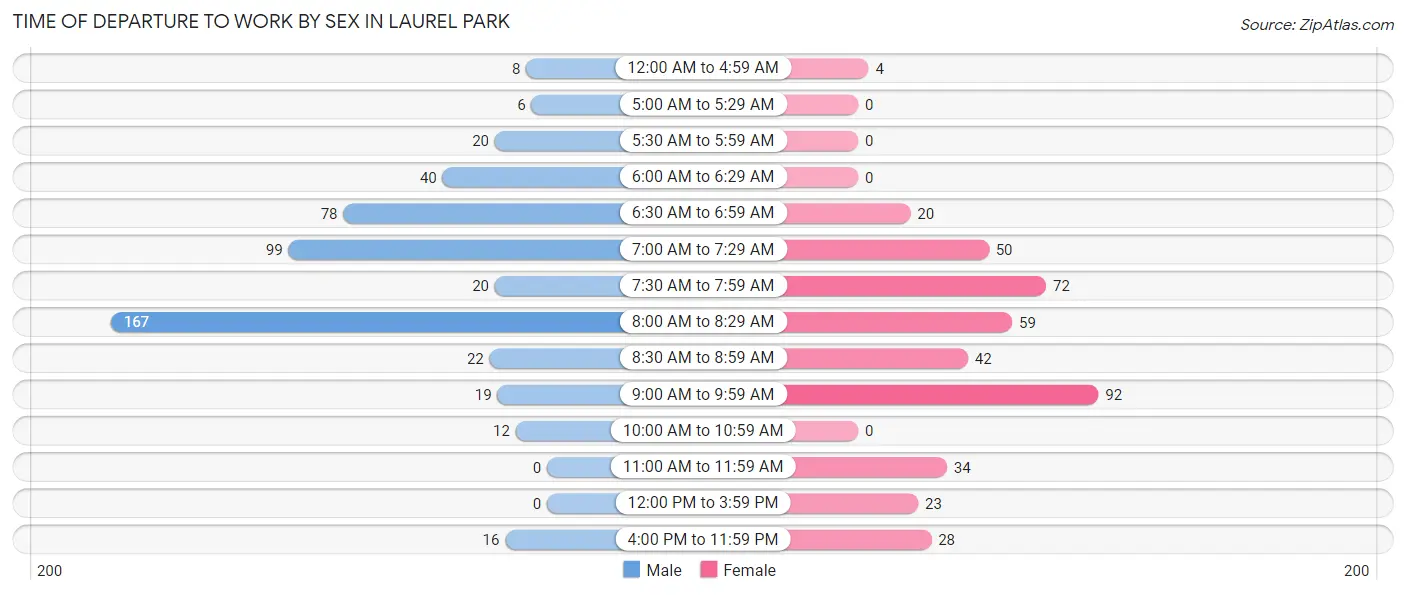
| Time of Departure | Male | Female |
| 12:00 AM to 4:59 AM | 8 (1.6%) | 4 (0.9%) |
| 5:00 AM to 5:29 AM | 6 (1.2%) | 0 (0.0%) |
| 5:30 AM to 5:59 AM | 20 (3.9%) | 0 (0.0%) |
| 6:00 AM to 6:29 AM | 40 (7.9%) | 0 (0.0%) |
| 6:30 AM to 6:59 AM | 78 (15.4%) | 20 (4.7%) |
| 7:00 AM to 7:29 AM | 99 (19.5%) | 50 (11.8%) |
| 7:30 AM to 7:59 AM | 20 (3.9%) | 72 (17.0%) |
| 8:00 AM to 8:29 AM | 167 (32.9%) | 59 (13.9%) |
| 8:30 AM to 8:59 AM | 22 (4.3%) | 42 (9.9%) |
| 9:00 AM to 9:59 AM | 19 (3.7%) | 92 (21.7%) |
| 10:00 AM to 10:59 AM | 12 (2.4%) | 0 (0.0%) |
| 11:00 AM to 11:59 AM | 0 (0.0%) | 34 (8.0%) |
| 12:00 PM to 3:59 PM | 0 (0.0%) | 23 (5.4%) |
| 4:00 PM to 11:59 PM | 16 (3.2%) | 28 (6.6%) |
| Total | 507 (100.0%) | 424 (100.0%) |
Housing Occupancy in Laurel Park
Occupancy by Ownership in Laurel Park
Of the total 1,113 dwellings in Laurel Park, owner-occupied units account for 1,004 (90.2%), while renter-occupied units make up 109 (9.8%).
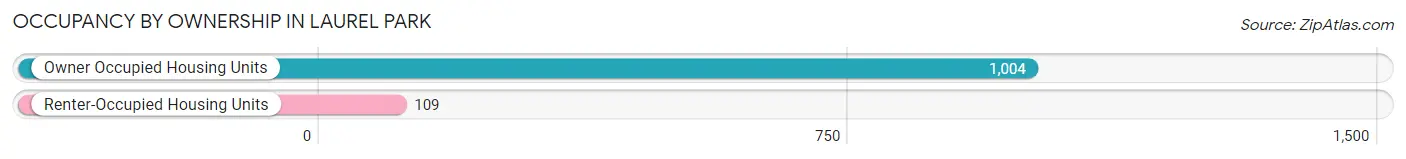
| Occupancy | # Housing Units | % Housing Units |
| Owner Occupied Housing Units | 1,004 | 90.2% |
| Renter-Occupied Housing Units | 109 | 9.8% |
| Total Occupied Housing Units | 1,113 | 100.0% |
Occupancy by Household Size in Laurel Park
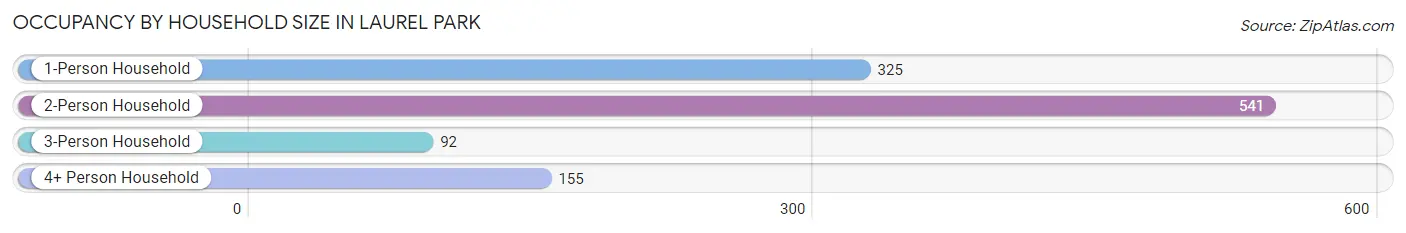
| Household Size | # Housing Units | % Housing Units |
| 1-Person Household | 325 | 29.2% |
| 2-Person Household | 541 | 48.6% |
| 3-Person Household | 92 | 8.3% |
| 4+ Person Household | 155 | 13.9% |
| Total Housing Units | 1,113 | 100.0% |
Occupancy by Ownership by Household Size in Laurel Park
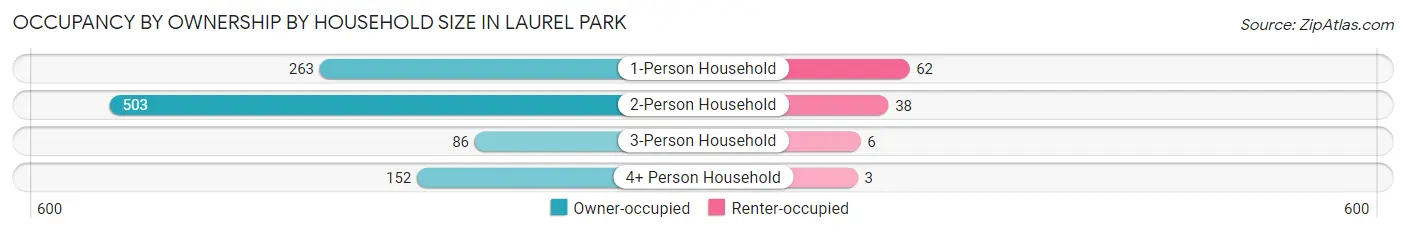
| Household Size | Owner-occupied | Renter-occupied |
| 1-Person Household | 263 (80.9%) | 62 (19.1%) |
| 2-Person Household | 503 (93.0%) | 38 (7.0%) |
| 3-Person Household | 86 (93.5%) | 6 (6.5%) |
| 4+ Person Household | 152 (98.1%) | 3 (1.9%) |
| Total Housing Units | 1,004 (90.2%) | 109 (9.8%) |
Occupancy by Educational Attainment in Laurel Park
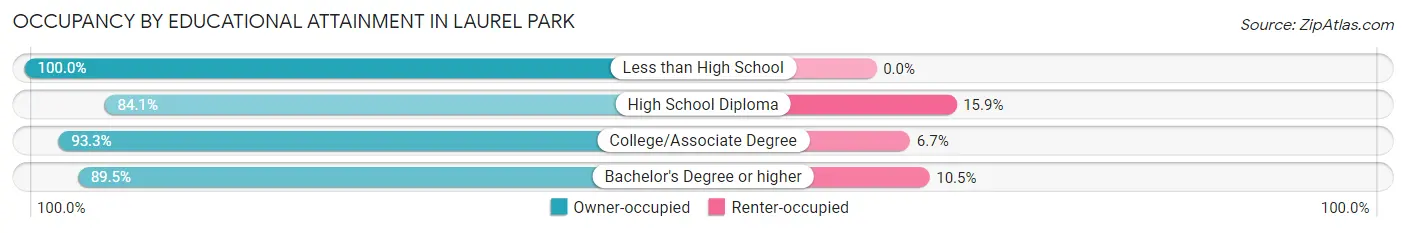
| Household Size | Owner-occupied | Renter-occupied |
| Less than High School | 6 (100.0%) | 0 (0.0%) |
| High School Diploma | 53 (84.1%) | 10 (15.9%) |
| College/Associate Degree | 265 (93.3%) | 19 (6.7%) |
| Bachelor's Degree or higher | 680 (89.5%) | 80 (10.5%) |
Occupancy by Age of Householder in Laurel Park
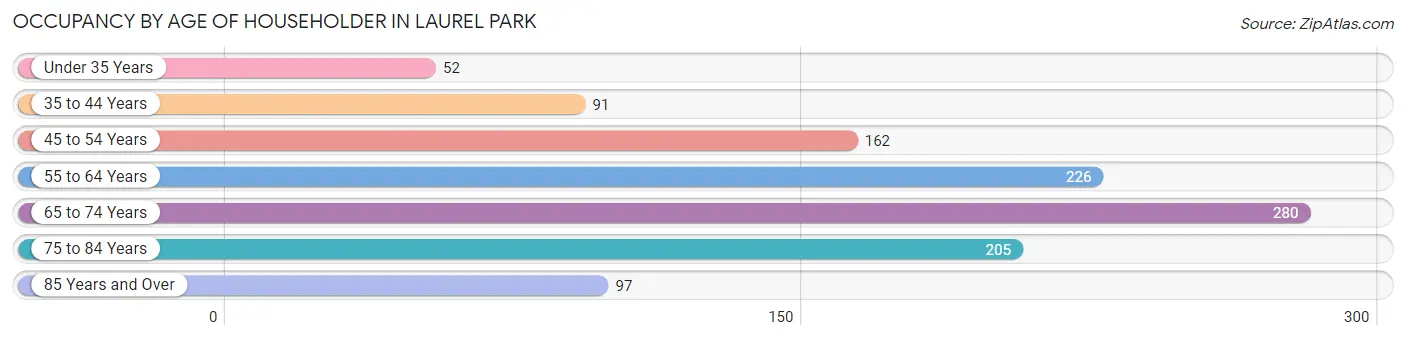
| Age Bracket | # Households | % Households |
| Under 35 Years | 52 | 4.7% |
| 35 to 44 Years | 91 | 8.2% |
| 45 to 54 Years | 162 | 14.6% |
| 55 to 64 Years | 226 | 20.3% |
| 65 to 74 Years | 280 | 25.2% |
| 75 to 84 Years | 205 | 18.4% |
| 85 Years and Over | 97 | 8.7% |
| Total | 1,113 | 100.0% |
Housing Finances in Laurel Park
Median Income by Occupancy in Laurel Park
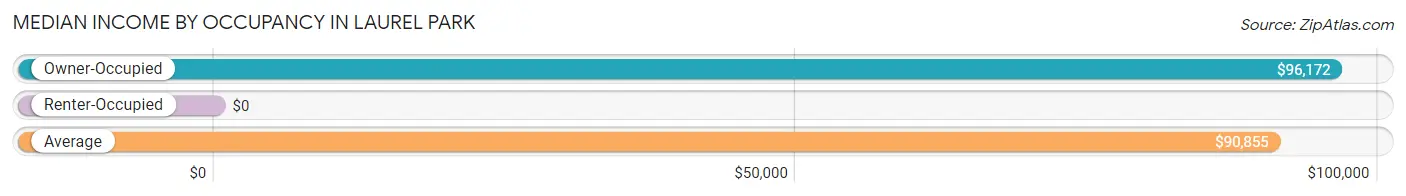
| Occupancy Type | # Households | Median Income |
| Owner-Occupied | 1,004 (90.2%) | $96,172 |
| Renter-Occupied | 109 (9.8%) | $0 |
| Average | 1,113 (100.0%) | $90,855 |
Occupancy by Householder Income Bracket in Laurel Park
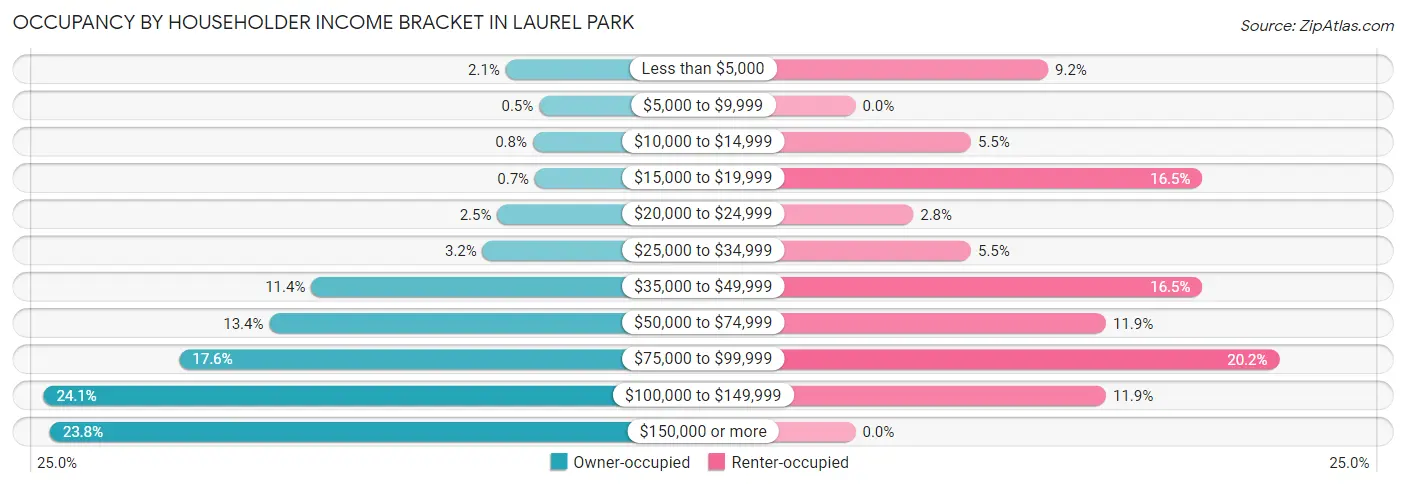
| Income Bracket | Owner-occupied | Renter-occupied |
| Less than $5,000 | 21 (2.1%) | 10 (9.2%) |
| $5,000 to $9,999 | 5 (0.5%) | 0 (0.0%) |
| $10,000 to $14,999 | 8 (0.8%) | 6 (5.5%) |
| $15,000 to $19,999 | 7 (0.7%) | 18 (16.5%) |
| $20,000 to $24,999 | 25 (2.5%) | 3 (2.8%) |
| $25,000 to $34,999 | 32 (3.2%) | 6 (5.5%) |
| $35,000 to $49,999 | 114 (11.4%) | 18 (16.5%) |
| $50,000 to $74,999 | 134 (13.4%) | 13 (11.9%) |
| $75,000 to $99,999 | 177 (17.6%) | 22 (20.2%) |
| $100,000 to $149,999 | 242 (24.1%) | 13 (11.9%) |
| $150,000 or more | 239 (23.8%) | 0 (0.0%) |
| Total | 1,004 (100.0%) | 109 (100.0%) |
Monthly Housing Cost Tiers in Laurel Park
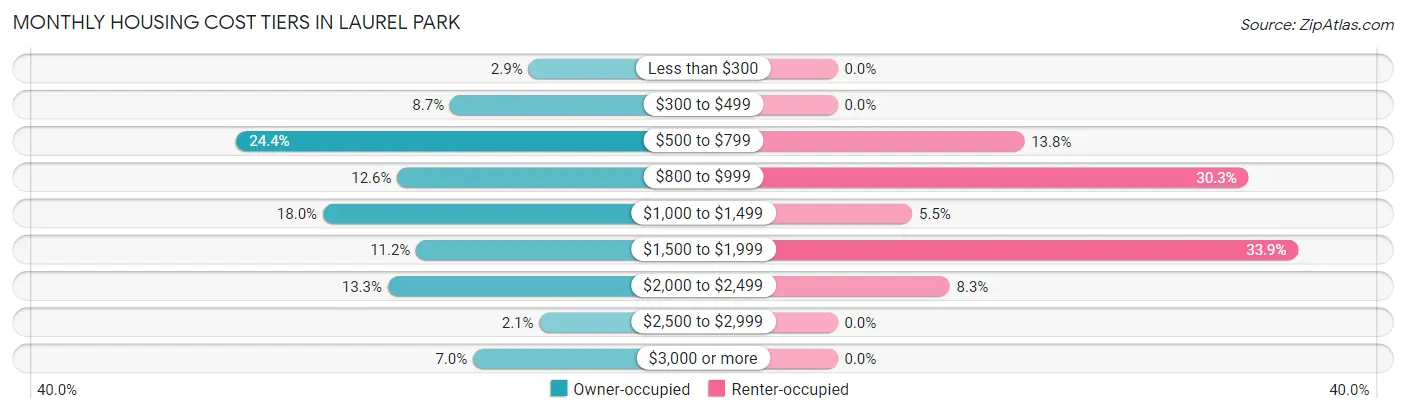
| Monthly Cost | Owner-occupied | Renter-occupied |
| Less than $300 | 29 (2.9%) | 0 (0.0%) |
| $300 to $499 | 87 (8.7%) | 0 (0.0%) |
| $500 to $799 | 245 (24.4%) | 15 (13.8%) |
| $800 to $999 | 126 (12.6%) | 33 (30.3%) |
| $1,000 to $1,499 | 181 (18.0%) | 6 (5.5%) |
| $1,500 to $1,999 | 112 (11.2%) | 37 (33.9%) |
| $2,000 to $2,499 | 133 (13.3%) | 9 (8.3%) |
| $2,500 to $2,999 | 21 (2.1%) | 0 (0.0%) |
| $3,000 or more | 70 (7.0%) | 0 (0.0%) |
| Total | 1,004 (100.0%) | 109 (100.0%) |
Physical Housing Characteristics in Laurel Park
Housing Structures in Laurel Park
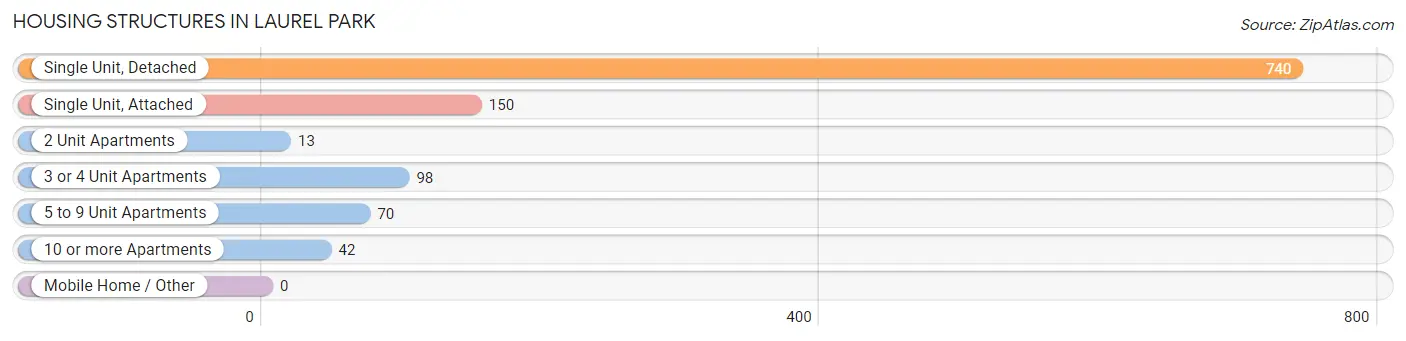
| Structure Type | # Housing Units | % Housing Units |
| Single Unit, Detached | 740 | 66.5% |
| Single Unit, Attached | 150 | 13.5% |
| 2 Unit Apartments | 13 | 1.2% |
| 3 or 4 Unit Apartments | 98 | 8.8% |
| 5 to 9 Unit Apartments | 70 | 6.3% |
| 10 or more Apartments | 42 | 3.8% |
| Mobile Home / Other | 0 | 0.0% |
| Total | 1,113 | 100.0% |
Housing Structures by Occupancy in Laurel Park
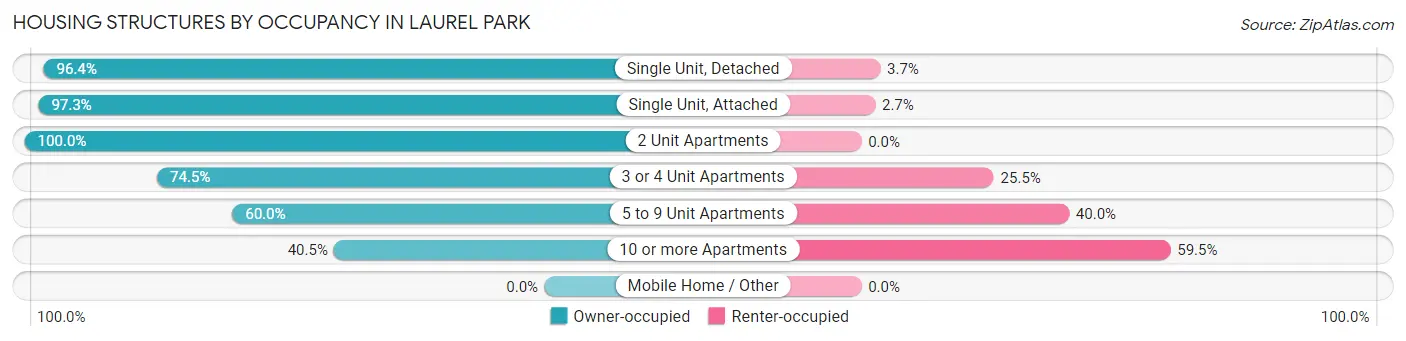
| Structure Type | Owner-occupied | Renter-occupied |
| Single Unit, Detached | 713 (96.4%) | 27 (3.6%) |
| Single Unit, Attached | 146 (97.3%) | 4 (2.7%) |
| 2 Unit Apartments | 13 (100.0%) | 0 (0.0%) |
| 3 or 4 Unit Apartments | 73 (74.5%) | 25 (25.5%) |
| 5 to 9 Unit Apartments | 42 (60.0%) | 28 (40.0%) |
| 10 or more Apartments | 17 (40.5%) | 25 (59.5%) |
| Mobile Home / Other | 0 (0.0%) | 0 (0.0%) |
| Total | 1,004 (90.2%) | 109 (9.8%) |
Housing Structures by Number of Rooms in Laurel Park
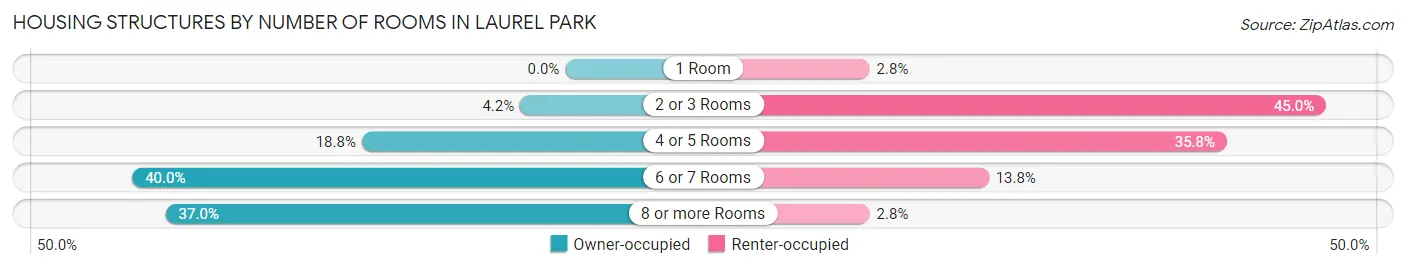
| Number of Rooms | Owner-occupied | Renter-occupied |
| 1 Room | 0 (0.0%) | 3 (2.8%) |
| 2 or 3 Rooms | 42 (4.2%) | 49 (45.0%) |
| 4 or 5 Rooms | 189 (18.8%) | 39 (35.8%) |
| 6 or 7 Rooms | 402 (40.0%) | 15 (13.8%) |
| 8 or more Rooms | 371 (36.9%) | 3 (2.8%) |
| Total | 1,004 (100.0%) | 109 (100.0%) |
Housing Structure by Heating Type in Laurel Park
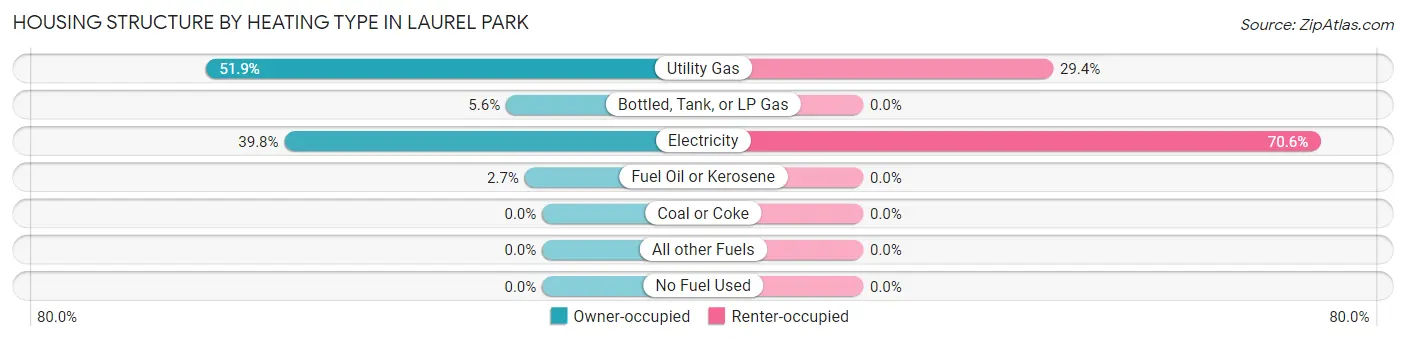
| Heating Type | Owner-occupied | Renter-occupied |
| Utility Gas | 521 (51.9%) | 32 (29.4%) |
| Bottled, Tank, or LP Gas | 56 (5.6%) | 0 (0.0%) |
| Electricity | 400 (39.8%) | 77 (70.6%) |
| Fuel Oil or Kerosene | 27 (2.7%) | 0 (0.0%) |
| Coal or Coke | 0 (0.0%) | 0 (0.0%) |
| All other Fuels | 0 (0.0%) | 0 (0.0%) |
| No Fuel Used | 0 (0.0%) | 0 (0.0%) |
| Total | 1,004 (100.0%) | 109 (100.0%) |
Household Vehicle Usage in Laurel Park
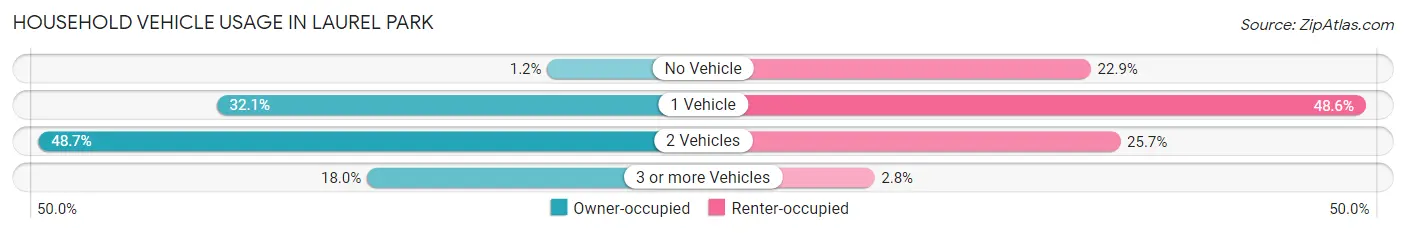
| Vehicles per Household | Owner-occupied | Renter-occupied |
| No Vehicle | 12 (1.2%) | 25 (22.9%) |
| 1 Vehicle | 322 (32.1%) | 53 (48.6%) |
| 2 Vehicles | 489 (48.7%) | 28 (25.7%) |
| 3 or more Vehicles | 181 (18.0%) | 3 (2.8%) |
| Total | 1,004 (100.0%) | 109 (100.0%) |
Real Estate & Mortgages in Laurel Park
Real Estate and Mortgage Overview in Laurel Park
| Characteristic | Without Mortgage | With Mortgage |
| Housing Units | 428 | 576 |
| Median Property Value | $358,500 | $359,300 |
| Median Household Income | $73,125 | $128 |
| Monthly Housing Costs | $575 | $70 |
| Real Estate Taxes | $2,548 | $7 |
Property Value by Mortgage Status in Laurel Park
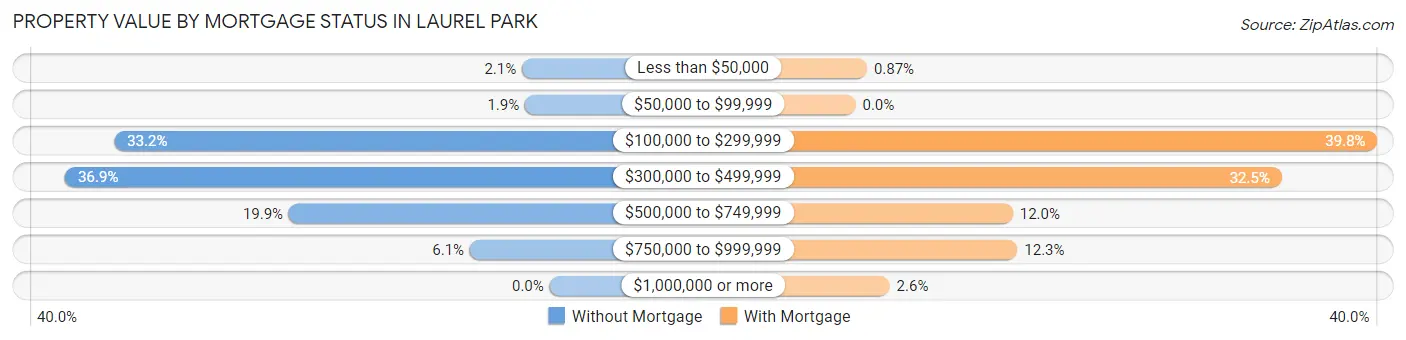
| Property Value | Without Mortgage | With Mortgage |
| Less than $50,000 | 9 (2.1%) | 5 (0.9%) |
| $50,000 to $99,999 | 8 (1.9%) | 0 (0.0%) |
| $100,000 to $299,999 | 142 (33.2%) | 229 (39.8%) |
| $300,000 to $499,999 | 158 (36.9%) | 187 (32.5%) |
| $500,000 to $749,999 | 85 (19.9%) | 69 (12.0%) |
| $750,000 to $999,999 | 26 (6.1%) | 71 (12.3%) |
| $1,000,000 or more | 0 (0.0%) | 15 (2.6%) |
| Total | 428 (100.0%) | 576 (100.0%) |
Household Income by Mortgage Status in Laurel Park
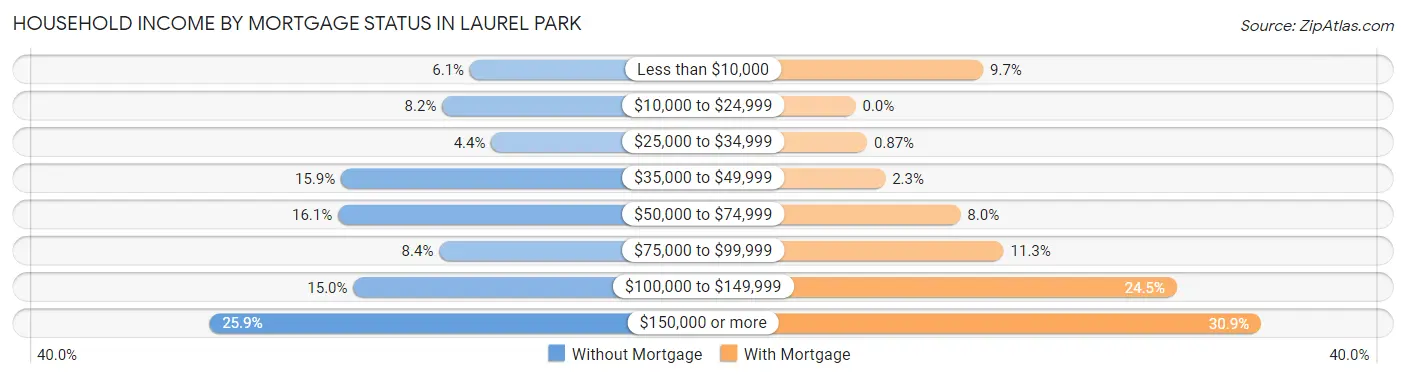
| Household Income | Without Mortgage | With Mortgage |
| Less than $10,000 | 26 (6.1%) | 56 (9.7%) |
| $10,000 to $24,999 | 35 (8.2%) | 0 (0.0%) |
| $25,000 to $34,999 | 19 (4.4%) | 5 (0.9%) |
| $35,000 to $49,999 | 68 (15.9%) | 13 (2.3%) |
| $50,000 to $74,999 | 69 (16.1%) | 46 (8.0%) |
| $75,000 to $99,999 | 36 (8.4%) | 65 (11.3%) |
| $100,000 to $149,999 | 64 (14.9%) | 141 (24.5%) |
| $150,000 or more | 111 (25.9%) | 178 (30.9%) |
| Total | 428 (100.0%) | 576 (100.0%) |
Property Value to Household Income Ratio in Laurel Park
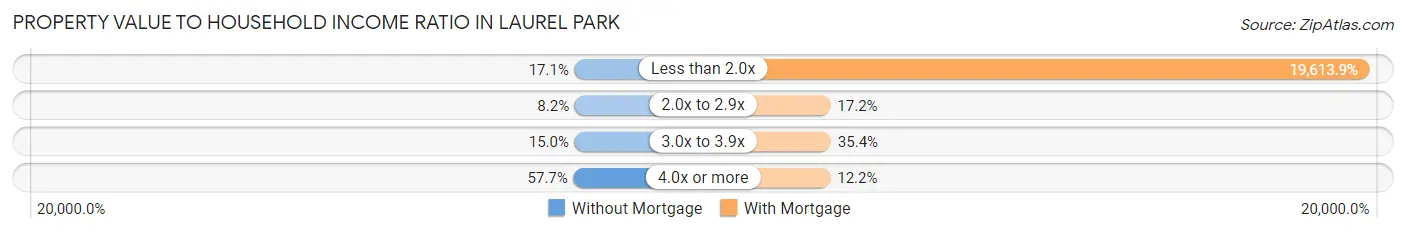
| Value-to-Income Ratio | Without Mortgage | With Mortgage |
| Less than 2.0x | 73 (17.1%) | 112,976 (19,613.9%) |
| 2.0x to 2.9x | 35 (8.2%) | 99 (17.2%) |
| 3.0x to 3.9x | 64 (14.9%) | 204 (35.4%) |
| 4.0x or more | 247 (57.7%) | 70 (12.1%) |
| Total | 428 (100.0%) | 576 (100.0%) |
Real Estate Taxes by Mortgage Status in Laurel Park
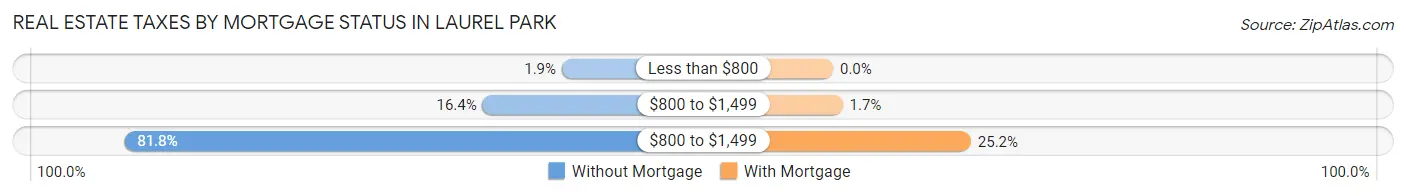
| Property Taxes | Without Mortgage | With Mortgage |
| Less than $800 | 8 (1.9%) | 0 (0.0%) |
| $800 to $1,499 | 70 (16.4%) | 10 (1.7%) |
| $800 to $1,499 | 350 (81.8%) | 145 (25.2%) |
| Total | 428 (100.0%) | 576 (100.0%) |
Health & Disability in Laurel Park
Health Insurance Coverage by Age in Laurel Park
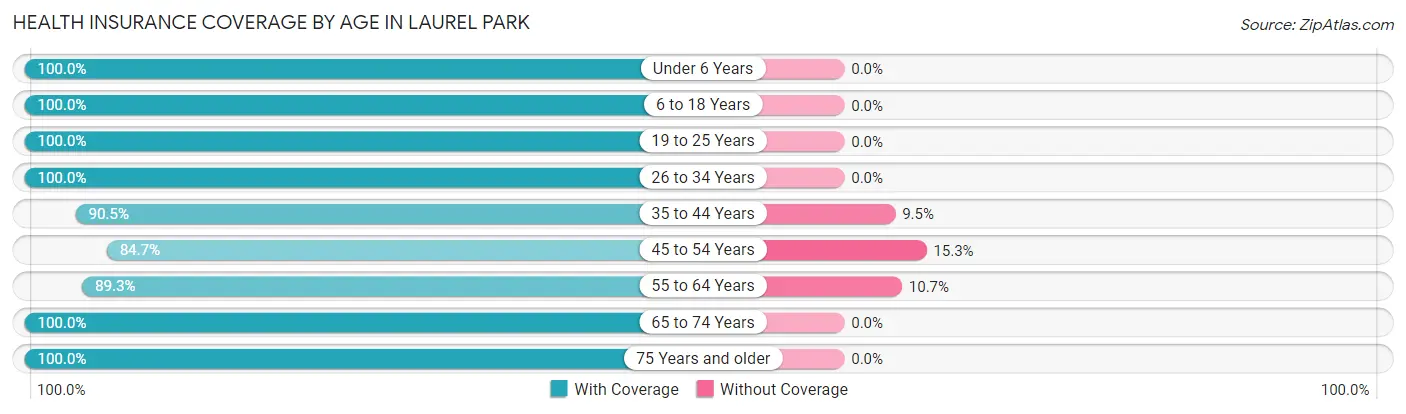
| Age Bracket | With Coverage | Without Coverage |
| Under 6 Years | 69 (100.0%) | 0 (0.0%) |
| 6 to 18 Years | 360 (100.0%) | 0 (0.0%) |
| 19 to 25 Years | 101 (100.0%) | 0 (0.0%) |
| 26 to 34 Years | 86 (100.0%) | 0 (0.0%) |
| 35 to 44 Years | 200 (90.5%) | 21 (9.5%) |
| 45 to 54 Years | 304 (84.7%) | 55 (15.3%) |
| 55 to 64 Years | 349 (89.3%) | 42 (10.7%) |
| 65 to 74 Years | 510 (100.0%) | 0 (0.0%) |
| 75 Years and older | 412 (100.0%) | 0 (0.0%) |
| Total | 2,391 (95.3%) | 118 (4.7%) |
Health Insurance Coverage by Citizenship Status in Laurel Park
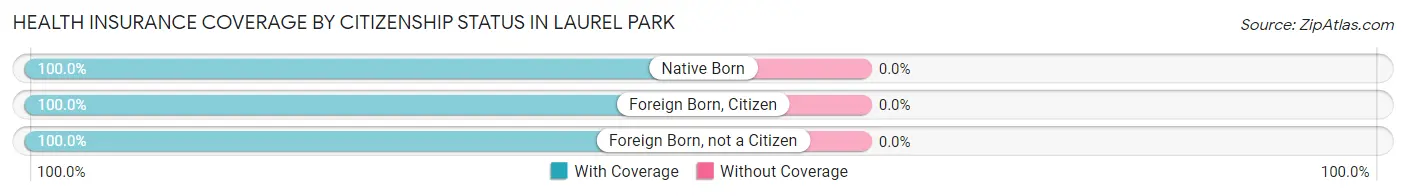
| Citizenship Status | With Coverage | Without Coverage |
| Native Born | 69 (100.0%) | 0 (0.0%) |
| Foreign Born, Citizen | 360 (100.0%) | 0 (0.0%) |
| Foreign Born, not a Citizen | 101 (100.0%) | 0 (0.0%) |
Health Insurance Coverage by Household Income in Laurel Park
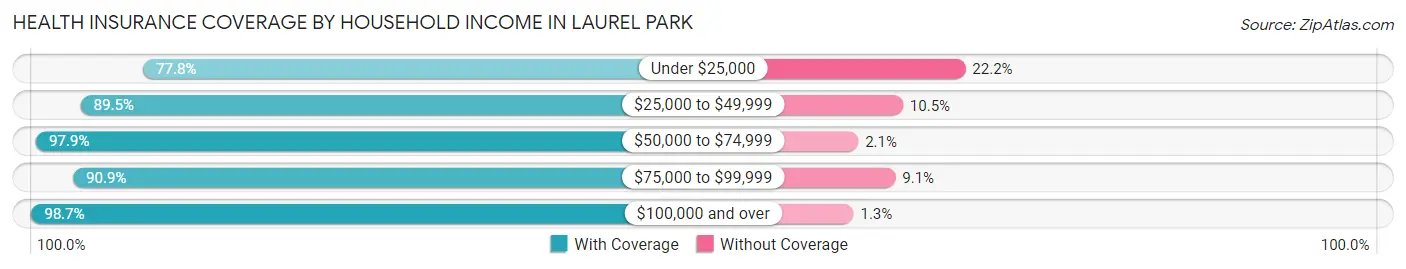
| Household Income | With Coverage | Without Coverage |
| Under $25,000 | 105 (77.8%) | 30 (22.2%) |
| $25,000 to $49,999 | 230 (89.5%) | 27 (10.5%) |
| $50,000 to $74,999 | 274 (97.9%) | 6 (2.1%) |
| $75,000 to $99,999 | 370 (90.9%) | 37 (9.1%) |
| $100,000 and over | 1,406 (98.7%) | 18 (1.3%) |
Public vs Private Health Insurance Coverage by Age in Laurel Park
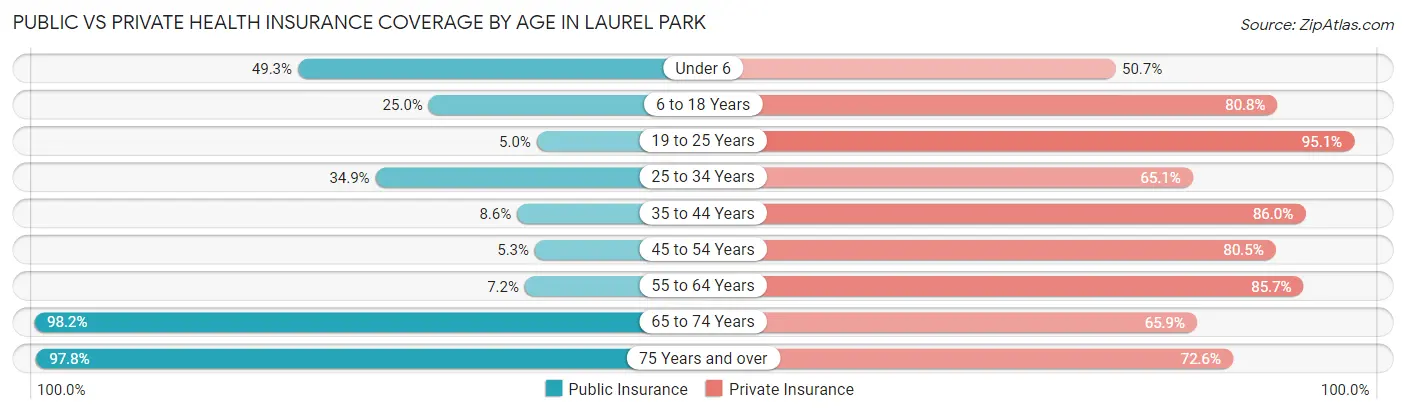
| Age Bracket | Public Insurance | Private Insurance |
| Under 6 | 34 (49.3%) | 35 (50.7%) |
| 6 to 18 Years | 90 (25.0%) | 291 (80.8%) |
| 19 to 25 Years | 5 (5.0%) | 96 (95.1%) |
| 25 to 34 Years | 30 (34.9%) | 56 (65.1%) |
| 35 to 44 Years | 19 (8.6%) | 190 (86.0%) |
| 45 to 54 Years | 19 (5.3%) | 289 (80.5%) |
| 55 to 64 Years | 28 (7.2%) | 335 (85.7%) |
| 65 to 74 Years | 501 (98.2%) | 336 (65.9%) |
| 75 Years and over | 403 (97.8%) | 299 (72.6%) |
| Total | 1,129 (45.0%) | 1,927 (76.8%) |
Disability Status by Sex by Age in Laurel Park
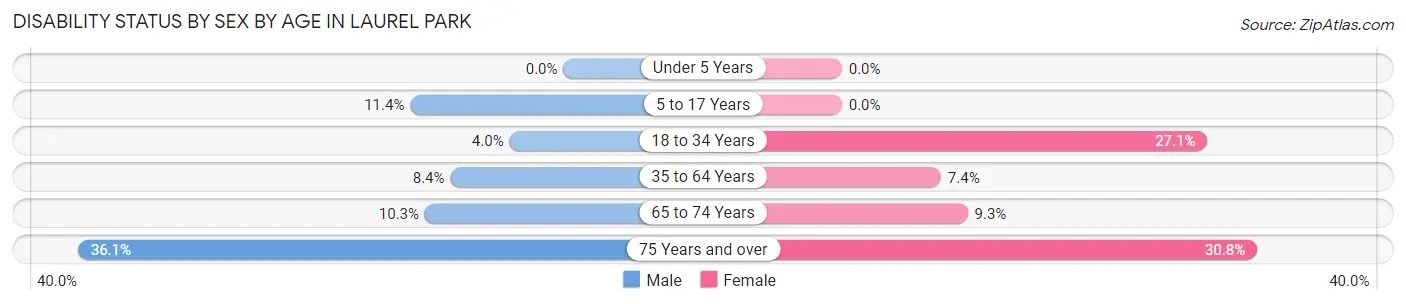
| Age Bracket | Male | Female |
| Under 5 Years | 0 (0.0%) | 0 (0.0%) |
| 5 to 17 Years | 24 (11.4%) | 0 (0.0%) |
| 18 to 34 Years | 5 (4.0%) | 35 (27.1%) |
| 35 to 64 Years | 37 (8.4%) | 39 (7.4%) |
| 65 to 74 Years | 26 (10.3%) | 24 (9.3%) |
| 75 Years and over | 62 (36.0%) | 74 (30.8%) |
Disability Class by Sex by Age in Laurel Park
Disability Class: Hearing Difficulty
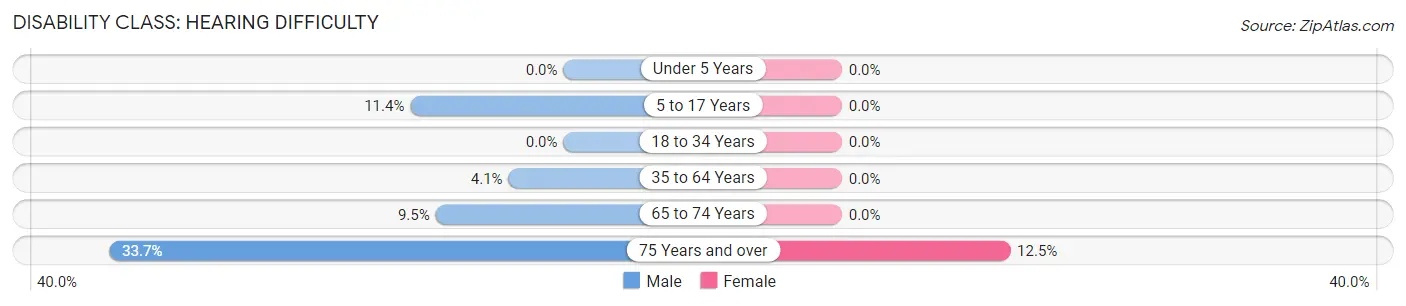
| Age Bracket | Male | Female |
| Under 5 Years | 0 (0.0%) | 0 (0.0%) |
| 5 to 17 Years | 24 (11.4%) | 0 (0.0%) |
| 18 to 34 Years | 0 (0.0%) | 0 (0.0%) |
| 35 to 64 Years | 18 (4.1%) | 0 (0.0%) |
| 65 to 74 Years | 24 (9.5%) | 0 (0.0%) |
| 75 Years and over | 58 (33.7%) | 30 (12.5%) |
Disability Class: Vision Difficulty
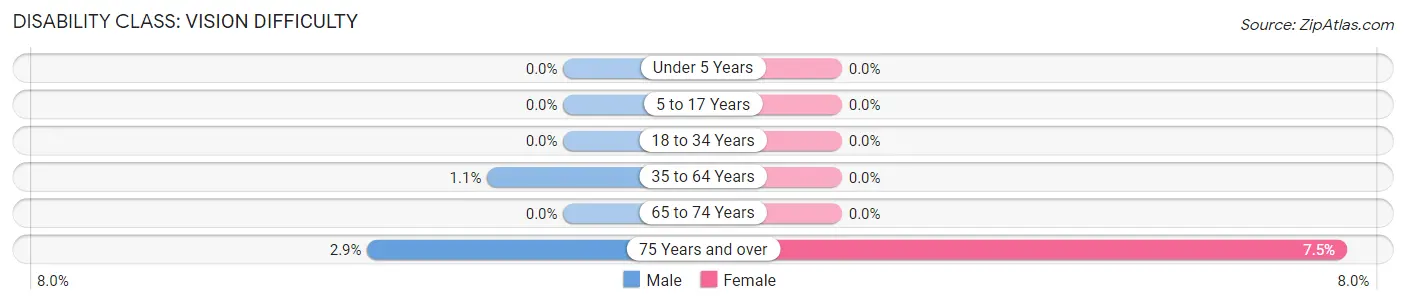
| Age Bracket | Male | Female |
| Under 5 Years | 0 (0.0%) | 0 (0.0%) |
| 5 to 17 Years | 0 (0.0%) | 0 (0.0%) |
| 18 to 34 Years | 0 (0.0%) | 0 (0.0%) |
| 35 to 64 Years | 5 (1.1%) | 0 (0.0%) |
| 65 to 74 Years | 0 (0.0%) | 0 (0.0%) |
| 75 Years and over | 5 (2.9%) | 18 (7.5%) |
Disability Class: Cognitive Difficulty
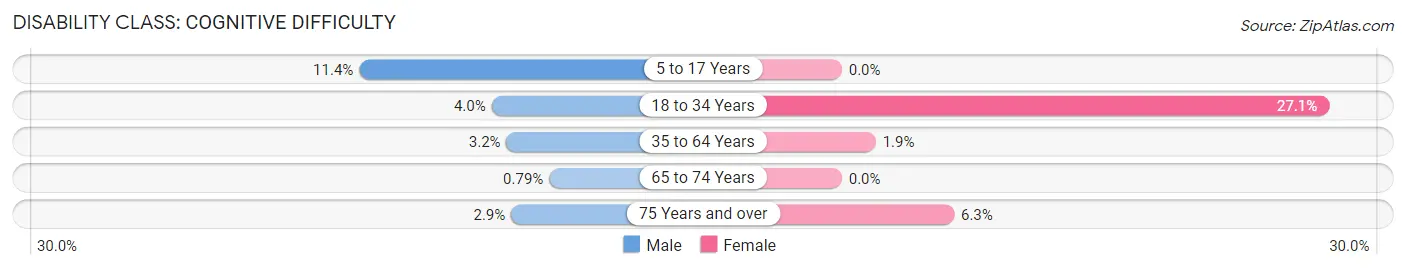
| Age Bracket | Male | Female |
| 5 to 17 Years | 24 (11.4%) | 0 (0.0%) |
| 18 to 34 Years | 5 (4.0%) | 35 (27.1%) |
| 35 to 64 Years | 14 (3.2%) | 10 (1.9%) |
| 65 to 74 Years | 2 (0.8%) | 0 (0.0%) |
| 75 Years and over | 5 (2.9%) | 15 (6.2%) |
Disability Class: Ambulatory Difficulty
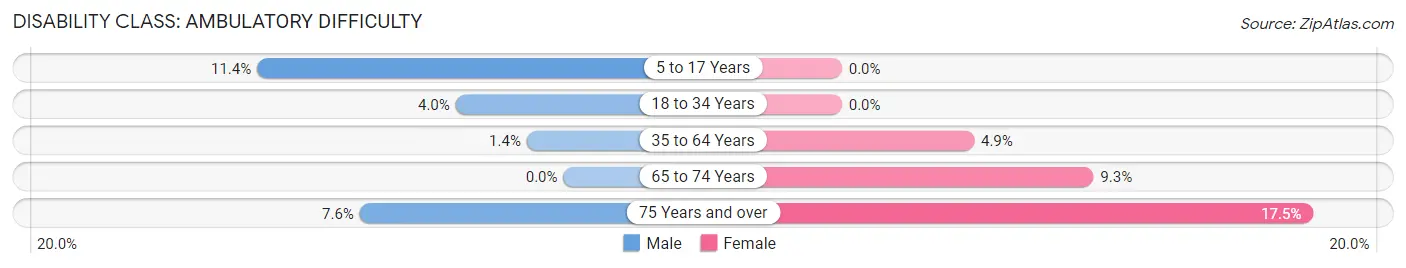
| Age Bracket | Male | Female |
| 5 to 17 Years | 24 (11.4%) | 0 (0.0%) |
| 18 to 34 Years | 5 (4.0%) | 0 (0.0%) |
| 35 to 64 Years | 6 (1.4%) | 26 (4.9%) |
| 65 to 74 Years | 0 (0.0%) | 24 (9.3%) |
| 75 Years and over | 13 (7.6%) | 42 (17.5%) |
Disability Class: Self-Care Difficulty
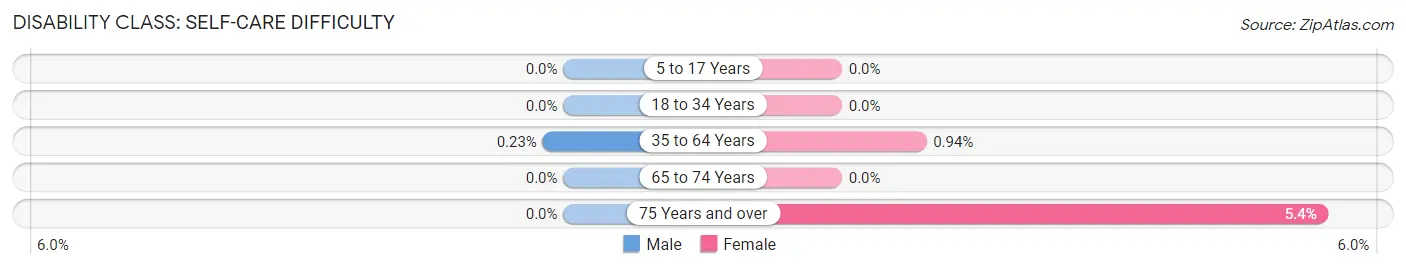
| Age Bracket | Male | Female |
| 5 to 17 Years | 0 (0.0%) | 0 (0.0%) |
| 18 to 34 Years | 0 (0.0%) | 0 (0.0%) |
| 35 to 64 Years | 1 (0.2%) | 5 (0.9%) |
| 65 to 74 Years | 0 (0.0%) | 0 (0.0%) |
| 75 Years and over | 0 (0.0%) | 13 (5.4%) |
Technology Access in Laurel Park
Computing Device Access in Laurel Park
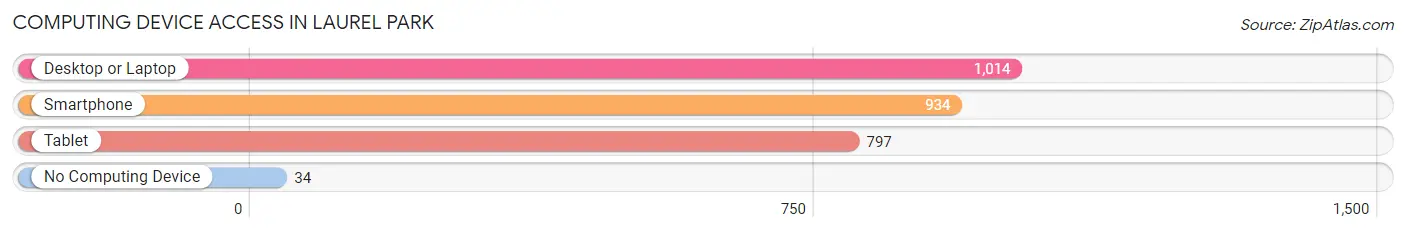
| Device Type | # Households | % Households |
| Desktop or Laptop | 1,014 | 91.1% |
| Smartphone | 934 | 83.9% |
| Tablet | 797 | 71.6% |
| No Computing Device | 34 | 3.0% |
| Total | 1,113 | 100.0% |
Internet Access in Laurel Park
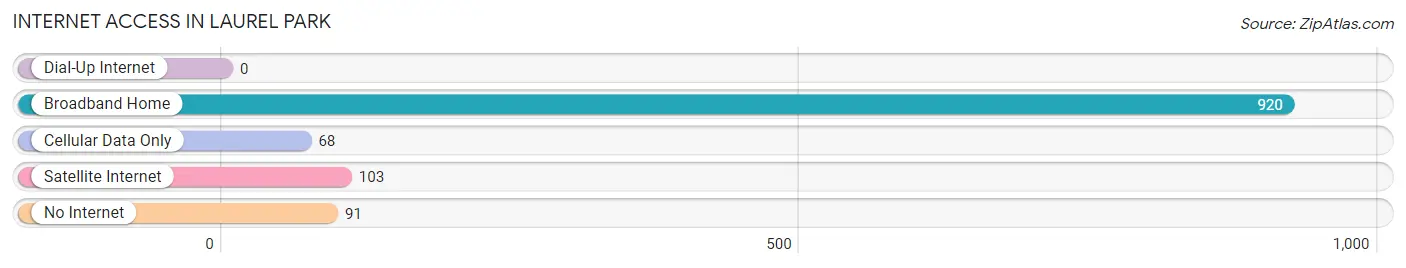
| Internet Type | # Households | % Households |
| Dial-Up Internet | 0 | 0.0% |
| Broadband Home | 920 | 82.7% |
| Cellular Data Only | 68 | 6.1% |
| Satellite Internet | 103 | 9.2% |
| No Internet | 91 | 8.2% |
| Total | 1,113 | 100.0% |
Laurel Park Summary
Laurel Park is a town located in Henderson County, North Carolina. It is situated in the Blue Ridge Mountains, approximately 25 miles south of Asheville. The town was founded in 1891 and incorporated in 1913. As of the 2010 census, the population of Laurel Park was 1,817.
Geography
Laurel Park is located at 35°19'25"N 82°31'45"W (35.323862, -82.529092). The town is situated in the Blue Ridge Mountains, approximately 25 miles south of Asheville. The elevation of Laurel Park is 2,717 feet above sea level. The town is located in the Eastern Time Zone.
The town of Laurel Park is located in Henderson County, North Carolina. The town is bordered by the towns of Fletcher to the north, Mills River to the east, and Hendersonville to the south. The town is also bordered by the Pisgah National Forest to the west.
Climate
Laurel Park has a humid subtropical climate, with hot, humid summers and mild winters. The average annual temperature is 57°F, with an average high of 73°F in July and an average low of 41°F in January. The average annual precipitation is 45 inches, with an average of 5.5 inches of snowfall per year.
Demographics
As of the 2010 census, the population of Laurel Park was 1,817. The racial makeup of the town was 94.3% White, 2.2% African American, 0.3% Native American, 0.7% Asian, 0.1% Pacific Islander, 1.2% from other races, and 1.2% from two or more races. Hispanic or Latino of any race were 3.2% of the population.
The median household income in Laurel Park was $45,938, and the median family income was $51,964. The per capita income for the town was $25,945. About 8.3% of families and 10.2% of the population were below the poverty line, including 14.2% of those under age 18 and 5.2% of those age 65 or over.
Economy
The economy of Laurel Park is largely based on tourism and agriculture. The town is home to several wineries, breweries, and distilleries, as well as a variety of restaurants and shops. The town is also home to several farms, which produce a variety of fruits and vegetables.
The town is also home to several manufacturing companies, including a furniture manufacturer, a plastics manufacturer, and a metal fabrication company. The town is also home to several technology companies, including a software development company and a web design company.
History
Laurel Park was founded in 1891 by a group of settlers from the nearby town of Hendersonville. The town was named after the laurel trees that grew in the area. The town was incorporated in 1913.
In the early 20th century, Laurel Park was a popular tourist destination, with several hotels and resorts located in the area. The town was also home to several factories, including a furniture factory and a plastics factory.
In the late 20th century, the town began to experience a decline in population as many of the factories closed and the tourist industry declined. In recent years, the town has experienced a resurgence in population as new businesses have opened and the town has become a popular destination for tourists.
Common Questions
What is Per Capita Income in Laurel Park?
Per Capita income in Laurel Park is $50,560.
What is the Median Family Income in Laurel Park?
Median Family Income in Laurel Park is $111,042.
What is the Median Household income in Laurel Park?
Median Household Income in Laurel Park is $90,855.
What is Income or Wage Gap in Laurel Park?
Income or Wage Gap in Laurel Park is 26.4%.
Women in Laurel Park earn 73.6 cents for every dollar earned by a man.
What is Inequality or Gini Index in Laurel Park?
Inequality or Gini Index in Laurel Park is 0.43.
What is the Total Population of Laurel Park?
Total Population of Laurel Park is 2,615.
What is the Total Male Population of Laurel Park?
Total Male Population of Laurel Park is 1,229.
What is the Total Female Population of Laurel Park?
Total Female Population of Laurel Park is 1,386.
What is the Ratio of Males per 100 Females in Laurel Park?
There are 88.67 Males per 100 Females in Laurel Park.
What is the Ratio of Females per 100 Males in Laurel Park?
There are 112.77 Females per 100 Males in Laurel Park.
What is the Median Population Age in Laurel Park?
Median Population Age in Laurel Park is 57.2 Years.
What is the Average Family Size in Laurel Park
Average Family Size in Laurel Park is 2.8 People.
What is the Average Household Size in Laurel Park
Average Household Size in Laurel Park is 2.2 People.
How Large is the Labor Force in Laurel Park?
There are 1,082 People in the Labor Forcein in Laurel Park.
What is the Percentage of People in the Labor Force in Laurel Park?
47.1% of People are in the Labor Force in Laurel Park.
What is the Unemployment Rate in Laurel Park?
Unemployment Rate in Laurel Park is 3.0%.