Zip Codes with the Highest Percentage of Population Employed in Computer & Mathematics in North Carolina
RELATED REPORTS & OPTIONS
Computer & Mathematics
North Carolina
Compare Zip Codes
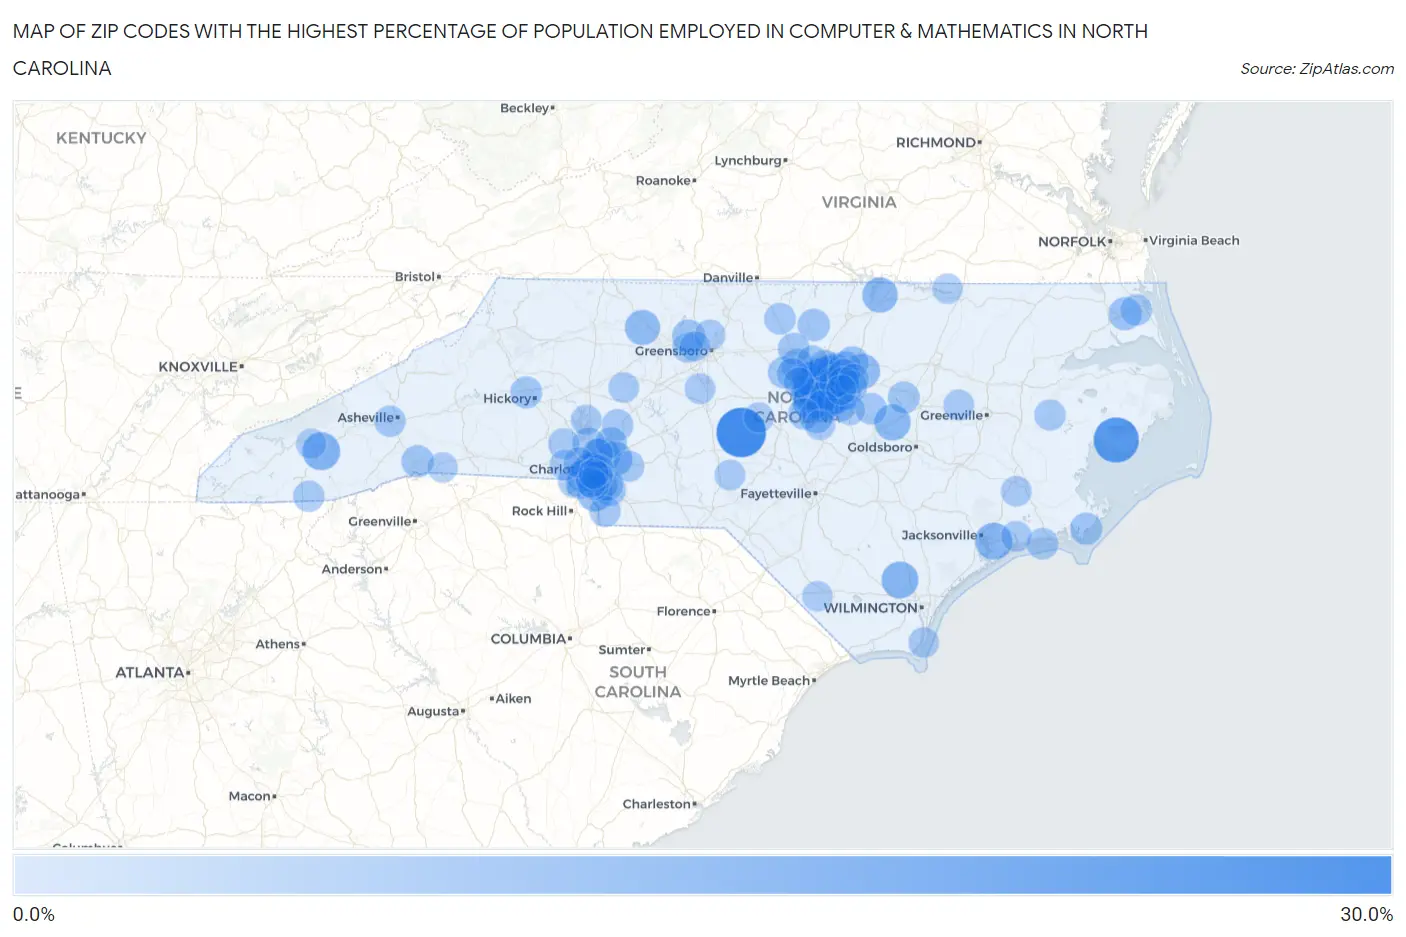
Map of Zip Codes with the Highest Percentage of Population Employed in Computer & Mathematics in North Carolina
0.0%
30.0%
Zip Codes with the Highest Percentage of Population Employed in Computer & Mathematics in North Carolina
| Zip Code | % Employed | vs State | vs National | |
| 1. | 27259 | 28.9% | 3.5%(+25.3)#1 | 3.5%(+25.4)#58 |
| 2. | 27885 | 23.3% | 3.5%(+19.7)#2 | 3.5%(+19.7)#92 |
| 3. | 27560 | 21.0% | 3.5%(+17.4)#3 | 3.5%(+17.5)#115 |
| 4. | 27519 | 18.4% | 3.5%(+14.8)#4 | 3.5%(+14.9)#165 |
| 5. | 28788 | 13.7% | 3.5%(+10.2)#5 | 3.5%(+10.2)#322 |
| 6. | 27513 | 13.5% | 3.5%(+9.97)#6 | 3.5%(+9.99)#332 |
| 7. | 27523 | 13.4% | 3.5%(+9.90)#7 | 3.5%(+9.92)#338 |
| 8. | 27518 | 13.3% | 3.5%(+9.78)#8 | 3.5%(+9.80)#342 |
| 9. | 27502 | 12.9% | 3.5%(+9.39)#9 | 3.5%(+9.42)#366 |
| 10. | 28544 | 12.8% | 3.5%(+9.27)#10 | 3.5%(+9.29)#374 |
| 11. | 28435 | 12.4% | 3.5%(+8.88)#11 | 3.5%(+8.91)#402 |
| 12. | 27601 | 12.2% | 3.5%(+8.66)#12 | 3.5%(+8.68)#422 |
| 13. | 27555 | 11.6% | 3.5%(+8.05)#13 | 3.5%(+8.08)#481 |
| 14. | 27617 | 11.5% | 3.5%(+7.98)#14 | 3.5%(+8.00)#491 |
| 15. | 27553 | 10.6% | 3.5%(+7.05)#15 | 3.5%(+7.07)#614 |
| 16. | 28277 | 10.6% | 3.5%(+7.03)#16 | 3.5%(+7.05)#618 |
| 17. | 28262 | 10.5% | 3.5%(+6.98)#17 | 3.5%(+7.00)#627 |
| 18. | 27050 | 10.4% | 3.5%(+6.82)#18 | 3.5%(+6.84)#650 |
| 19. | 27571 | 10.3% | 3.5%(+6.71)#19 | 3.5%(+6.73)#668 |
| 20. | 28203 | 10.1% | 3.5%(+6.53)#20 | 3.5%(+6.55)#699 |
| 21. | 28075 | 9.9% | 3.5%(+6.31)#21 | 3.5%(+6.33)#730 |
| 22. | 27713 | 9.0% | 3.5%(+5.47)#22 | 3.5%(+5.49)#899 |
| 23. | 28204 | 8.9% | 3.5%(+5.32)#23 | 3.5%(+5.34)#936 |
| 24. | 27613 | 8.7% | 3.5%(+5.17)#24 | 3.5%(+5.19)#983 |
| 25. | 28202 | 8.7% | 3.5%(+5.13)#25 | 3.5%(+5.15)#998 |
| 26. | 27540 | 8.6% | 3.5%(+5.03)#26 | 3.5%(+5.05)#1,028 |
| 27. | 27606 | 8.6% | 3.5%(+5.03)#27 | 3.5%(+5.05)#1,029 |
| 28. | 27607 | 8.2% | 3.5%(+4.62)#28 | 3.5%(+4.64)#1,157 |
| 29. | 28217 | 7.9% | 3.5%(+4.33)#29 | 3.5%(+4.36)#1,242 |
| 30. | 27310 | 7.9% | 3.5%(+4.31)#30 | 3.5%(+4.33)#1,255 |
| 31. | 27921 | 7.8% | 3.5%(+4.26)#31 | 3.5%(+4.29)#1,279 |
| 32. | 27511 | 7.3% | 3.5%(+3.77)#32 | 3.5%(+3.79)#1,460 |
| 33. | 27614 | 7.1% | 3.5%(+3.54)#33 | 3.5%(+3.56)#1,580 |
| 34. | 27514 | 7.0% | 3.5%(+3.47)#34 | 3.5%(+3.50)#1,612 |
| 35. | 27603 | 7.0% | 3.5%(+3.47)#35 | 3.5%(+3.49)#1,615 |
| 36. | 27587 | 7.0% | 3.5%(+3.45)#36 | 3.5%(+3.48)#1,624 |
| 37. | 27612 | 7.0% | 3.5%(+3.42)#37 | 3.5%(+3.44)#1,644 |
| 38. | 28731 | 6.9% | 3.5%(+3.40)#38 | 3.5%(+3.42)#1,656 |
| 39. | 27539 | 6.9% | 3.5%(+3.33)#39 | 3.5%(+3.35)#1,694 |
| 40. | 28078 | 6.9% | 3.5%(+3.32)#40 | 3.5%(+3.34)#1,703 |
| 41. | 27572 | 6.8% | 3.5%(+3.28)#41 | 3.5%(+3.30)#1,725 |
| 42. | 28579 | 6.8% | 3.5%(+3.23)#42 | 3.5%(+3.25)#1,752 |
| 43. | 27703 | 6.7% | 3.5%(+3.20)#43 | 3.5%(+3.22)#1,764 |
| 44. | 27615 | 6.5% | 3.5%(+2.92)#44 | 3.5%(+2.94)#1,958 |
| 45. | 28270 | 6.4% | 3.5%(+2.84)#45 | 3.5%(+2.86)#2,007 |
| 46. | 27880 | 6.4% | 3.5%(+2.81)#46 | 3.5%(+2.83)#2,037 |
| 47. | 28104 | 6.3% | 3.5%(+2.76)#47 | 3.5%(+2.79)#2,074 |
| 48. | 27604 | 6.2% | 3.5%(+2.64)#48 | 3.5%(+2.67)#2,153 |
| 49. | 28667 | 6.2% | 3.5%(+2.64)#49 | 3.5%(+2.66)#2,155 |
| 50. | 27516 | 6.1% | 3.5%(+2.54)#50 | 3.5%(+2.56)#2,235 |
| 51. | 27278 | 6.0% | 3.5%(+2.47)#51 | 3.5%(+2.49)#2,301 |
| 52. | 27314 | 6.0% | 3.5%(+2.44)#52 | 3.5%(+2.46)#2,319 |
| 53. | 28088 | 6.0% | 3.5%(+2.44)#53 | 3.5%(+2.46)#2,321 |
| 54. | 28105 | 5.9% | 3.5%(+2.39)#54 | 3.5%(+2.41)#2,371 |
| 55. | 27973 | 5.9% | 3.5%(+2.38)#55 | 3.5%(+2.40)#2,381 |
| 56. | 27701 | 5.9% | 3.5%(+2.34)#56 | 3.5%(+2.36)#2,420 |
| 57. | 28575 | 5.9% | 3.5%(+2.34)#57 | 3.5%(+2.36)#2,424 |
| 58. | 28027 | 5.8% | 3.5%(+2.29)#58 | 3.5%(+2.31)#2,473 |
| 59. | 27510 | 5.6% | 3.5%(+2.08)#59 | 3.5%(+2.10)#2,653 |
| 60. | 28278 | 5.6% | 3.5%(+2.06)#60 | 3.5%(+2.08)#2,669 |
| 61. | 27527 | 5.6% | 3.5%(+2.06)#61 | 3.5%(+2.08)#2,671 |
| 62. | 28806 | 5.6% | 3.5%(+2.01)#62 | 3.5%(+2.04)#2,716 |
| 63. | 27562 | 5.6% | 3.5%(+2.01)#63 | 3.5%(+2.03)#2,721 |
| 64. | 28775 | 5.5% | 3.5%(+1.93)#64 | 3.5%(+1.95)#2,808 |
| 65. | 28173 | 5.4% | 3.5%(+1.84)#65 | 3.5%(+1.87)#2,906 |
| 66. | 28107 | 5.4% | 3.5%(+1.81)#66 | 3.5%(+1.83)#2,949 |
| 67. | 28006 | 5.3% | 3.5%(+1.80)#67 | 3.5%(+1.82)#2,956 |
| 68. | 27609 | 5.3% | 3.5%(+1.79)#68 | 3.5%(+1.81)#2,962 |
| 69. | 27865 | 5.3% | 3.5%(+1.75)#69 | 3.5%(+1.77)#3,011 |
| 70. | 28269 | 5.1% | 3.5%(+1.51)#70 | 3.5%(+1.53)#3,295 |
| 71. | 28273 | 5.0% | 3.5%(+1.49)#71 | 3.5%(+1.52)#3,317 |
| 72. | 28209 | 5.0% | 3.5%(+1.44)#72 | 3.5%(+1.47)#3,368 |
| 73. | 28101 | 5.0% | 3.5%(+1.44)#73 | 3.5%(+1.47)#3,369 |
| 74. | 27455 | 5.0% | 3.5%(+1.41)#74 | 3.5%(+1.43)#3,413 |
| 75. | 27829 | 4.7% | 3.5%(+1.18)#75 | 3.5%(+1.20)#3,757 |
| 76. | 28449 | 4.7% | 3.5%(+1.17)#76 | 3.5%(+1.19)#3,767 |
| 77. | 28584 | 4.7% | 3.5%(+1.17)#77 | 3.5%(+1.19)#3,768 |
| 78. | 28214 | 4.7% | 3.5%(+1.17)#78 | 3.5%(+1.19)#3,775 |
| 79. | 28205 | 4.7% | 3.5%(+1.11)#79 | 3.5%(+1.14)#3,845 |
| 80. | 27350 | 4.7% | 3.5%(+1.11)#80 | 3.5%(+1.13)#3,851 |
| 81. | 28562 | 4.7% | 3.5%(+1.10)#81 | 3.5%(+1.13)#3,869 |
| 82. | 28211 | 4.6% | 3.5%(+1.10)#82 | 3.5%(+1.12)#3,878 |
| 83. | 27014 | 4.6% | 3.5%(+1.07)#83 | 3.5%(+1.09)#3,919 |
| 84. | 28117 | 4.6% | 3.5%(+1.04)#84 | 3.5%(+1.06)#3,969 |
| 85. | 27281 | 4.6% | 3.5%(+1.02)#85 | 3.5%(+1.04)#3,994 |
| 86. | 27235 | 4.5% | 3.5%(+0.989)#86 | 3.5%(+1.01)#4,027 |
| 87. | 27529 | 4.5% | 3.5%(+0.971)#87 | 3.5%(+0.994)#4,049 |
| 88. | 28431 | 4.5% | 3.5%(+0.949)#88 | 3.5%(+0.971)#4,082 |
| 89. | 27526 | 4.5% | 3.5%(+0.930)#89 | 3.5%(+0.953)#4,120 |
| 90. | 28226 | 4.5% | 3.5%(+0.919)#90 | 3.5%(+0.942)#4,140 |
| 91. | 27616 | 4.5% | 3.5%(+0.908)#91 | 3.5%(+0.931)#4,164 |
| 92. | 28210 | 4.4% | 3.5%(+0.884)#92 | 3.5%(+0.907)#4,216 |
| 93. | 27517 | 4.4% | 3.5%(+0.882)#93 | 3.5%(+0.905)#4,219 |
| 94. | 27832 | 4.4% | 3.5%(+0.835)#94 | 3.5%(+0.858)#4,293 |
| 95. | 27207 | 4.4% | 3.5%(+0.818)#95 | 3.5%(+0.840)#4,322 |
| 96. | 28207 | 4.3% | 3.5%(+0.800)#96 | 3.5%(+0.822)#4,352 |
| 97. | 27409 | 4.3% | 3.5%(+0.794)#97 | 3.5%(+0.817)#4,359 |
| 98. | 28789 | 4.3% | 3.5%(+0.771)#98 | 3.5%(+0.794)#4,399 |
| 99. | 28782 | 4.3% | 3.5%(+0.746)#99 | 3.5%(+0.768)#4,447 |
| 100. | 27605 | 4.3% | 3.5%(+0.739)#100 | 3.5%(+0.762)#4,457 |
Common Questions
What are the Top 10 Zip Codes with the Highest Percentage of Population Employed in Computer & Mathematics in North Carolina?
Top 10 Zip Codes with the Highest Percentage of Population Employed in Computer & Mathematics in North Carolina are:
What zip code has the Highest Percentage of Population Employed in Computer & Mathematics in North Carolina?
27259 has the Highest Percentage of Population Employed in Computer & Mathematics in North Carolina with 28.9%.
What is the Percentage of Population Employed in Computer & Mathematics in the State of North Carolina?
Percentage of Population Employed in Computer & Mathematics in North Carolina is 3.5%.
What is the Percentage of Population Employed in Computer & Mathematics in the United States?
Percentage of Population Employed in Computer & Mathematics in the United States is 3.5%.