Bethlehem, NC Map & Demographics
Bethlehem Map
Bethlehem Overview
$51,662
PER CAPITA INCOME
$104,602
AVG FAMILY INCOME
$75,838
AVG HOUSEHOLD INCOME
46.4%
WAGE / INCOME GAP [ % ]
53.6¢/ $1
WAGE / INCOME GAP [ $ ]
0.44
INEQUALITY / GINI INDEX
3,688
TOTAL POPULATION
1,899
MALE POPULATION
1,789
FEMALE POPULATION
106.15
MALES / 100 FEMALES
94.21
FEMALES / 100 MALES
52.3
MEDIAN AGE
2.8
AVG FAMILY SIZE
2.3
AVG HOUSEHOLD SIZE
1,844
LABOR FORCE [ PEOPLE ]
56.6%
PERCENT IN LABOR FORCE
2.9%
UNEMPLOYMENT RATE
Income in Bethlehem
Income Overview in Bethlehem
Per Capita Income in Bethlehem is $51,662, while median incomes of families and households are $104,602 and $75,838 respectively.
| Characteristic | Number | Measure |
| Per Capita Income | 3,688 | $51,662 |
| Median Family Income | 1,147 | $104,602 |
| Mean Family Income | 1,147 | $137,821 |
| Median Household Income | 1,617 | $75,838 |
| Mean Household Income | 1,617 | $112,093 |
| Income Deficit | 1,147 | $0 |
| Wage / Income Gap (%) | 3,688 | 46.44% |
| Wage / Income Gap ($) | 3,688 | 53.56¢ per $1 |
| Gini / Inequality Index | 3,688 | 0.44 |
Earnings by Sex in Bethlehem
Average Earnings in Bethlehem are $53,017, $67,683 for men and $36,250 for women, a difference of 46.4%.
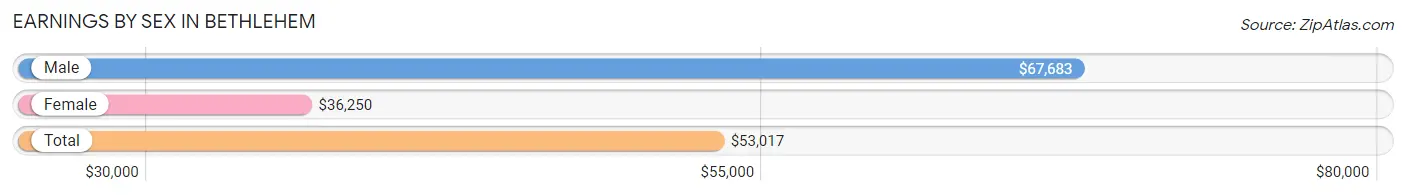
| Sex | Number | Average Earnings |
| Male | 1,050 (54.4%) | $67,683 |
| Female | 880 (45.6%) | $36,250 |
| Total | 1,930 (100.0%) | $53,017 |
Earnings by Sex by Income Bracket in Bethlehem
The most common earnings brackets in Bethlehem are $100,000+ for men (308 | 29.3%) and $55,000 to $64,999 for women (156 | 17.7%).
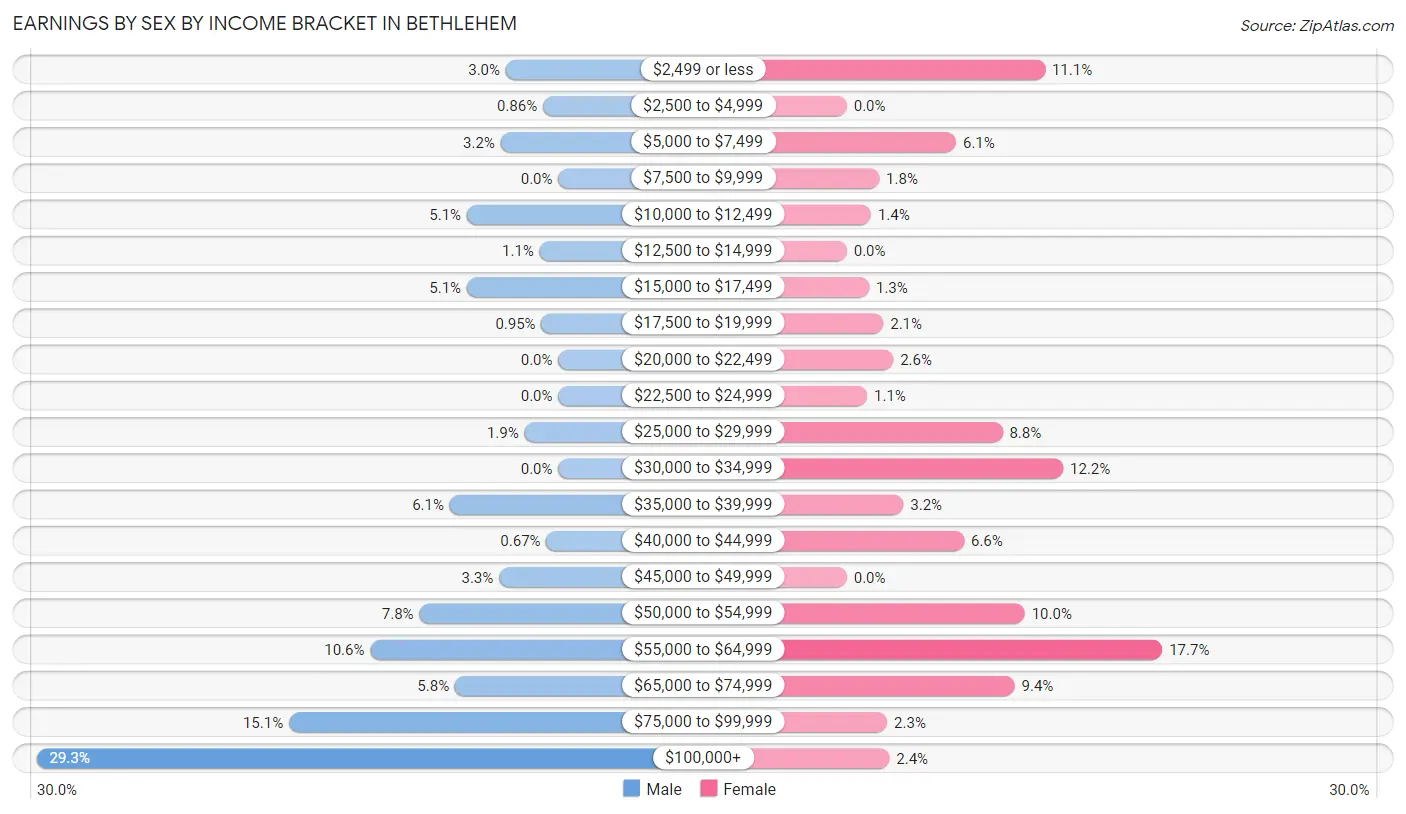
| Income | Male | Female |
| $2,499 or less | 31 (2.9%) | 98 (11.1%) |
| $2,500 to $4,999 | 9 (0.9%) | 0 (0.0%) |
| $5,000 to $7,499 | 34 (3.2%) | 54 (6.1%) |
| $7,500 to $9,999 | 0 (0.0%) | 16 (1.8%) |
| $10,000 to $12,499 | 54 (5.1%) | 12 (1.4%) |
| $12,500 to $14,999 | 11 (1.1%) | 0 (0.0%) |
| $15,000 to $17,499 | 54 (5.1%) | 11 (1.3%) |
| $17,500 to $19,999 | 10 (0.9%) | 18 (2.1%) |
| $20,000 to $22,499 | 0 (0.0%) | 23 (2.6%) |
| $22,500 to $24,999 | 0 (0.0%) | 10 (1.1%) |
| $25,000 to $29,999 | 20 (1.9%) | 77 (8.7%) |
| $30,000 to $34,999 | 0 (0.0%) | 107 (12.2%) |
| $35,000 to $39,999 | 64 (6.1%) | 28 (3.2%) |
| $40,000 to $44,999 | 7 (0.7%) | 58 (6.6%) |
| $45,000 to $49,999 | 35 (3.3%) | 0 (0.0%) |
| $50,000 to $54,999 | 82 (7.8%) | 88 (10.0%) |
| $55,000 to $64,999 | 111 (10.6%) | 156 (17.7%) |
| $65,000 to $74,999 | 61 (5.8%) | 83 (9.4%) |
| $75,000 to $99,999 | 159 (15.1%) | 20 (2.3%) |
| $100,000+ | 308 (29.3%) | 21 (2.4%) |
| Total | 1,050 (100.0%) | 880 (100.0%) |
Earnings by Sex by Educational Attainment in Bethlehem
Average earnings in Bethlehem are $67,683 for men and $42,016 for women, a difference of 37.9%. Men with an educational attainment of graduate degree enjoy the highest average annual earnings of $136,453, while those with high school diploma education earn the least with $45,234. Women with an educational attainment of graduate degree earn the most with the average annual earnings of $54,279, while those with college or associate's degree education have the smallest earnings of $34,319.
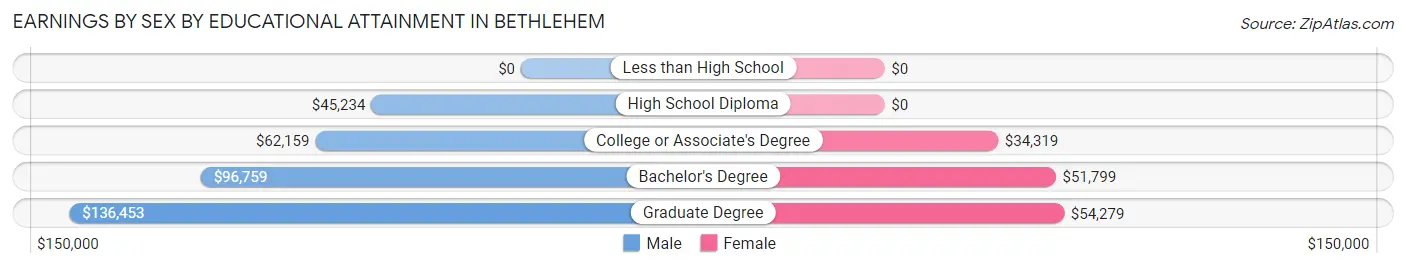
| Educational Attainment | Male Income | Female Income |
| Less than High School | - | - |
| High School Diploma | $45,234 | $0 |
| College or Associate's Degree | $62,159 | $34,319 |
| Bachelor's Degree | $96,759 | $51,799 |
| Graduate Degree | $136,453 | $54,279 |
| Total | $67,683 | $42,016 |
Family Income in Bethlehem
Family Income Brackets in Bethlehem
According to the Bethlehem family income data, there are 309 families falling into the $100,000 to $149,999 income range, which is the most common income bracket and makes up 26.9% of all families.
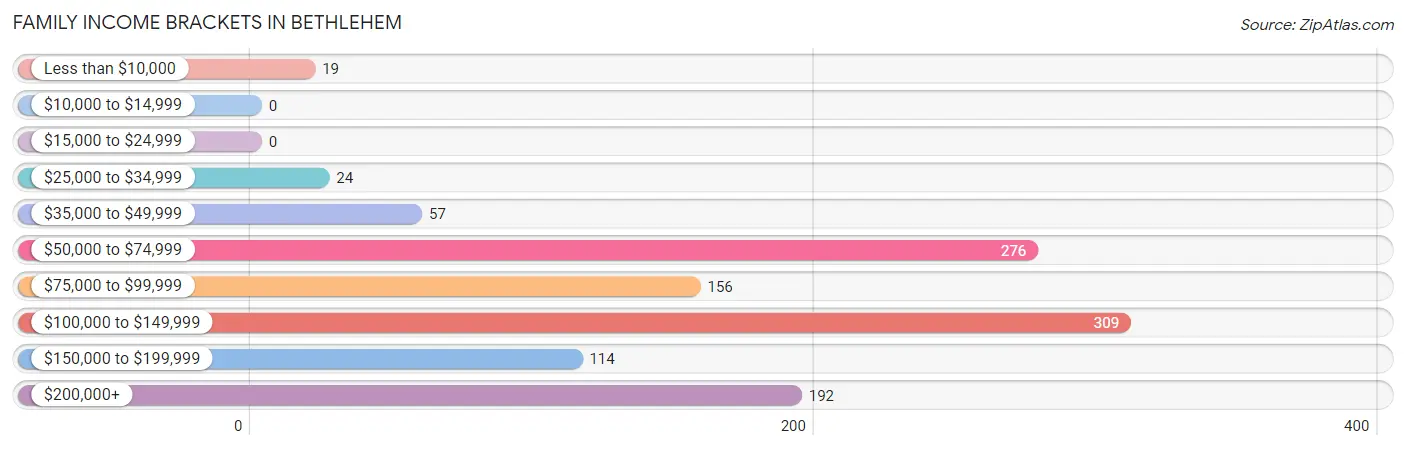
| Income Bracket | # Families | % Families |
| Less than $10,000 | 19 | 1.7% |
| $10,000 to $14,999 | 0 | 0.0% |
| $15,000 to $24,999 | 0 | 0.0% |
| $25,000 to $34,999 | 24 | 2.1% |
| $35,000 to $49,999 | 57 | 5.0% |
| $50,000 to $74,999 | 276 | 24.1% |
| $75,000 to $99,999 | 156 | 13.6% |
| $100,000 to $149,999 | 309 | 26.9% |
| $150,000 to $199,999 | 114 | 9.9% |
| $200,000+ | 192 | 16.7% |
Family Income by Famaliy Size in Bethlehem
3-person families (196 | 17.1%) account for the highest median family income in Bethlehem with $125,426 per family, while 2-person families (767 | 66.9%) have the highest median income of $58,952 per family member.
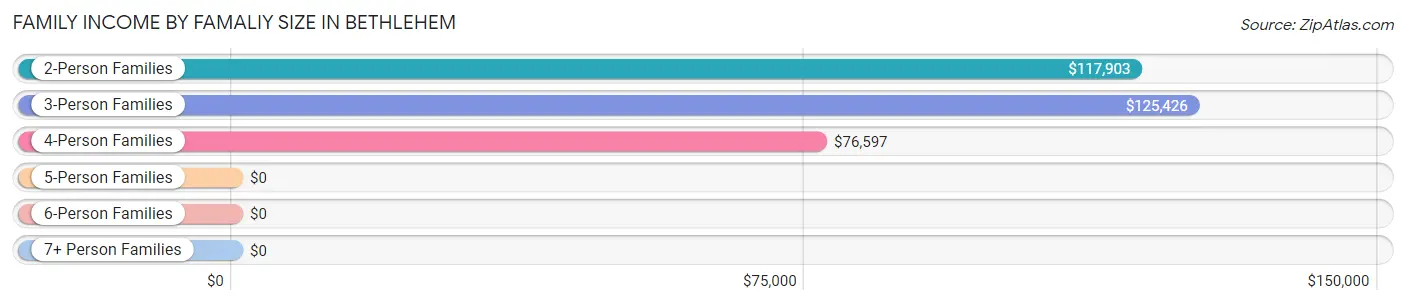
| Income Bracket | # Families | Median Income |
| 2-Person Families | 767 (66.9%) | $117,903 |
| 3-Person Families | 196 (17.1%) | $125,426 |
| 4-Person Families | 131 (11.4%) | $76,597 |
| 5-Person Families | 41 (3.6%) | $0 |
| 6-Person Families | 12 (1.1%) | $0 |
| 7+ Person Families | 0 (0.0%) | $0 |
| Total | 1,147 (100.0%) | $104,602 |
Family Income by Number of Earners in Bethlehem
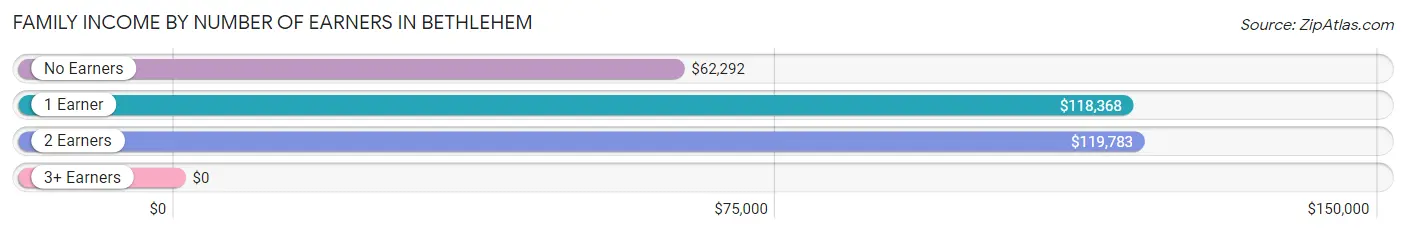
| Number of Earners | # Families | Median Income |
| No Earners | 172 (15.0%) | $62,292 |
| 1 Earner | 455 (39.7%) | $118,368 |
| 2 Earners | 460 (40.1%) | $119,783 |
| 3+ Earners | 60 (5.2%) | $0 |
| Total | 1,147 (100.0%) | $104,602 |
Household Income in Bethlehem
Household Income Brackets in Bethlehem
With 450 households falling in the category, the $50,000 to $74,999 income range is the most frequent in Bethlehem, accounting for 27.8% of all households. In contrast, only 21 households (1.3%) fall into the $10,000 to $14,999 income bracket, making it the least populous group.
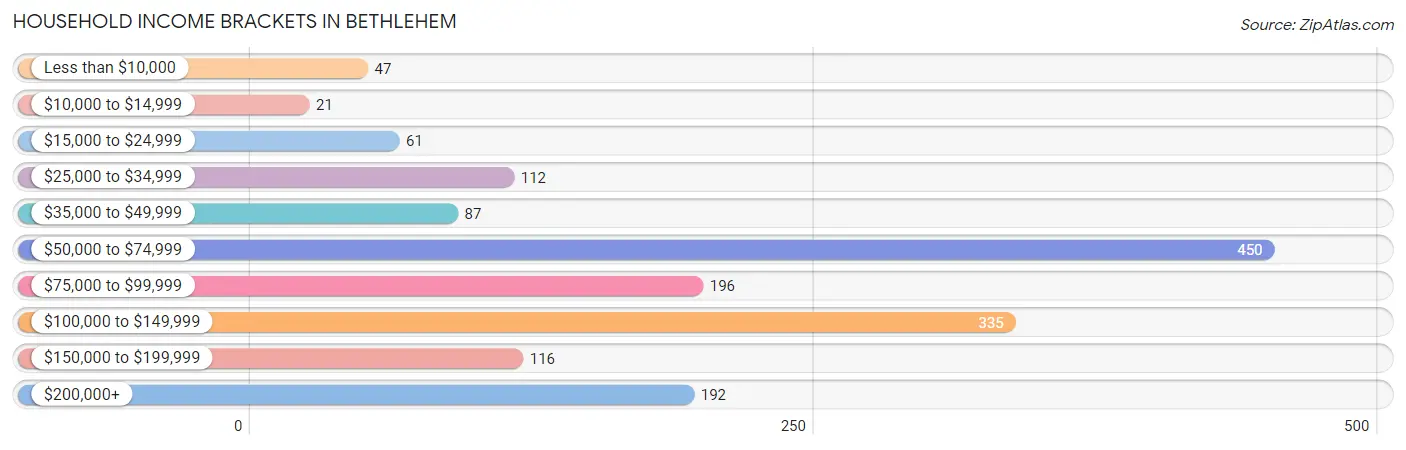
| Income Bracket | # Households | % Households |
| Less than $10,000 | 47 | 2.9% |
| $10,000 to $14,999 | 21 | 1.3% |
| $15,000 to $24,999 | 61 | 3.8% |
| $25,000 to $34,999 | 112 | 6.9% |
| $35,000 to $49,999 | 87 | 5.4% |
| $50,000 to $74,999 | 450 | 27.8% |
| $75,000 to $99,999 | 196 | 12.1% |
| $100,000 to $149,999 | 335 | 20.7% |
| $150,000 to $199,999 | 116 | 7.2% |
| $200,000+ | 192 | 11.9% |
Household Income by Householder Age in Bethlehem
The median household income in Bethlehem is $75,838, with the highest median household income of $117,604 found in the 45 to 64 years age bracket for the primary householder. A total of 719 households (44.5%) fall into this category.
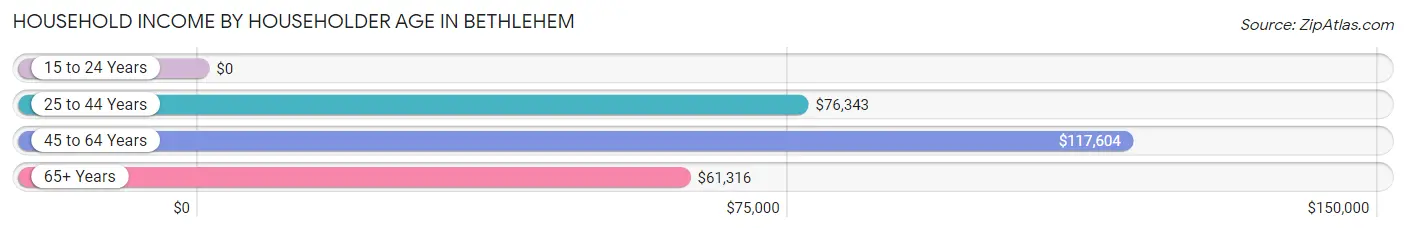
| Income Bracket | # Households | Median Income |
| 15 to 24 Years | 0 (0.0%) | $0 |
| 25 to 44 Years | 432 (26.7%) | $76,343 |
| 45 to 64 Years | 719 (44.5%) | $117,604 |
| 65+ Years | 466 (28.8%) | $61,316 |
| Total | 1,617 (100.0%) | $75,838 |
Poverty in Bethlehem
Income Below Poverty by Sex and Age in Bethlehem
With 1.6% poverty level for males and 3.1% for females among the residents of Bethlehem, 75 year old and over males and 55 to 64 year old females are the most vulnerable to poverty, with 12 males (8.8%) and 55 females (14.0%) in their respective age groups living below the poverty level.
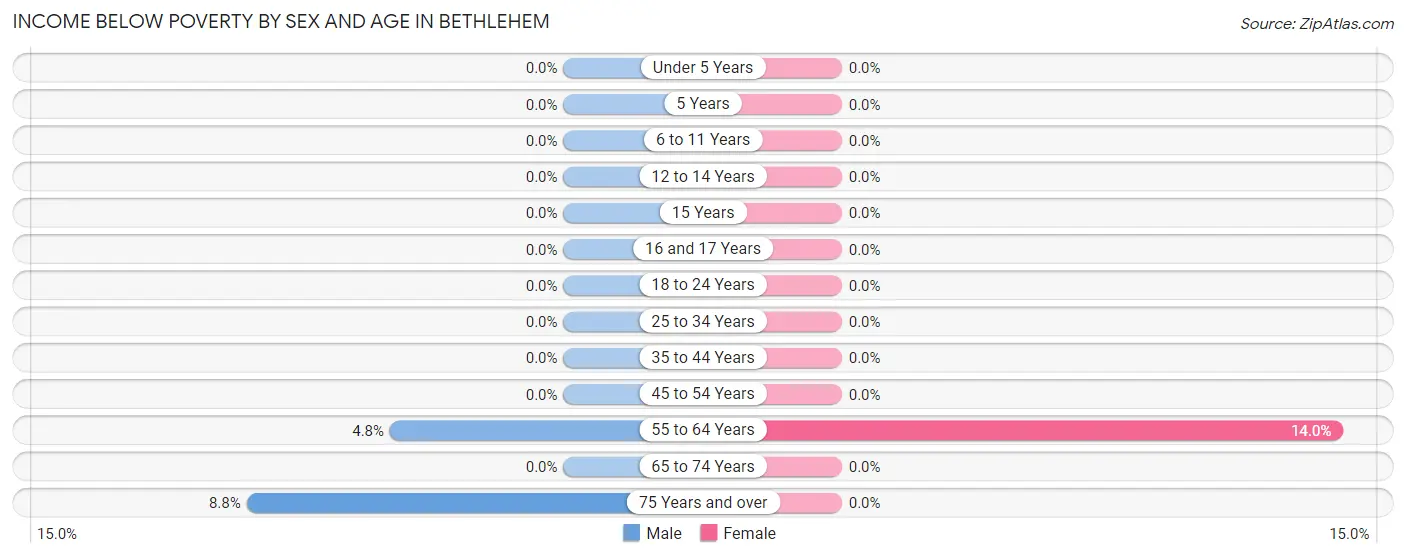
| Age Bracket | Male | Female |
| Under 5 Years | 0 (0.0%) | 0 (0.0%) |
| 5 Years | 0 (0.0%) | 0 (0.0%) |
| 6 to 11 Years | 0 (0.0%) | 0 (0.0%) |
| 12 to 14 Years | 0 (0.0%) | 0 (0.0%) |
| 15 Years | 0 (0.0%) | 0 (0.0%) |
| 16 and 17 Years | 0 (0.0%) | 0 (0.0%) |
| 18 to 24 Years | 0 (0.0%) | 0 (0.0%) |
| 25 to 34 Years | 0 (0.0%) | 0 (0.0%) |
| 35 to 44 Years | 0 (0.0%) | 0 (0.0%) |
| 45 to 54 Years | 0 (0.0%) | 0 (0.0%) |
| 55 to 64 Years | 19 (4.8%) | 55 (14.0%) |
| 65 to 74 Years | 0 (0.0%) | 0 (0.0%) |
| 75 Years and over | 12 (8.8%) | 0 (0.0%) |
| Total | 31 (1.6%) | 55 (3.1%) |
Income Above Poverty by Sex and Age in Bethlehem
According to the poverty statistics in Bethlehem, males aged under 5 years and females aged under 5 years are the age groups that are most secure financially, with 100.0% of males and 100.0% of females in these age groups living above the poverty line.
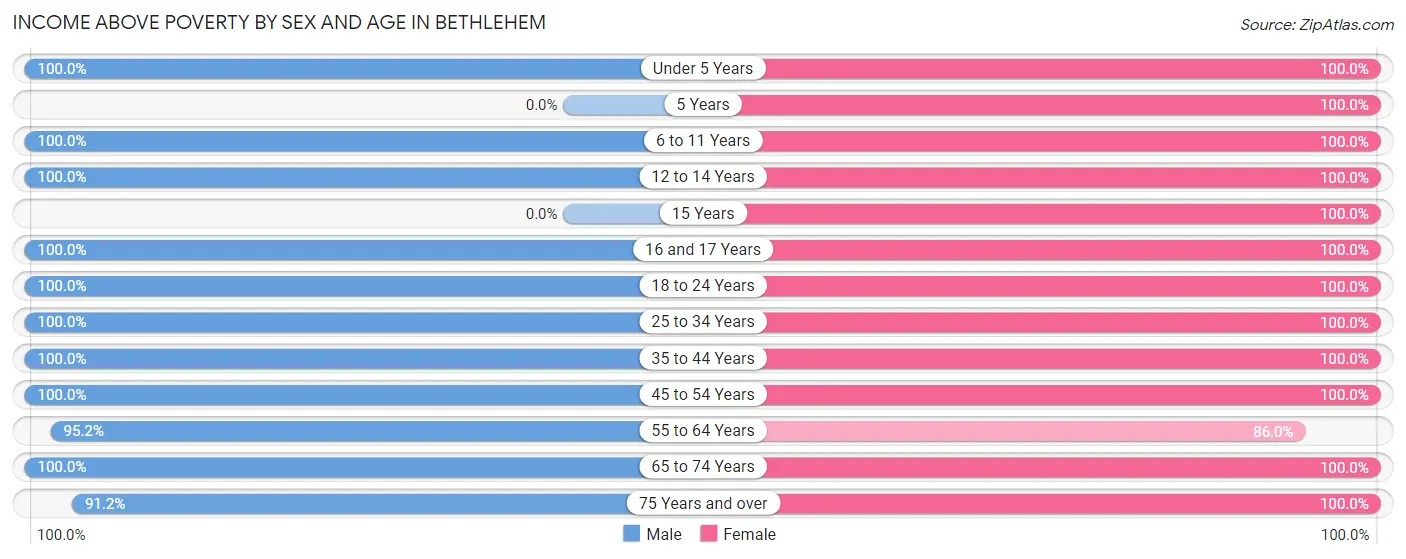
| Age Bracket | Male | Female |
| Under 5 Years | 19 (100.0%) | 22 (100.0%) |
| 5 Years | 0 (0.0%) | 15 (100.0%) |
| 6 to 11 Years | 154 (100.0%) | 90 (100.0%) |
| 12 to 14 Years | 47 (100.0%) | 54 (100.0%) |
| 15 Years | 0 (0.0%) | 29 (100.0%) |
| 16 and 17 Years | 65 (100.0%) | 23 (100.0%) |
| 18 to 24 Years | 58 (100.0%) | 151 (100.0%) |
| 25 to 34 Years | 236 (100.0%) | 115 (100.0%) |
| 35 to 44 Years | 181 (100.0%) | 306 (100.0%) |
| 45 to 54 Years | 277 (100.0%) | 166 (100.0%) |
| 55 to 64 Years | 374 (95.2%) | 339 (86.0%) |
| 65 to 74 Years | 333 (100.0%) | 230 (100.0%) |
| 75 Years and over | 124 (91.2%) | 194 (100.0%) |
| Total | 1,868 (98.4%) | 1,734 (96.9%) |
Income Below Poverty Among Married-Couple Families in Bethlehem
The poverty statistics for married-couple families in Bethlehem show that 2.1% or 19 of the total 898 families live below the poverty line. Families with no children have the highest poverty rate of 2.6%, comprising of 19 families. On the other hand, families with 1 or 2 children have the lowest poverty rate of 0.0%, which includes 0 families.
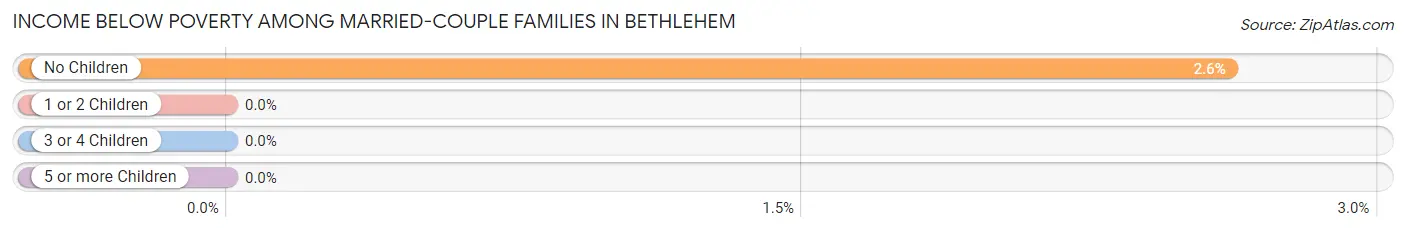
| Children | Above Poverty | Below Poverty |
| No Children | 710 (97.4%) | 19 (2.6%) |
| 1 or 2 Children | 138 (100.0%) | 0 (0.0%) |
| 3 or 4 Children | 31 (100.0%) | 0 (0.0%) |
| 5 or more Children | 0 (0.0%) | 0 (0.0%) |
| Total | 879 (97.9%) | 19 (2.1%) |
Income Below Poverty Among Single-Parent Households in Bethlehem
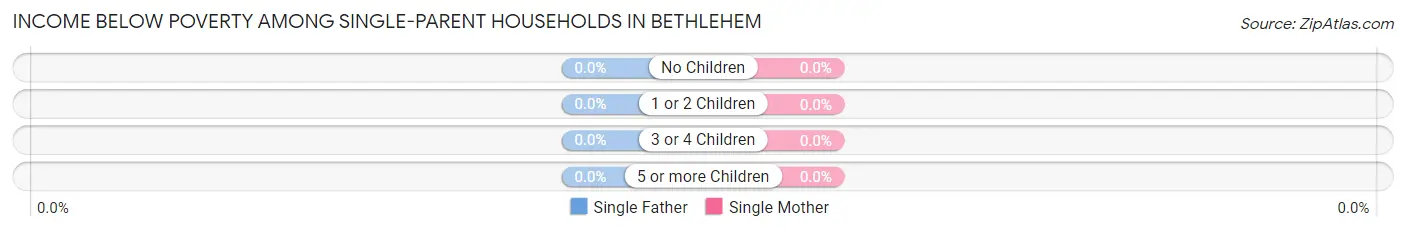
| Children | Single Father | Single Mother |
| No Children | 0 (0.0%) | 0 (0.0%) |
| 1 or 2 Children | 0 (0.0%) | 0 (0.0%) |
| 3 or 4 Children | 0 (0.0%) | 0 (0.0%) |
| 5 or more Children | 0 (0.0%) | 0 (0.0%) |
| Total | 0 (0.0%) | 0 (0.0%) |
Income Below Poverty Among Married-Couple vs Single-Parent Households in Bethlehem
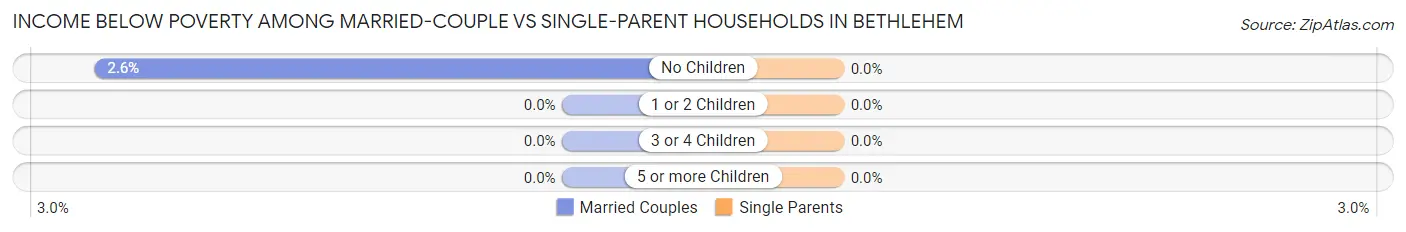
| Children | Married-Couple Families | Single-Parent Households |
| No Children | 19 (2.6%) | 0 (0.0%) |
| 1 or 2 Children | 0 (0.0%) | 0 (0.0%) |
| 3 or 4 Children | 0 (0.0%) | 0 (0.0%) |
| 5 or more Children | 0 (0.0%) | 0 (0.0%) |
| Total | 19 (2.1%) | 0 (0.0%) |
Race in Bethlehem
The most populous races in Bethlehem are White / Caucasian (3,440 | 93.3%), Asian (215 | 5.8%), and Hispanic or Latino (154 | 4.2%).
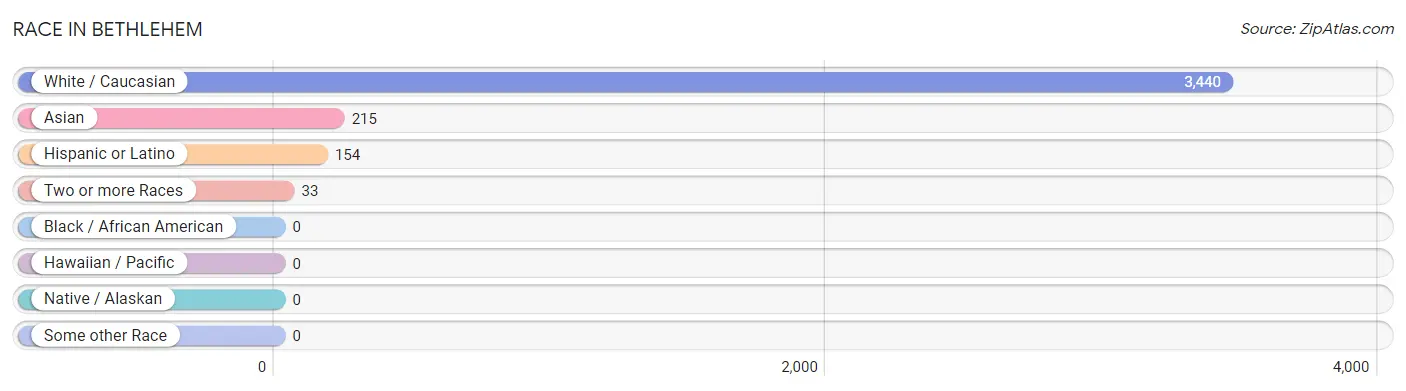
| Race | # Population | % Population |
| Asian | 215 | 5.8% |
| Black / African American | 0 | 0.0% |
| Hawaiian / Pacific | 0 | 0.0% |
| Hispanic or Latino | 154 | 4.2% |
| Native / Alaskan | 0 | 0.0% |
| White / Caucasian | 3,440 | 93.3% |
| Two or more Races | 33 | 0.9% |
| Some other Race | 0 | 0.0% |
| Total | 3,688 | 100.0% |
Ancestry in Bethlehem
The most populous ancestries reported in Bethlehem are German (932 | 25.3%), Irish (780 | 21.1%), American (511 | 13.9%), English (320 | 8.7%), and Italian (199 | 5.4%), together accounting for 74.4% of all Bethlehem residents.
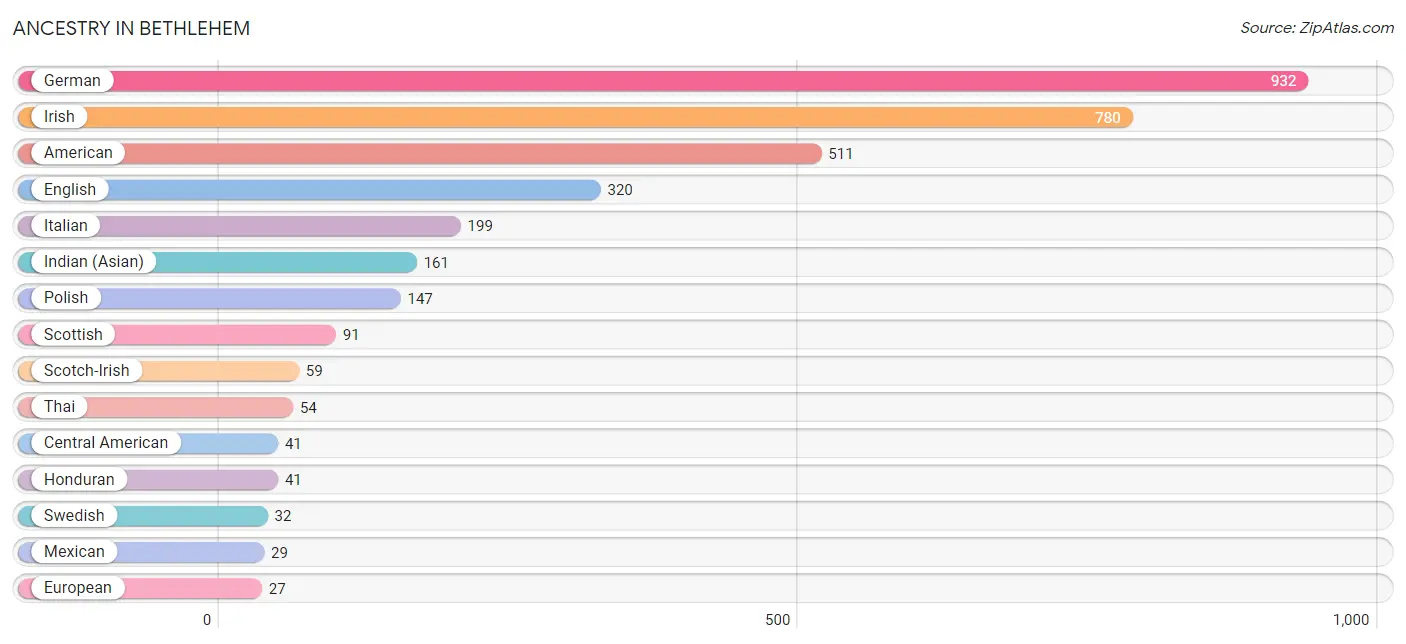
| Ancestry | # Population | % Population |
| American | 511 | 13.9% |
| Austrian | 11 | 0.3% |
| British | 16 | 0.4% |
| Central American | 41 | 1.1% |
| Chinese | 15 | 0.4% |
| Croatian | 15 | 0.4% |
| Dutch | 14 | 0.4% |
| English | 320 | 8.7% |
| European | 27 | 0.7% |
| French | 27 | 0.7% |
| French Canadian | 10 | 0.3% |
| German | 932 | 25.3% |
| Honduran | 41 | 1.1% |
| Indian (Asian) | 161 | 4.4% |
| Irish | 780 | 21.1% |
| Italian | 199 | 5.4% |
| Mexican | 29 | 0.8% |
| Polish | 147 | 4.0% |
| Portuguese | 11 | 0.3% |
| Russian | 11 | 0.3% |
| Scandinavian | 14 | 0.4% |
| Scotch-Irish | 59 | 1.6% |
| Scottish | 91 | 2.5% |
| Slovak | 13 | 0.4% |
| Swedish | 32 | 0.9% |
| Thai | 54 | 1.5% |
| Welsh | 14 | 0.4% | View All 27 Rows |
Immigrants in Bethlehem
The most numerous immigrant groups reported in Bethlehem came from Asia (142 | 3.8%), China (88 | 2.4%), Eastern Asia (88 | 2.4%), South Central Asia (54 | 1.5%), and India (43 | 1.2%), together accounting for 11.3% of all Bethlehem residents.
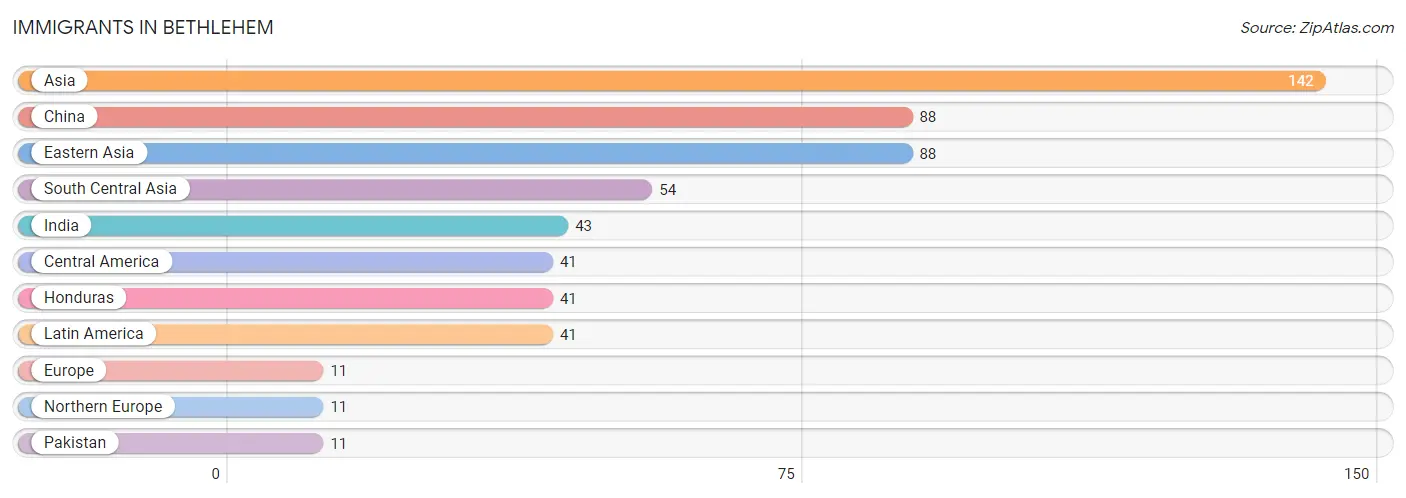
| Immigration Origin | # Population | % Population |
| Asia | 142 | 3.8% |
| Central America | 41 | 1.1% |
| China | 88 | 2.4% |
| Eastern Asia | 88 | 2.4% |
| Europe | 11 | 0.3% |
| Honduras | 41 | 1.1% |
| India | 43 | 1.2% |
| Latin America | 41 | 1.1% |
| Northern Europe | 11 | 0.3% |
| Pakistan | 11 | 0.3% |
| South Central Asia | 54 | 1.5% | View All 11 Rows |
Sex and Age in Bethlehem
Sex and Age in Bethlehem
The most populous age groups in Bethlehem are 70 to 74 Years (220 | 11.6%) for men and 60 to 64 Years (248 | 13.9%) for women.
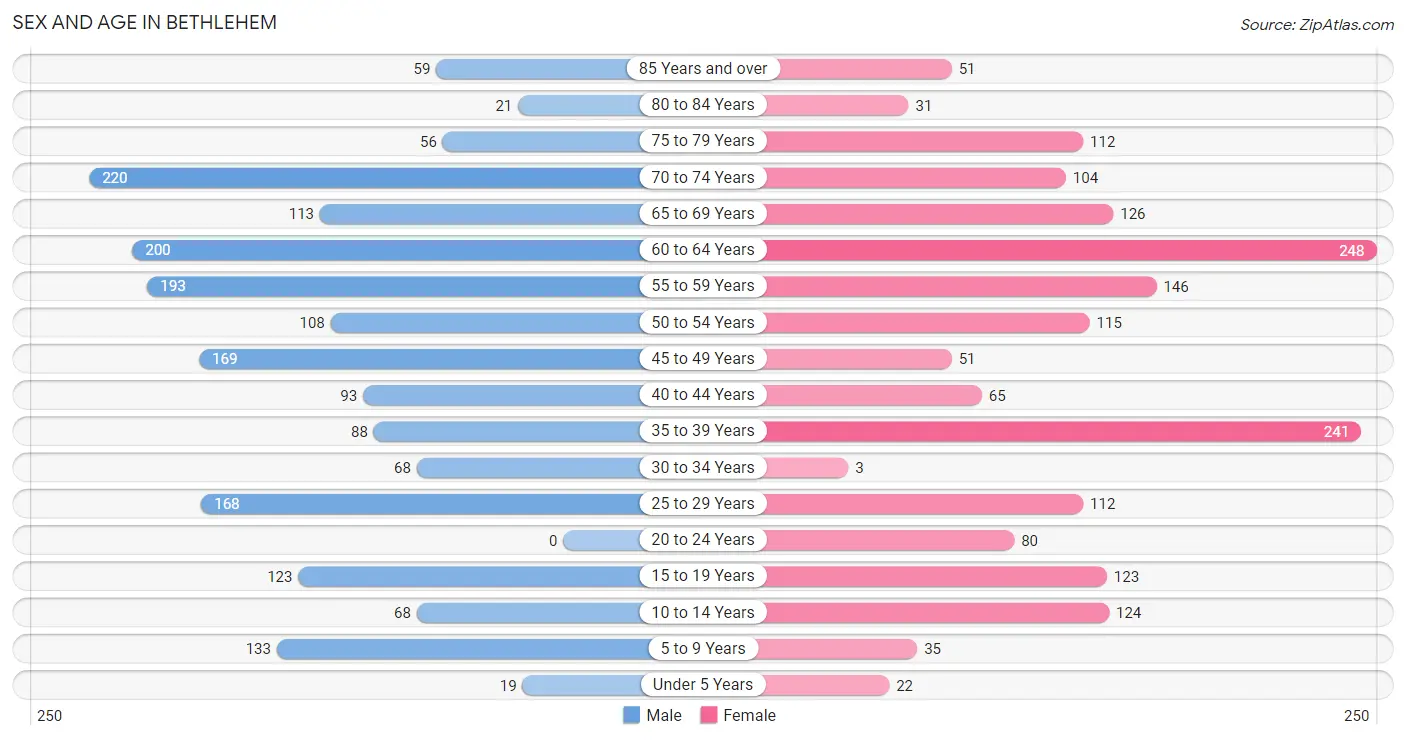
| Age Bracket | Male | Female |
| Under 5 Years | 19 (1.0%) | 22 (1.2%) |
| 5 to 9 Years | 133 (7.0%) | 35 (2.0%) |
| 10 to 14 Years | 68 (3.6%) | 124 (6.9%) |
| 15 to 19 Years | 123 (6.5%) | 123 (6.9%) |
| 20 to 24 Years | 0 (0.0%) | 80 (4.5%) |
| 25 to 29 Years | 168 (8.8%) | 112 (6.3%) |
| 30 to 34 Years | 68 (3.6%) | 3 (0.2%) |
| 35 to 39 Years | 88 (4.6%) | 241 (13.5%) |
| 40 to 44 Years | 93 (4.9%) | 65 (3.6%) |
| 45 to 49 Years | 169 (8.9%) | 51 (2.9%) |
| 50 to 54 Years | 108 (5.7%) | 115 (6.4%) |
| 55 to 59 Years | 193 (10.2%) | 146 (8.2%) |
| 60 to 64 Years | 200 (10.5%) | 248 (13.9%) |
| 65 to 69 Years | 113 (5.9%) | 126 (7.0%) |
| 70 to 74 Years | 220 (11.6%) | 104 (5.8%) |
| 75 to 79 Years | 56 (2.9%) | 112 (6.3%) |
| 80 to 84 Years | 21 (1.1%) | 31 (1.7%) |
| 85 Years and over | 59 (3.1%) | 51 (2.9%) |
| Total | 1,899 (100.0%) | 1,789 (100.0%) |
Families and Households in Bethlehem
Median Family Size in Bethlehem
The median family size in Bethlehem is 2.76 persons per family, with married-couple families (898 | 78.3%) accounting for the largest median family size of 2.84 persons per family. On the other hand, single male/father families (91 | 7.9%) represent the smallest median family size with 2.09 persons per family.
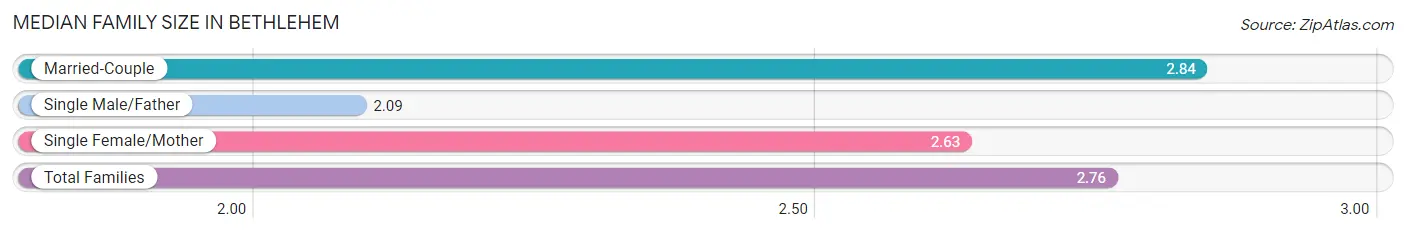
| Family Type | # Families | Family Size |
| Married-Couple | 898 (78.3%) | 2.84 |
| Single Male/Father | 91 (7.9%) | 2.09 |
| Single Female/Mother | 158 (13.8%) | 2.63 |
| Total Families | 1,147 (100.0%) | 2.76 |
Median Household Size in Bethlehem
The median household size in Bethlehem is 2.28 persons per household, with married-couple households (898 | 55.5%) accounting for the largest median household size of 2.84 persons per household. non-family households (470 | 29.1%) represent the smallest median household size with 1.12 persons per household.
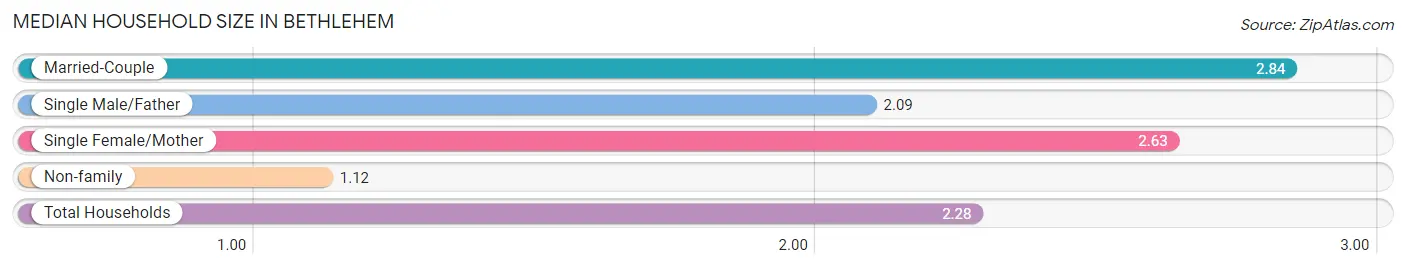
| Household Type | # Households | Household Size |
| Married-Couple | 898 (55.5%) | 2.84 |
| Single Male/Father | 91 (5.6%) | 2.09 |
| Single Female/Mother | 158 (9.8%) | 2.63 |
| Non-family | 470 (29.1%) | 1.12 |
| Total Households | 1,617 (100.0%) | 2.28 |
Household Size by Marriage Status in Bethlehem
Out of a total of 1,617 households in Bethlehem, 1,147 (70.9%) are family households, while 470 (29.1%) are nonfamily households. The most numerous type of family households are 2-person households, comprising 767, and the most common type of nonfamily households are 1-person households, comprising 435.
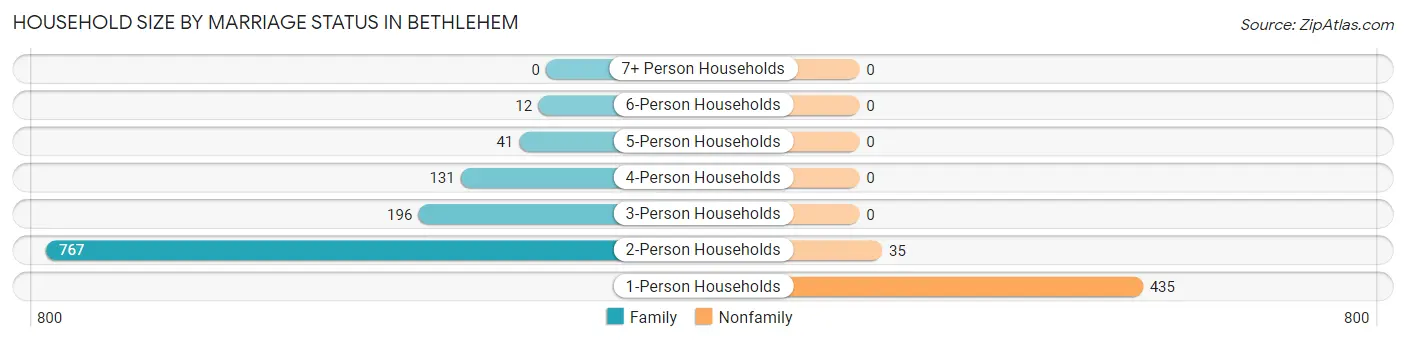
| Household Size | Family Households | Nonfamily Households |
| 1-Person Households | - | 435 (26.9%) |
| 2-Person Households | 767 (47.4%) | 35 (2.2%) |
| 3-Person Households | 196 (12.1%) | 0 (0.0%) |
| 4-Person Households | 131 (8.1%) | 0 (0.0%) |
| 5-Person Households | 41 (2.5%) | 0 (0.0%) |
| 6-Person Households | 12 (0.7%) | 0 (0.0%) |
| 7+ Person Households | 0 (0.0%) | 0 (0.0%) |
| Total | 1,147 (70.9%) | 470 (29.1%) |
Female Fertility in Bethlehem
Fertility by Age in Bethlehem
| Age Bracket | Women with Births | Births / 1,000 Women |
| 15 to 19 years | 0 (0.0%) | 0.0 |
| 20 to 34 years | 0 (0.0%) | 0.0 |
| 35 to 50 years | 0 (0.0%) | 0.0 |
| Total | 0 (0.0%) | 0.0 |
Fertility by Age by Marriage Status in Bethlehem
| Age Bracket | Married | Unmarried |
| 15 to 19 years | 0 (0.0%) | 0 (0.0%) |
| 20 to 34 years | 0 (0.0%) | 0 (0.0%) |
| 35 to 50 years | 0 (0.0%) | 0 (0.0%) |
| Total | 0 (0.0%) | 0 (0.0%) |
Fertility by Education in Bethlehem
| Educational Attainment | Women with Births | Births / 1,000 Women |
| Less than High School | 0 (0.0%) | 0.0 |
| High School Diploma | 0 (0.0%) | 0.0 |
| College or Associate's Degree | 0 (0.0%) | 0.0 |
| Bachelor's Degree | 0 (0.0%) | 0.0 |
| Graduate Degree | 0 (0.0%) | 0.0 |
| Total | 0 (0.0%) | 0.0 |
Fertility by Education by Marriage Status in Bethlehem
| Educational Attainment | Married | Unmarried |
| Less than High School | 0 (0.0%) | 0 (0.0%) |
| High School Diploma | 0 (0.0%) | 0 (0.0%) |
| College or Associate's Degree | 0 (0.0%) | 0 (0.0%) |
| Bachelor's Degree | 0 (0.0%) | 0 (0.0%) |
| Graduate Degree | 0 (0.0%) | 0 (0.0%) |
| Total | 0 (0.0%) | 0 (0.0%) |
Employment Characteristics in Bethlehem
Employment by Class of Employer in Bethlehem
Among the 1,762 employed individuals in Bethlehem, private company employees (1,237 | 70.2%), self-employed (not incorporated) (151 | 8.6%), and self-employed (incorporated) (109 | 6.2%) make up the most common classes of employment.
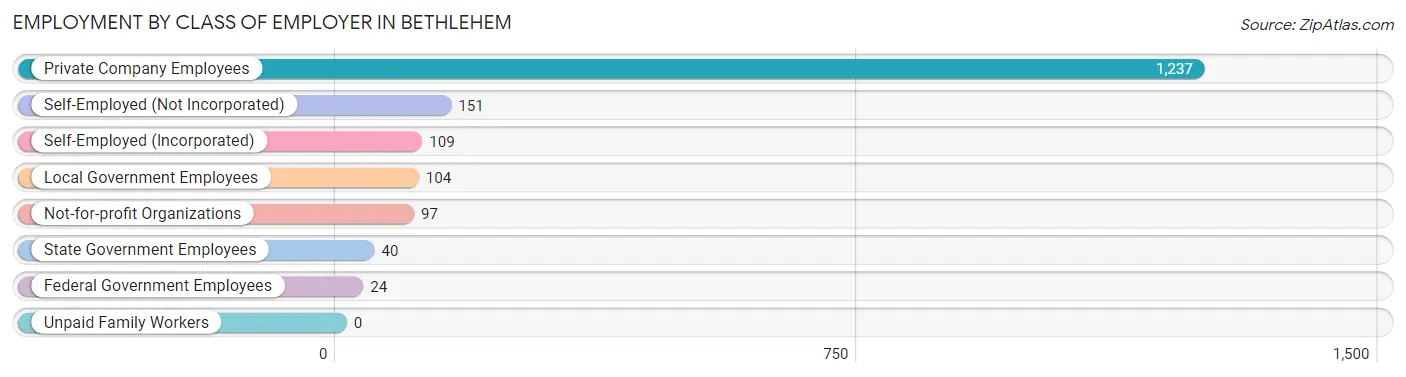
| Employer Class | # Employees | % Employees |
| Private Company Employees | 1,237 | 70.2% |
| Self-Employed (Incorporated) | 109 | 6.2% |
| Self-Employed (Not Incorporated) | 151 | 8.6% |
| Not-for-profit Organizations | 97 | 5.5% |
| Local Government Employees | 104 | 5.9% |
| State Government Employees | 40 | 2.3% |
| Federal Government Employees | 24 | 1.4% |
| Unpaid Family Workers | 0 | 0.0% |
| Total | 1,762 | 100.0% |
Employment Status by Age in Bethlehem
According to the labor force statistics for Bethlehem, out of the total population over 16 years of age (3,258), 56.6% or 1,844 individuals are in the labor force, with 2.9% or 53 of them unemployed. The age group with the highest labor force participation rate is 25 to 29 years, with 100.0% or 280 individuals in the labor force. Within the labor force, the 30 to 34 years age range has the highest percentage of unemployed individuals, with 76.1% or 54 of them being unemployed.
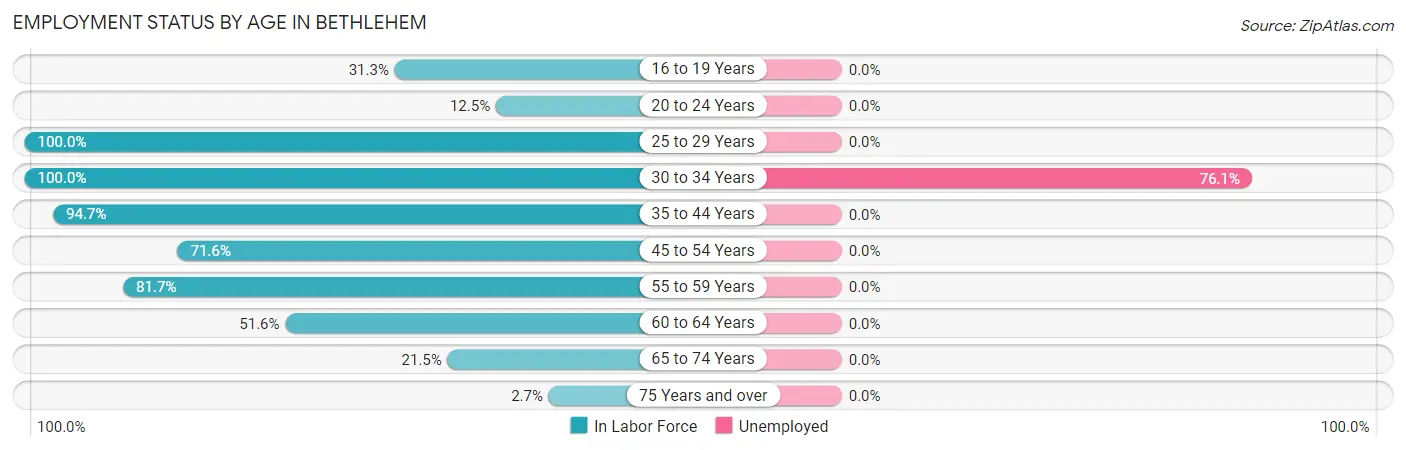
| Age Bracket | In Labor Force | Unemployed |
| 16 to 19 Years | 68 (31.3%) | 0 (0.0%) |
| 20 to 24 Years | 10 (12.5%) | 0 (0.0%) |
| 25 to 29 Years | 280 (100.0%) | 0 (0.0%) |
| 30 to 34 Years | 71 (100.0%) | 54 (76.1%) |
| 35 to 44 Years | 461 (94.7%) | 0 (0.0%) |
| 45 to 54 Years | 317 (71.6%) | 0 (0.0%) |
| 55 to 59 Years | 277 (81.7%) | 0 (0.0%) |
| 60 to 64 Years | 231 (51.6%) | 0 (0.0%) |
| 65 to 74 Years | 121 (21.5%) | 0 (0.0%) |
| 75 Years and over | 9 (2.7%) | 0 (0.0%) |
| Total | 1,844 (56.6%) | 53 (2.9%) |
Employment Status by Educational Attainment in Bethlehem
According to labor force statistics for Bethlehem, 79.2% of individuals (1,638) out of the total population between 25 and 64 years of age (2,068) are in the labor force, with 3.3% or 54 of them being unemployed. The group with the highest labor force participation rate are those with the educational attainment of college / associate degree, with 91.1% or 604 individuals in the labor force. Within the labor force, individuals with high school diploma education have the highest percentage of unemployment, with 17.3% or 54 of them being unemployed.
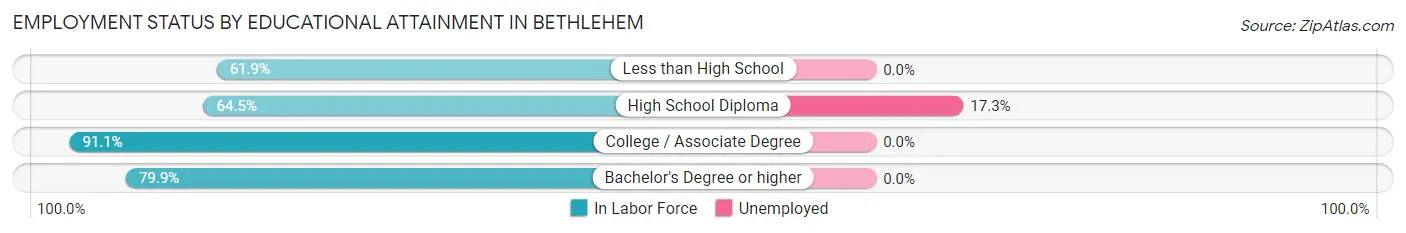
| Educational Attainment | In Labor Force | Unemployed |
| Less than High School | 52 (61.9%) | 0 (0.0%) |
| High School Diploma | 312 (64.5%) | 84 (17.3%) |
| College / Associate Degree | 604 (91.1%) | 0 (0.0%) |
| Bachelor's Degree or higher | 669 (79.9%) | 0 (0.0%) |
| Total | 1,638 (79.2%) | 68 (3.3%) |
Employment Occupations by Sex in Bethlehem
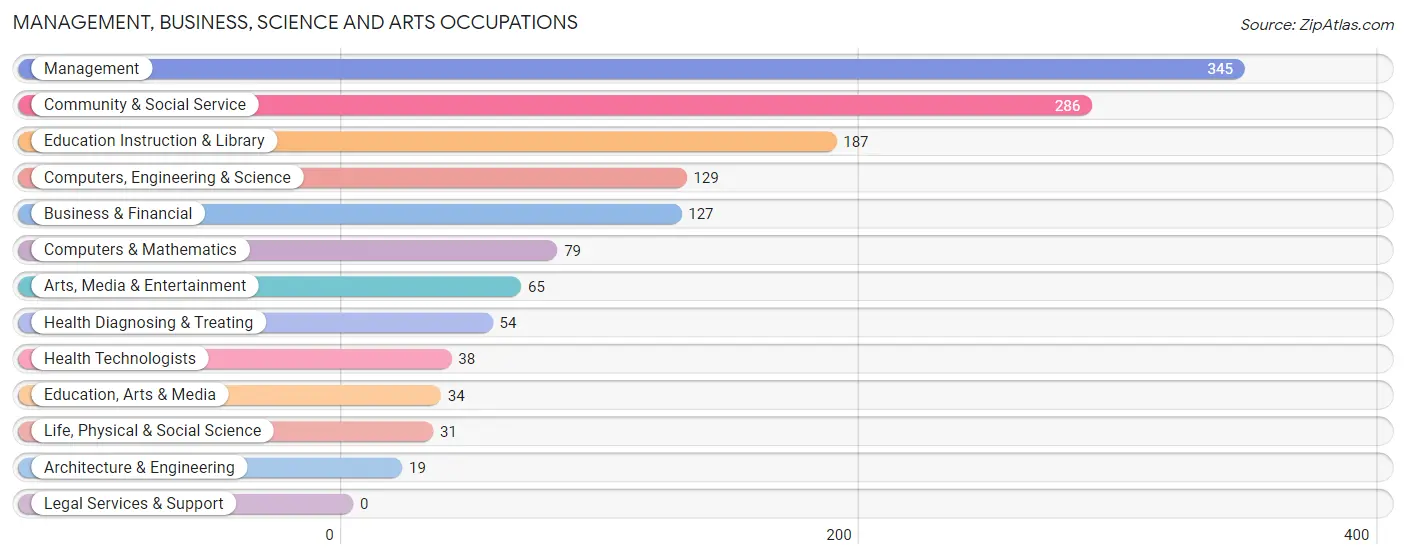
Management, Business, Science and Arts Occupations
The most common Management, Business, Science and Arts occupations in Bethlehem are Management (345 | 19.3%), Community & Social Service (286 | 16.0%), Education Instruction & Library (187 | 10.4%), Computers, Engineering & Science (129 | 7.2%), and Business & Financial (127 | 7.1%).
Management, Business, Science and Arts Occupations by Sex
Within the Management, Business, Science and Arts occupations in Bethlehem, the most male-oriented occupations are Architecture & Engineering (100.0%), Life, Physical & Social Science (100.0%), and Business & Financial (87.4%), while the most female-oriented occupations are Education, Arts & Media (100.0%), Health Diagnosing & Treating (75.9%), and Arts, Media & Entertainment (70.8%).
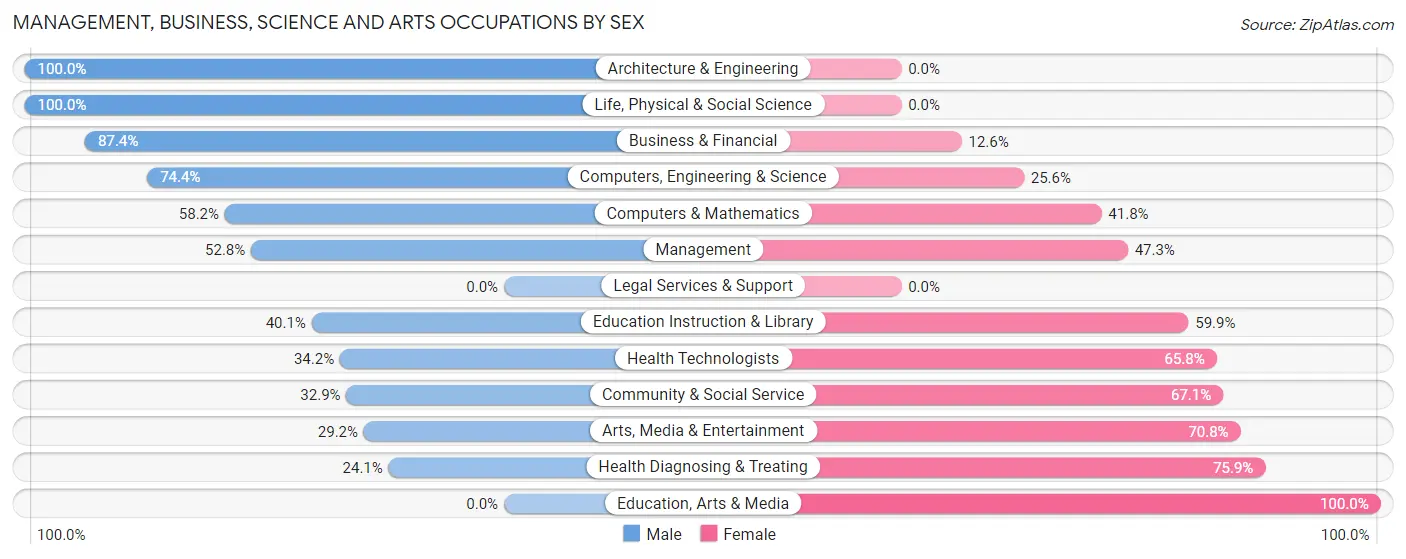
| Occupation | Male | Female |
| Management | 182 (52.7%) | 163 (47.2%) |
| Business & Financial | 111 (87.4%) | 16 (12.6%) |
| Computers, Engineering & Science | 96 (74.4%) | 33 (25.6%) |
| Computers & Mathematics | 46 (58.2%) | 33 (41.8%) |
| Architecture & Engineering | 19 (100.0%) | 0 (0.0%) |
| Life, Physical & Social Science | 31 (100.0%) | 0 (0.0%) |
| Community & Social Service | 94 (32.9%) | 192 (67.1%) |
| Education, Arts & Media | 0 (0.0%) | 34 (100.0%) |
| Legal Services & Support | 0 (0.0%) | 0 (0.0%) |
| Education Instruction & Library | 75 (40.1%) | 112 (59.9%) |
| Arts, Media & Entertainment | 19 (29.2%) | 46 (70.8%) |
| Health Diagnosing & Treating | 13 (24.1%) | 41 (75.9%) |
| Health Technologists | 13 (34.2%) | 25 (65.8%) |
| Total (Category) | 496 (52.7%) | 445 (47.3%) |
| Total (Overall) | 953 (53.2%) | 838 (46.8%) |
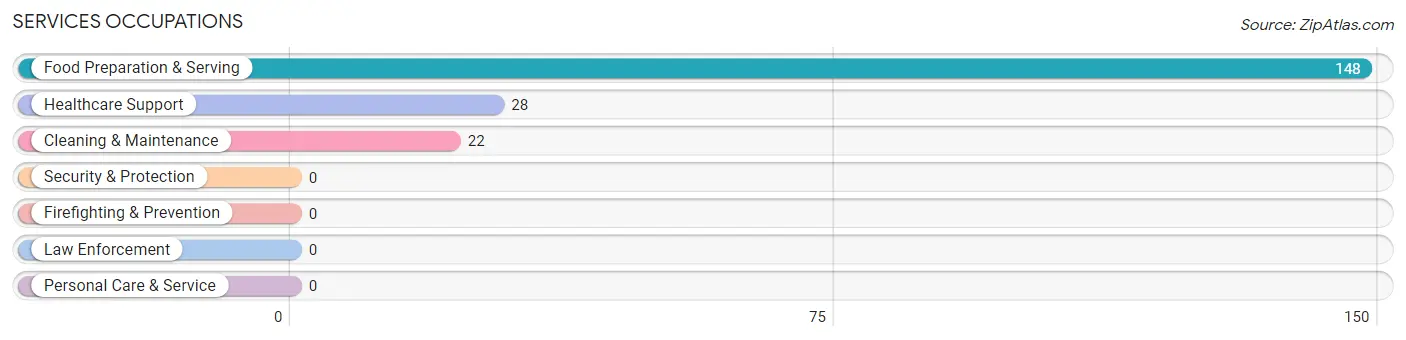
Services Occupations
The most common Services occupations in Bethlehem are Food Preparation & Serving (148 | 8.3%), Healthcare Support (28 | 1.6%), and Cleaning & Maintenance (22 | 1.2%).
Services Occupations by Sex
Within the Services occupations in Bethlehem, the most male-oriented occupations are Cleaning & Maintenance (50.0%), and Food Preparation & Serving (23.0%), while the most female-oriented occupations are Healthcare Support (100.0%), Food Preparation & Serving (77.0%), and Cleaning & Maintenance (50.0%).
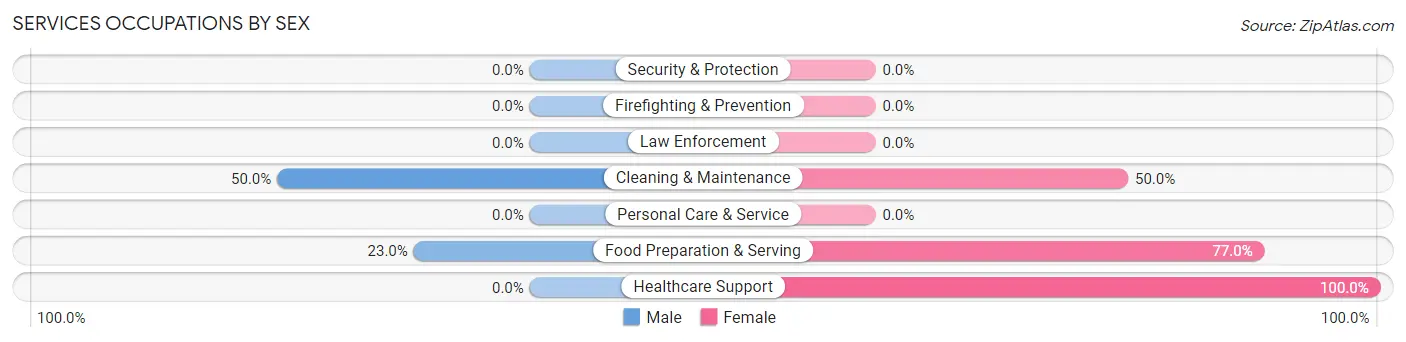
| Occupation | Male | Female |
| Healthcare Support | 0 (0.0%) | 28 (100.0%) |
| Security & Protection | 0 (0.0%) | 0 (0.0%) |
| Firefighting & Prevention | 0 (0.0%) | 0 (0.0%) |
| Law Enforcement | 0 (0.0%) | 0 (0.0%) |
| Food Preparation & Serving | 34 (23.0%) | 114 (77.0%) |
| Cleaning & Maintenance | 11 (50.0%) | 11 (50.0%) |
| Personal Care & Service | 0 (0.0%) | 0 (0.0%) |
| Total (Category) | 45 (22.7%) | 153 (77.3%) |
| Total (Overall) | 953 (53.2%) | 838 (46.8%) |
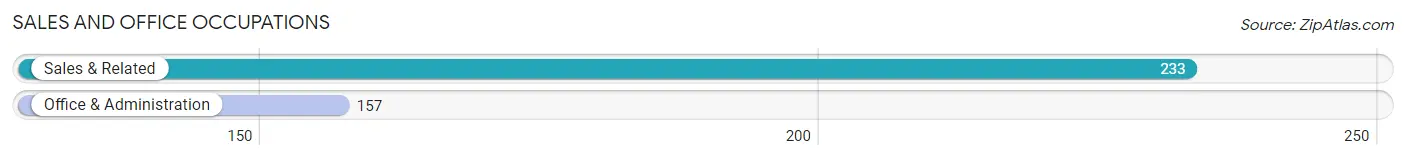
Sales and Office Occupations
The most common Sales and Office occupations in Bethlehem are Sales & Related (233 | 13.0%), and Office & Administration (157 | 8.8%).
Sales and Office Occupations by Sex
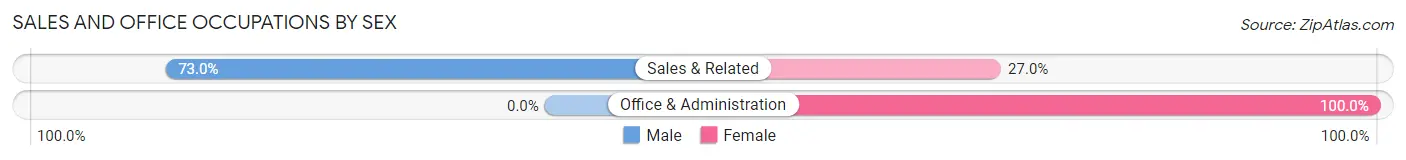
| Occupation | Male | Female |
| Sales & Related | 170 (73.0%) | 63 (27.0%) |
| Office & Administration | 0 (0.0%) | 157 (100.0%) |
| Total (Category) | 170 (43.6%) | 220 (56.4%) |
| Total (Overall) | 953 (53.2%) | 838 (46.8%) |
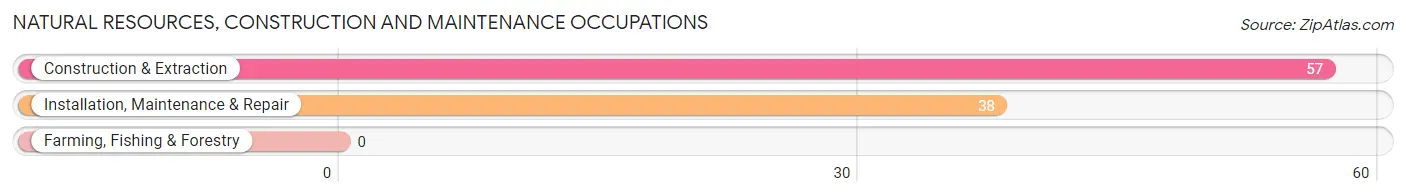
Natural Resources, Construction and Maintenance Occupations
The most common Natural Resources, Construction and Maintenance occupations in Bethlehem are Construction & Extraction (57 | 3.2%), and Installation, Maintenance & Repair (38 | 2.1%).
Natural Resources, Construction and Maintenance Occupations by Sex
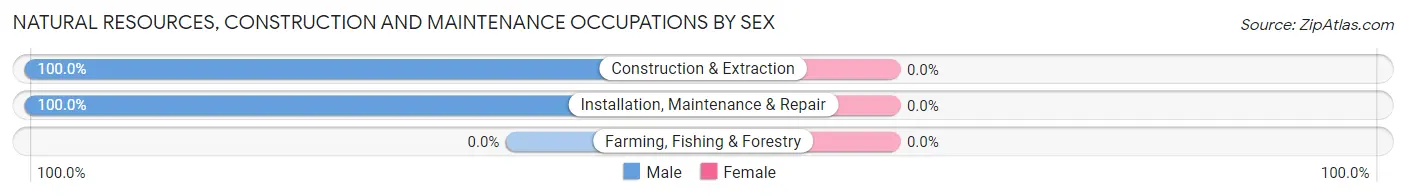
| Occupation | Male | Female |
| Farming, Fishing & Forestry | 0 (0.0%) | 0 (0.0%) |
| Construction & Extraction | 57 (100.0%) | 0 (0.0%) |
| Installation, Maintenance & Repair | 38 (100.0%) | 0 (0.0%) |
| Total (Category) | 95 (100.0%) | 0 (0.0%) |
| Total (Overall) | 953 (53.2%) | 838 (46.8%) |
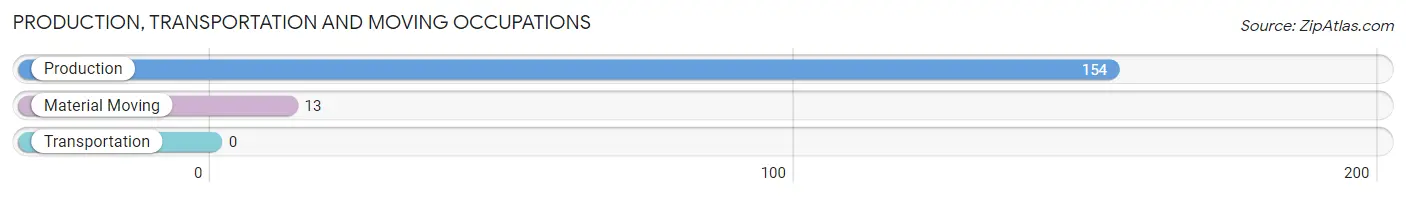
Production, Transportation and Moving Occupations
The most common Production, Transportation and Moving occupations in Bethlehem are Production (154 | 8.6%), and Material Moving (13 | 0.7%).
Production, Transportation and Moving Occupations by Sex
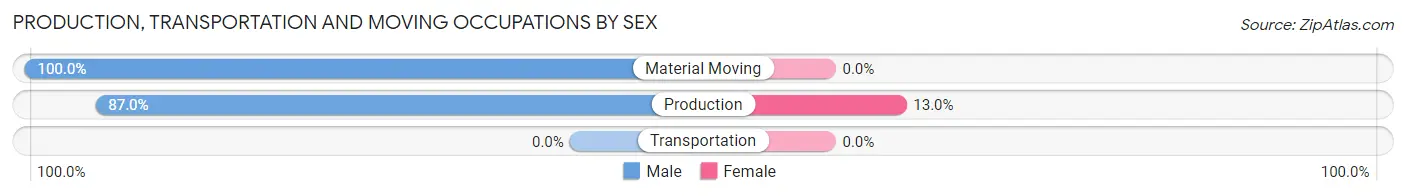
| Occupation | Male | Female |
| Production | 134 (87.0%) | 20 (13.0%) |
| Transportation | 0 (0.0%) | 0 (0.0%) |
| Material Moving | 13 (100.0%) | 0 (0.0%) |
| Total (Category) | 147 (88.0%) | 20 (12.0%) |
| Total (Overall) | 953 (53.2%) | 838 (46.8%) |
Employment Industries by Sex in Bethlehem
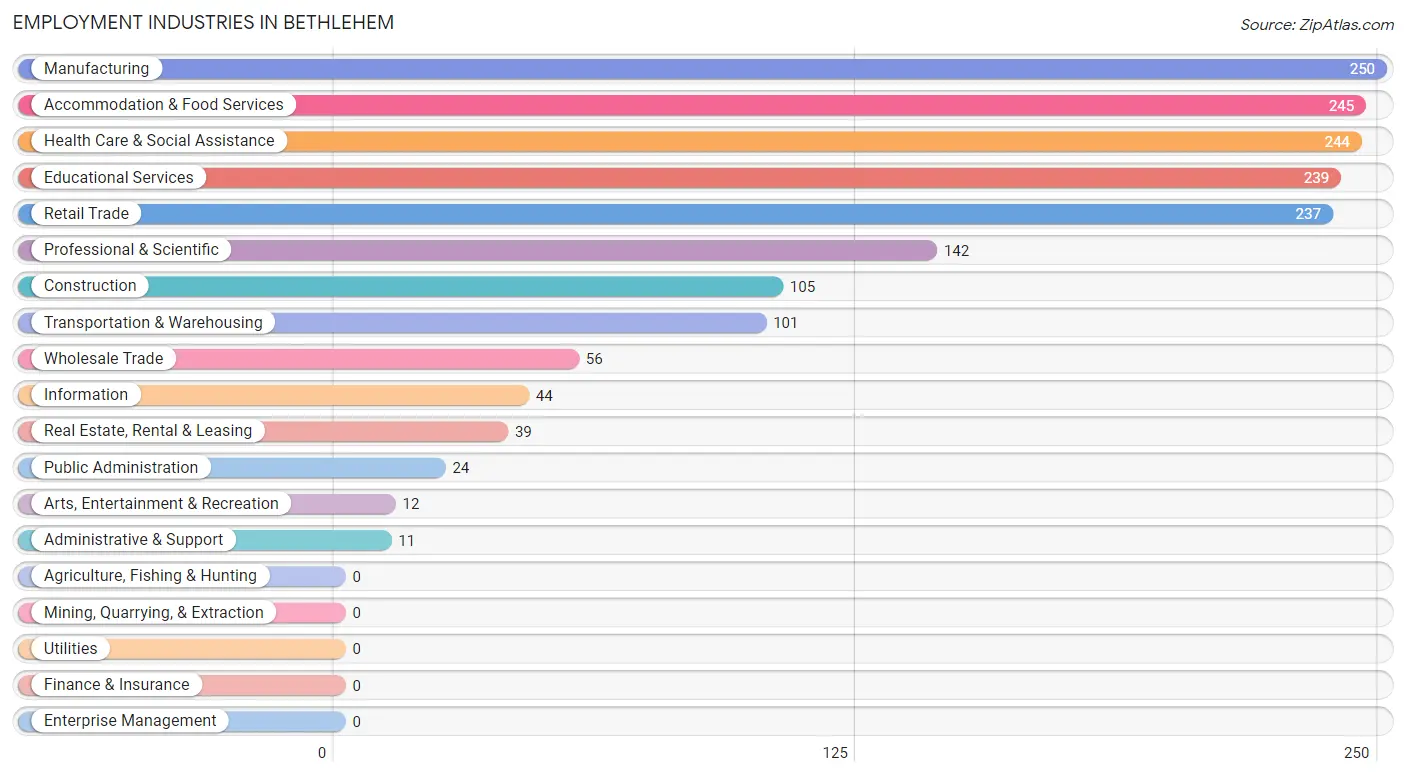
Employment Industries in Bethlehem
The major employment industries in Bethlehem include Manufacturing (250 | 14.0%), Accommodation & Food Services (245 | 13.7%), Health Care & Social Assistance (244 | 13.6%), Educational Services (239 | 13.3%), and Retail Trade (237 | 13.2%).
Employment Industries by Sex in Bethlehem
The Bethlehem industries that see more men than women are Transportation & Warehousing (100.0%), Information (100.0%), and Administrative & Support (100.0%), whereas the industries that tend to have a higher number of women are Arts, Entertainment & Recreation (100.0%), Public Administration (100.0%), and Accommodation & Food Services (81.2%).
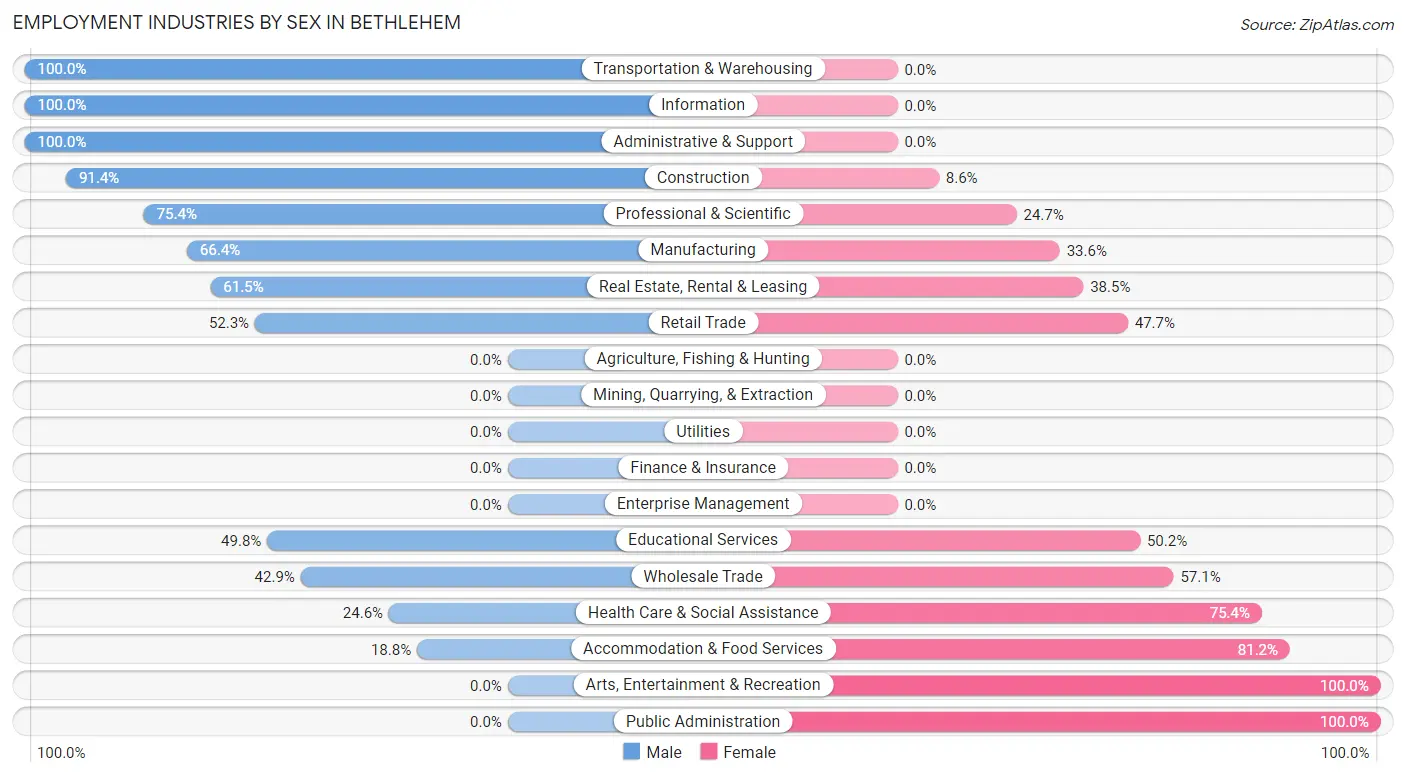
| Industry | Male | Female |
| Agriculture, Fishing & Hunting | 0 (0.0%) | 0 (0.0%) |
| Mining, Quarrying, & Extraction | 0 (0.0%) | 0 (0.0%) |
| Construction | 96 (91.4%) | 9 (8.6%) |
| Manufacturing | 166 (66.4%) | 84 (33.6%) |
| Wholesale Trade | 24 (42.9%) | 32 (57.1%) |
| Retail Trade | 124 (52.3%) | 113 (47.7%) |
| Transportation & Warehousing | 101 (100.0%) | 0 (0.0%) |
| Utilities | 0 (0.0%) | 0 (0.0%) |
| Information | 44 (100.0%) | 0 (0.0%) |
| Finance & Insurance | 0 (0.0%) | 0 (0.0%) |
| Real Estate, Rental & Leasing | 24 (61.5%) | 15 (38.5%) |
| Professional & Scientific | 107 (75.3%) | 35 (24.6%) |
| Enterprise Management | 0 (0.0%) | 0 (0.0%) |
| Administrative & Support | 11 (100.0%) | 0 (0.0%) |
| Educational Services | 119 (49.8%) | 120 (50.2%) |
| Health Care & Social Assistance | 60 (24.6%) | 184 (75.4%) |
| Arts, Entertainment & Recreation | 0 (0.0%) | 12 (100.0%) |
| Accommodation & Food Services | 46 (18.8%) | 199 (81.2%) |
| Public Administration | 0 (0.0%) | 24 (100.0%) |
| Total | 953 (53.2%) | 838 (46.8%) |
Education in Bethlehem
School Enrollment in Bethlehem
The most common levels of schooling among the 713 students in Bethlehem are high school (219 | 30.7%), elementary school (180 | 25.3%), and middle school (165 | 23.1%).
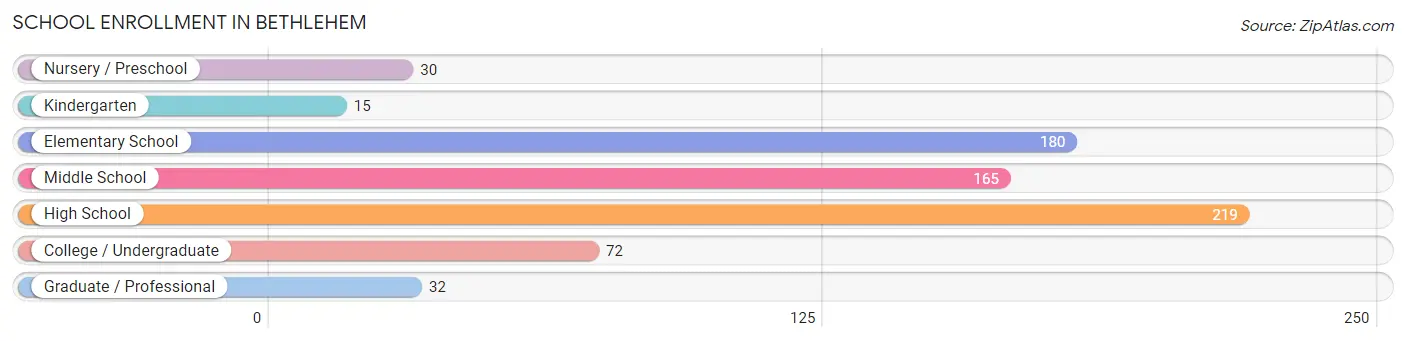
| School Level | # Students | % Students |
| Nursery / Preschool | 30 | 4.2% |
| Kindergarten | 15 | 2.1% |
| Elementary School | 180 | 25.3% |
| Middle School | 165 | 23.1% |
| High School | 219 | 30.7% |
| College / Undergraduate | 72 | 10.1% |
| Graduate / Professional | 32 | 4.5% |
| Total | 713 | 100.0% |
School Enrollment by Age by Funding Source in Bethlehem
Out of a total of 713 students who are enrolled in schools in Bethlehem, 187 (26.2%) attend a private institution, while the remaining 526 (73.8%) are enrolled in public schools. The age group of 3 to 4 year olds has the highest likelihood of being enrolled in private schools, with 30 (100.0% in the age bracket) enrolled. Conversely, the age group of 25 to 34 year olds has the lowest likelihood of being enrolled in a private school, with 13 (100.0% in the age bracket) attending a public institution.
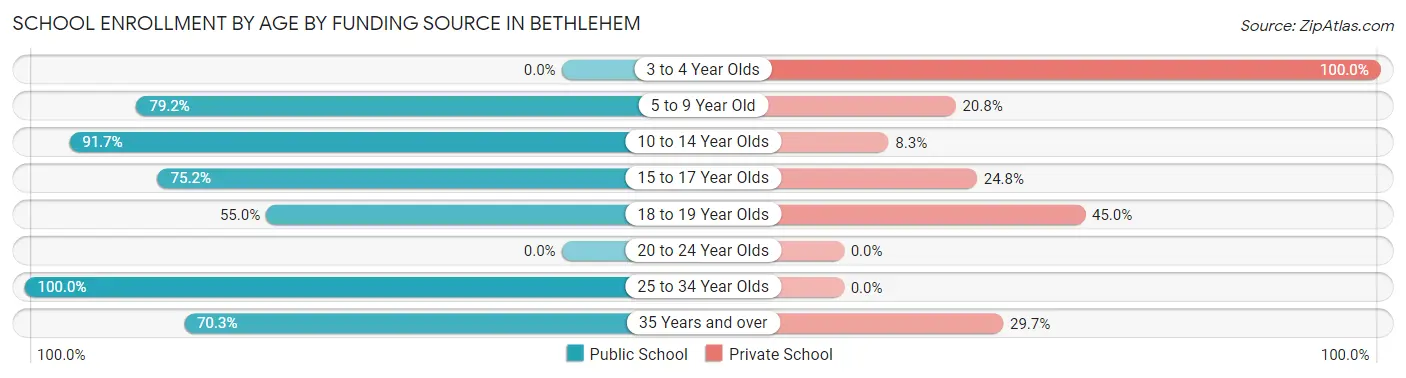
| Age Bracket | Public School | Private School |
| 3 to 4 Year Olds | 0 (0.0%) | 30 (100.0%) |
| 5 to 9 Year Old | 133 (79.2%) | 35 (20.8%) |
| 10 to 14 Year Olds | 176 (91.7%) | 16 (8.3%) |
| 15 to 17 Year Olds | 88 (75.2%) | 29 (24.8%) |
| 18 to 19 Year Olds | 71 (55.0%) | 58 (45.0%) |
| 20 to 24 Year Olds | 0 (0.0%) | 0 (0.0%) |
| 25 to 34 Year Olds | 13 (100.0%) | 0 (0.0%) |
| 35 Years and over | 45 (70.3%) | 19 (29.7%) |
| Total | 526 (73.8%) | 187 (26.2%) |
Educational Attainment by Field of Study in Bethlehem
Education (400 | 33.2%), business (217 | 18.0%), engineering (132 | 11.0%), arts & humanities (116 | 9.6%), and computers & mathematics (103 | 8.6%) are the most common fields of study among 1,204 individuals in Bethlehem who have obtained a bachelor's degree or higher.
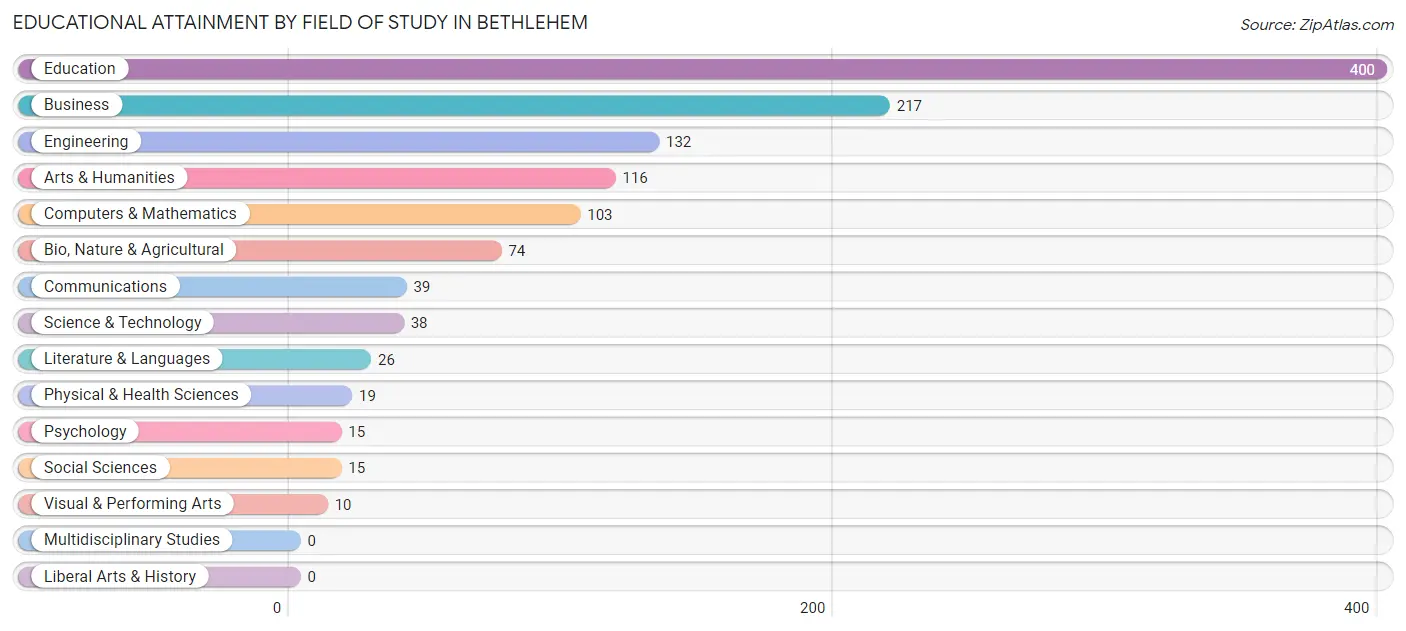
| Field of Study | # Graduates | % Graduates |
| Computers & Mathematics | 103 | 8.6% |
| Bio, Nature & Agricultural | 74 | 6.1% |
| Physical & Health Sciences | 19 | 1.6% |
| Psychology | 15 | 1.3% |
| Social Sciences | 15 | 1.3% |
| Engineering | 132 | 11.0% |
| Multidisciplinary Studies | 0 | 0.0% |
| Science & Technology | 38 | 3.2% |
| Business | 217 | 18.0% |
| Education | 400 | 33.2% |
| Literature & Languages | 26 | 2.2% |
| Liberal Arts & History | 0 | 0.0% |
| Visual & Performing Arts | 10 | 0.8% |
| Communications | 39 | 3.2% |
| Arts & Humanities | 116 | 9.6% |
| Total | 1,204 | 100.0% |
Transportation & Commute in Bethlehem
Vehicle Availability by Sex in Bethlehem
The most prevalent vehicle ownership categories in Bethlehem are males with 2 vehicles (378, accounting for 40.9%) and females with 2 vehicles (368, making up 45.1%).
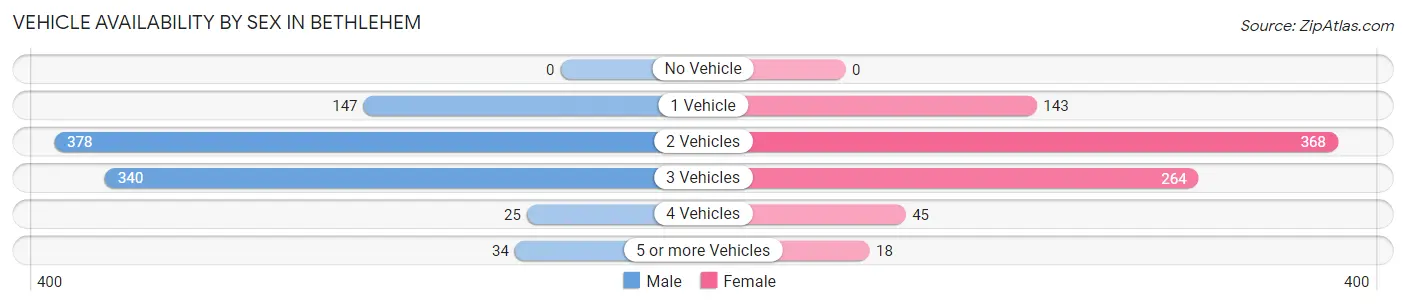
| Vehicles Available | Male | Female |
| No Vehicle | 0 (0.0%) | 0 (0.0%) |
| 1 Vehicle | 147 (15.9%) | 143 (17.1%) |
| 2 Vehicles | 378 (40.9%) | 368 (43.9%) |
| 3 Vehicles | 340 (36.8%) | 264 (31.5%) |
| 4 Vehicles | 25 (2.7%) | 45 (5.4%) |
| 5 or more Vehicles | 34 (3.7%) | 18 (2.1%) |
| Total | 924 (100.0%) | 838 (100.0%) |
Commute Time in Bethlehem
The most frequently occuring commute durations in Bethlehem are 20 to 24 minutes (530 commuters, 32.8%), 15 to 19 minutes (322 commuters, 19.9%), and 60 to 89 minutes (183 commuters, 11.3%).
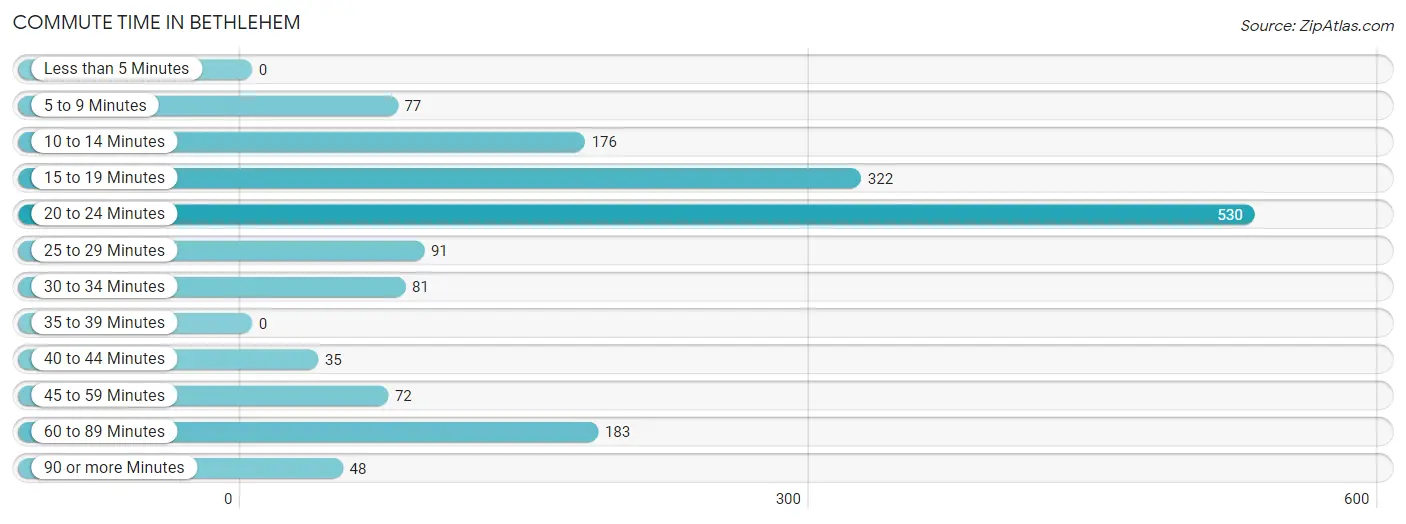
| Commute Time | # Commuters | % Commuters |
| Less than 5 Minutes | 0 | 0.0% |
| 5 to 9 Minutes | 77 | 4.8% |
| 10 to 14 Minutes | 176 | 10.9% |
| 15 to 19 Minutes | 322 | 19.9% |
| 20 to 24 Minutes | 530 | 32.8% |
| 25 to 29 Minutes | 91 | 5.6% |
| 30 to 34 Minutes | 81 | 5.0% |
| 35 to 39 Minutes | 0 | 0.0% |
| 40 to 44 Minutes | 35 | 2.2% |
| 45 to 59 Minutes | 72 | 4.5% |
| 60 to 89 Minutes | 183 | 11.3% |
| 90 or more Minutes | 48 | 3.0% |
Commute Time by Sex in Bethlehem
The most common commute times in Bethlehem are 15 to 19 minutes (202 commuters, 22.8%) for males and 20 to 24 minutes (373 commuters, 51.2%) for females.
| Commute Time | Male | Female |
| Less than 5 Minutes | 0 (0.0%) | 0 (0.0%) |
| 5 to 9 Minutes | 20 (2.2%) | 57 (7.8%) |
| 10 to 14 Minutes | 90 (10.2%) | 86 (11.8%) |
| 15 to 19 Minutes | 202 (22.8%) | 120 (16.5%) |
| 20 to 24 Minutes | 157 (17.7%) | 373 (51.2%) |
| 25 to 29 Minutes | 80 (9.0%) | 11 (1.5%) |
| 30 to 34 Minutes | 63 (7.1%) | 18 (2.5%) |
| 35 to 39 Minutes | 0 (0.0%) | 0 (0.0%) |
| 40 to 44 Minutes | 35 (4.0%) | 0 (0.0%) |
| 45 to 59 Minutes | 54 (6.1%) | 18 (2.5%) |
| 60 to 89 Minutes | 147 (16.6%) | 36 (5.0%) |
| 90 or more Minutes | 39 (4.4%) | 9 (1.2%) |
Time of Departure to Work by Sex in Bethlehem
The most frequent times of departure to work in Bethlehem are 7:00 AM to 7:29 AM (157, 17.7%) for males and 7:00 AM to 7:29 AM (166, 22.8%) for females.
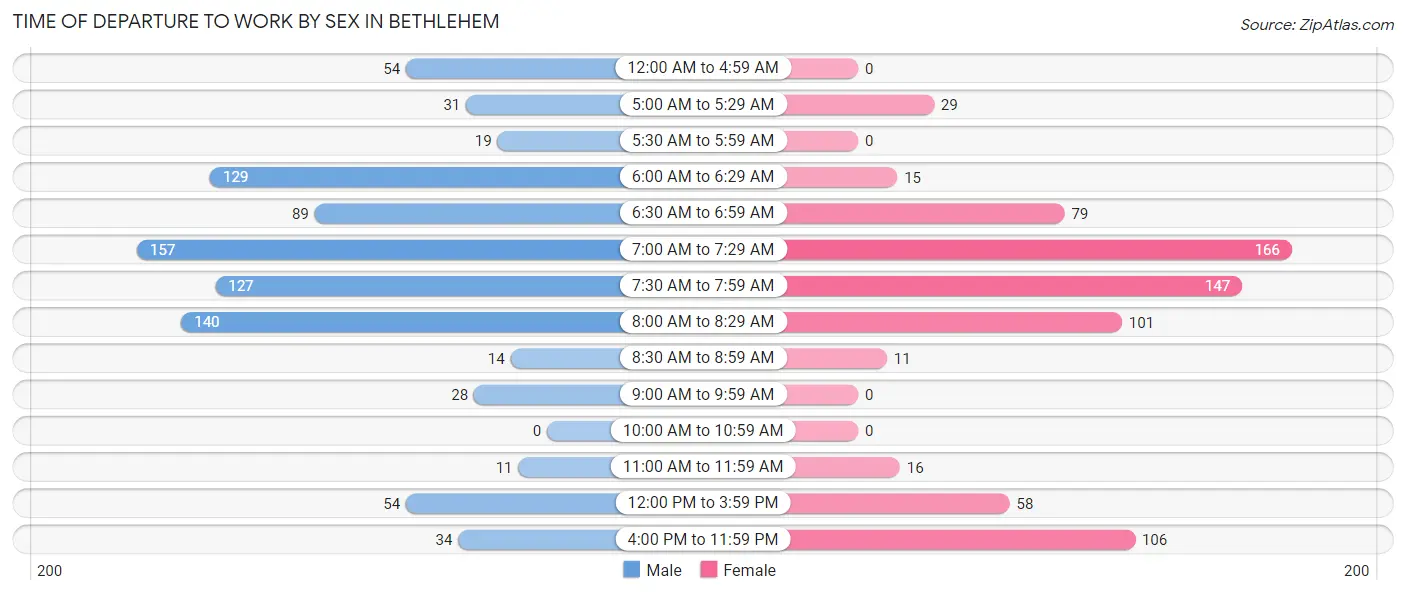
| Time of Departure | Male | Female |
| 12:00 AM to 4:59 AM | 54 (6.1%) | 0 (0.0%) |
| 5:00 AM to 5:29 AM | 31 (3.5%) | 29 (4.0%) |
| 5:30 AM to 5:59 AM | 19 (2.1%) | 0 (0.0%) |
| 6:00 AM to 6:29 AM | 129 (14.5%) | 15 (2.1%) |
| 6:30 AM to 6:59 AM | 89 (10.0%) | 79 (10.8%) |
| 7:00 AM to 7:29 AM | 157 (17.7%) | 166 (22.8%) |
| 7:30 AM to 7:59 AM | 127 (14.3%) | 147 (20.2%) |
| 8:00 AM to 8:29 AM | 140 (15.8%) | 101 (13.9%) |
| 8:30 AM to 8:59 AM | 14 (1.6%) | 11 (1.5%) |
| 9:00 AM to 9:59 AM | 28 (3.2%) | 0 (0.0%) |
| 10:00 AM to 10:59 AM | 0 (0.0%) | 0 (0.0%) |
| 11:00 AM to 11:59 AM | 11 (1.2%) | 16 (2.2%) |
| 12:00 PM to 3:59 PM | 54 (6.1%) | 58 (8.0%) |
| 4:00 PM to 11:59 PM | 34 (3.8%) | 106 (14.6%) |
| Total | 887 (100.0%) | 728 (100.0%) |
Housing Occupancy in Bethlehem
Occupancy by Ownership in Bethlehem
Of the total 1,617 dwellings in Bethlehem, owner-occupied units account for 1,371 (84.8%), while renter-occupied units make up 246 (15.2%).
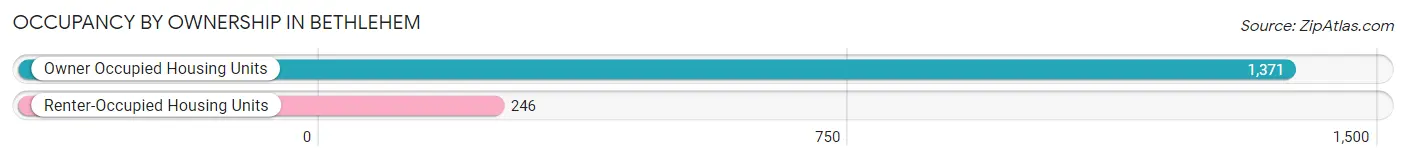
| Occupancy | # Housing Units | % Housing Units |
| Owner Occupied Housing Units | 1,371 | 84.8% |
| Renter-Occupied Housing Units | 246 | 15.2% |
| Total Occupied Housing Units | 1,617 | 100.0% |
Occupancy by Household Size in Bethlehem
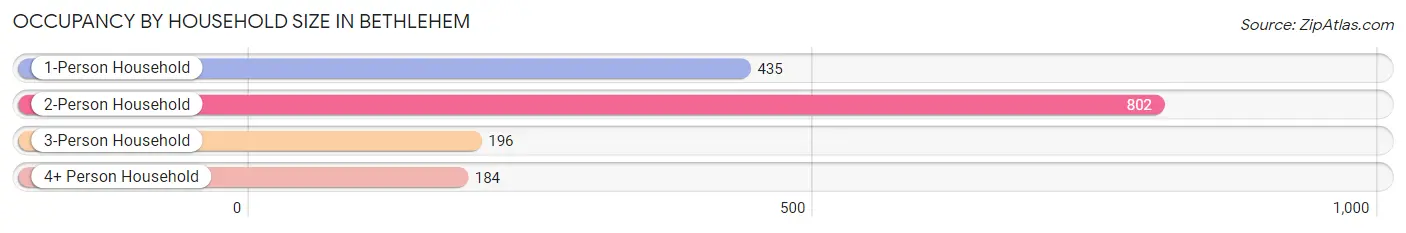
| Household Size | # Housing Units | % Housing Units |
| 1-Person Household | 435 | 26.9% |
| 2-Person Household | 802 | 49.6% |
| 3-Person Household | 196 | 12.1% |
| 4+ Person Household | 184 | 11.4% |
| Total Housing Units | 1,617 | 100.0% |
Occupancy by Ownership by Household Size in Bethlehem
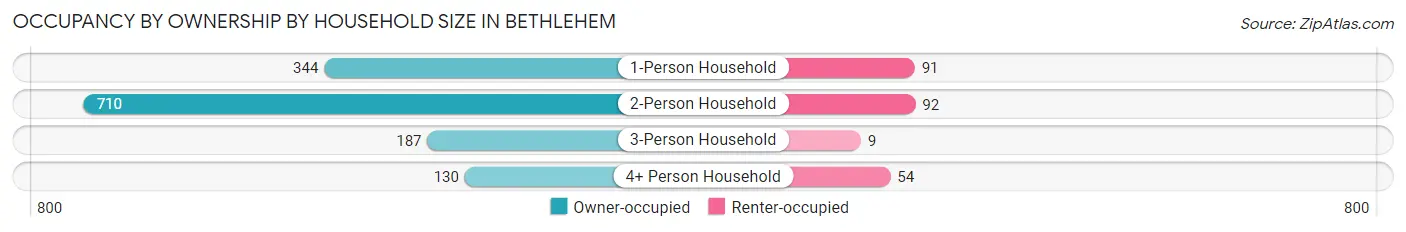
| Household Size | Owner-occupied | Renter-occupied |
| 1-Person Household | 344 (79.1%) | 91 (20.9%) |
| 2-Person Household | 710 (88.5%) | 92 (11.5%) |
| 3-Person Household | 187 (95.4%) | 9 (4.6%) |
| 4+ Person Household | 130 (70.7%) | 54 (29.3%) |
| Total Housing Units | 1,371 (84.8%) | 246 (15.2%) |
Occupancy by Educational Attainment in Bethlehem
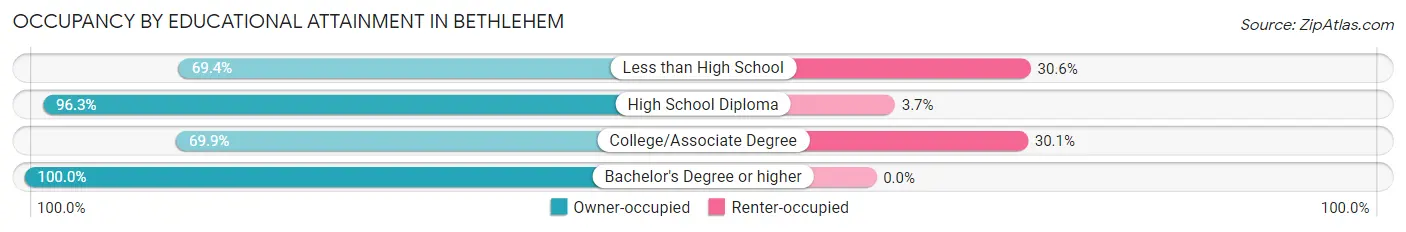
| Household Size | Owner-occupied | Renter-occupied |
| Less than High School | 93 (69.4%) | 41 (30.6%) |
| High School Diploma | 235 (96.3%) | 9 (3.7%) |
| College/Associate Degree | 456 (69.9%) | 196 (30.1%) |
| Bachelor's Degree or higher | 587 (100.0%) | 0 (0.0%) |
Occupancy by Age of Householder in Bethlehem
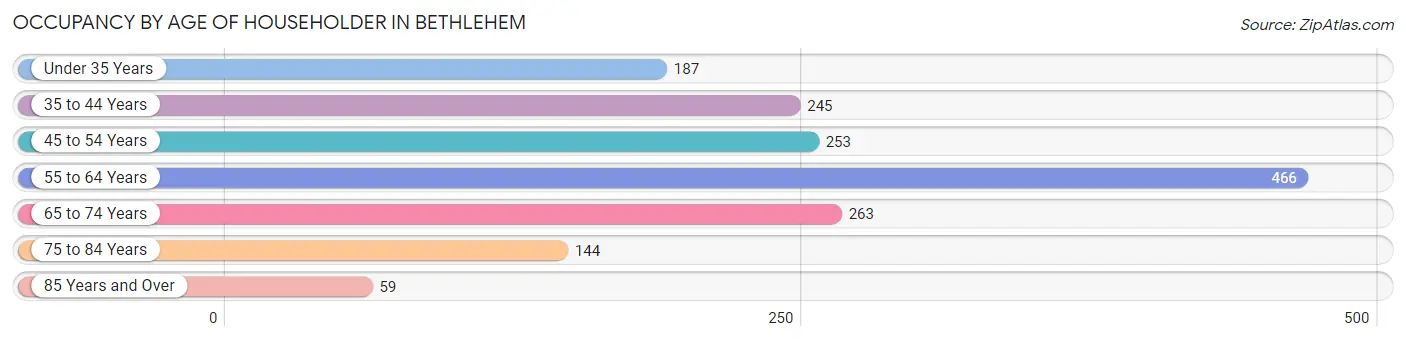
| Age Bracket | # Households | % Households |
| Under 35 Years | 187 | 11.6% |
| 35 to 44 Years | 245 | 15.1% |
| 45 to 54 Years | 253 | 15.7% |
| 55 to 64 Years | 466 | 28.8% |
| 65 to 74 Years | 263 | 16.3% |
| 75 to 84 Years | 144 | 8.9% |
| 85 Years and Over | 59 | 3.6% |
| Total | 1,617 | 100.0% |
Housing Finances in Bethlehem
Median Income by Occupancy in Bethlehem
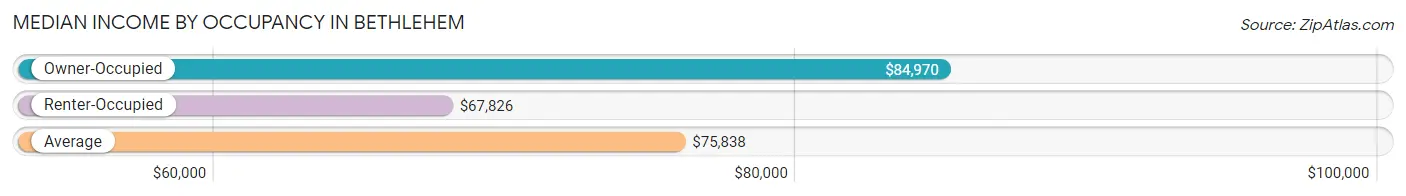
| Occupancy Type | # Households | Median Income |
| Owner-Occupied | 1,371 (84.8%) | $84,970 |
| Renter-Occupied | 246 (15.2%) | $67,826 |
| Average | 1,617 (100.0%) | $75,838 |
Occupancy by Householder Income Bracket in Bethlehem
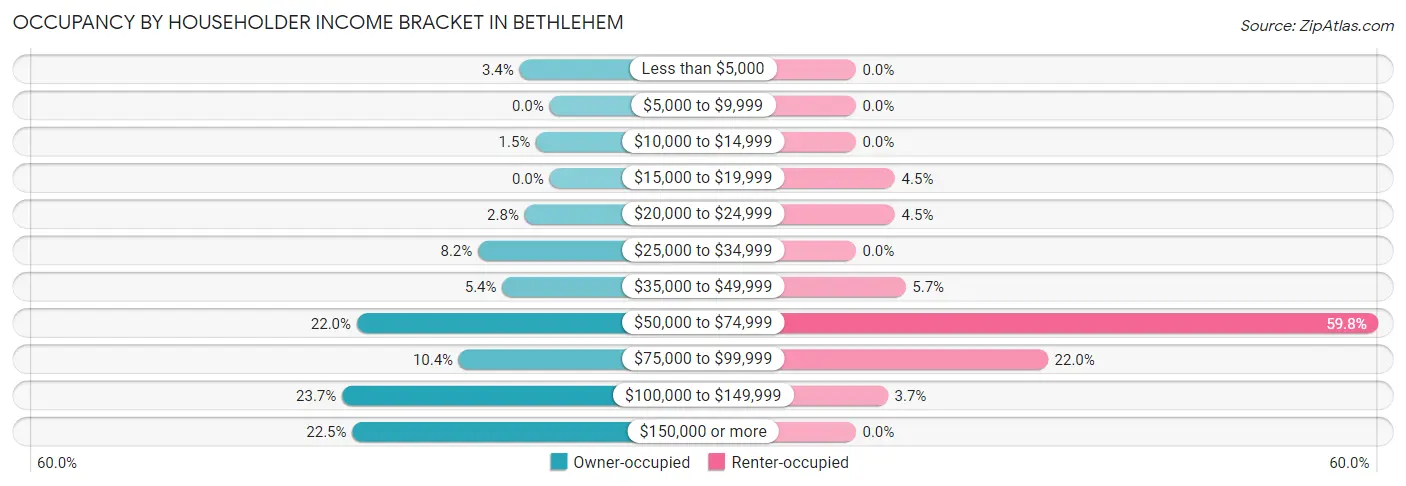
| Income Bracket | Owner-occupied | Renter-occupied |
| Less than $5,000 | 47 (3.4%) | 0 (0.0%) |
| $5,000 to $9,999 | 0 (0.0%) | 0 (0.0%) |
| $10,000 to $14,999 | 21 (1.5%) | 0 (0.0%) |
| $15,000 to $19,999 | 0 (0.0%) | 11 (4.5%) |
| $20,000 to $24,999 | 39 (2.8%) | 11 (4.5%) |
| $25,000 to $34,999 | 112 (8.2%) | 0 (0.0%) |
| $35,000 to $49,999 | 74 (5.4%) | 14 (5.7%) |
| $50,000 to $74,999 | 302 (22.0%) | 147 (59.8%) |
| $75,000 to $99,999 | 142 (10.4%) | 54 (22.0%) |
| $100,000 to $149,999 | 325 (23.7%) | 9 (3.7%) |
| $150,000 or more | 309 (22.5%) | 0 (0.0%) |
| Total | 1,371 (100.0%) | 246 (100.0%) |
Monthly Housing Cost Tiers in Bethlehem
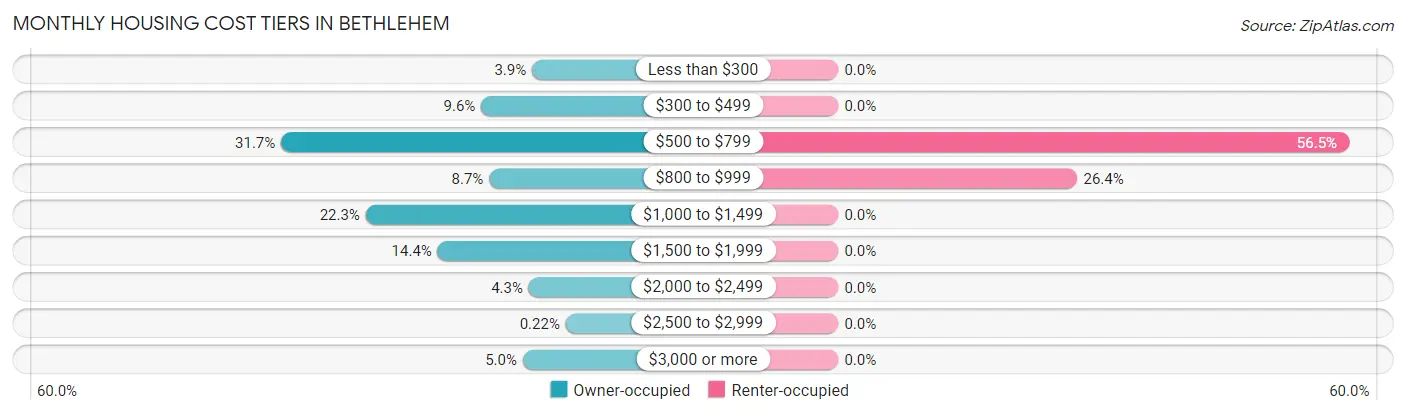
| Monthly Cost | Owner-occupied | Renter-occupied |
| Less than $300 | 54 (3.9%) | 0 (0.0%) |
| $300 to $499 | 131 (9.6%) | 0 (0.0%) |
| $500 to $799 | 434 (31.7%) | 139 (56.5%) |
| $800 to $999 | 119 (8.7%) | 65 (26.4%) |
| $1,000 to $1,499 | 306 (22.3%) | 0 (0.0%) |
| $1,500 to $1,999 | 197 (14.4%) | 0 (0.0%) |
| $2,000 to $2,499 | 59 (4.3%) | 0 (0.0%) |
| $2,500 to $2,999 | 3 (0.2%) | 0 (0.0%) |
| $3,000 or more | 68 (5.0%) | 0 (0.0%) |
| Total | 1,371 (100.0%) | 246 (100.0%) |
Physical Housing Characteristics in Bethlehem
Housing Structures in Bethlehem
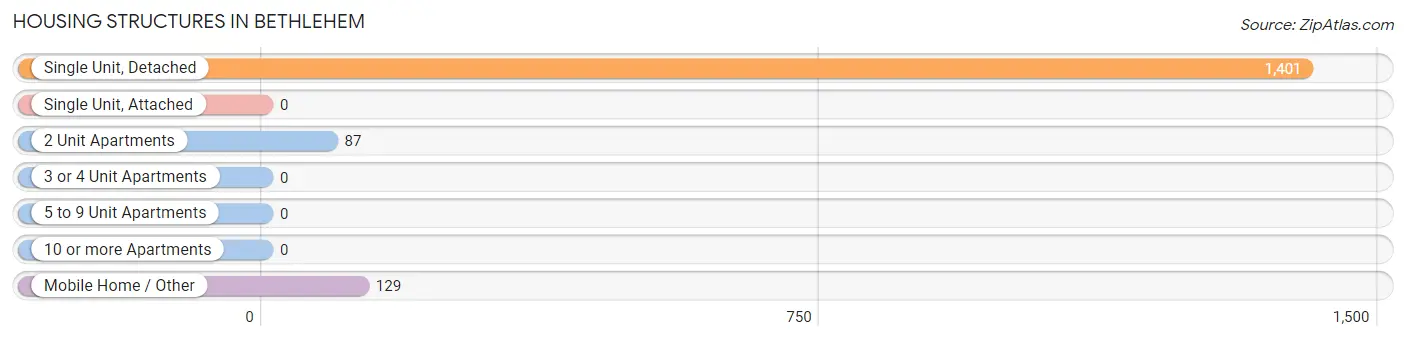
| Structure Type | # Housing Units | % Housing Units |
| Single Unit, Detached | 1,401 | 86.6% |
| Single Unit, Attached | 0 | 0.0% |
| 2 Unit Apartments | 87 | 5.4% |
| 3 or 4 Unit Apartments | 0 | 0.0% |
| 5 to 9 Unit Apartments | 0 | 0.0% |
| 10 or more Apartments | 0 | 0.0% |
| Mobile Home / Other | 129 | 8.0% |
| Total | 1,617 | 100.0% |
Housing Structures by Occupancy in Bethlehem
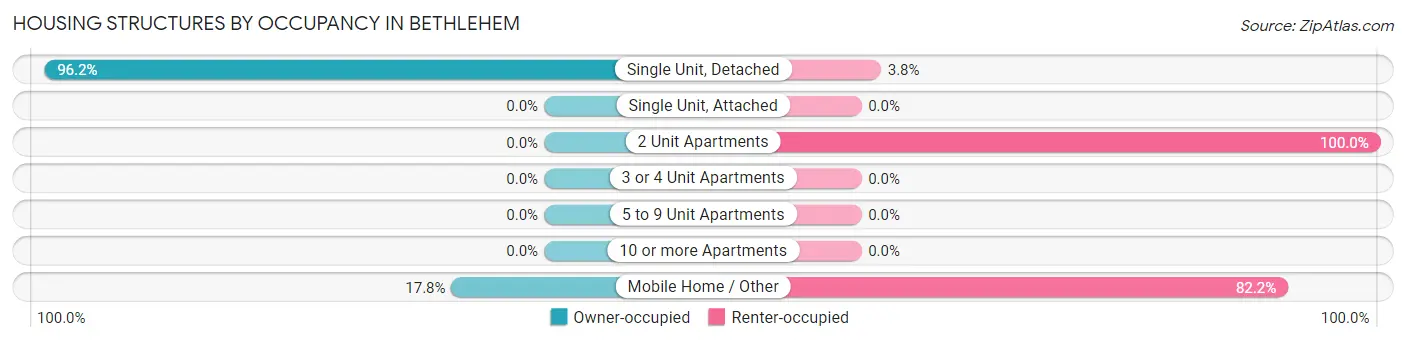
| Structure Type | Owner-occupied | Renter-occupied |
| Single Unit, Detached | 1,348 (96.2%) | 53 (3.8%) |
| Single Unit, Attached | 0 (0.0%) | 0 (0.0%) |
| 2 Unit Apartments | 0 (0.0%) | 87 (100.0%) |
| 3 or 4 Unit Apartments | 0 (0.0%) | 0 (0.0%) |
| 5 to 9 Unit Apartments | 0 (0.0%) | 0 (0.0%) |
| 10 or more Apartments | 0 (0.0%) | 0 (0.0%) |
| Mobile Home / Other | 23 (17.8%) | 106 (82.2%) |
| Total | 1,371 (84.8%) | 246 (15.2%) |
Housing Structures by Number of Rooms in Bethlehem
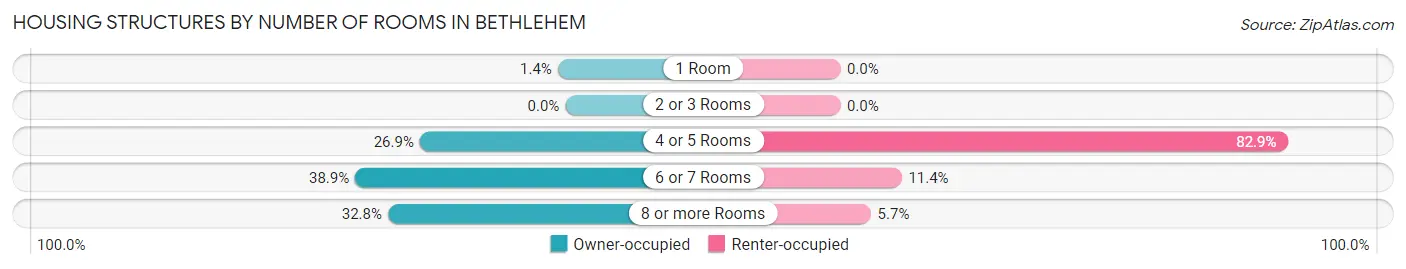
| Number of Rooms | Owner-occupied | Renter-occupied |
| 1 Room | 19 (1.4%) | 0 (0.0%) |
| 2 or 3 Rooms | 0 (0.0%) | 0 (0.0%) |
| 4 or 5 Rooms | 369 (26.9%) | 204 (82.9%) |
| 6 or 7 Rooms | 533 (38.9%) | 28 (11.4%) |
| 8 or more Rooms | 450 (32.8%) | 14 (5.7%) |
| Total | 1,371 (100.0%) | 246 (100.0%) |
Housing Structure by Heating Type in Bethlehem
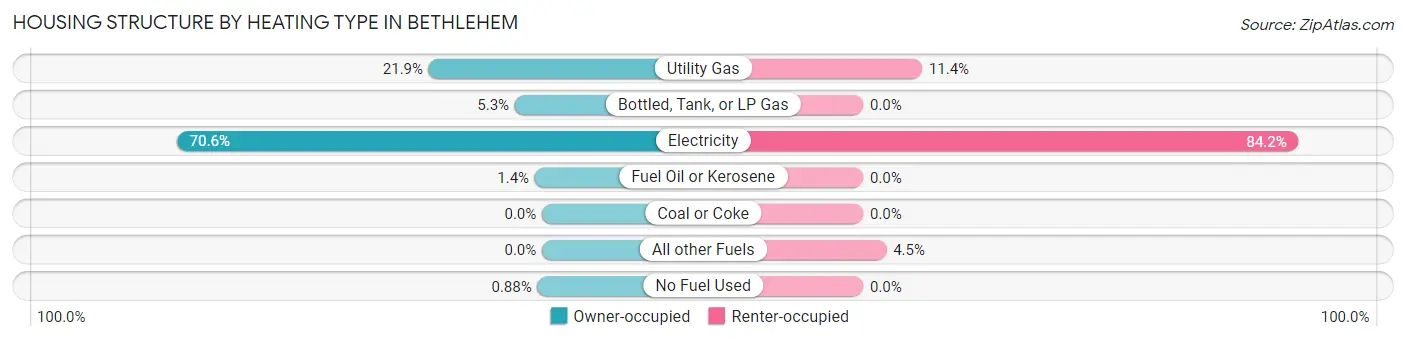
| Heating Type | Owner-occupied | Renter-occupied |
| Utility Gas | 300 (21.9%) | 28 (11.4%) |
| Bottled, Tank, or LP Gas | 72 (5.2%) | 0 (0.0%) |
| Electricity | 968 (70.6%) | 207 (84.2%) |
| Fuel Oil or Kerosene | 19 (1.4%) | 0 (0.0%) |
| Coal or Coke | 0 (0.0%) | 0 (0.0%) |
| All other Fuels | 0 (0.0%) | 11 (4.5%) |
| No Fuel Used | 12 (0.9%) | 0 (0.0%) |
| Total | 1,371 (100.0%) | 246 (100.0%) |
Household Vehicle Usage in Bethlehem
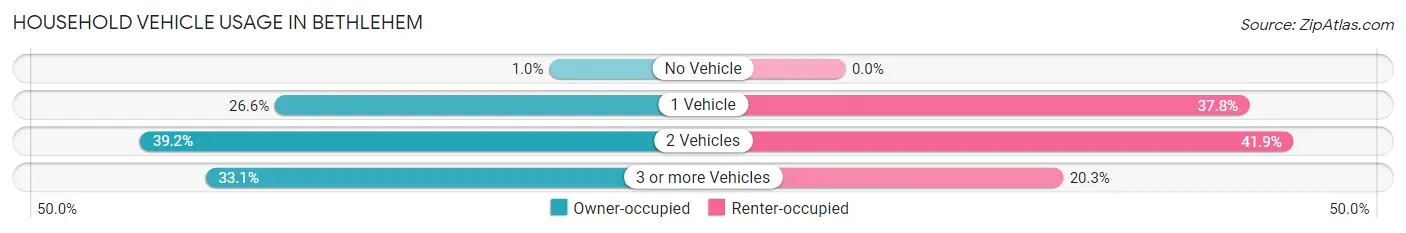
| Vehicles per Household | Owner-occupied | Renter-occupied |
| No Vehicle | 14 (1.0%) | 0 (0.0%) |
| 1 Vehicle | 365 (26.6%) | 93 (37.8%) |
| 2 Vehicles | 538 (39.2%) | 103 (41.9%) |
| 3 or more Vehicles | 454 (33.1%) | 50 (20.3%) |
| Total | 1,371 (100.0%) | 246 (100.0%) |
Real Estate & Mortgages in Bethlehem
Real Estate and Mortgage Overview in Bethlehem
| Characteristic | Without Mortgage | With Mortgage |
| Housing Units | 575 | 796 |
| Median Property Value | $295,100 | $252,700 |
| Median Household Income | $81,146 | $127 |
| Monthly Housing Costs | $552 | $68 |
| Real Estate Taxes | $2,503 | $0 |
Property Value by Mortgage Status in Bethlehem
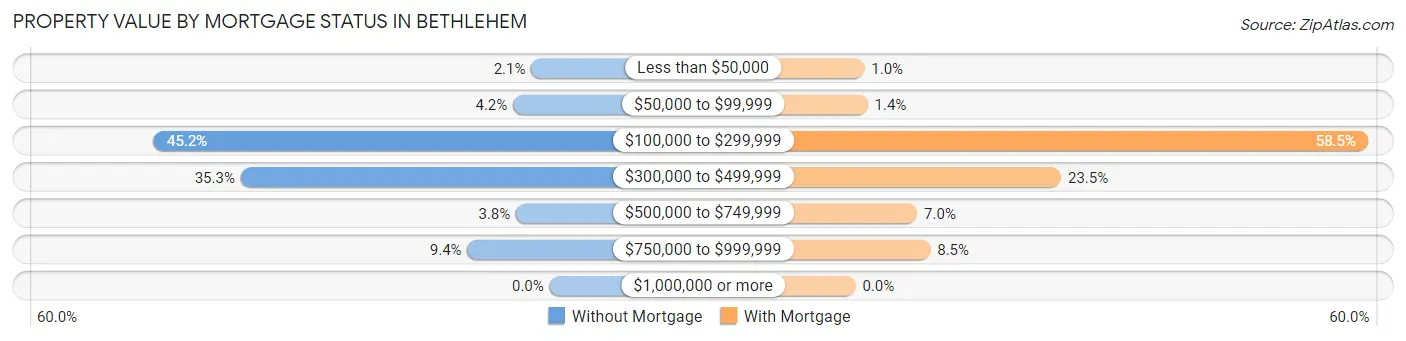
| Property Value | Without Mortgage | With Mortgage |
| Less than $50,000 | 12 (2.1%) | 8 (1.0%) |
| $50,000 to $99,999 | 24 (4.2%) | 11 (1.4%) |
| $100,000 to $299,999 | 260 (45.2%) | 466 (58.5%) |
| $300,000 to $499,999 | 203 (35.3%) | 187 (23.5%) |
| $500,000 to $749,999 | 22 (3.8%) | 56 (7.0%) |
| $750,000 to $999,999 | 54 (9.4%) | 68 (8.5%) |
| $1,000,000 or more | 0 (0.0%) | 0 (0.0%) |
| Total | 575 (100.0%) | 796 (100.0%) |
Household Income by Mortgage Status in Bethlehem
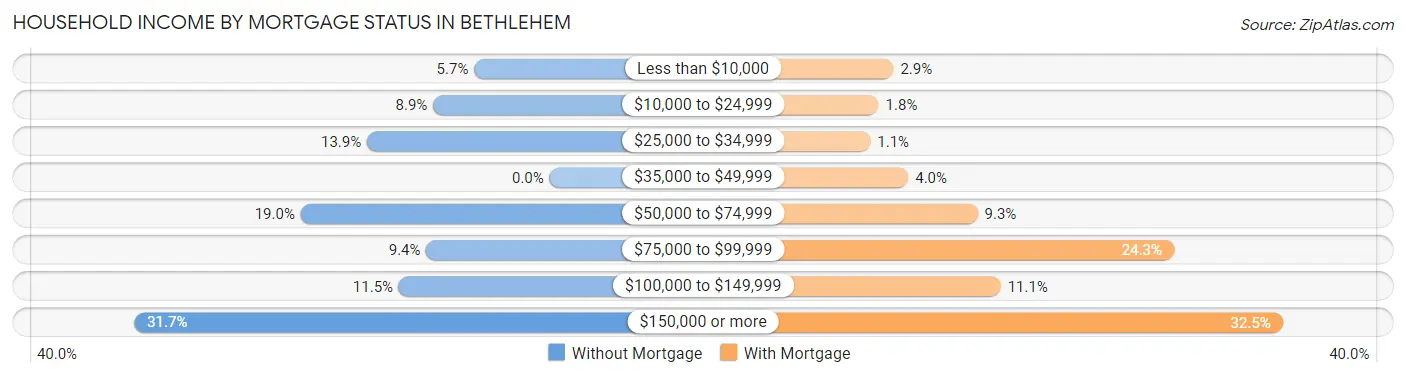
| Household Income | Without Mortgage | With Mortgage |
| Less than $10,000 | 33 (5.7%) | 23 (2.9%) |
| $10,000 to $24,999 | 51 (8.9%) | 14 (1.8%) |
| $25,000 to $34,999 | 80 (13.9%) | 9 (1.1%) |
| $35,000 to $49,999 | 0 (0.0%) | 32 (4.0%) |
| $50,000 to $74,999 | 109 (19.0%) | 74 (9.3%) |
| $75,000 to $99,999 | 54 (9.4%) | 193 (24.2%) |
| $100,000 to $149,999 | 66 (11.5%) | 88 (11.1%) |
| $150,000 or more | 182 (31.7%) | 259 (32.5%) |
| Total | 575 (100.0%) | 796 (100.0%) |
Property Value to Household Income Ratio in Bethlehem
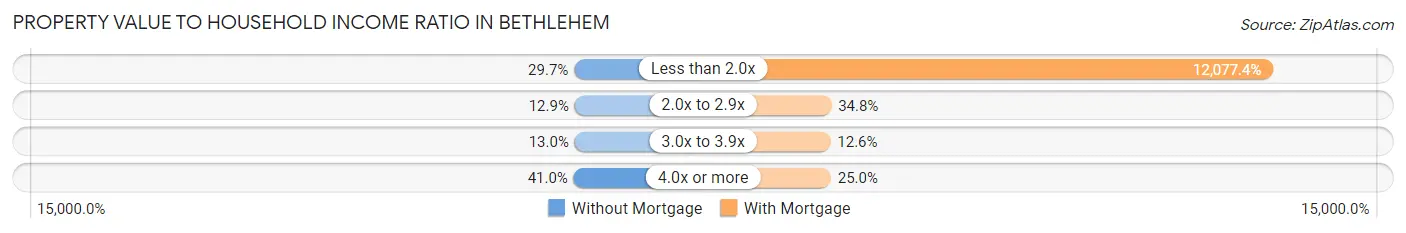
| Value-to-Income Ratio | Without Mortgage | With Mortgage |
| Less than 2.0x | 171 (29.7%) | 96,136 (12,077.4%) |
| 2.0x to 2.9x | 74 (12.9%) | 277 (34.8%) |
| 3.0x to 3.9x | 75 (13.0%) | 100 (12.6%) |
| 4.0x or more | 236 (41.0%) | 199 (25.0%) |
| Total | 575 (100.0%) | 796 (100.0%) |
Real Estate Taxes by Mortgage Status in Bethlehem
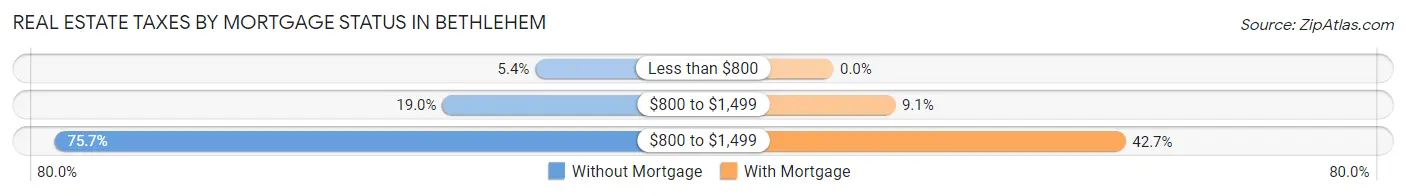
| Property Taxes | Without Mortgage | With Mortgage |
| Less than $800 | 31 (5.4%) | 0 (0.0%) |
| $800 to $1,499 | 109 (19.0%) | 72 (9.0%) |
| $800 to $1,499 | 435 (75.6%) | 340 (42.7%) |
| Total | 575 (100.0%) | 796 (100.0%) |
Health & Disability in Bethlehem
Health Insurance Coverage by Age in Bethlehem
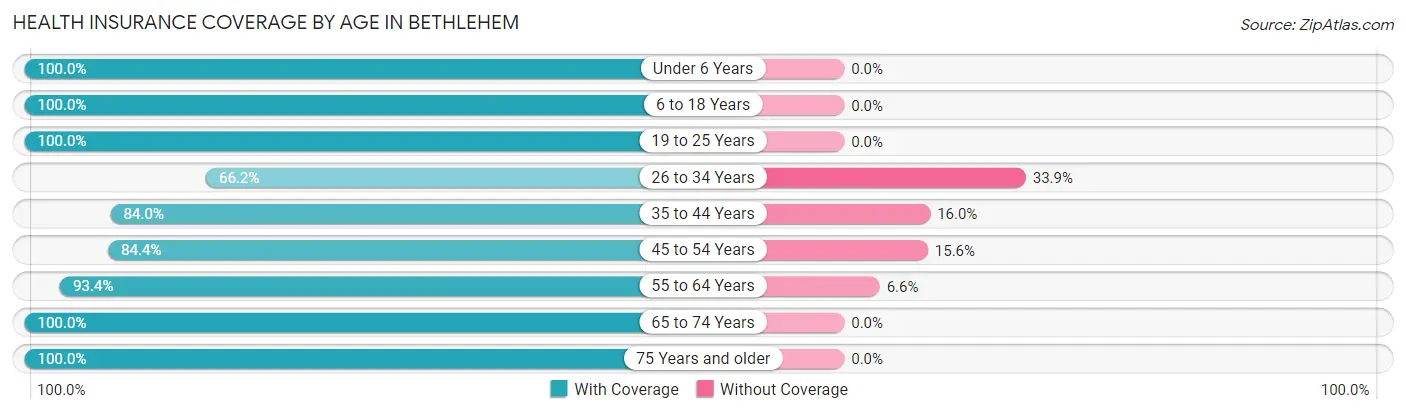
| Age Bracket | With Coverage | Without Coverage |
| Under 6 Years | 56 (100.0%) | 0 (0.0%) |
| 6 to 18 Years | 591 (100.0%) | 0 (0.0%) |
| 19 to 25 Years | 171 (100.0%) | 0 (0.0%) |
| 26 to 34 Years | 172 (66.1%) | 88 (33.9%) |
| 35 to 44 Years | 409 (84.0%) | 78 (16.0%) |
| 45 to 54 Years | 374 (84.4%) | 69 (15.6%) |
| 55 to 64 Years | 735 (93.4%) | 52 (6.6%) |
| 65 to 74 Years | 563 (100.0%) | 0 (0.0%) |
| 75 Years and older | 330 (100.0%) | 0 (0.0%) |
| Total | 3,401 (92.2%) | 287 (7.8%) |
Health Insurance Coverage by Citizenship Status in Bethlehem
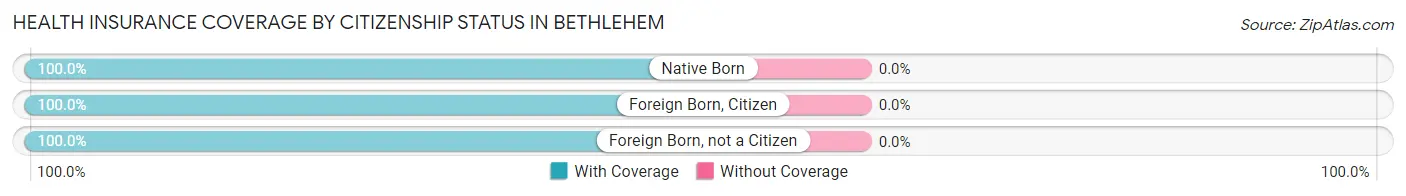
| Citizenship Status | With Coverage | Without Coverage |
| Native Born | 56 (100.0%) | 0 (0.0%) |
| Foreign Born, Citizen | 591 (100.0%) | 0 (0.0%) |
| Foreign Born, not a Citizen | 171 (100.0%) | 0 (0.0%) |
Health Insurance Coverage by Household Income in Bethlehem
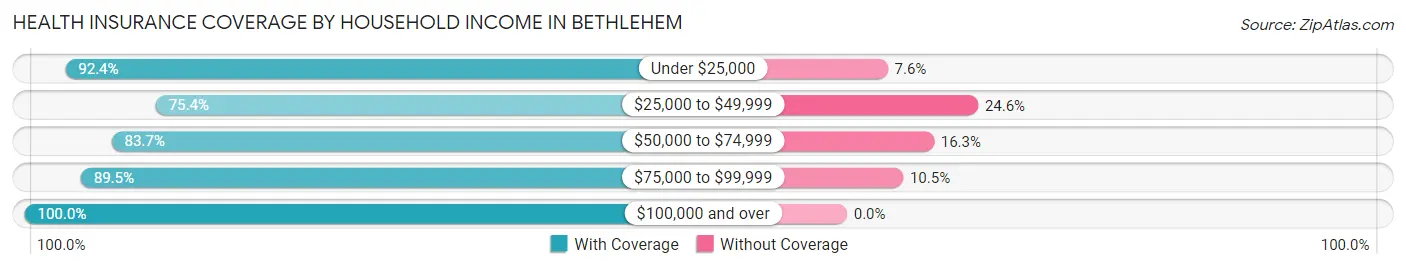
| Household Income | With Coverage | Without Coverage |
| Under $25,000 | 133 (92.4%) | 11 (7.6%) |
| $25,000 to $49,999 | 221 (75.4%) | 72 (24.6%) |
| $50,000 to $74,999 | 770 (83.7%) | 150 (16.3%) |
| $75,000 to $99,999 | 459 (89.5%) | 54 (10.5%) |
| $100,000 and over | 1,818 (100.0%) | 0 (0.0%) |
Public vs Private Health Insurance Coverage by Age in Bethlehem
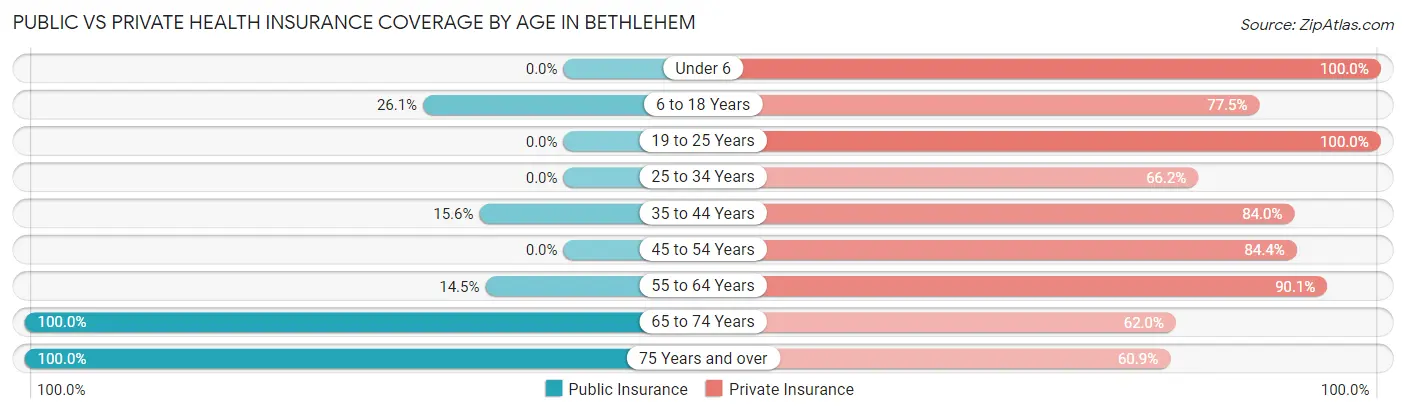
| Age Bracket | Public Insurance | Private Insurance |
| Under 6 | 0 (0.0%) | 56 (100.0%) |
| 6 to 18 Years | 154 (26.1%) | 458 (77.5%) |
| 19 to 25 Years | 0 (0.0%) | 171 (100.0%) |
| 25 to 34 Years | 0 (0.0%) | 172 (66.1%) |
| 35 to 44 Years | 76 (15.6%) | 409 (84.0%) |
| 45 to 54 Years | 0 (0.0%) | 374 (84.4%) |
| 55 to 64 Years | 114 (14.5%) | 709 (90.1%) |
| 65 to 74 Years | 563 (100.0%) | 349 (62.0%) |
| 75 Years and over | 330 (100.0%) | 201 (60.9%) |
| Total | 1,237 (33.5%) | 2,899 (78.6%) |
Disability Status by Sex by Age in Bethlehem
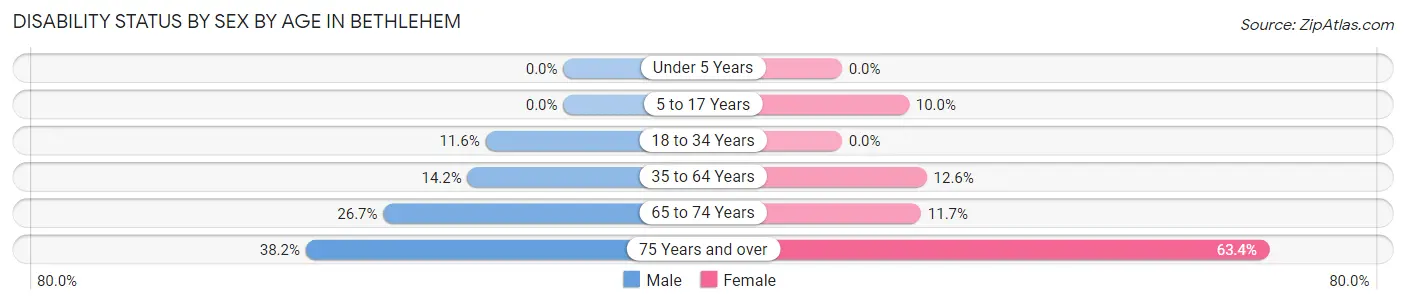
| Age Bracket | Male | Female |
| Under 5 Years | 0 (0.0%) | 0 (0.0%) |
| 5 to 17 Years | 0 (0.0%) | 21 (10.0%) |
| 18 to 34 Years | 34 (11.6%) | 0 (0.0%) |
| 35 to 64 Years | 121 (14.2%) | 109 (12.6%) |
| 65 to 74 Years | 89 (26.7%) | 27 (11.7%) |
| 75 Years and over | 52 (38.2%) | 123 (63.4%) |
Disability Class by Sex by Age in Bethlehem
Disability Class: Hearing Difficulty
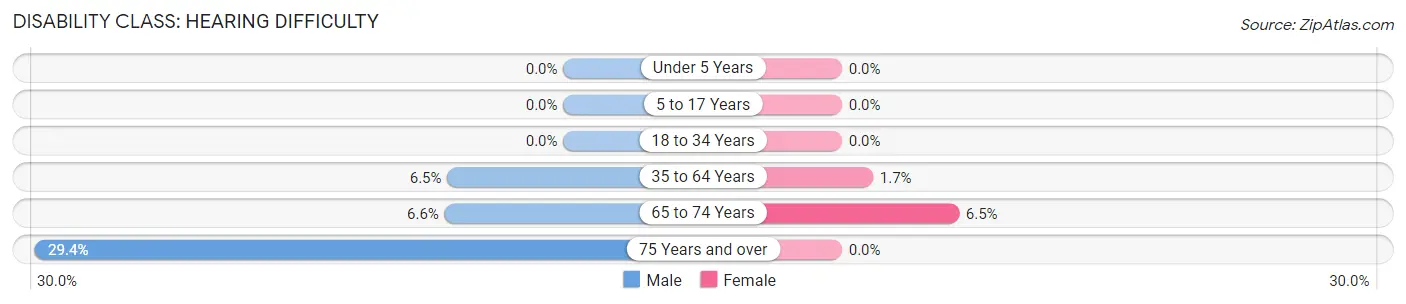
| Age Bracket | Male | Female |
| Under 5 Years | 0 (0.0%) | 0 (0.0%) |
| 5 to 17 Years | 0 (0.0%) | 0 (0.0%) |
| 18 to 34 Years | 0 (0.0%) | 0 (0.0%) |
| 35 to 64 Years | 55 (6.5%) | 15 (1.7%) |
| 65 to 74 Years | 22 (6.6%) | 15 (6.5%) |
| 75 Years and over | 40 (29.4%) | 0 (0.0%) |
Disability Class: Vision Difficulty
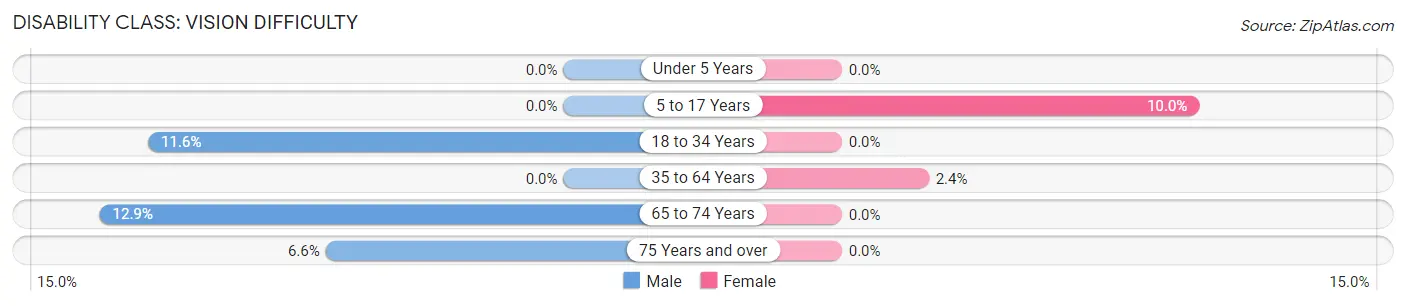
| Age Bracket | Male | Female |
| Under 5 Years | 0 (0.0%) | 0 (0.0%) |
| 5 to 17 Years | 0 (0.0%) | 21 (10.0%) |
| 18 to 34 Years | 34 (11.6%) | 0 (0.0%) |
| 35 to 64 Years | 0 (0.0%) | 21 (2.4%) |
| 65 to 74 Years | 43 (12.9%) | 0 (0.0%) |
| 75 Years and over | 9 (6.6%) | 0 (0.0%) |
Disability Class: Cognitive Difficulty
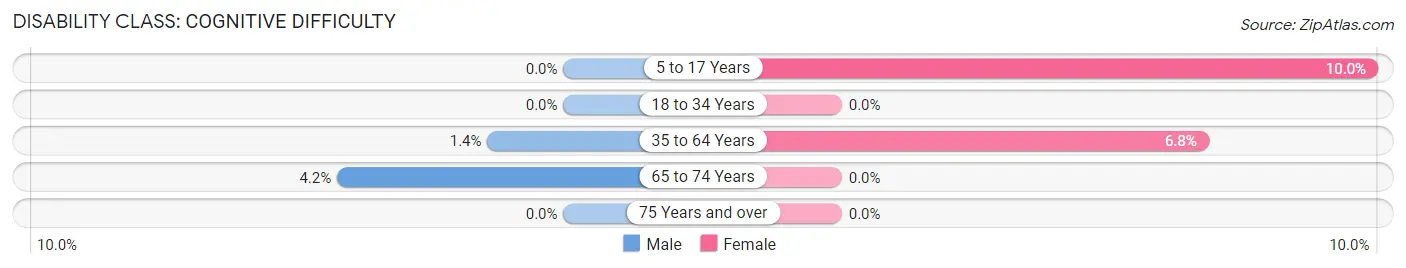
| Age Bracket | Male | Female |
| 5 to 17 Years | 0 (0.0%) | 21 (10.0%) |
| 18 to 34 Years | 0 (0.0%) | 0 (0.0%) |
| 35 to 64 Years | 12 (1.4%) | 59 (6.8%) |
| 65 to 74 Years | 14 (4.2%) | 0 (0.0%) |
| 75 Years and over | 0 (0.0%) | 0 (0.0%) |
Disability Class: Ambulatory Difficulty
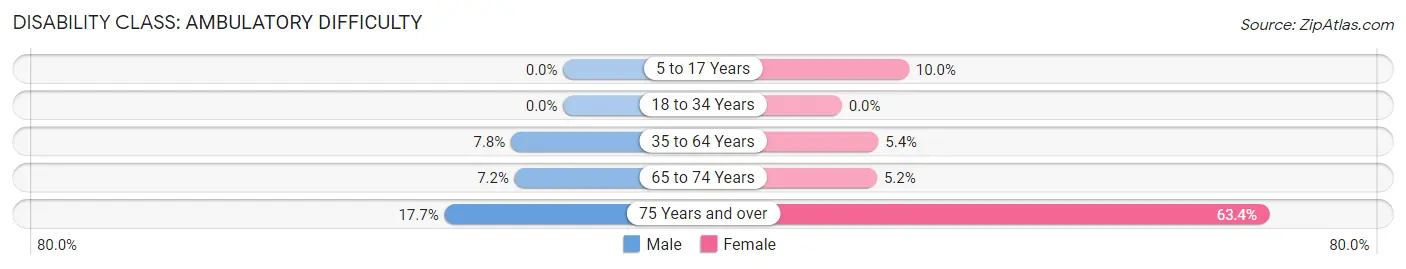
| Age Bracket | Male | Female |
| 5 to 17 Years | 0 (0.0%) | 21 (10.0%) |
| 18 to 34 Years | 0 (0.0%) | 0 (0.0%) |
| 35 to 64 Years | 66 (7.8%) | 47 (5.4%) |
| 65 to 74 Years | 24 (7.2%) | 12 (5.2%) |
| 75 Years and over | 24 (17.6%) | 123 (63.4%) |
Disability Class: Self-Care Difficulty
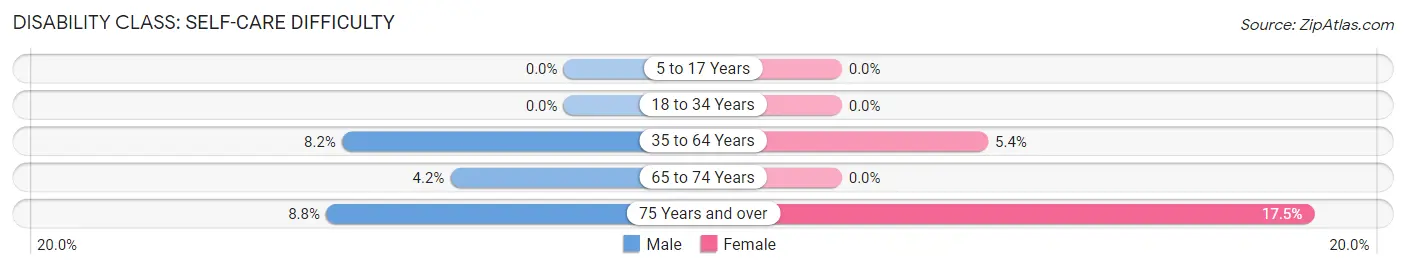
| Age Bracket | Male | Female |
| 5 to 17 Years | 0 (0.0%) | 0 (0.0%) |
| 18 to 34 Years | 0 (0.0%) | 0 (0.0%) |
| 35 to 64 Years | 70 (8.2%) | 47 (5.4%) |
| 65 to 74 Years | 14 (4.2%) | 0 (0.0%) |
| 75 Years and over | 12 (8.8%) | 34 (17.5%) |
Technology Access in Bethlehem
Computing Device Access in Bethlehem
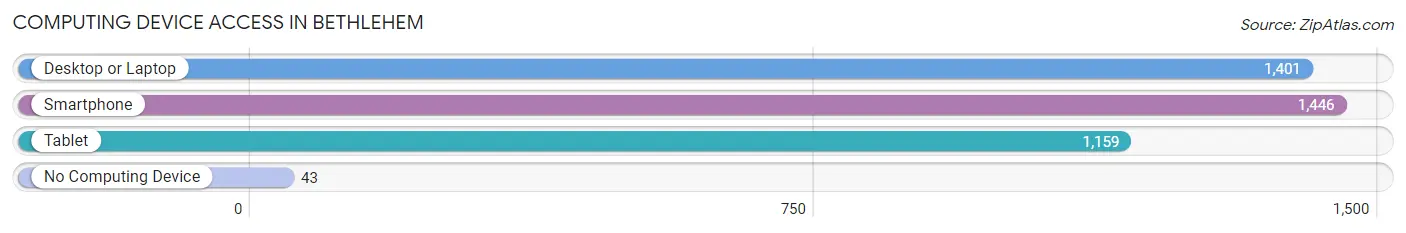
| Device Type | # Households | % Households |
| Desktop or Laptop | 1,401 | 86.6% |
| Smartphone | 1,446 | 89.4% |
| Tablet | 1,159 | 71.7% |
| No Computing Device | 43 | 2.7% |
| Total | 1,617 | 100.0% |
Internet Access in Bethlehem
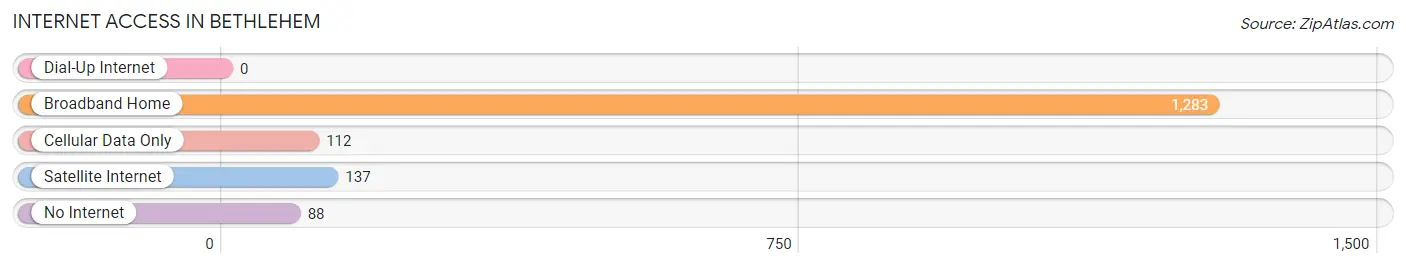
| Internet Type | # Households | % Households |
| Dial-Up Internet | 0 | 0.0% |
| Broadband Home | 1,283 | 79.3% |
| Cellular Data Only | 112 | 6.9% |
| Satellite Internet | 137 | 8.5% |
| No Internet | 88 | 5.4% |
| Total | 1,617 | 100.0% |
Bethlehem Summary
Bethlehem is a small town located in the foothills of the Blue Ridge Mountains in western North Carolina. It is situated in the county of Alexander, and is part of the Hickory-Lenoir-Morganton Metropolitan Statistical Area. The town has a population of approximately 1,000 people, and is known for its rural charm and small-town atmosphere.
Geography
Bethlehem is located in the foothills of the Blue Ridge Mountains, and is situated in the county of Alexander. The town is located at an elevation of 1,000 feet, and is surrounded by rolling hills and lush forests. The town is located approximately 30 miles from the city of Hickory, and is accessible via US Highway 64.
Climate
Bethlehem has a humid subtropical climate, with hot summers and mild winters. The average annual temperature is around 60 degrees Fahrenheit, with temperatures ranging from the mid-30s in the winter to the mid-80s in the summer. The town receives an average of 45 inches of precipitation per year, with most of it falling in the form of rain.
Demographics
As of the 2010 census, Bethlehem had a population of 1,000 people. The racial makeup of the town was 95.2% White, 1.2% African American, 0.2% Native American, 0.2% Asian, 0.2% from other races, and 2.2% from two or more races. Hispanic or Latino of any race were 1.2% of the population.
Economy
Bethlehem’s economy is largely based on agriculture and tourism. The town is home to several small farms, which produce a variety of crops, including corn, soybeans, and tobacco. The town is also home to several small businesses, including restaurants, shops, and a winery. Tourism is also an important part of the local economy, with visitors coming to the area to enjoy the scenic beauty of the Blue Ridge Mountains.
History
Bethlehem was founded in 1845 by a group of settlers from Pennsylvania. The town was named after the biblical town of Bethlehem, and was originally intended to be a religious community. The town grew slowly over the years, and by the early 1900s, it had become a thriving agricultural community. The town was also home to several small businesses, including a general store, a blacksmith shop, and a grist mill.
In the late 20th century, Bethlehem began to experience a decline in population as many of its residents moved away in search of better economic opportunities. However, in recent years, the town has seen a resurgence in population as people have moved back to the area to take advantage of the town’s rural charm and small-town atmosphere. Today, Bethlehem is a thriving community with a strong sense of community and a vibrant economy.
Common Questions
What is Per Capita Income in Bethlehem?
Per Capita income in Bethlehem is $51,662.
What is the Median Family Income in Bethlehem?
Median Family Income in Bethlehem is $104,602.
What is the Median Household income in Bethlehem?
Median Household Income in Bethlehem is $75,838.
What is Income or Wage Gap in Bethlehem?
Income or Wage Gap in Bethlehem is 46.4%.
Women in Bethlehem earn 53.6 cents for every dollar earned by a man.
What is Inequality or Gini Index in Bethlehem?
Inequality or Gini Index in Bethlehem is 0.44.
What is the Total Population of Bethlehem?
Total Population of Bethlehem is 3,688.
What is the Total Male Population of Bethlehem?
Total Male Population of Bethlehem is 1,899.
What is the Total Female Population of Bethlehem?
Total Female Population of Bethlehem is 1,789.
What is the Ratio of Males per 100 Females in Bethlehem?
There are 106.15 Males per 100 Females in Bethlehem.
What is the Ratio of Females per 100 Males in Bethlehem?
There are 94.21 Females per 100 Males in Bethlehem.
What is the Median Population Age in Bethlehem?
Median Population Age in Bethlehem is 52.3 Years.
What is the Average Family Size in Bethlehem
Average Family Size in Bethlehem is 2.8 People.
What is the Average Household Size in Bethlehem
Average Household Size in Bethlehem is 2.3 People.
How Large is the Labor Force in Bethlehem?
There are 1,844 People in the Labor Forcein in Bethlehem.
What is the Percentage of People in the Labor Force in Bethlehem?
56.6% of People are in the Labor Force in Bethlehem.
What is the Unemployment Rate in Bethlehem?
Unemployment Rate in Bethlehem is 2.9%.