Kure Beach, NC Map & Demographics
Kure Beach Map
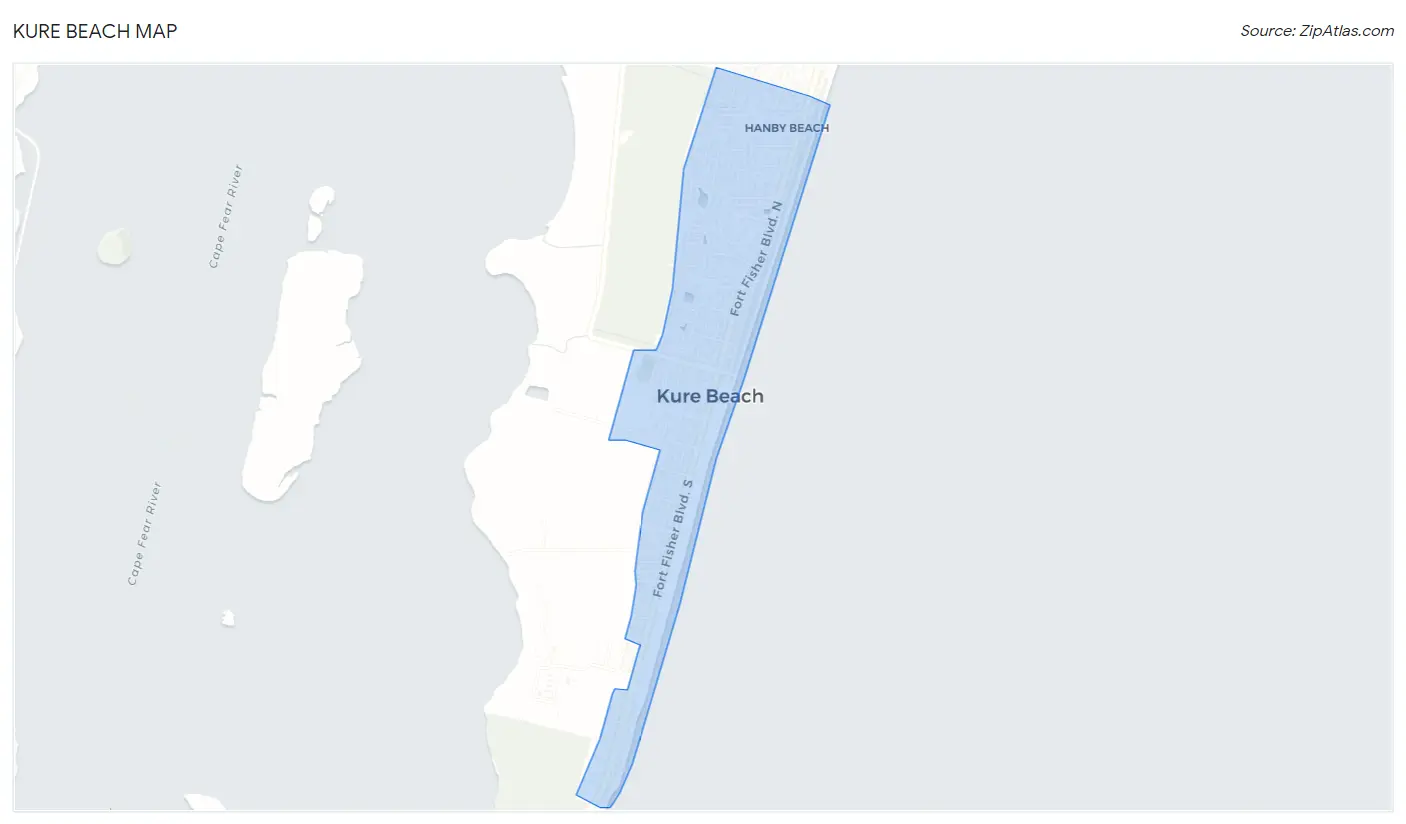
Kure Beach Overview
$59,415
PER CAPITA INCOME
$106,250
AVG FAMILY INCOME
$97,269
AVG HOUSEHOLD INCOME
58.6%
WAGE / INCOME GAP [ % ]
41.4¢/ $1
WAGE / INCOME GAP [ $ ]
0.42
INEQUALITY / GINI INDEX
2,313
TOTAL POPULATION
1,118
MALE POPULATION
1,195
FEMALE POPULATION
93.56
MALES / 100 FEMALES
106.89
FEMALES / 100 MALES
55.1
MEDIAN AGE
2.6
AVG FAMILY SIZE
2.4
AVG HOUSEHOLD SIZE
1,253
LABOR FORCE [ PEOPLE ]
60.0%
PERCENT IN LABOR FORCE
1.2%
UNEMPLOYMENT RATE
Kure Beach Zip Codes
Kure Beach Area Codes
Income in Kure Beach
Income Overview in Kure Beach
Per Capita Income in Kure Beach is $59,415, while median incomes of families and households are $106,250 and $97,269 respectively.
| Characteristic | Number | Measure |
| Per Capita Income | 2,313 | $59,415 |
| Median Family Income | 760 | $106,250 |
| Mean Family Income | 760 | $149,157 |
| Median Household Income | 973 | $97,269 |
| Mean Household Income | 973 | $138,496 |
| Income Deficit | 760 | $0 |
| Wage / Income Gap (%) | 2,313 | 58.56% |
| Wage / Income Gap ($) | 2,313 | 41.44¢ per $1 |
| Gini / Inequality Index | 2,313 | 0.42 |
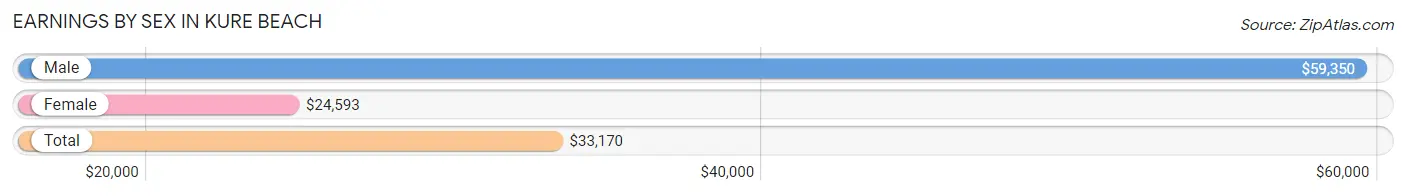
Earnings by Sex in Kure Beach
Average Earnings in Kure Beach are $33,170, $59,350 for men and $24,593 for women, a difference of 58.6%.
| Sex | Number | Average Earnings |
| Male | 706 (50.7%) | $59,350 |
| Female | 687 (49.3%) | $24,593 |
| Total | 1,393 (100.0%) | $33,170 |
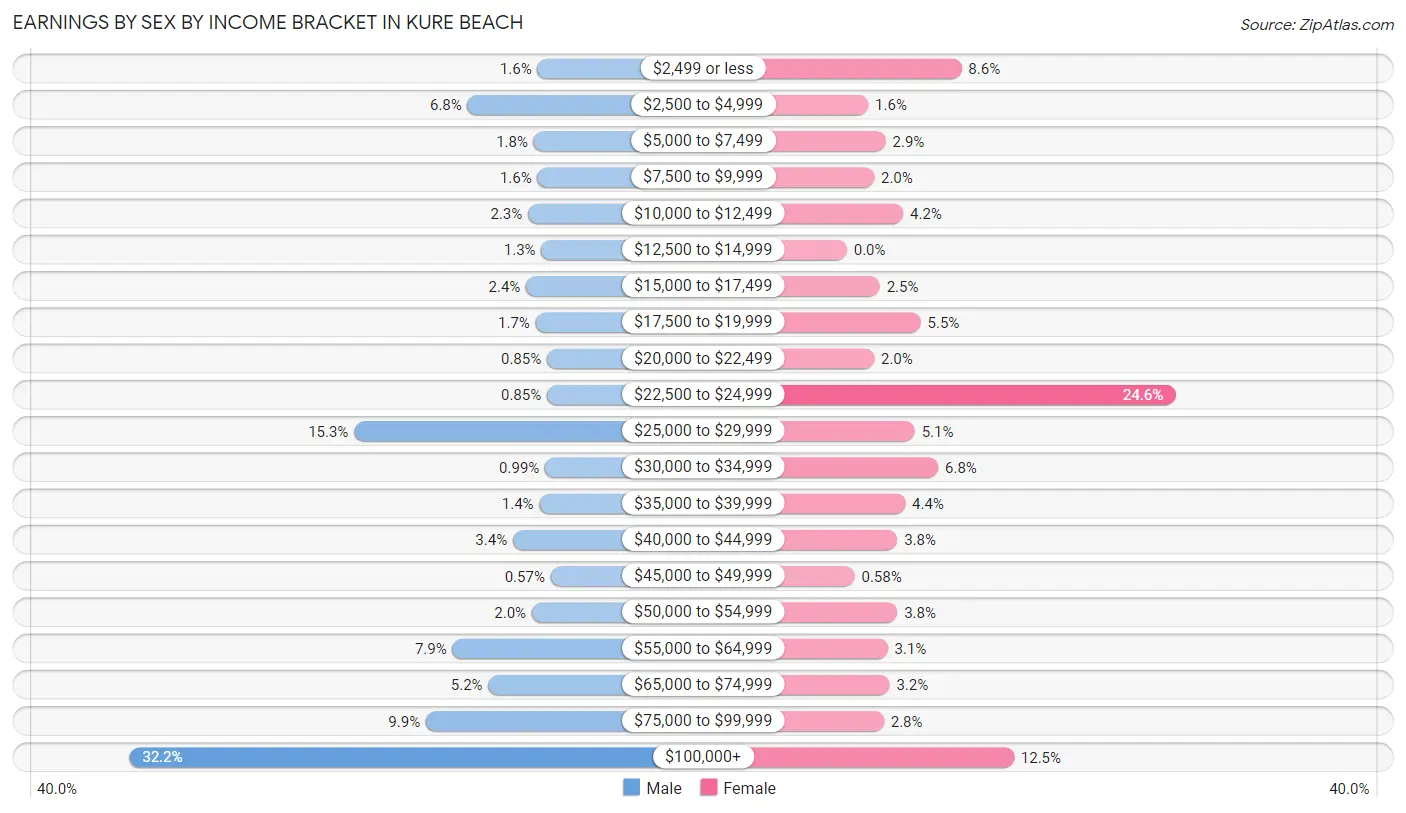
Earnings by Sex by Income Bracket in Kure Beach
The most common earnings brackets in Kure Beach are $100,000+ for men (227 | 32.2%) and $22,500 to $24,999 for women (169 | 24.6%).
| Income | Male | Female |
| $2,499 or less | 11 (1.6%) | 59 (8.6%) |
| $2,500 to $4,999 | 48 (6.8%) | 11 (1.6%) |
| $5,000 to $7,499 | 13 (1.8%) | 20 (2.9%) |
| $7,500 to $9,999 | 11 (1.6%) | 14 (2.0%) |
| $10,000 to $12,499 | 16 (2.3%) | 29 (4.2%) |
| $12,500 to $14,999 | 9 (1.3%) | 0 (0.0%) |
| $15,000 to $17,499 | 17 (2.4%) | 17 (2.5%) |
| $17,500 to $19,999 | 12 (1.7%) | 38 (5.5%) |
| $20,000 to $22,499 | 6 (0.9%) | 14 (2.0%) |
| $22,500 to $24,999 | 6 (0.9%) | 169 (24.6%) |
| $25,000 to $29,999 | 108 (15.3%) | 35 (5.1%) |
| $30,000 to $34,999 | 7 (1.0%) | 47 (6.8%) |
| $35,000 to $39,999 | 10 (1.4%) | 30 (4.4%) |
| $40,000 to $44,999 | 24 (3.4%) | 26 (3.8%) |
| $45,000 to $49,999 | 4 (0.6%) | 4 (0.6%) |
| $50,000 to $54,999 | 14 (2.0%) | 26 (3.8%) |
| $55,000 to $64,999 | 56 (7.9%) | 21 (3.1%) |
| $65,000 to $74,999 | 37 (5.2%) | 22 (3.2%) |
| $75,000 to $99,999 | 70 (9.9%) | 19 (2.8%) |
| $100,000+ | 227 (32.2%) | 86 (12.5%) |
| Total | 706 (100.0%) | 687 (100.0%) |
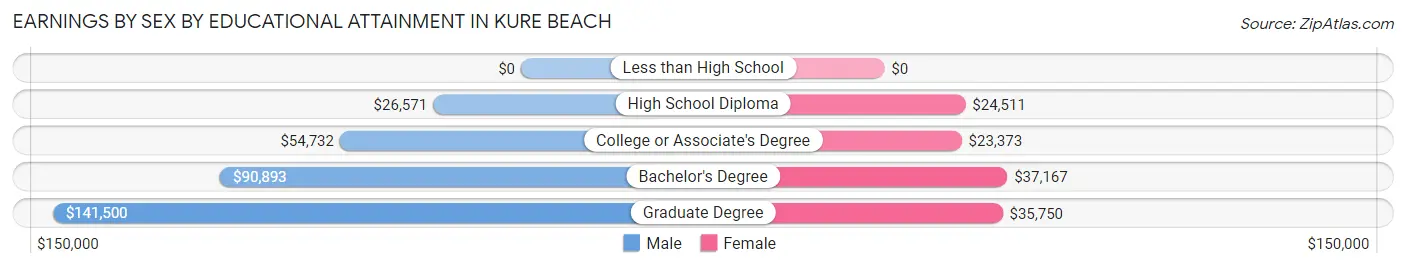
Earnings by Sex by Educational Attainment in Kure Beach
Average earnings in Kure Beach are $64,167 for men and $26,357 for women, a difference of 58.9%. Men with an educational attainment of graduate degree enjoy the highest average annual earnings of $141,500, while those with high school diploma education earn the least with $26,571. Women with an educational attainment of bachelor's degree earn the most with the average annual earnings of $37,167, while those with college or associate's degree education have the smallest earnings of $23,373.
| Educational Attainment | Male Income | Female Income |
| Less than High School | - | - |
| High School Diploma | $26,571 | $24,511 |
| College or Associate's Degree | $54,732 | $23,373 |
| Bachelor's Degree | $90,893 | $37,167 |
| Graduate Degree | $141,500 | $35,750 |
| Total | $64,167 | $26,357 |
Family Income in Kure Beach
Family Income Brackets in Kure Beach
According to the Kure Beach family income data, there are 169 families falling into the $200,000+ income range, which is the most common income bracket and makes up 22.2% of all families.
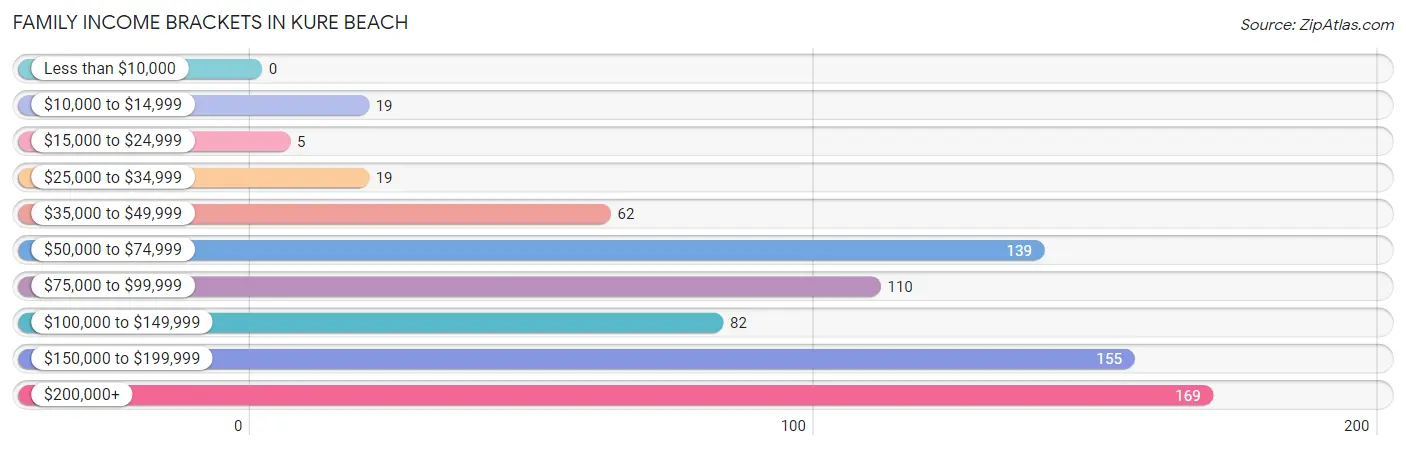
| Income Bracket | # Families | % Families |
| Less than $10,000 | 0 | 0.0% |
| $10,000 to $14,999 | 19 | 2.5% |
| $15,000 to $24,999 | 5 | 0.7% |
| $25,000 to $34,999 | 19 | 2.5% |
| $35,000 to $49,999 | 62 | 8.2% |
| $50,000 to $74,999 | 139 | 18.3% |
| $75,000 to $99,999 | 110 | 14.5% |
| $100,000 to $149,999 | 82 | 10.8% |
| $150,000 to $199,999 | 155 | 20.4% |
| $200,000+ | 169 | 22.2% |
Family Income by Famaliy Size in Kure Beach
4-person families (106 | 14.0%) account for the highest median family income in Kure Beach with $175,192 per family, while 3-person families (116 | 15.3%) have the highest median income of $56,250 per family member.

| Income Bracket | # Families | Median Income |
| 2-Person Families | 507 (66.7%) | $96,188 |
| 3-Person Families | 116 (15.3%) | $168,750 |
| 4-Person Families | 106 (14.0%) | $175,192 |
| 5-Person Families | 31 (4.1%) | $0 |
| 6-Person Families | 0 (0.0%) | $0 |
| 7+ Person Families | 0 (0.0%) | $0 |
| Total | 760 (100.0%) | $106,250 |
Family Income by Number of Earners in Kure Beach
The median family income in Kure Beach is $106,250, with families comprising 3+ earners (87) having the highest median family income of $177,019, while families with no earners (161) have the lowest median family income of $77,411, accounting for 11.5% and 21.2% of families, respectively.
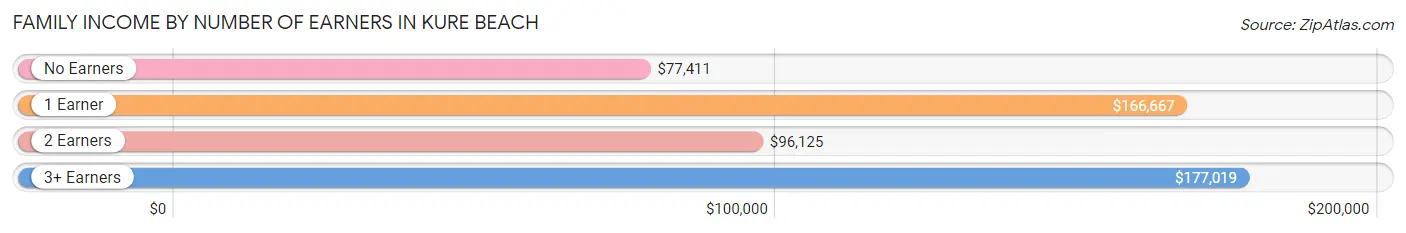
| Number of Earners | # Families | Median Income |
| No Earners | 161 (21.2%) | $77,411 |
| 1 Earner | 128 (16.8%) | $166,667 |
| 2 Earners | 384 (50.5%) | $96,125 |
| 3+ Earners | 87 (11.5%) | $177,019 |
| Total | 760 (100.0%) | $106,250 |
Household Income in Kure Beach
Household Income Brackets in Kure Beach
With 204 households falling in the category, the $50,000 to $74,999 income range is the most frequent in Kure Beach, accounting for 21.0% of all households. In contrast, only 5 households (0.5%) fall into the less than $10,000 income bracket, making it the least populous group.
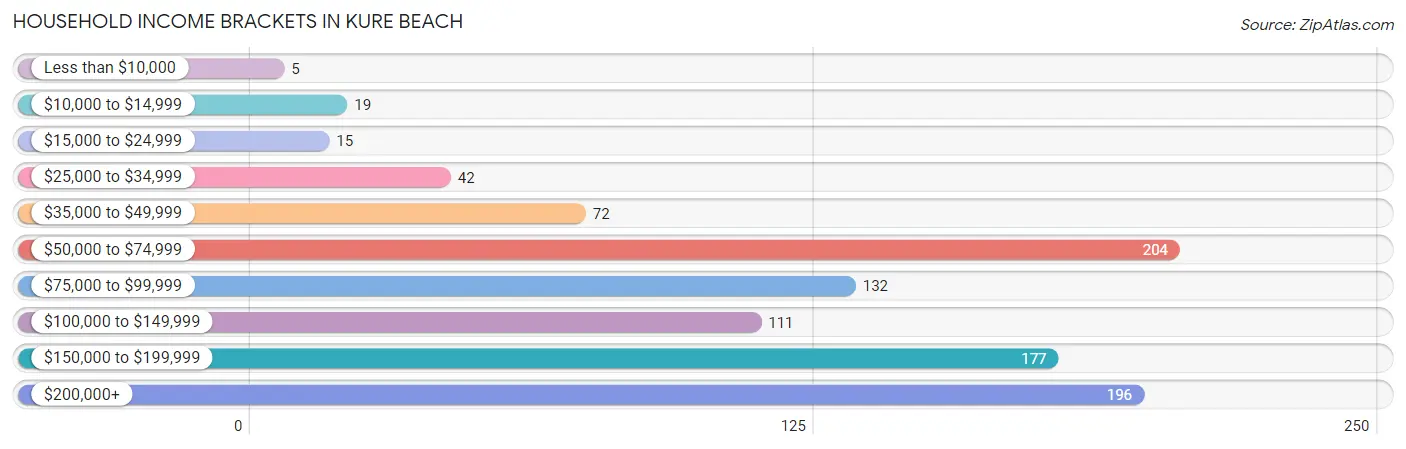
| Income Bracket | # Households | % Households |
| Less than $10,000 | 5 | 0.5% |
| $10,000 to $14,999 | 19 | 2.0% |
| $15,000 to $24,999 | 15 | 1.5% |
| $25,000 to $34,999 | 42 | 4.3% |
| $35,000 to $49,999 | 72 | 7.4% |
| $50,000 to $74,999 | 204 | 21.0% |
| $75,000 to $99,999 | 132 | 13.6% |
| $100,000 to $149,999 | 111 | 11.4% |
| $150,000 to $199,999 | 177 | 18.2% |
| $200,000+ | 196 | 20.1% |
Household Income by Householder Age in Kure Beach
The median household income in Kure Beach is $97,269, with the highest median household income of $143,500 found in the 65+ years age bracket for the primary householder. A total of 326 households (33.5%) fall into this category.
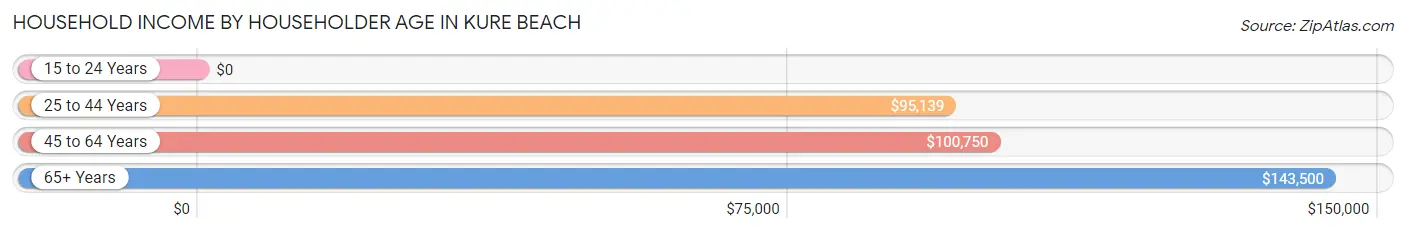
| Income Bracket | # Households | Median Income |
| 15 to 24 Years | 0 (0.0%) | $0 |
| 25 to 44 Years | 153 (15.7%) | $95,139 |
| 45 to 64 Years | 494 (50.8%) | $100,750 |
| 65+ Years | 326 (33.5%) | $143,500 |
| Total | 973 (100.0%) | $97,269 |
Poverty in Kure Beach
Income Below Poverty by Sex and Age in Kure Beach
With 5.2% poverty level for males and 1.9% for females among the residents of Kure Beach, 45 to 54 year old males and 18 to 24 year old females are the most vulnerable to poverty, with 22 males (10.4%) and 5 females (8.1%) in their respective age groups living below the poverty level.
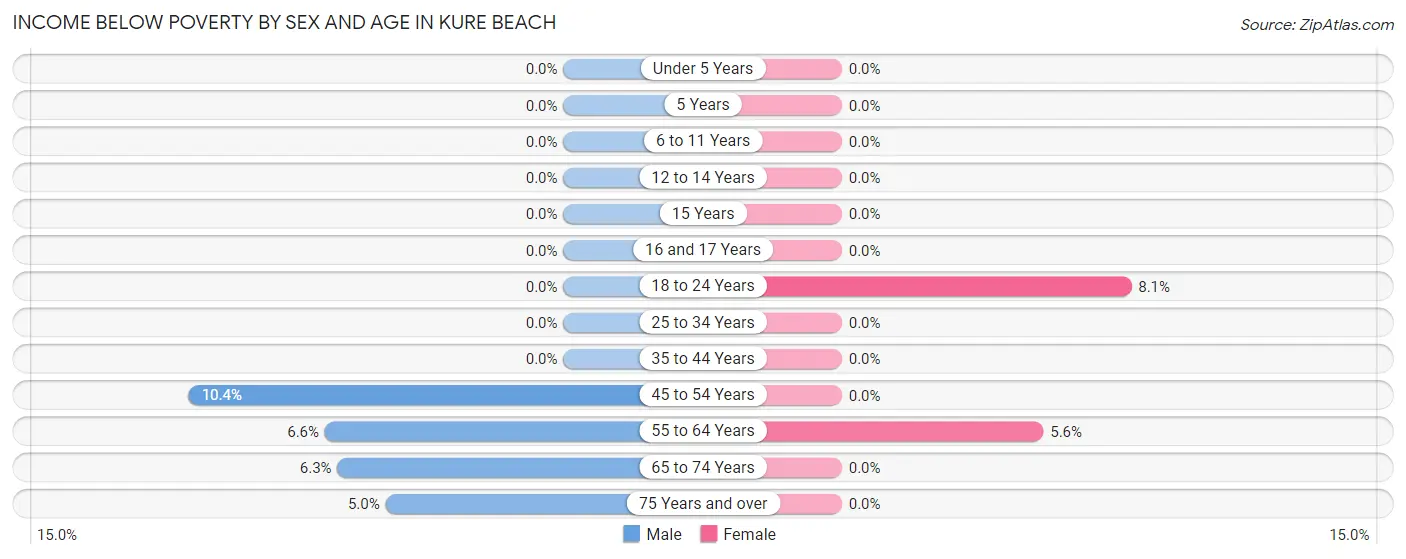
| Age Bracket | Male | Female |
| Under 5 Years | 0 (0.0%) | 0 (0.0%) |
| 5 Years | 0 (0.0%) | 0 (0.0%) |
| 6 to 11 Years | 0 (0.0%) | 0 (0.0%) |
| 12 to 14 Years | 0 (0.0%) | 0 (0.0%) |
| 15 Years | 0 (0.0%) | 0 (0.0%) |
| 16 and 17 Years | 0 (0.0%) | 0 (0.0%) |
| 18 to 24 Years | 0 (0.0%) | 5 (8.1%) |
| 25 to 34 Years | 0 (0.0%) | 0 (0.0%) |
| 35 to 44 Years | 0 (0.0%) | 0 (0.0%) |
| 45 to 54 Years | 22 (10.4%) | 0 (0.0%) |
| 55 to 64 Years | 20 (6.6%) | 18 (5.6%) |
| 65 to 74 Years | 11 (6.3%) | 0 (0.0%) |
| 75 Years and over | 5 (5.0%) | 0 (0.0%) |
| Total | 58 (5.2%) | 23 (1.9%) |
Income Above Poverty by Sex and Age in Kure Beach
According to the poverty statistics in Kure Beach, males aged under 5 years and females aged under 5 years are the age groups that are most secure financially, with 100.0% of males and 100.0% of females in these age groups living above the poverty line.
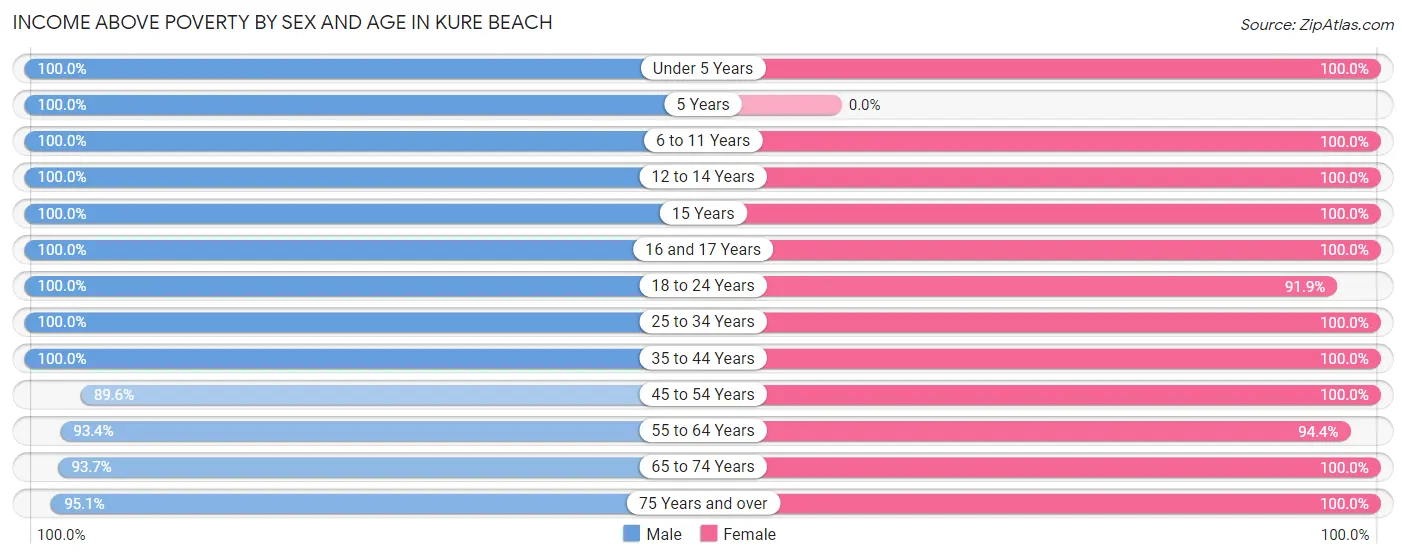
| Age Bracket | Male | Female |
| Under 5 Years | 23 (100.0%) | 21 (100.0%) |
| 5 Years | 7 (100.0%) | 0 (0.0%) |
| 6 to 11 Years | 32 (100.0%) | 30 (100.0%) |
| 12 to 14 Years | 32 (100.0%) | 66 (100.0%) |
| 15 Years | 9 (100.0%) | 5 (100.0%) |
| 16 and 17 Years | 12 (100.0%) | 37 (100.0%) |
| 18 to 24 Years | 42 (100.0%) | 57 (91.9%) |
| 25 to 34 Years | 80 (100.0%) | 82 (100.0%) |
| 35 to 44 Years | 93 (100.0%) | 94 (100.0%) |
| 45 to 54 Years | 189 (89.6%) | 214 (100.0%) |
| 55 to 64 Years | 281 (93.4%) | 303 (94.4%) |
| 65 to 74 Years | 164 (93.7%) | 200 (100.0%) |
| 75 Years and over | 96 (95.1%) | 63 (100.0%) |
| Total | 1,060 (94.8%) | 1,172 (98.1%) |
Income Below Poverty Among Married-Couple Families in Kure Beach
The poverty statistics for married-couple families in Kure Beach show that 2.6% or 19 of the total 717 families live below the poverty line. Families with no children have the highest poverty rate of 3.5%, comprising of 19 families. On the other hand, families with 1 or 2 children have the lowest poverty rate of 0.0%, which includes 0 families.
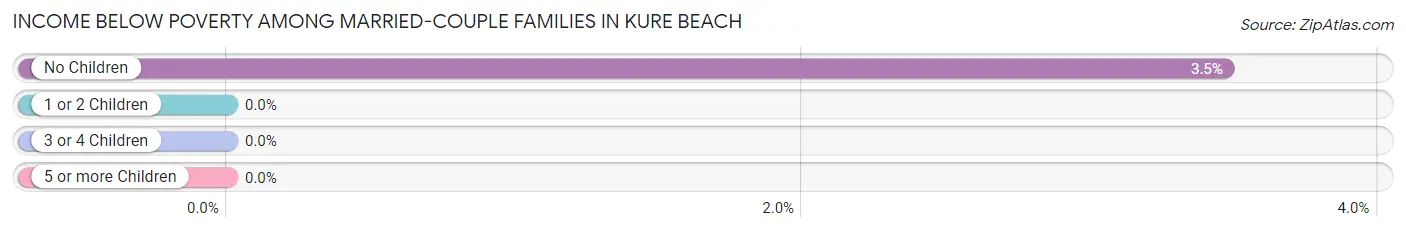
| Children | Above Poverty | Below Poverty |
| No Children | 529 (96.5%) | 19 (3.5%) |
| 1 or 2 Children | 154 (100.0%) | 0 (0.0%) |
| 3 or 4 Children | 15 (100.0%) | 0 (0.0%) |
| 5 or more Children | 0 (0.0%) | 0 (0.0%) |
| Total | 698 (97.4%) | 19 (2.6%) |
Income Below Poverty Among Single-Parent Households in Kure Beach
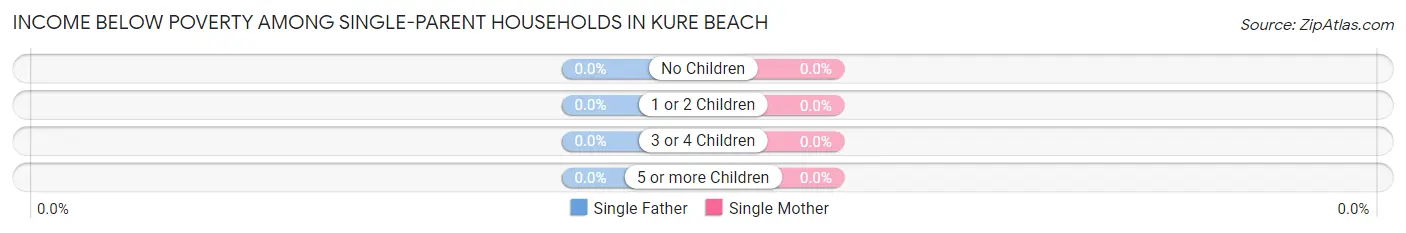
| Children | Single Father | Single Mother |
| No Children | 0 (0.0%) | 0 (0.0%) |
| 1 or 2 Children | 0 (0.0%) | 0 (0.0%) |
| 3 or 4 Children | 0 (0.0%) | 0 (0.0%) |
| 5 or more Children | 0 (0.0%) | 0 (0.0%) |
| Total | 0 (0.0%) | 0 (0.0%) |
Income Below Poverty Among Married-Couple vs Single-Parent Households in Kure Beach
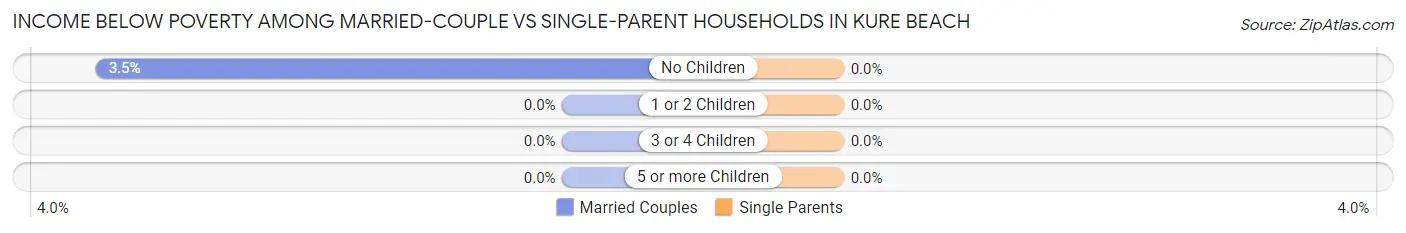
| Children | Married-Couple Families | Single-Parent Households |
| No Children | 19 (3.5%) | 0 (0.0%) |
| 1 or 2 Children | 0 (0.0%) | 0 (0.0%) |
| 3 or 4 Children | 0 (0.0%) | 0 (0.0%) |
| 5 or more Children | 0 (0.0%) | 0 (0.0%) |
| Total | 19 (2.6%) | 0 (0.0%) |
Race in Kure Beach
The most populous races in Kure Beach are White / Caucasian (2,252 | 97.4%), Two or more Races (56 | 2.4%), and Hispanic or Latino (52 | 2.2%).
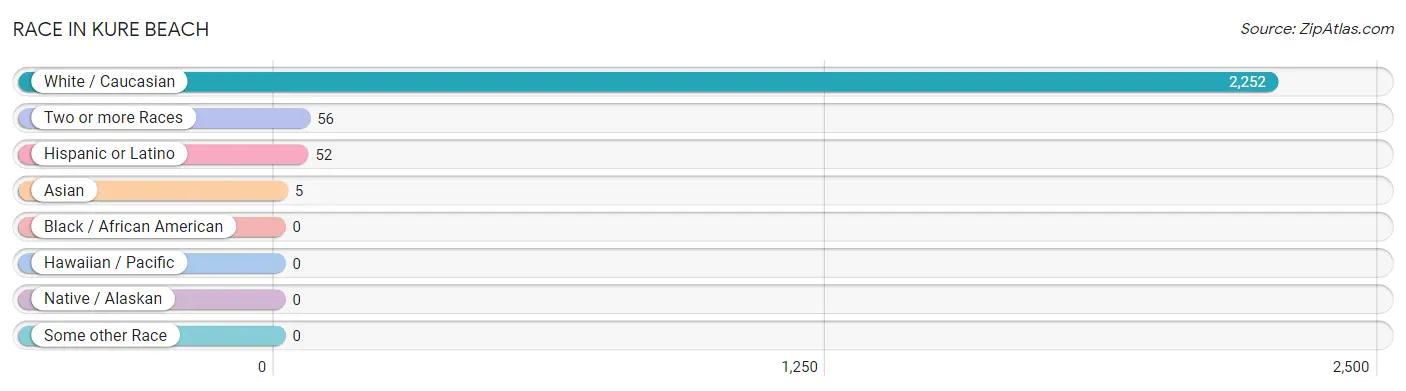
| Race | # Population | % Population |
| Asian | 5 | 0.2% |
| Black / African American | 0 | 0.0% |
| Hawaiian / Pacific | 0 | 0.0% |
| Hispanic or Latino | 52 | 2.2% |
| Native / Alaskan | 0 | 0.0% |
| White / Caucasian | 2,252 | 97.4% |
| Two or more Races | 56 | 2.4% |
| Some other Race | 0 | 0.0% |
| Total | 2,313 | 100.0% |
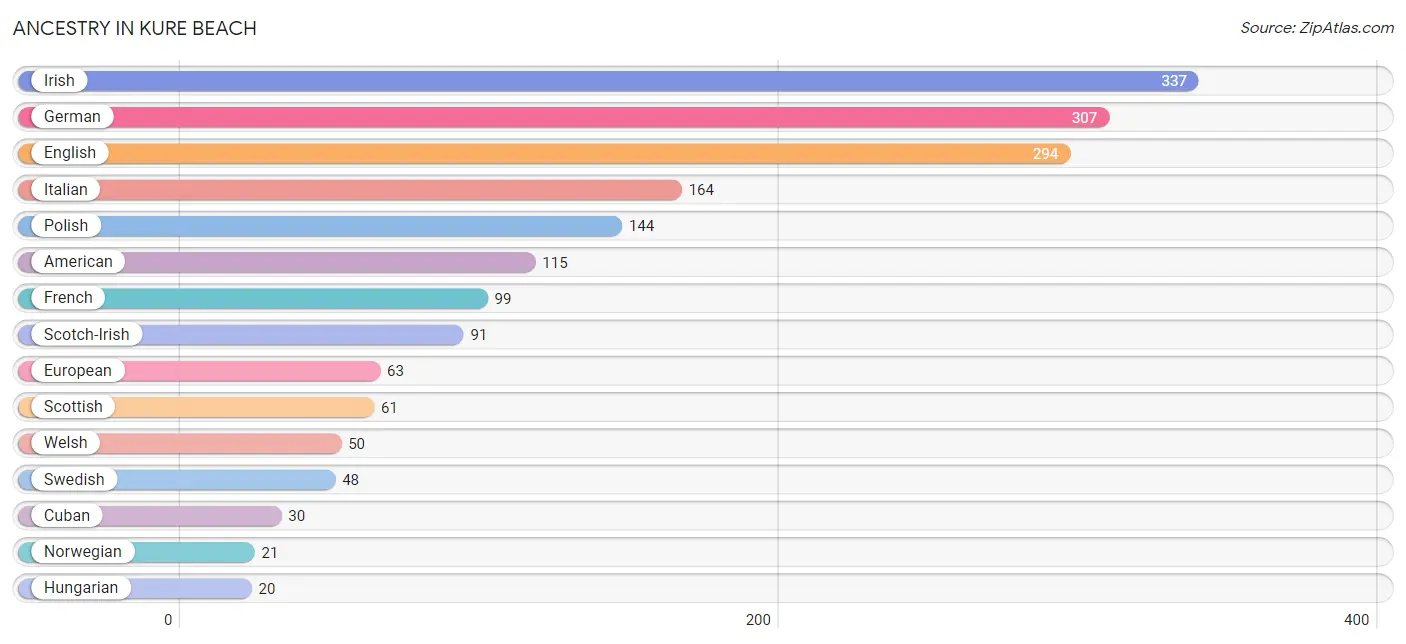
Ancestry in Kure Beach
The most populous ancestries reported in Kure Beach are Irish (337 | 14.6%), German (307 | 13.3%), English (294 | 12.7%), Italian (164 | 7.1%), and Polish (144 | 6.2%), together accounting for 53.9% of all Kure Beach residents.
| Ancestry | # Population | % Population |
| American | 115 | 5.0% |
| Armenian | 4 | 0.2% |
| Austrian | 5 | 0.2% |
| Bhutanese | 6 | 0.3% |
| British | 13 | 0.6% |
| Canadian | 4 | 0.2% |
| Croatian | 5 | 0.2% |
| Cuban | 30 | 1.3% |
| Danish | 16 | 0.7% |
| Dutch | 3 | 0.1% |
| Eastern European | 12 | 0.5% |
| English | 294 | 12.7% |
| European | 63 | 2.7% |
| Finnish | 16 | 0.7% |
| French | 99 | 4.3% |
| German | 307 | 13.3% |
| Greek | 10 | 0.4% |
| Hungarian | 20 | 0.9% |
| Indian (Asian) | 5 | 0.2% |
| Iranian | 10 | 0.4% |
| Irish | 337 | 14.6% |
| Italian | 164 | 7.1% |
| Lithuanian | 2 | 0.1% |
| Norwegian | 21 | 0.9% |
| Polish | 144 | 6.2% |
| Portuguese | 16 | 0.7% |
| Puerto Rican | 18 | 0.8% |
| Scandinavian | 6 | 0.3% |
| Scotch-Irish | 91 | 3.9% |
| Scottish | 61 | 2.6% |
| Slovak | 5 | 0.2% |
| South African | 5 | 0.2% |
| Subsaharan African | 5 | 0.2% |
| Swedish | 48 | 2.1% |
| Swiss | 5 | 0.2% |
| Welsh | 50 | 2.2% | View All 36 Rows |
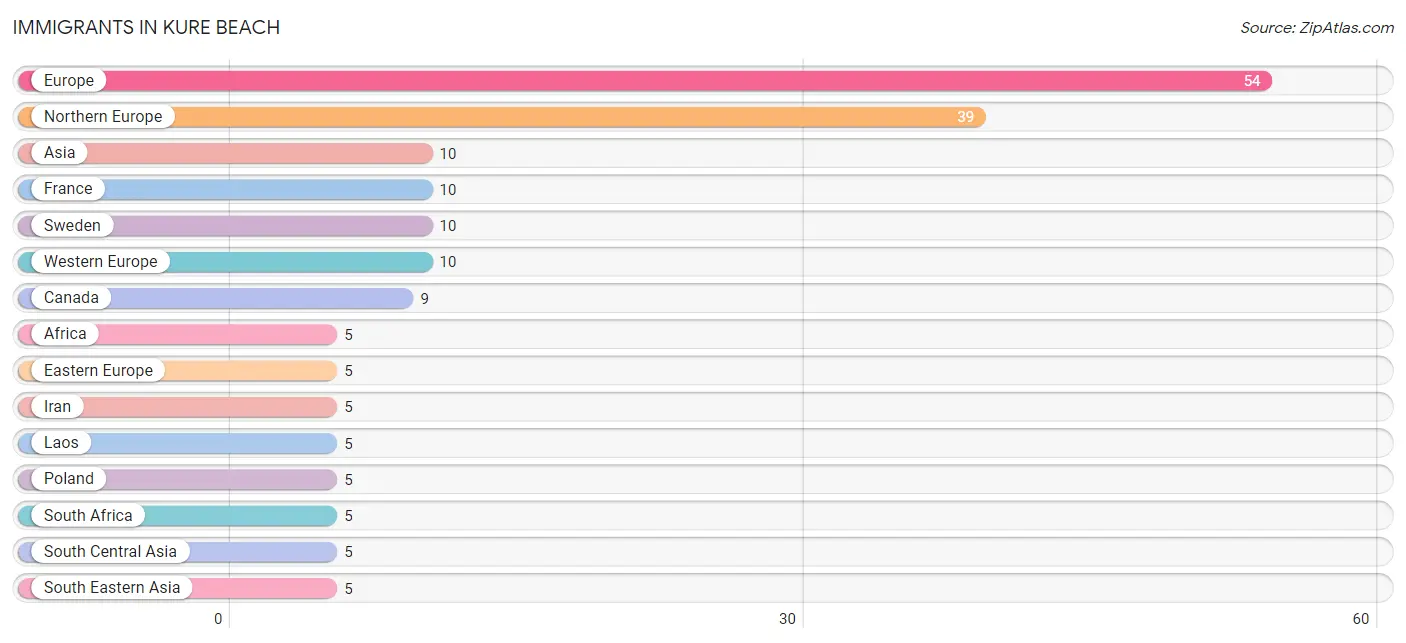
Immigrants in Kure Beach
The most numerous immigrant groups reported in Kure Beach came from Europe (54 | 2.3%), Northern Europe (39 | 1.7%), Asia (10 | 0.4%), France (10 | 0.4%), and Sweden (10 | 0.4%), together accounting for 5.3% of all Kure Beach residents.
| Immigration Origin | # Population | % Population |
| Africa | 5 | 0.2% |
| Asia | 10 | 0.4% |
| Canada | 9 | 0.4% |
| Eastern Europe | 5 | 0.2% |
| Europe | 54 | 2.3% |
| France | 10 | 0.4% |
| Iran | 5 | 0.2% |
| Laos | 5 | 0.2% |
| Northern Europe | 39 | 1.7% |
| Poland | 5 | 0.2% |
| South Africa | 5 | 0.2% |
| South Central Asia | 5 | 0.2% |
| South Eastern Asia | 5 | 0.2% |
| Sweden | 10 | 0.4% |
| Western Europe | 10 | 0.4% | View All 15 Rows |
Sex and Age in Kure Beach
Sex and Age in Kure Beach
The most populous age groups in Kure Beach are 55 to 59 Years (176 | 15.7%) for men and 55 to 59 Years (218 | 18.2%) for women.
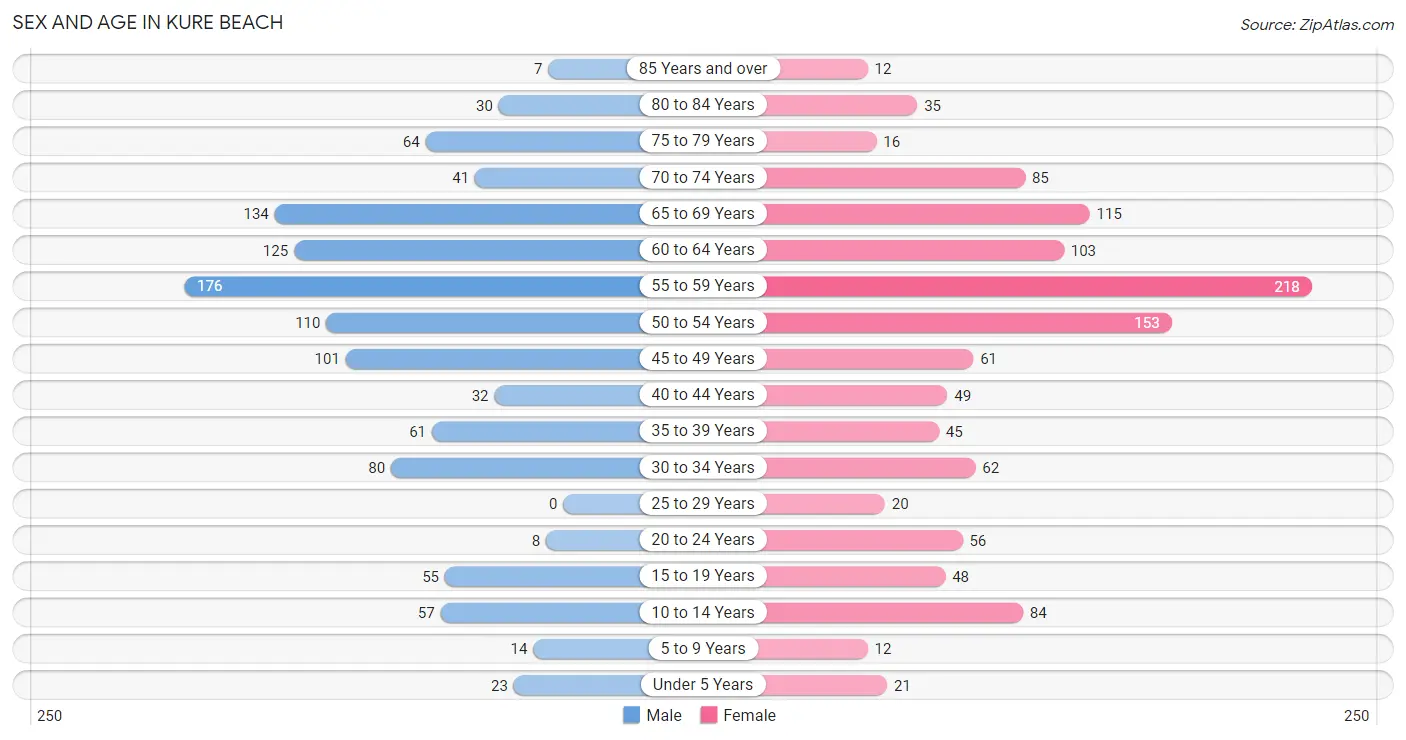
| Age Bracket | Male | Female |
| Under 5 Years | 23 (2.1%) | 21 (1.8%) |
| 5 to 9 Years | 14 (1.3%) | 12 (1.0%) |
| 10 to 14 Years | 57 (5.1%) | 84 (7.0%) |
| 15 to 19 Years | 55 (4.9%) | 48 (4.0%) |
| 20 to 24 Years | 8 (0.7%) | 56 (4.7%) |
| 25 to 29 Years | 0 (0.0%) | 20 (1.7%) |
| 30 to 34 Years | 80 (7.2%) | 62 (5.2%) |
| 35 to 39 Years | 61 (5.5%) | 45 (3.8%) |
| 40 to 44 Years | 32 (2.9%) | 49 (4.1%) |
| 45 to 49 Years | 101 (9.0%) | 61 (5.1%) |
| 50 to 54 Years | 110 (9.8%) | 153 (12.8%) |
| 55 to 59 Years | 176 (15.7%) | 218 (18.2%) |
| 60 to 64 Years | 125 (11.2%) | 103 (8.6%) |
| 65 to 69 Years | 134 (12.0%) | 115 (9.6%) |
| 70 to 74 Years | 41 (3.7%) | 85 (7.1%) |
| 75 to 79 Years | 64 (5.7%) | 16 (1.3%) |
| 80 to 84 Years | 30 (2.7%) | 35 (2.9%) |
| 85 Years and over | 7 (0.6%) | 12 (1.0%) |
| Total | 1,118 (100.0%) | 1,195 (100.0%) |
Families and Households in Kure Beach
Median Family Size in Kure Beach
The median family size in Kure Beach is 2.64 persons per family, with single female/mother families (15 | 2.0%) accounting for the largest median family size of 3.8 persons per family. On the other hand, married-couple families (717 | 94.3%) represent the smallest median family size with 2.58 persons per family.
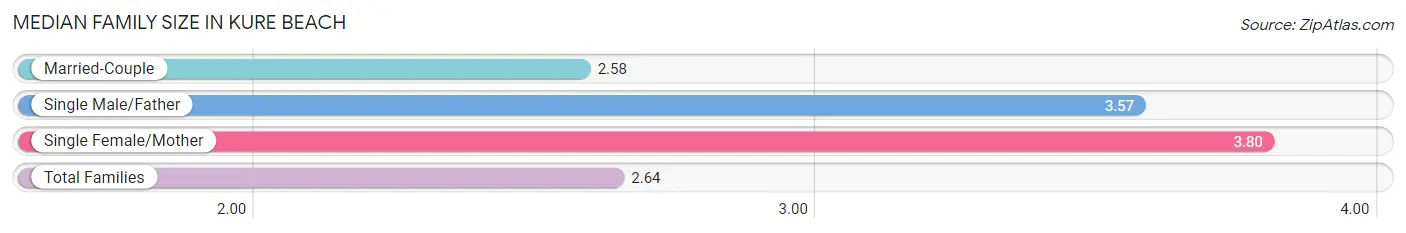
| Family Type | # Families | Family Size |
| Married-Couple | 717 (94.3%) | 2.58 |
| Single Male/Father | 28 (3.7%) | 3.57 |
| Single Female/Mother | 15 (2.0%) | 3.80 |
| Total Families | 760 (100.0%) | 2.64 |
Median Household Size in Kure Beach
The median household size in Kure Beach is 2.38 persons per household, with single female/mother households (15 | 1.5%) accounting for the largest median household size of 4.2 persons per household. non-family households (213 | 21.9%) represent the smallest median household size with 1.33 persons per household.
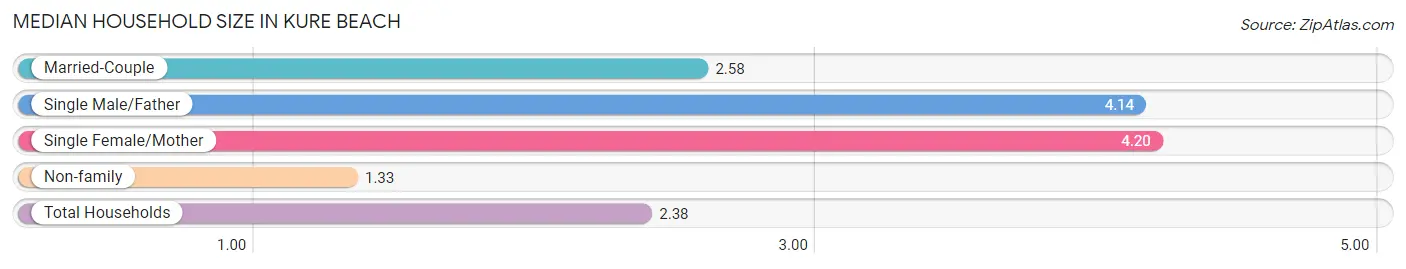
| Household Type | # Households | Household Size |
| Married-Couple | 717 (73.7%) | 2.58 |
| Single Male/Father | 28 (2.9%) | 4.14 |
| Single Female/Mother | 15 (1.5%) | 4.20 |
| Non-family | 213 (21.9%) | 1.33 |
| Total Households | 973 (100.0%) | 2.38 |
Household Size by Marriage Status in Kure Beach
Out of a total of 973 households in Kure Beach, 760 (78.1%) are family households, while 213 (21.9%) are nonfamily households. The most numerous type of family households are 2-person households, comprising 499, and the most common type of nonfamily households are 1-person households, comprising 149.
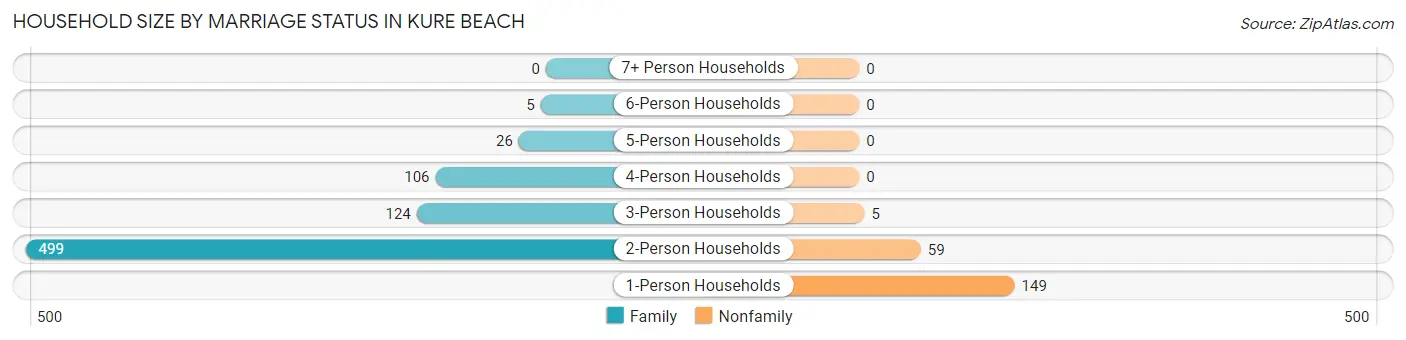
| Household Size | Family Households | Nonfamily Households |
| 1-Person Households | - | 149 (15.3%) |
| 2-Person Households | 499 (51.3%) | 59 (6.1%) |
| 3-Person Households | 124 (12.7%) | 5 (0.5%) |
| 4-Person Households | 106 (10.9%) | 0 (0.0%) |
| 5-Person Households | 26 (2.7%) | 0 (0.0%) |
| 6-Person Households | 5 (0.5%) | 0 (0.0%) |
| 7+ Person Households | 0 (0.0%) | 0 (0.0%) |
| Total | 760 (78.1%) | 213 (21.9%) |
Female Fertility in Kure Beach
Fertility by Age in Kure Beach
Average fertility rate in Kure Beach is 12.0 births per 1,000 women. Women in the age bracket of 35 to 50 years have the highest fertility rate with 22.0 births per 1,000 women. Women in the age bracket of 35 to 50 years acount for 100.0% of all women with births.
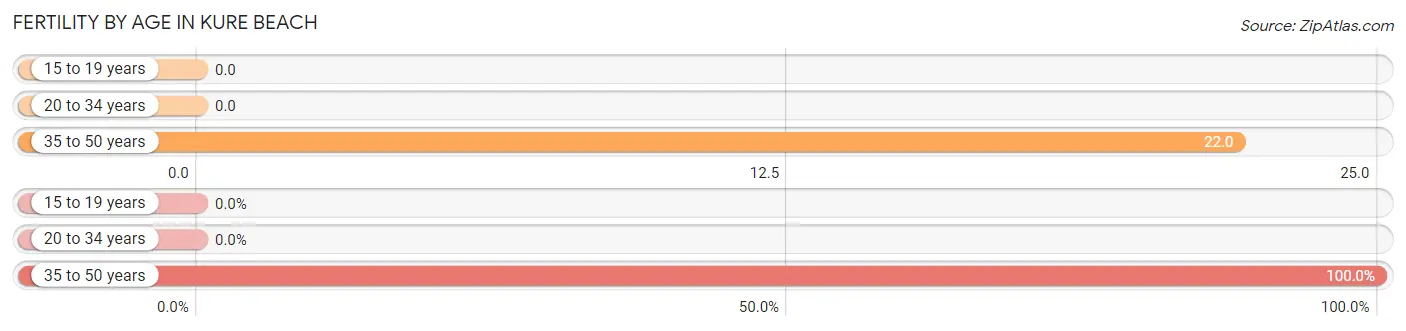
| Age Bracket | Women with Births | Births / 1,000 Women |
| 15 to 19 years | 0 (0.0%) | 0.0 |
| 20 to 34 years | 0 (0.0%) | 0.0 |
| 35 to 50 years | 5 (100.0%) | 22.0 |
| Total | 5 (100.0%) | 12.0 |
Fertility by Age by Marriage Status in Kure Beach
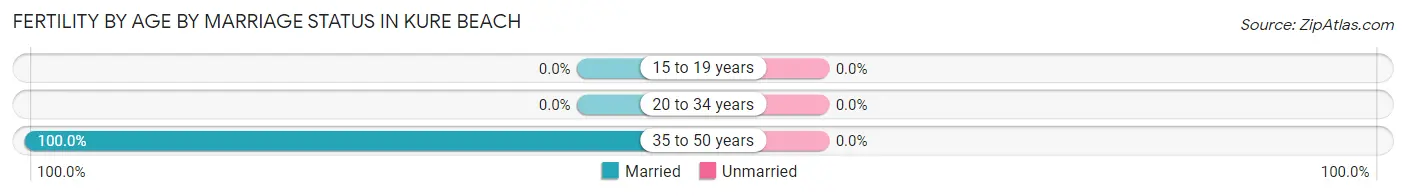
| Age Bracket | Married | Unmarried |
| 15 to 19 years | 0 (0.0%) | 0 (0.0%) |
| 20 to 34 years | 0 (0.0%) | 0 (0.0%) |
| 35 to 50 years | 5 (100.0%) | 0 (0.0%) |
| Total | 5 (100.0%) | 0 (0.0%) |
Fertility by Education in Kure Beach
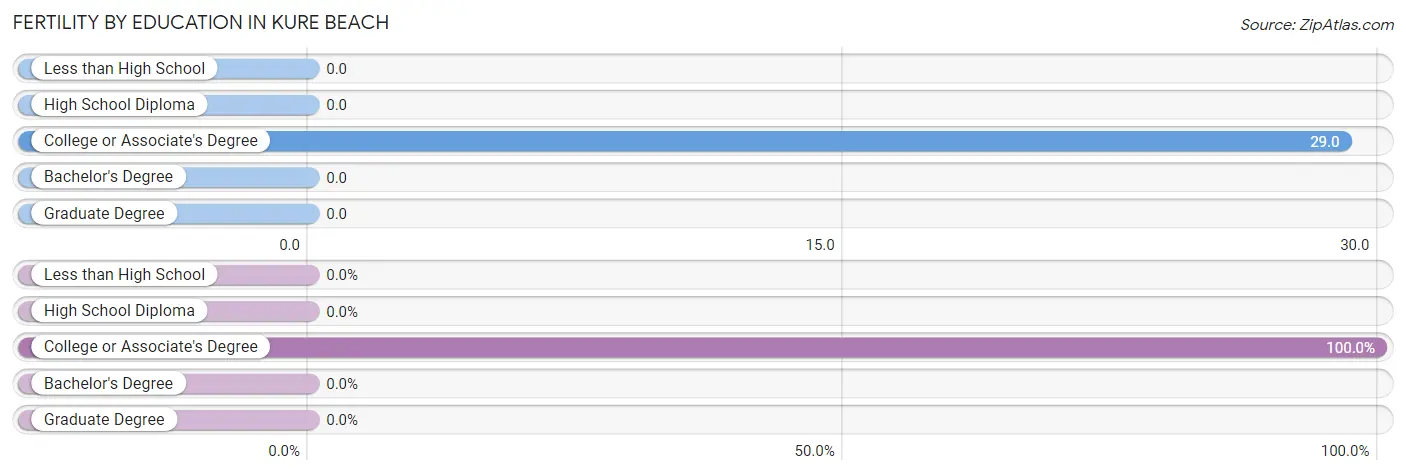
| Educational Attainment | Women with Births | Births / 1,000 Women |
| Less than High School | 0 (0.0%) | 0.0 |
| High School Diploma | 0 (0.0%) | 0.0 |
| College or Associate's Degree | 5 (100.0%) | 29.0 |
| Bachelor's Degree | 0 (0.0%) | 0.0 |
| Graduate Degree | 0 (0.0%) | 0.0 |
| Total | 5 (100.0%) | 12.0 |
Fertility by Education by Marriage Status in Kure Beach
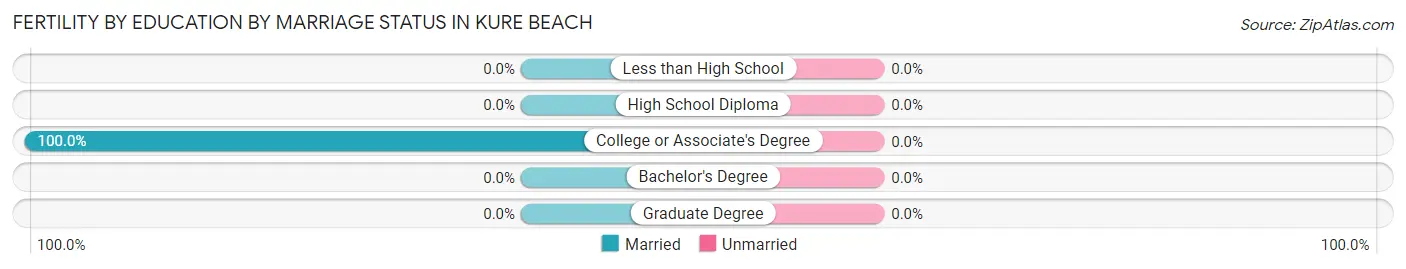
| Educational Attainment | Married | Unmarried |
| Less than High School | 0 (0.0%) | 0 (0.0%) |
| High School Diploma | 0 (0.0%) | 0 (0.0%) |
| College or Associate's Degree | 5 (100.0%) | 0 (0.0%) |
| Bachelor's Degree | 0 (0.0%) | 0 (0.0%) |
| Graduate Degree | 0 (0.0%) | 0 (0.0%) |
| Total | 5 (100.0%) | 0 (0.0%) |
Employment Characteristics in Kure Beach
Employment by Class of Employer in Kure Beach
Among the 1,133 employed individuals in Kure Beach, private company employees (684 | 60.4%), self-employed (not incorporated) (171 | 15.1%), and local government employees (84 | 7.4%) make up the most common classes of employment.
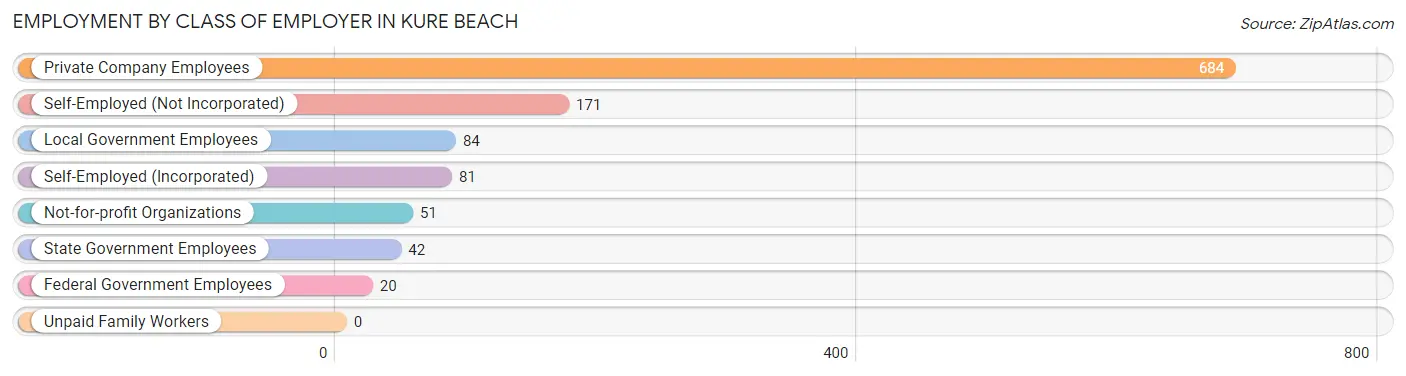
| Employer Class | # Employees | % Employees |
| Private Company Employees | 684 | 60.4% |
| Self-Employed (Incorporated) | 81 | 7.1% |
| Self-Employed (Not Incorporated) | 171 | 15.1% |
| Not-for-profit Organizations | 51 | 4.5% |
| Local Government Employees | 84 | 7.4% |
| State Government Employees | 42 | 3.7% |
| Federal Government Employees | 20 | 1.8% |
| Unpaid Family Workers | 0 | 0.0% |
| Total | 1,133 | 100.0% |
Employment Status by Age in Kure Beach
According to the labor force statistics for Kure Beach, out of the total population over 16 years of age (2,088), 60.0% or 1,253 individuals are in the labor force, with 1.2% or 15 of them unemployed. The age group with the highest labor force participation rate is 25 to 29 years, with 100.0% or 20 individuals in the labor force. Within the labor force, the 25 to 29 years age range has the highest percentage of unemployed individuals, with 35.0% or 7 of them being unemployed.
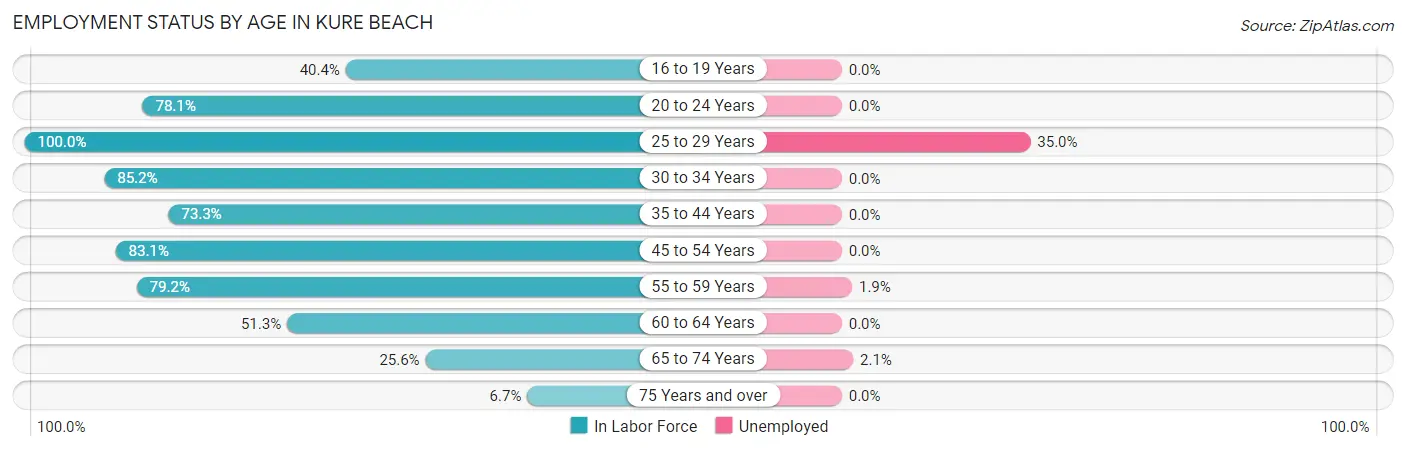
| Age Bracket | In Labor Force | Unemployed |
| 16 to 19 Years | 36 (40.4%) | 0 (0.0%) |
| 20 to 24 Years | 50 (78.1%) | 0 (0.0%) |
| 25 to 29 Years | 20 (100.0%) | 7 (35.0%) |
| 30 to 34 Years | 121 (85.2%) | 0 (0.0%) |
| 35 to 44 Years | 137 (73.3%) | 0 (0.0%) |
| 45 to 54 Years | 353 (83.1%) | 0 (0.0%) |
| 55 to 59 Years | 312 (79.2%) | 6 (1.9%) |
| 60 to 64 Years | 117 (51.3%) | 0 (0.0%) |
| 65 to 74 Years | 96 (25.6%) | 2 (2.1%) |
| 75 Years and over | 11 (6.7%) | 0 (0.0%) |
| Total | 1,253 (60.0%) | 15 (1.2%) |
Employment Status by Educational Attainment in Kure Beach
According to labor force statistics for Kure Beach, 75.9% of individuals (1,060) out of the total population between 25 and 64 years of age (1,396) are in the labor force, with 1.2% or 13 of them being unemployed. The group with the highest labor force participation rate are those with the educational attainment of less than high school, with 100.0% or 39 individuals in the labor force. Within the labor force, individuals with college / associate degree education have the highest percentage of unemployment, with 2.4% or 7 of them being unemployed.
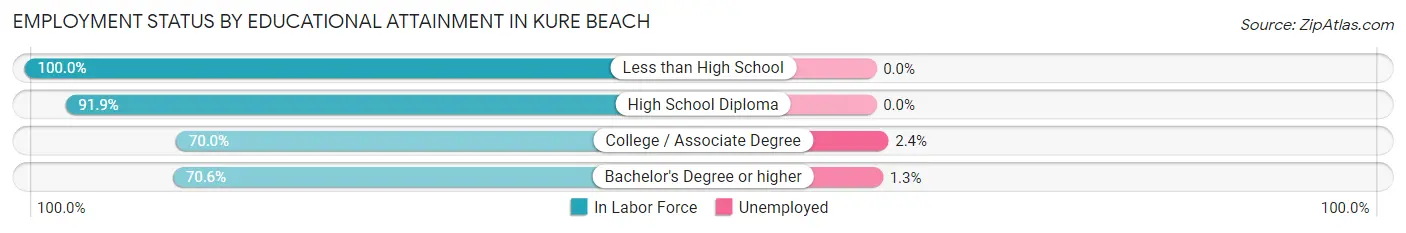
| Educational Attainment | In Labor Force | Unemployed |
| Less than High School | 39 (100.0%) | 0 (0.0%) |
| High School Diploma | 283 (91.9%) | 0 (0.0%) |
| College / Associate Degree | 291 (70.0%) | 10 (2.4%) |
| Bachelor's Degree or higher | 447 (70.6%) | 8 (1.3%) |
| Total | 1,060 (75.9%) | 17 (1.2%) |
Employment Occupations by Sex in Kure Beach
Management, Business, Science and Arts Occupations
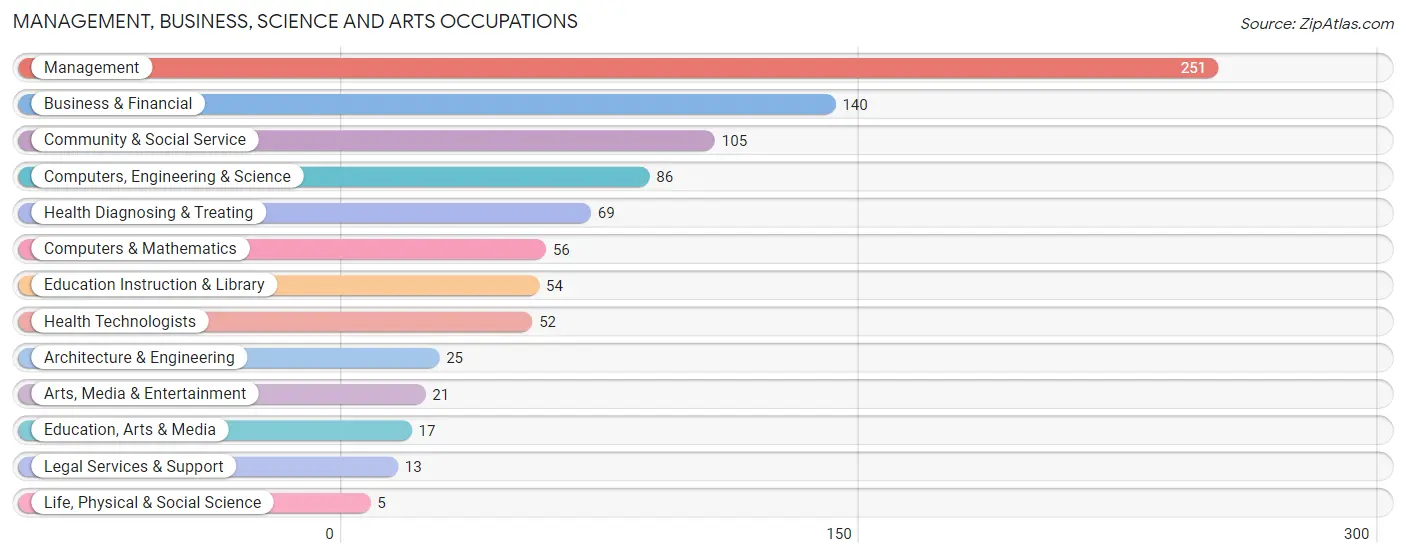
The most common Management, Business, Science and Arts occupations in Kure Beach are Management (251 | 20.3%), Business & Financial (140 | 11.3%), Community & Social Service (105 | 8.5%), Computers, Engineering & Science (86 | 7.0%), and Health Diagnosing & Treating (69 | 5.6%).
Management, Business, Science and Arts Occupations by Sex
Within the Management, Business, Science and Arts occupations in Kure Beach, the most male-oriented occupations are Architecture & Engineering (100.0%), Management (94.4%), and Computers & Mathematics (92.9%), while the most female-oriented occupations are Life, Physical & Social Science (100.0%), Education, Arts & Media (100.0%), and Legal Services & Support (100.0%).
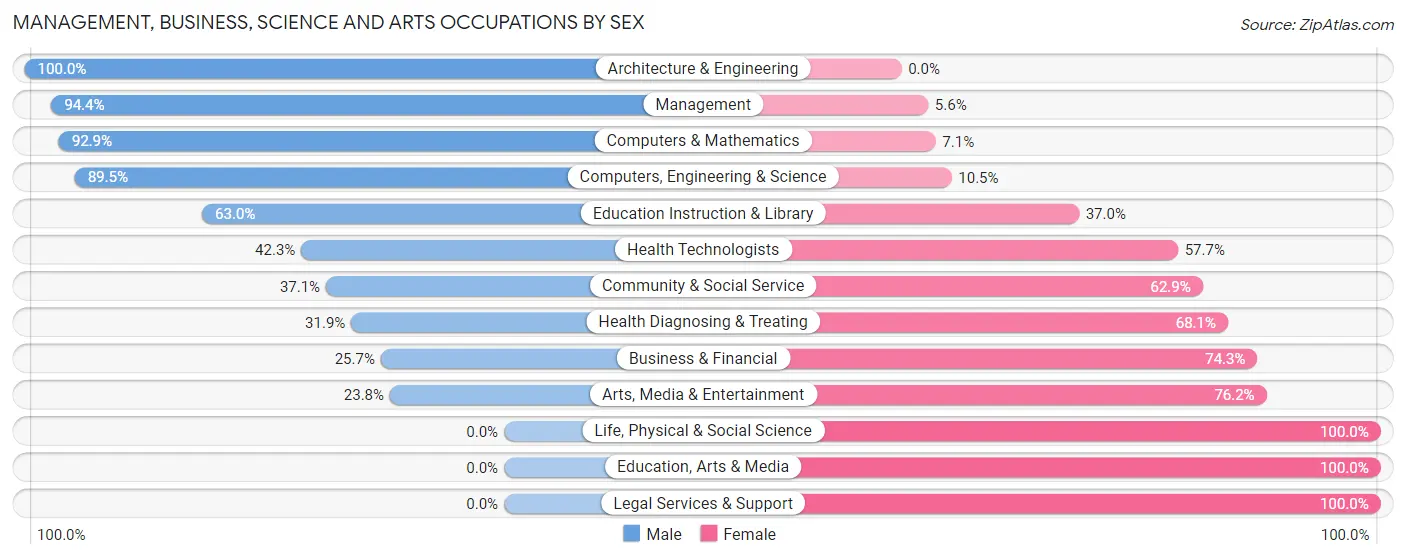
| Occupation | Male | Female |
| Management | 237 (94.4%) | 14 (5.6%) |
| Business & Financial | 36 (25.7%) | 104 (74.3%) |
| Computers, Engineering & Science | 77 (89.5%) | 9 (10.5%) |
| Computers & Mathematics | 52 (92.9%) | 4 (7.1%) |
| Architecture & Engineering | 25 (100.0%) | 0 (0.0%) |
| Life, Physical & Social Science | 0 (0.0%) | 5 (100.0%) |
| Community & Social Service | 39 (37.1%) | 66 (62.9%) |
| Education, Arts & Media | 0 (0.0%) | 17 (100.0%) |
| Legal Services & Support | 0 (0.0%) | 13 (100.0%) |
| Education Instruction & Library | 34 (63.0%) | 20 (37.0%) |
| Arts, Media & Entertainment | 5 (23.8%) | 16 (76.2%) |
| Health Diagnosing & Treating | 22 (31.9%) | 47 (68.1%) |
| Health Technologists | 22 (42.3%) | 30 (57.7%) |
| Total (Category) | 411 (63.1%) | 240 (36.9%) |
| Total (Overall) | 647 (52.3%) | 591 (47.7%) |
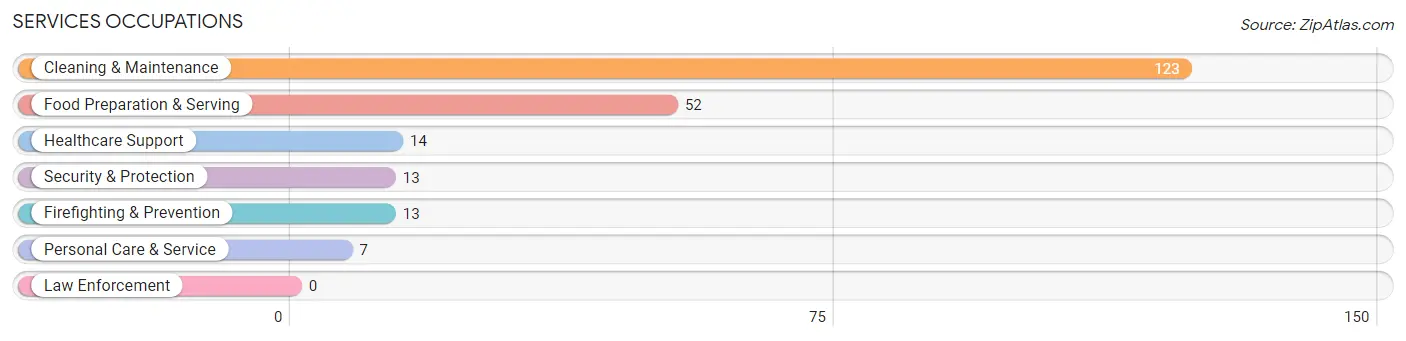
Services Occupations
The most common Services occupations in Kure Beach are Cleaning & Maintenance (123 | 9.9%), Food Preparation & Serving (52 | 4.2%), Healthcare Support (14 | 1.1%), Security & Protection (13 | 1.1%), and Firefighting & Prevention (13 | 1.1%).
Services Occupations by Sex
Within the Services occupations in Kure Beach, the most male-oriented occupations are Security & Protection (100.0%), Firefighting & Prevention (100.0%), and Food Preparation & Serving (53.8%), while the most female-oriented occupations are Healthcare Support (100.0%), Personal Care & Service (100.0%), and Cleaning & Maintenance (82.9%).
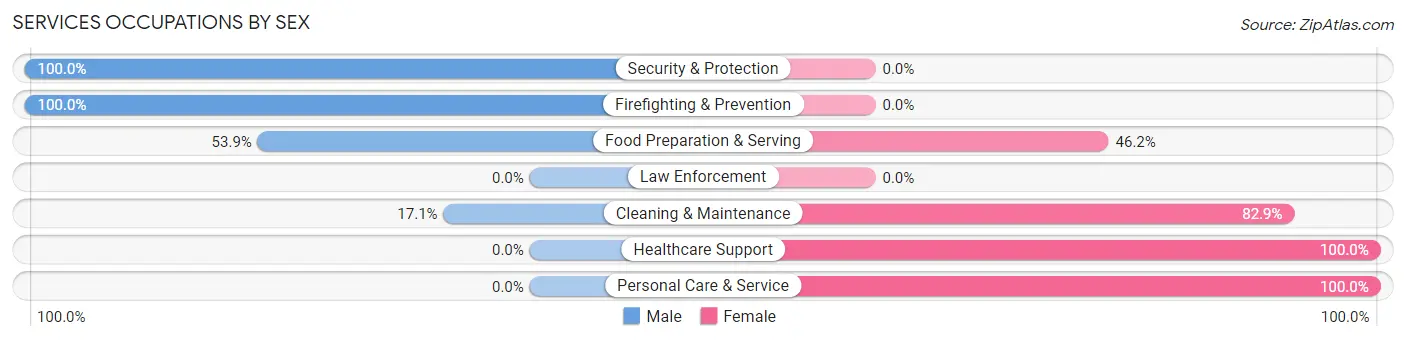
| Occupation | Male | Female |
| Healthcare Support | 0 (0.0%) | 14 (100.0%) |
| Security & Protection | 13 (100.0%) | 0 (0.0%) |
| Firefighting & Prevention | 13 (100.0%) | 0 (0.0%) |
| Law Enforcement | 0 (0.0%) | 0 (0.0%) |
| Food Preparation & Serving | 28 (53.8%) | 24 (46.2%) |
| Cleaning & Maintenance | 21 (17.1%) | 102 (82.9%) |
| Personal Care & Service | 0 (0.0%) | 7 (100.0%) |
| Total (Category) | 62 (29.7%) | 147 (70.3%) |
| Total (Overall) | 647 (52.3%) | 591 (47.7%) |
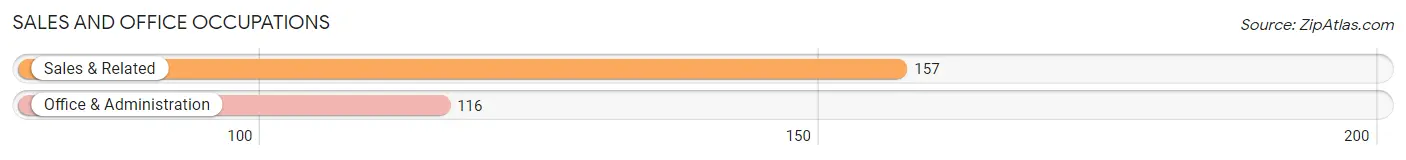
Sales and Office Occupations
The most common Sales and Office occupations in Kure Beach are Sales & Related (157 | 12.7%), and Office & Administration (116 | 9.4%).
Sales and Office Occupations by Sex
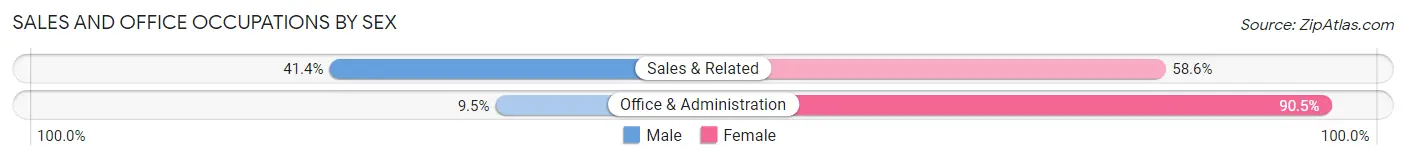
| Occupation | Male | Female |
| Sales & Related | 65 (41.4%) | 92 (58.6%) |
| Office & Administration | 11 (9.5%) | 105 (90.5%) |
| Total (Category) | 76 (27.8%) | 197 (72.2%) |
| Total (Overall) | 647 (52.3%) | 591 (47.7%) |
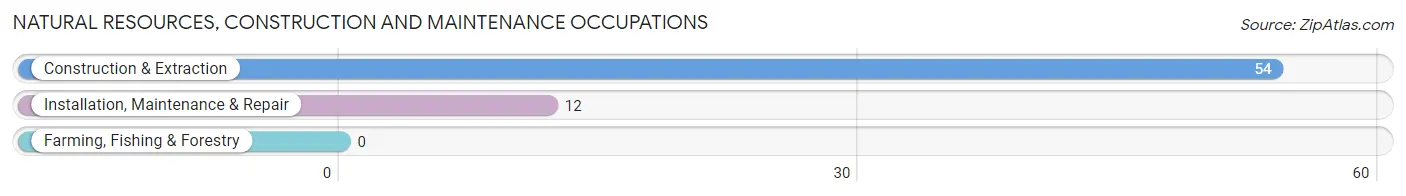
Natural Resources, Construction and Maintenance Occupations
The most common Natural Resources, Construction and Maintenance occupations in Kure Beach are Construction & Extraction (54 | 4.4%), and Installation, Maintenance & Repair (12 | 1.0%).
Natural Resources, Construction and Maintenance Occupations by Sex
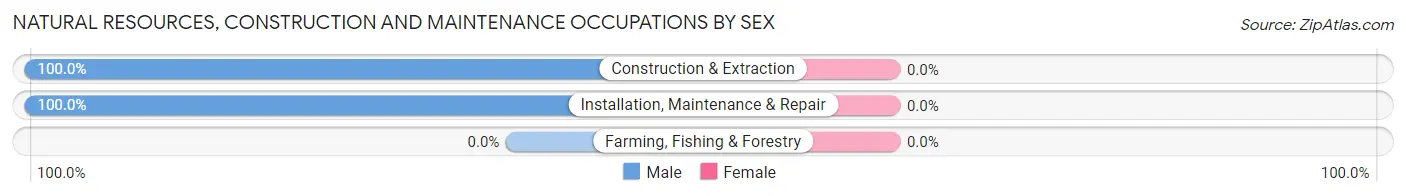
| Occupation | Male | Female |
| Farming, Fishing & Forestry | 0 (0.0%) | 0 (0.0%) |
| Construction & Extraction | 54 (100.0%) | 0 (0.0%) |
| Installation, Maintenance & Repair | 12 (100.0%) | 0 (0.0%) |
| Total (Category) | 66 (100.0%) | 0 (0.0%) |
| Total (Overall) | 647 (52.3%) | 591 (47.7%) |
Production, Transportation and Moving Occupations
The most common Production, Transportation and Moving occupations in Kure Beach are Production (20 | 1.6%), Material Moving (13 | 1.1%), and Transportation (6 | 0.5%).
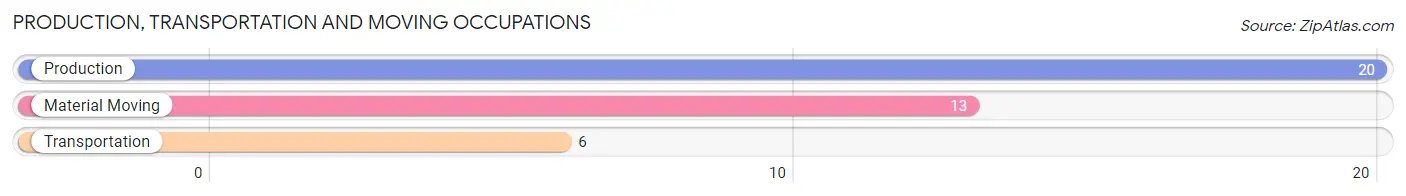
Production, Transportation and Moving Occupations by Sex
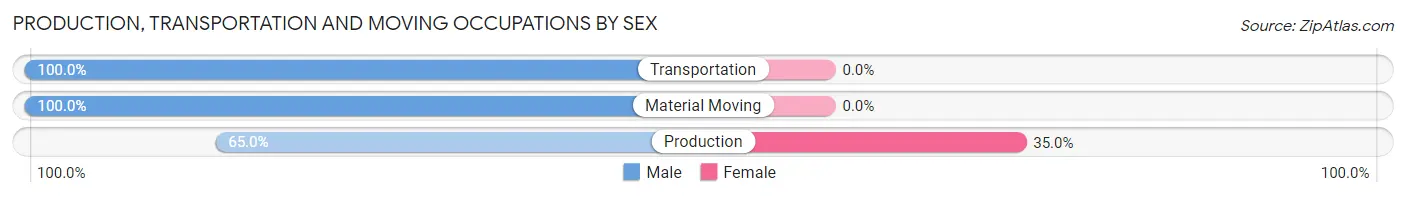
| Occupation | Male | Female |
| Production | 13 (65.0%) | 7 (35.0%) |
| Transportation | 6 (100.0%) | 0 (0.0%) |
| Material Moving | 13 (100.0%) | 0 (0.0%) |
| Total (Category) | 32 (82.1%) | 7 (17.9%) |
| Total (Overall) | 647 (52.3%) | 591 (47.7%) |
Employment Industries by Sex in Kure Beach
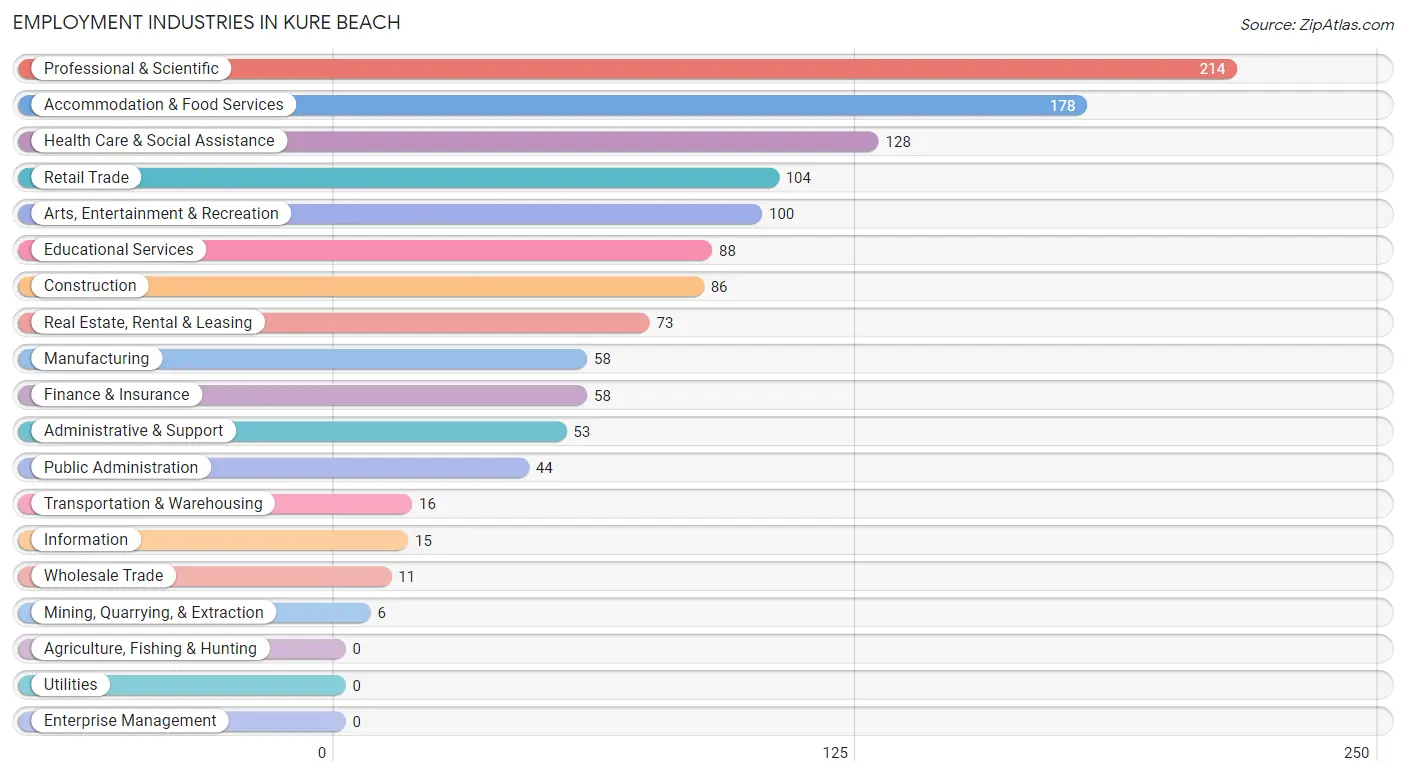
Employment Industries in Kure Beach
The major employment industries in Kure Beach include Professional & Scientific (214 | 17.3%), Accommodation & Food Services (178 | 14.4%), Health Care & Social Assistance (128 | 10.3%), Retail Trade (104 | 8.4%), and Arts, Entertainment & Recreation (100 | 8.1%).
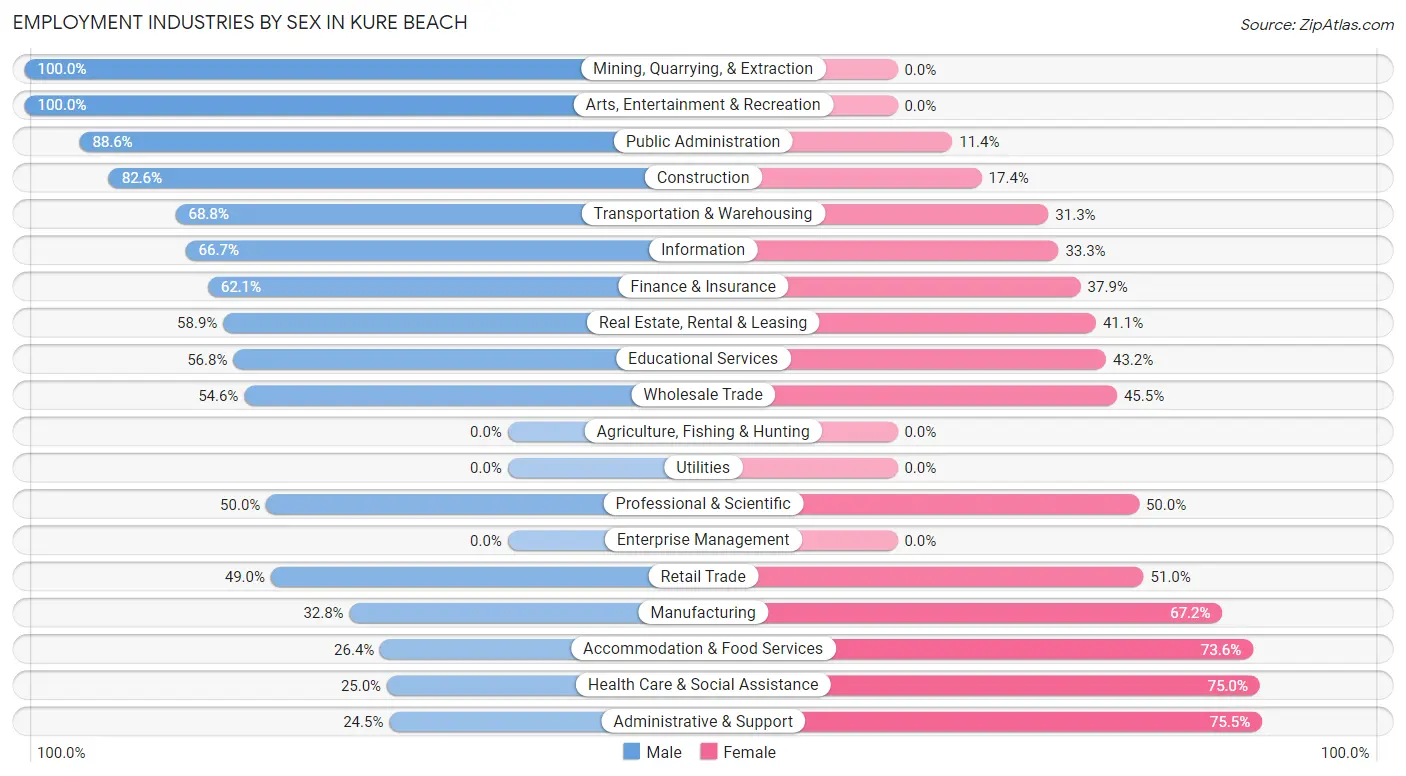
Employment Industries by Sex in Kure Beach
The Kure Beach industries that see more men than women are Mining, Quarrying, & Extraction (100.0%), Arts, Entertainment & Recreation (100.0%), and Public Administration (88.6%), whereas the industries that tend to have a higher number of women are Administrative & Support (75.5%), Health Care & Social Assistance (75.0%), and Accommodation & Food Services (73.6%).
| Industry | Male | Female |
| Agriculture, Fishing & Hunting | 0 (0.0%) | 0 (0.0%) |
| Mining, Quarrying, & Extraction | 6 (100.0%) | 0 (0.0%) |
| Construction | 71 (82.6%) | 15 (17.4%) |
| Manufacturing | 19 (32.8%) | 39 (67.2%) |
| Wholesale Trade | 6 (54.5%) | 5 (45.5%) |
| Retail Trade | 51 (49.0%) | 53 (51.0%) |
| Transportation & Warehousing | 11 (68.8%) | 5 (31.2%) |
| Utilities | 0 (0.0%) | 0 (0.0%) |
| Information | 10 (66.7%) | 5 (33.3%) |
| Finance & Insurance | 36 (62.1%) | 22 (37.9%) |
| Real Estate, Rental & Leasing | 43 (58.9%) | 30 (41.1%) |
| Professional & Scientific | 107 (50.0%) | 107 (50.0%) |
| Enterprise Management | 0 (0.0%) | 0 (0.0%) |
| Administrative & Support | 13 (24.5%) | 40 (75.5%) |
| Educational Services | 50 (56.8%) | 38 (43.2%) |
| Health Care & Social Assistance | 32 (25.0%) | 96 (75.0%) |
| Arts, Entertainment & Recreation | 100 (100.0%) | 0 (0.0%) |
| Accommodation & Food Services | 47 (26.4%) | 131 (73.6%) |
| Public Administration | 39 (88.6%) | 5 (11.4%) |
| Total | 647 (52.3%) | 591 (47.7%) |
Education in Kure Beach
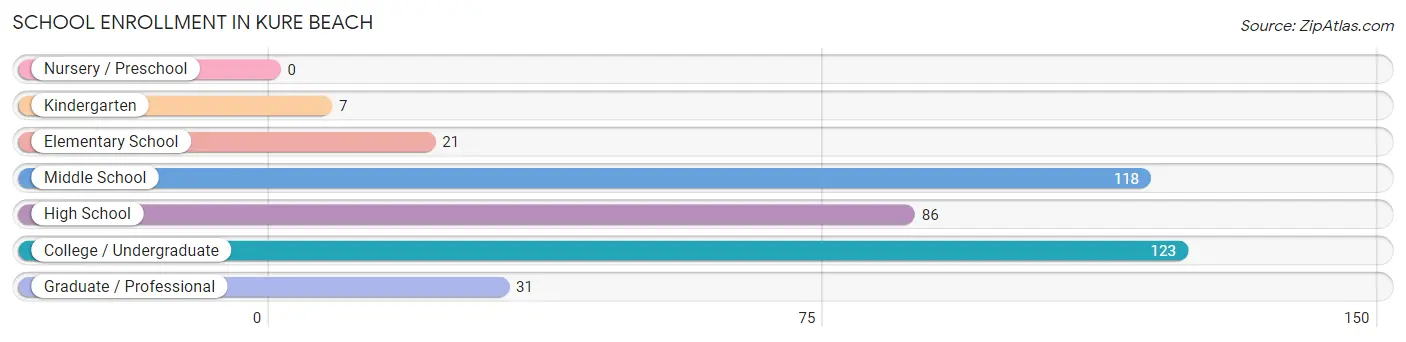
School Enrollment in Kure Beach
The most common levels of schooling among the 386 students in Kure Beach are college / undergraduate (123 | 31.9%), middle school (118 | 30.6%), and high school (86 | 22.3%).
| School Level | # Students | % Students |
| Nursery / Preschool | 0 | 0.0% |
| Kindergarten | 7 | 1.8% |
| Elementary School | 21 | 5.4% |
| Middle School | 118 | 30.6% |
| High School | 86 | 22.3% |
| College / Undergraduate | 123 | 31.9% |
| Graduate / Professional | 31 | 8.0% |
| Total | 386 | 100.0% |
School Enrollment by Age by Funding Source in Kure Beach
Out of a total of 386 students who are enrolled in schools in Kure Beach, 117 (30.3%) attend a private institution, while the remaining 269 (69.7%) are enrolled in public schools. The age group of 25 to 34 year olds has the highest likelihood of being enrolled in private schools, with 5 (100.0% in the age bracket) enrolled. Conversely, the age group of 5 to 9 year old has the lowest likelihood of being enrolled in a private school, with 21 (100.0% in the age bracket) attending a public institution.
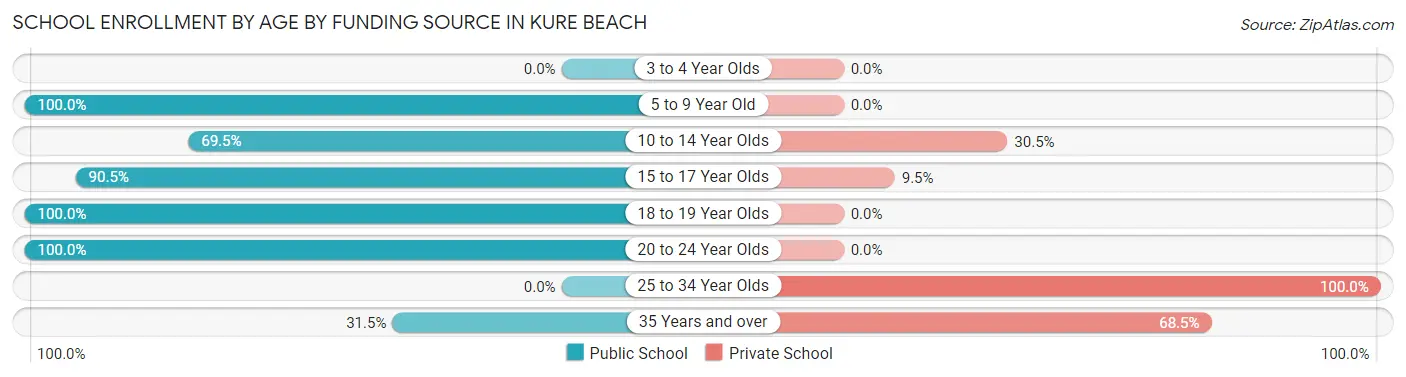
| Age Bracket | Public School | Private School |
| 3 to 4 Year Olds | 0 (0.0%) | 0 (0.0%) |
| 5 to 9 Year Old | 21 (100.0%) | 0 (0.0%) |
| 10 to 14 Year Olds | 98 (69.5%) | 43 (30.5%) |
| 15 to 17 Year Olds | 57 (90.5%) | 6 (9.5%) |
| 18 to 19 Year Olds | 39 (100.0%) | 0 (0.0%) |
| 20 to 24 Year Olds | 25 (100.0%) | 0 (0.0%) |
| 25 to 34 Year Olds | 0 (0.0%) | 5 (100.0%) |
| 35 Years and over | 29 (31.5%) | 63 (68.5%) |
| Total | 269 (69.7%) | 117 (30.3%) |
Educational Attainment by Field of Study in Kure Beach
Business (285 | 28.1%), science & technology (123 | 12.1%), education (112 | 11.1%), social sciences (85 | 8.4%), and psychology (80 | 7.9%) are the most common fields of study among 1,014 individuals in Kure Beach who have obtained a bachelor's degree or higher.
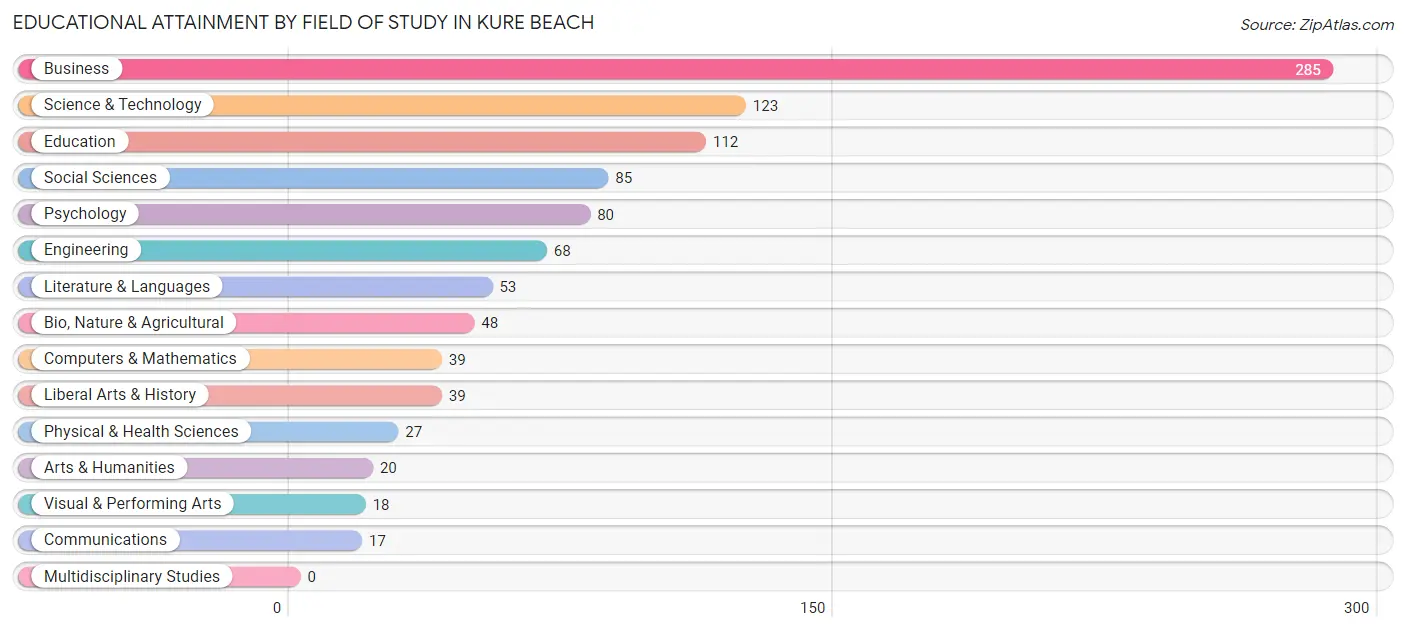
| Field of Study | # Graduates | % Graduates |
| Computers & Mathematics | 39 | 3.8% |
| Bio, Nature & Agricultural | 48 | 4.7% |
| Physical & Health Sciences | 27 | 2.7% |
| Psychology | 80 | 7.9% |
| Social Sciences | 85 | 8.4% |
| Engineering | 68 | 6.7% |
| Multidisciplinary Studies | 0 | 0.0% |
| Science & Technology | 123 | 12.1% |
| Business | 285 | 28.1% |
| Education | 112 | 11.1% |
| Literature & Languages | 53 | 5.2% |
| Liberal Arts & History | 39 | 3.8% |
| Visual & Performing Arts | 18 | 1.8% |
| Communications | 17 | 1.7% |
| Arts & Humanities | 20 | 2.0% |
| Total | 1,014 | 100.0% |
Transportation & Commute in Kure Beach
Vehicle Availability by Sex in Kure Beach
The most prevalent vehicle ownership categories in Kure Beach are males with 2 vehicles (322, accounting for 50.2%) and females with 2 vehicles (230, making up 65.4%).
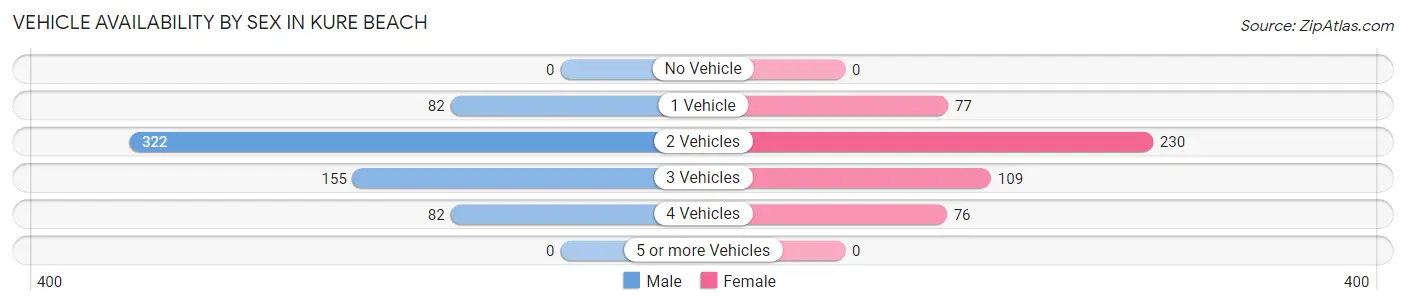
| Vehicles Available | Male | Female |
| No Vehicle | 0 (0.0%) | 0 (0.0%) |
| 1 Vehicle | 82 (12.8%) | 77 (15.7%) |
| 2 Vehicles | 322 (50.2%) | 230 (46.8%) |
| 3 Vehicles | 155 (24.2%) | 109 (22.2%) |
| 4 Vehicles | 82 (12.8%) | 76 (15.4%) |
| 5 or more Vehicles | 0 (0.0%) | 0 (0.0%) |
| Total | 641 (100.0%) | 492 (100.0%) |
Commute Time in Kure Beach
The most frequently occuring commute durations in Kure Beach are 20 to 24 minutes (213 commuters, 26.7%), 30 to 34 minutes (92 commuters, 11.5%), and less than 5 minutes (89 commuters, 11.2%).
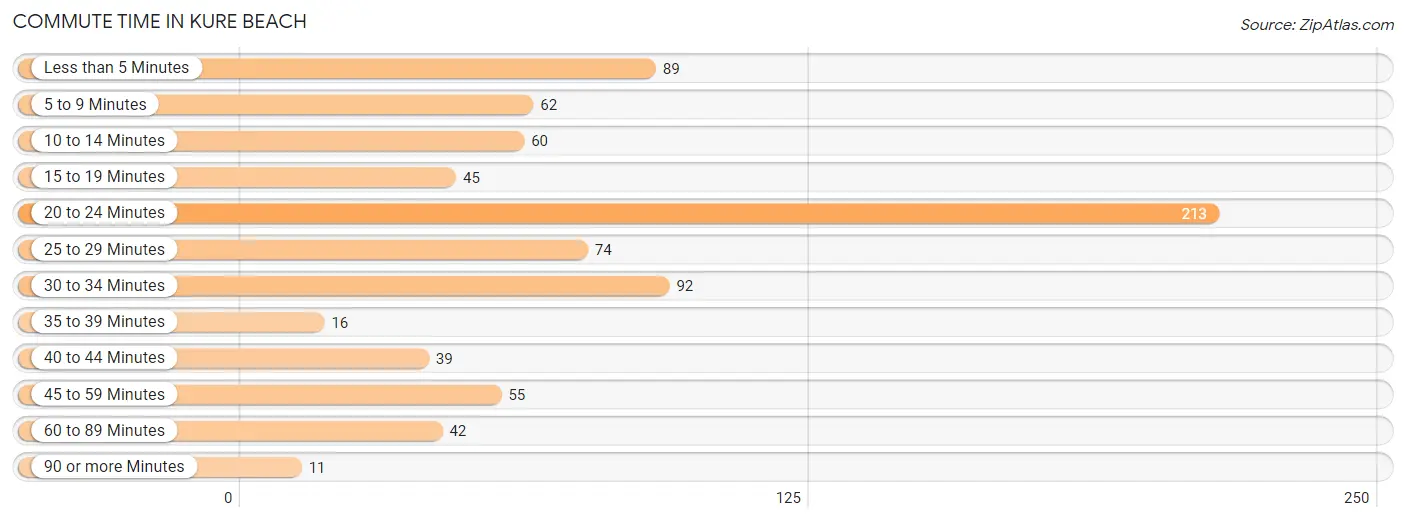
| Commute Time | # Commuters | % Commuters |
| Less than 5 Minutes | 89 | 11.2% |
| 5 to 9 Minutes | 62 | 7.8% |
| 10 to 14 Minutes | 60 | 7.5% |
| 15 to 19 Minutes | 45 | 5.6% |
| 20 to 24 Minutes | 213 | 26.7% |
| 25 to 29 Minutes | 74 | 9.3% |
| 30 to 34 Minutes | 92 | 11.5% |
| 35 to 39 Minutes | 16 | 2.0% |
| 40 to 44 Minutes | 39 | 4.9% |
| 45 to 59 Minutes | 55 | 6.9% |
| 60 to 89 Minutes | 42 | 5.3% |
| 90 or more Minutes | 11 | 1.4% |
Commute Time by Sex in Kure Beach
The most common commute times in Kure Beach are 20 to 24 minutes (129 commuters, 25.3%) for males and 20 to 24 minutes (84 commuters, 29.2%) for females.
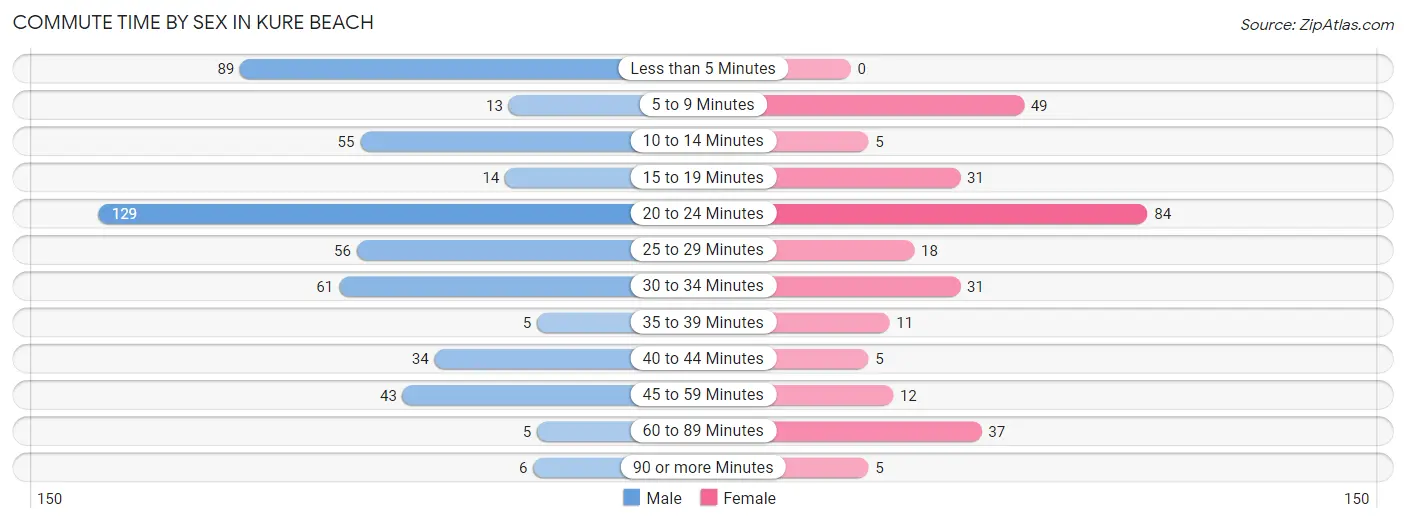
| Commute Time | Male | Female |
| Less than 5 Minutes | 89 (17.4%) | 0 (0.0%) |
| 5 to 9 Minutes | 13 (2.5%) | 49 (17.0%) |
| 10 to 14 Minutes | 55 (10.8%) | 5 (1.7%) |
| 15 to 19 Minutes | 14 (2.8%) | 31 (10.8%) |
| 20 to 24 Minutes | 129 (25.3%) | 84 (29.2%) |
| 25 to 29 Minutes | 56 (11.0%) | 18 (6.2%) |
| 30 to 34 Minutes | 61 (12.0%) | 31 (10.8%) |
| 35 to 39 Minutes | 5 (1.0%) | 11 (3.8%) |
| 40 to 44 Minutes | 34 (6.7%) | 5 (1.7%) |
| 45 to 59 Minutes | 43 (8.4%) | 12 (4.2%) |
| 60 to 89 Minutes | 5 (1.0%) | 37 (12.9%) |
| 90 or more Minutes | 6 (1.2%) | 5 (1.7%) |
Time of Departure to Work by Sex in Kure Beach
The most frequent times of departure to work in Kure Beach are 6:30 AM to 6:59 AM (119, 23.3%) for males and 7:00 AM to 7:29 AM (58, 20.1%) for females.
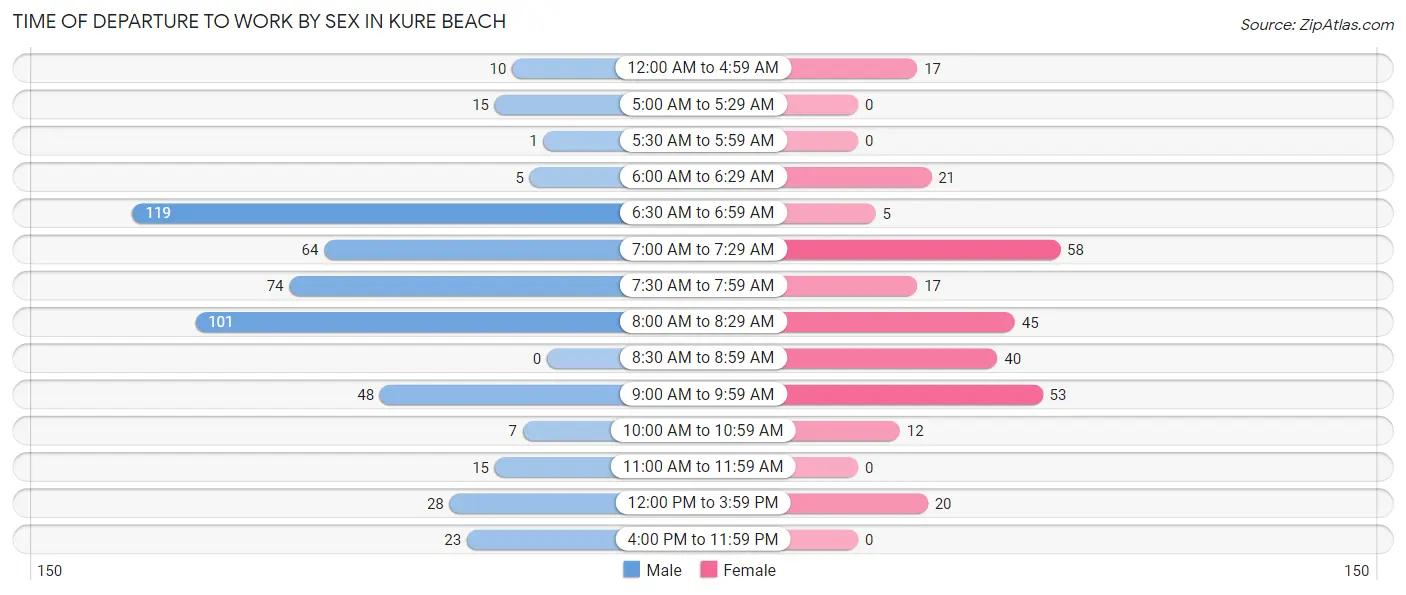
| Time of Departure | Male | Female |
| 12:00 AM to 4:59 AM | 10 (2.0%) | 17 (5.9%) |
| 5:00 AM to 5:29 AM | 15 (2.9%) | 0 (0.0%) |
| 5:30 AM to 5:59 AM | 1 (0.2%) | 0 (0.0%) |
| 6:00 AM to 6:29 AM | 5 (1.0%) | 21 (7.3%) |
| 6:30 AM to 6:59 AM | 119 (23.3%) | 5 (1.7%) |
| 7:00 AM to 7:29 AM | 64 (12.6%) | 58 (20.1%) |
| 7:30 AM to 7:59 AM | 74 (14.5%) | 17 (5.9%) |
| 8:00 AM to 8:29 AM | 101 (19.8%) | 45 (15.6%) |
| 8:30 AM to 8:59 AM | 0 (0.0%) | 40 (13.9%) |
| 9:00 AM to 9:59 AM | 48 (9.4%) | 53 (18.4%) |
| 10:00 AM to 10:59 AM | 7 (1.4%) | 12 (4.2%) |
| 11:00 AM to 11:59 AM | 15 (2.9%) | 0 (0.0%) |
| 12:00 PM to 3:59 PM | 28 (5.5%) | 20 (6.9%) |
| 4:00 PM to 11:59 PM | 23 (4.5%) | 0 (0.0%) |
| Total | 510 (100.0%) | 288 (100.0%) |
Housing Occupancy in Kure Beach
Occupancy by Ownership in Kure Beach
Of the total 973 dwellings in Kure Beach, owner-occupied units account for 697 (71.6%), while renter-occupied units make up 276 (28.4%).
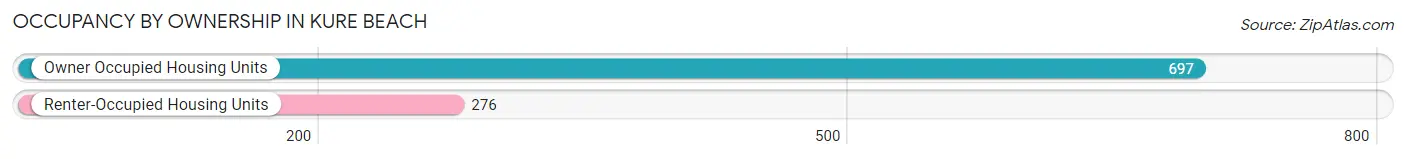
| Occupancy | # Housing Units | % Housing Units |
| Owner Occupied Housing Units | 697 | 71.6% |
| Renter-Occupied Housing Units | 276 | 28.4% |
| Total Occupied Housing Units | 973 | 100.0% |
Occupancy by Household Size in Kure Beach
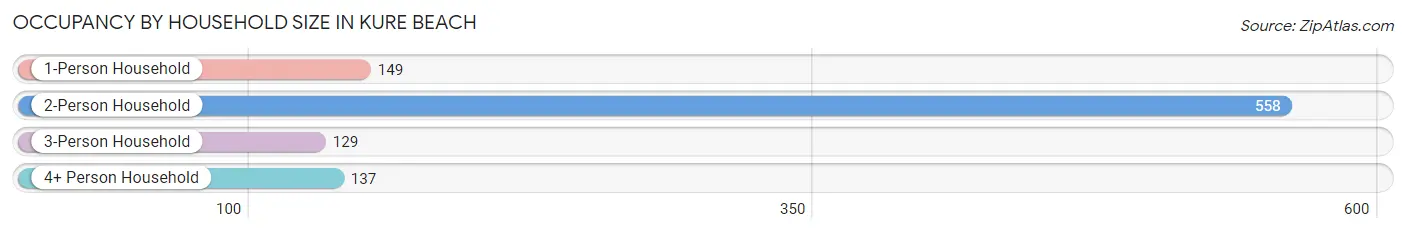
| Household Size | # Housing Units | % Housing Units |
| 1-Person Household | 149 | 15.3% |
| 2-Person Household | 558 | 57.4% |
| 3-Person Household | 129 | 13.3% |
| 4+ Person Household | 137 | 14.1% |
| Total Housing Units | 973 | 100.0% |
Occupancy by Ownership by Household Size in Kure Beach
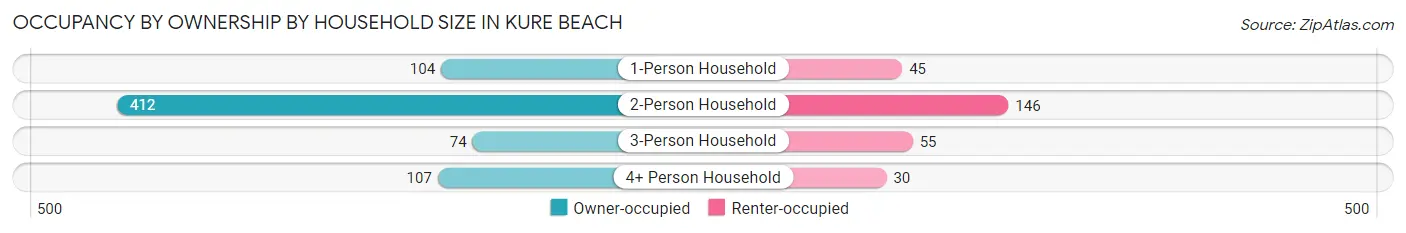
| Household Size | Owner-occupied | Renter-occupied |
| 1-Person Household | 104 (69.8%) | 45 (30.2%) |
| 2-Person Household | 412 (73.8%) | 146 (26.2%) |
| 3-Person Household | 74 (57.4%) | 55 (42.6%) |
| 4+ Person Household | 107 (78.1%) | 30 (21.9%) |
| Total Housing Units | 697 (71.6%) | 276 (28.4%) |
Occupancy by Educational Attainment in Kure Beach
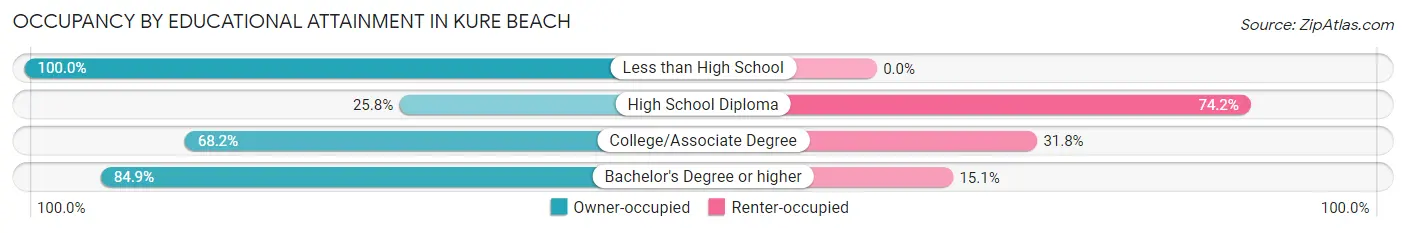
| Household Size | Owner-occupied | Renter-occupied |
| Less than High School | 21 (100.0%) | 0 (0.0%) |
| High School Diploma | 42 (25.8%) | 121 (74.2%) |
| College/Associate Degree | 146 (68.2%) | 68 (31.8%) |
| Bachelor's Degree or higher | 488 (84.9%) | 87 (15.1%) |
Occupancy by Age of Householder in Kure Beach
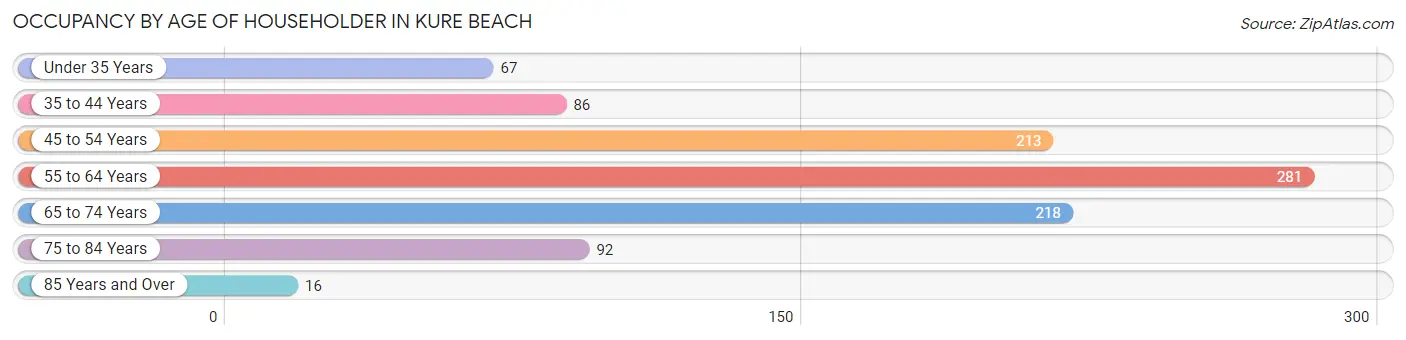
| Age Bracket | # Households | % Households |
| Under 35 Years | 67 | 6.9% |
| 35 to 44 Years | 86 | 8.8% |
| 45 to 54 Years | 213 | 21.9% |
| 55 to 64 Years | 281 | 28.9% |
| 65 to 74 Years | 218 | 22.4% |
| 75 to 84 Years | 92 | 9.5% |
| 85 Years and Over | 16 | 1.6% |
| Total | 973 | 100.0% |
Housing Finances in Kure Beach
Median Income by Occupancy in Kure Beach
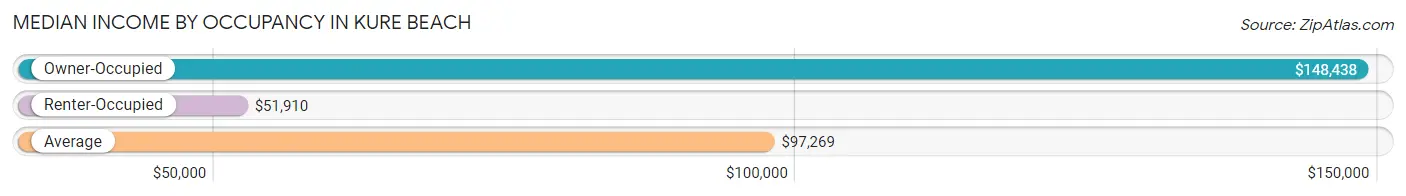
| Occupancy Type | # Households | Median Income |
| Owner-Occupied | 697 (71.6%) | $148,438 |
| Renter-Occupied | 276 (28.4%) | $51,910 |
| Average | 973 (100.0%) | $97,269 |
Occupancy by Householder Income Bracket in Kure Beach
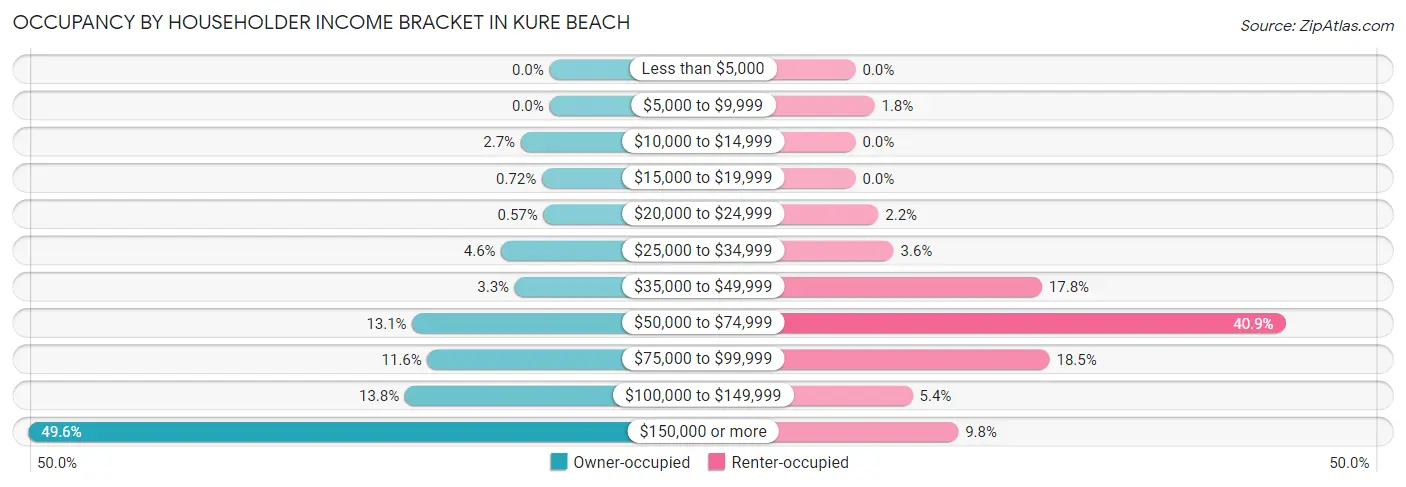
| Income Bracket | Owner-occupied | Renter-occupied |
| Less than $5,000 | 0 (0.0%) | 0 (0.0%) |
| $5,000 to $9,999 | 0 (0.0%) | 5 (1.8%) |
| $10,000 to $14,999 | 19 (2.7%) | 0 (0.0%) |
| $15,000 to $19,999 | 5 (0.7%) | 0 (0.0%) |
| $20,000 to $24,999 | 4 (0.6%) | 6 (2.2%) |
| $25,000 to $34,999 | 32 (4.6%) | 10 (3.6%) |
| $35,000 to $49,999 | 23 (3.3%) | 49 (17.7%) |
| $50,000 to $74,999 | 91 (13.1%) | 113 (40.9%) |
| $75,000 to $99,999 | 81 (11.6%) | 51 (18.5%) |
| $100,000 to $149,999 | 96 (13.8%) | 15 (5.4%) |
| $150,000 or more | 346 (49.6%) | 27 (9.8%) |
| Total | 697 (100.0%) | 276 (100.0%) |
Monthly Housing Cost Tiers in Kure Beach
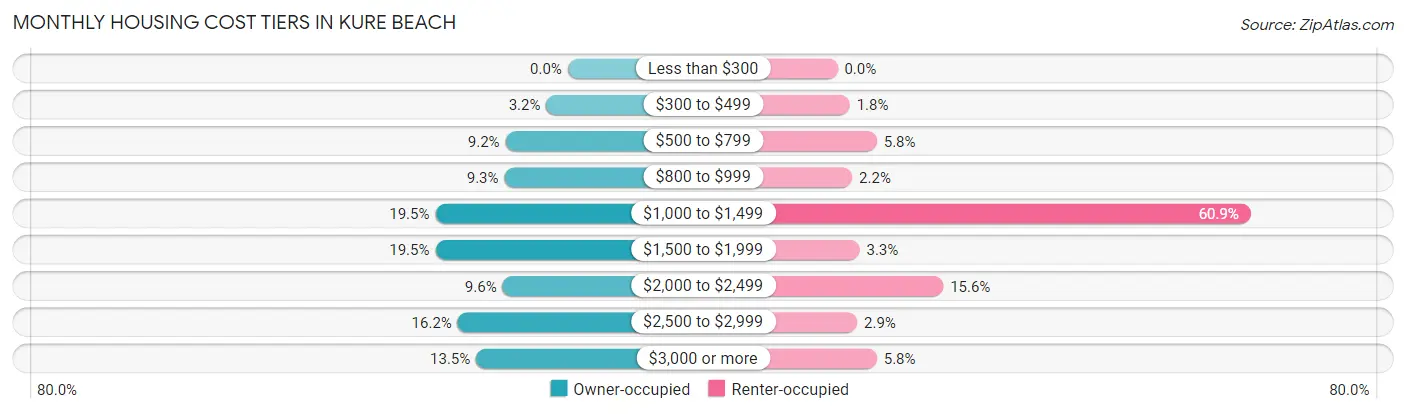
| Monthly Cost | Owner-occupied | Renter-occupied |
| Less than $300 | 0 (0.0%) | 0 (0.0%) |
| $300 to $499 | 22 (3.2%) | 5 (1.8%) |
| $500 to $799 | 64 (9.2%) | 16 (5.8%) |
| $800 to $999 | 65 (9.3%) | 6 (2.2%) |
| $1,000 to $1,499 | 136 (19.5%) | 168 (60.9%) |
| $1,500 to $1,999 | 136 (19.5%) | 9 (3.3%) |
| $2,000 to $2,499 | 67 (9.6%) | 43 (15.6%) |
| $2,500 to $2,999 | 113 (16.2%) | 8 (2.9%) |
| $3,000 or more | 94 (13.5%) | 16 (5.8%) |
| Total | 697 (100.0%) | 276 (100.0%) |
Physical Housing Characteristics in Kure Beach
Housing Structures in Kure Beach
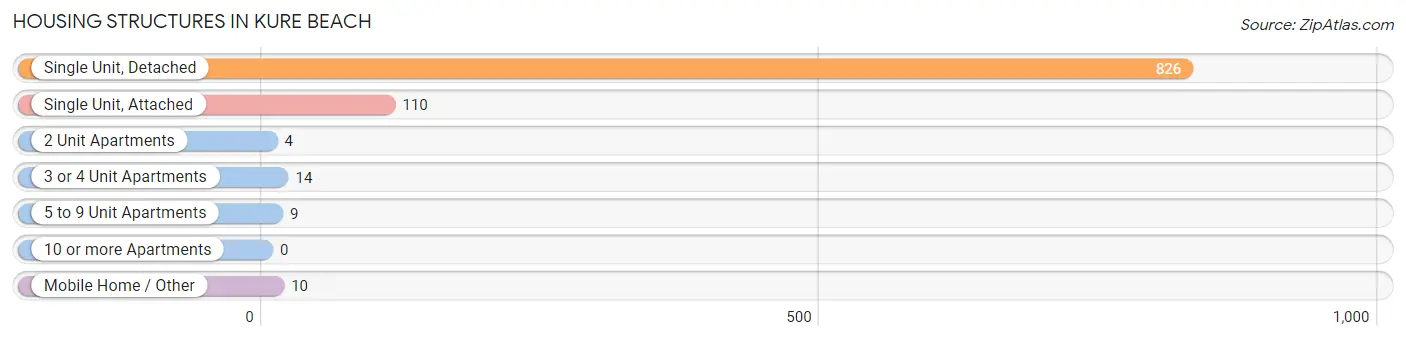
| Structure Type | # Housing Units | % Housing Units |
| Single Unit, Detached | 826 | 84.9% |
| Single Unit, Attached | 110 | 11.3% |
| 2 Unit Apartments | 4 | 0.4% |
| 3 or 4 Unit Apartments | 14 | 1.4% |
| 5 to 9 Unit Apartments | 9 | 0.9% |
| 10 or more Apartments | 0 | 0.0% |
| Mobile Home / Other | 10 | 1.0% |
| Total | 973 | 100.0% |
Housing Structures by Occupancy in Kure Beach
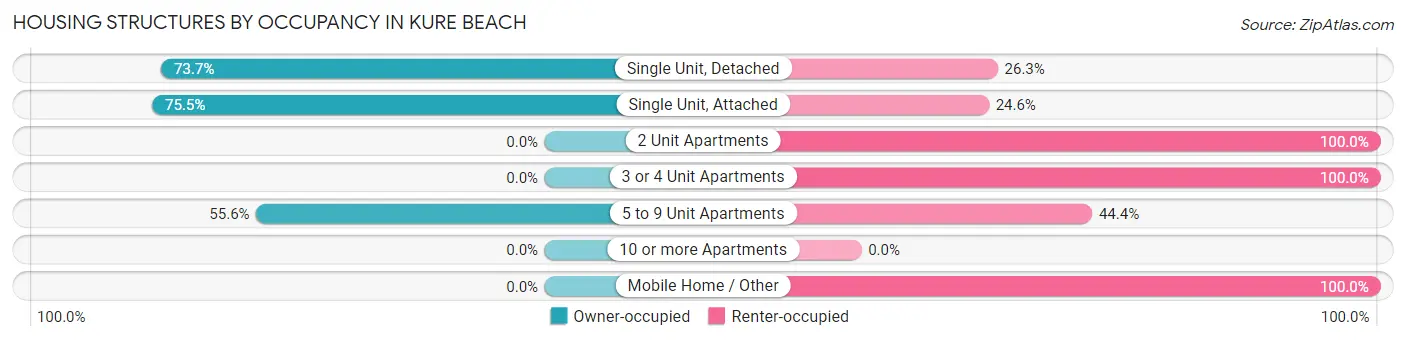
| Structure Type | Owner-occupied | Renter-occupied |
| Single Unit, Detached | 609 (73.7%) | 217 (26.3%) |
| Single Unit, Attached | 83 (75.4%) | 27 (24.5%) |
| 2 Unit Apartments | 0 (0.0%) | 4 (100.0%) |
| 3 or 4 Unit Apartments | 0 (0.0%) | 14 (100.0%) |
| 5 to 9 Unit Apartments | 5 (55.6%) | 4 (44.4%) |
| 10 or more Apartments | 0 (0.0%) | 0 (0.0%) |
| Mobile Home / Other | 0 (0.0%) | 10 (100.0%) |
| Total | 697 (71.6%) | 276 (28.4%) |
Housing Structures by Number of Rooms in Kure Beach
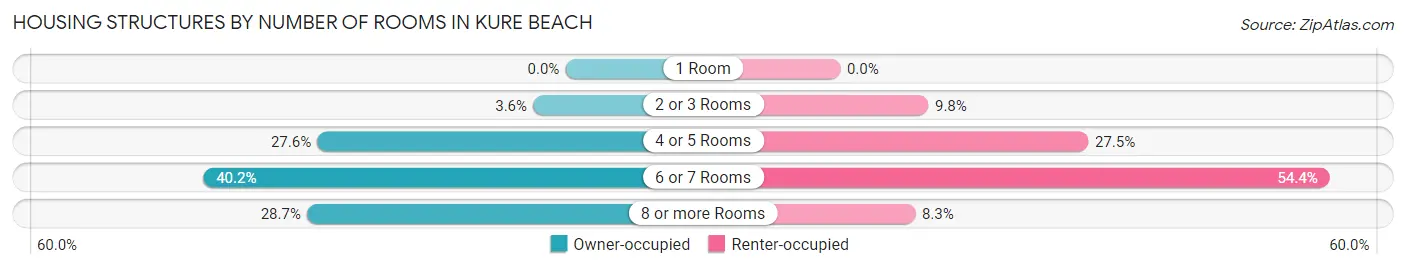
| Number of Rooms | Owner-occupied | Renter-occupied |
| 1 Room | 0 (0.0%) | 0 (0.0%) |
| 2 or 3 Rooms | 25 (3.6%) | 27 (9.8%) |
| 4 or 5 Rooms | 192 (27.6%) | 76 (27.5%) |
| 6 or 7 Rooms | 280 (40.2%) | 150 (54.3%) |
| 8 or more Rooms | 200 (28.7%) | 23 (8.3%) |
| Total | 697 (100.0%) | 276 (100.0%) |
Housing Structure by Heating Type in Kure Beach
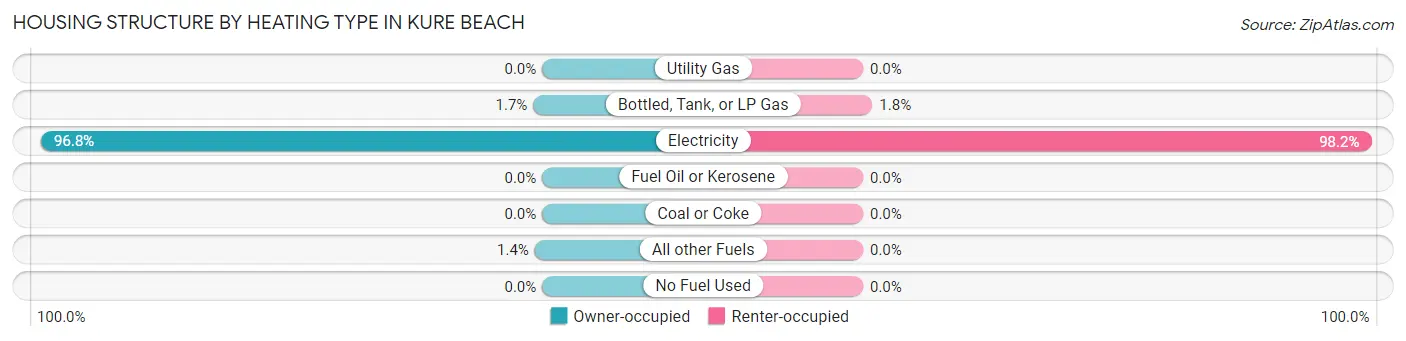
| Heating Type | Owner-occupied | Renter-occupied |
| Utility Gas | 0 (0.0%) | 0 (0.0%) |
| Bottled, Tank, or LP Gas | 12 (1.7%) | 5 (1.8%) |
| Electricity | 675 (96.8%) | 271 (98.2%) |
| Fuel Oil or Kerosene | 0 (0.0%) | 0 (0.0%) |
| Coal or Coke | 0 (0.0%) | 0 (0.0%) |
| All other Fuels | 10 (1.4%) | 0 (0.0%) |
| No Fuel Used | 0 (0.0%) | 0 (0.0%) |
| Total | 697 (100.0%) | 276 (100.0%) |
Household Vehicle Usage in Kure Beach
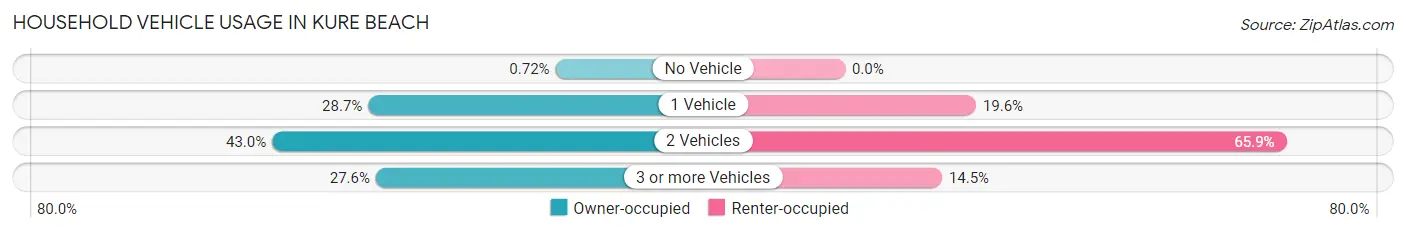
| Vehicles per Household | Owner-occupied | Renter-occupied |
| No Vehicle | 5 (0.7%) | 0 (0.0%) |
| 1 Vehicle | 200 (28.7%) | 54 (19.6%) |
| 2 Vehicles | 300 (43.0%) | 182 (65.9%) |
| 3 or more Vehicles | 192 (27.6%) | 40 (14.5%) |
| Total | 697 (100.0%) | 276 (100.0%) |
Real Estate & Mortgages in Kure Beach
Real Estate and Mortgage Overview in Kure Beach
| Characteristic | Without Mortgage | With Mortgage |
| Housing Units | 266 | 431 |
| Median Property Value | $614,000 | $521,600 |
| Median Household Income | $91,071 | $233 |
| Monthly Housing Costs | $965 | $88 |
| Real Estate Taxes | $4,142 | $0 |
Property Value by Mortgage Status in Kure Beach
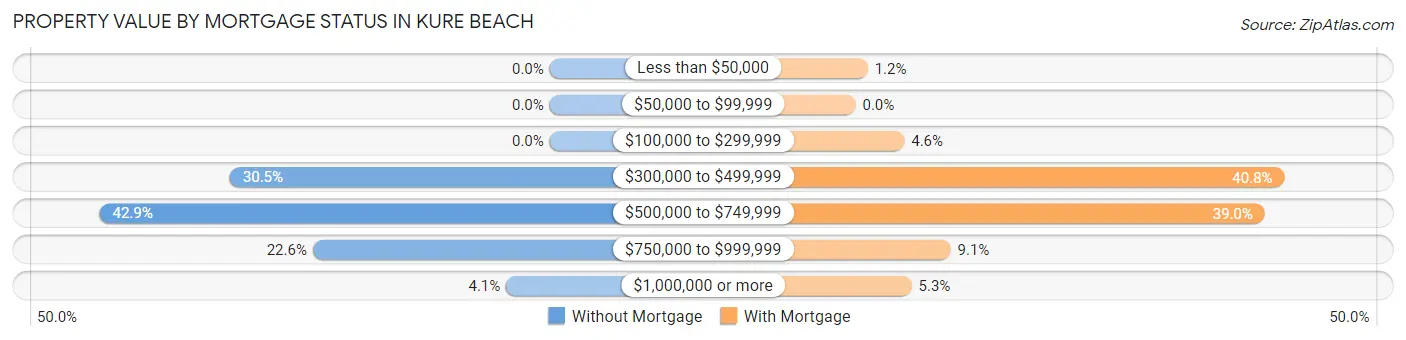
| Property Value | Without Mortgage | With Mortgage |
| Less than $50,000 | 0 (0.0%) | 5 (1.2%) |
| $50,000 to $99,999 | 0 (0.0%) | 0 (0.0%) |
| $100,000 to $299,999 | 0 (0.0%) | 20 (4.6%) |
| $300,000 to $499,999 | 81 (30.4%) | 176 (40.8%) |
| $500,000 to $749,999 | 114 (42.9%) | 168 (39.0%) |
| $750,000 to $999,999 | 60 (22.6%) | 39 (9.0%) |
| $1,000,000 or more | 11 (4.1%) | 23 (5.3%) |
| Total | 266 (100.0%) | 431 (100.0%) |
Household Income by Mortgage Status in Kure Beach
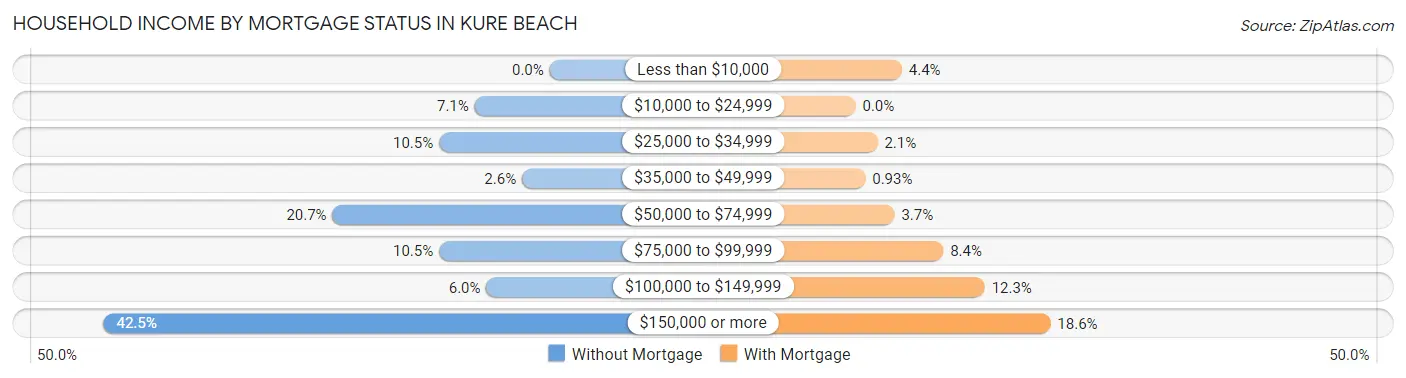
| Household Income | Without Mortgage | With Mortgage |
| Less than $10,000 | 0 (0.0%) | 19 (4.4%) |
| $10,000 to $24,999 | 19 (7.1%) | 0 (0.0%) |
| $25,000 to $34,999 | 28 (10.5%) | 9 (2.1%) |
| $35,000 to $49,999 | 7 (2.6%) | 4 (0.9%) |
| $50,000 to $74,999 | 55 (20.7%) | 16 (3.7%) |
| $75,000 to $99,999 | 28 (10.5%) | 36 (8.4%) |
| $100,000 to $149,999 | 16 (6.0%) | 53 (12.3%) |
| $150,000 or more | 113 (42.5%) | 80 (18.6%) |
| Total | 266 (100.0%) | 431 (100.0%) |
Property Value to Household Income Ratio in Kure Beach
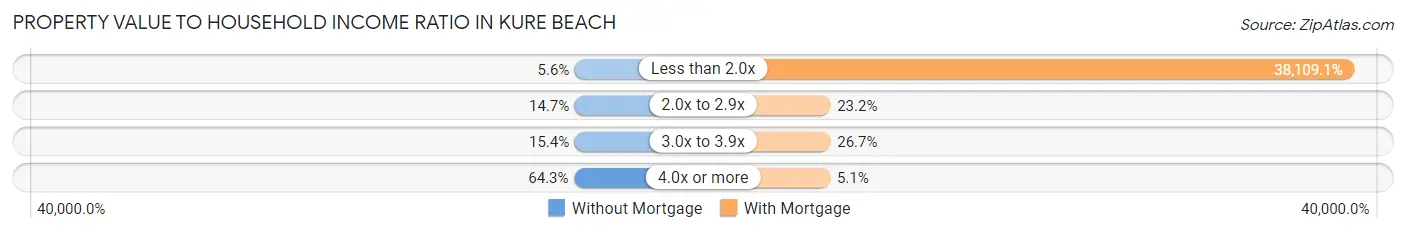
| Value-to-Income Ratio | Without Mortgage | With Mortgage |
| Less than 2.0x | 15 (5.6%) | 164,250 (38,109.1%) |
| 2.0x to 2.9x | 39 (14.7%) | 100 (23.2%) |
| 3.0x to 3.9x | 41 (15.4%) | 115 (26.7%) |
| 4.0x or more | 171 (64.3%) | 22 (5.1%) |
| Total | 266 (100.0%) | 431 (100.0%) |
Real Estate Taxes by Mortgage Status in Kure Beach
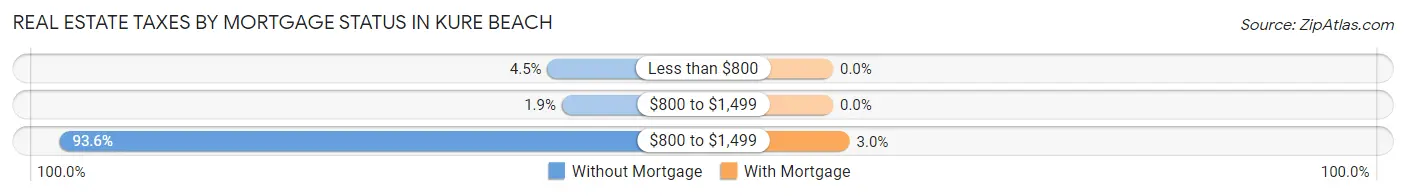
| Property Taxes | Without Mortgage | With Mortgage |
| Less than $800 | 12 (4.5%) | 0 (0.0%) |
| $800 to $1,499 | 5 (1.9%) | 0 (0.0%) |
| $800 to $1,499 | 249 (93.6%) | 13 (3.0%) |
| Total | 266 (100.0%) | 431 (100.0%) |
Health & Disability in Kure Beach
Health Insurance Coverage by Age in Kure Beach
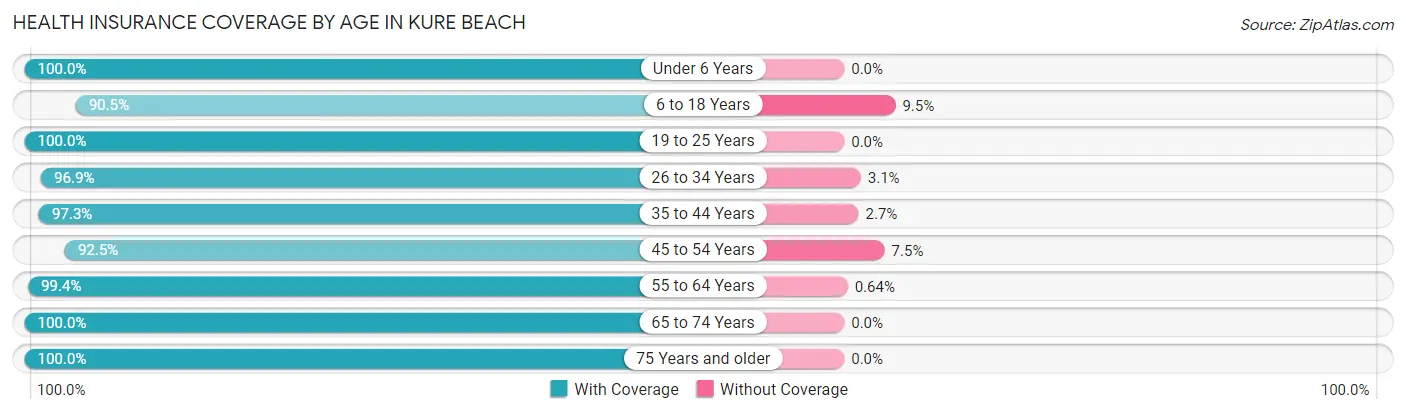
| Age Bracket | With Coverage | Without Coverage |
| Under 6 Years | 51 (100.0%) | 0 (0.0%) |
| 6 to 18 Years | 237 (90.5%) | 25 (9.5%) |
| 19 to 25 Years | 65 (100.0%) | 0 (0.0%) |
| 26 to 34 Years | 157 (96.9%) | 5 (3.1%) |
| 35 to 44 Years | 182 (97.3%) | 5 (2.7%) |
| 45 to 54 Years | 393 (92.5%) | 32 (7.5%) |
| 55 to 64 Years | 618 (99.4%) | 4 (0.6%) |
| 65 to 74 Years | 375 (100.0%) | 0 (0.0%) |
| 75 Years and older | 164 (100.0%) | 0 (0.0%) |
| Total | 2,242 (96.9%) | 71 (3.1%) |
Health Insurance Coverage by Citizenship Status in Kure Beach
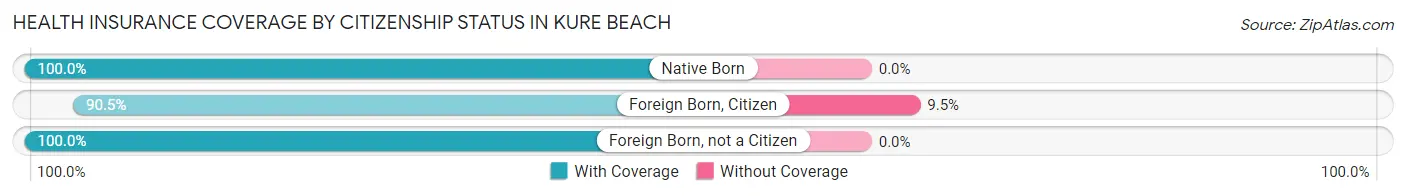
| Citizenship Status | With Coverage | Without Coverage |
| Native Born | 51 (100.0%) | 0 (0.0%) |
| Foreign Born, Citizen | 237 (90.5%) | 25 (9.5%) |
| Foreign Born, not a Citizen | 65 (100.0%) | 0 (0.0%) |
Health Insurance Coverage by Household Income in Kure Beach
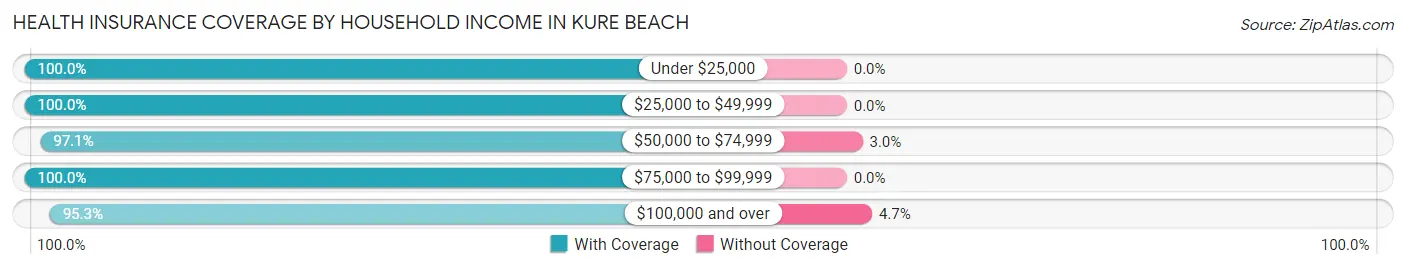
| Household Income | With Coverage | Without Coverage |
| Under $25,000 | 63 (100.0%) | 0 (0.0%) |
| $25,000 to $49,999 | 214 (100.0%) | 0 (0.0%) |
| $50,000 to $74,999 | 362 (97.1%) | 11 (2.9%) |
| $75,000 to $99,999 | 392 (100.0%) | 0 (0.0%) |
| $100,000 and over | 1,211 (95.3%) | 60 (4.7%) |
Public vs Private Health Insurance Coverage by Age in Kure Beach
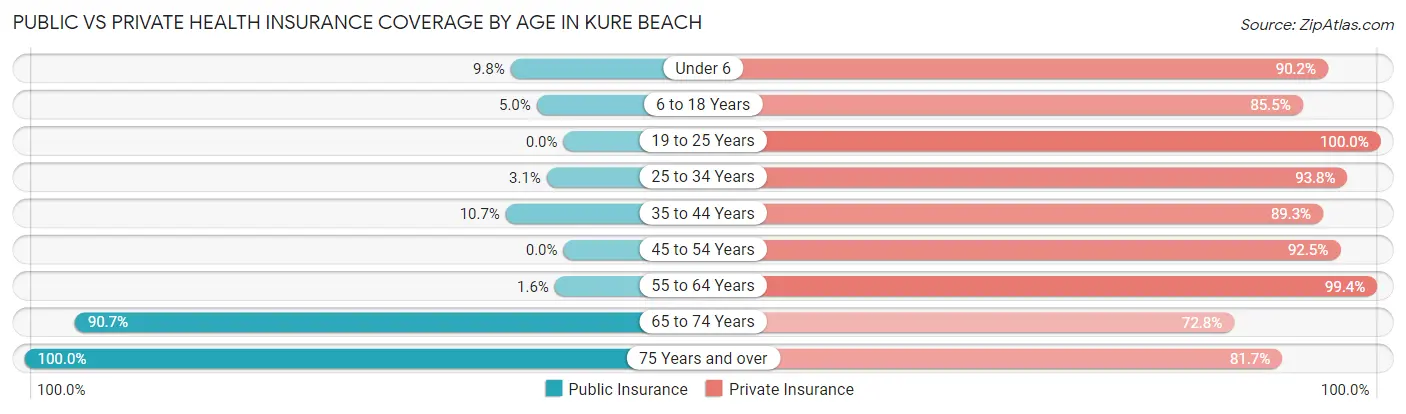
| Age Bracket | Public Insurance | Private Insurance |
| Under 6 | 5 (9.8%) | 46 (90.2%) |
| 6 to 18 Years | 13 (5.0%) | 224 (85.5%) |
| 19 to 25 Years | 0 (0.0%) | 65 (100.0%) |
| 25 to 34 Years | 5 (3.1%) | 152 (93.8%) |
| 35 to 44 Years | 20 (10.7%) | 167 (89.3%) |
| 45 to 54 Years | 0 (0.0%) | 393 (92.5%) |
| 55 to 64 Years | 10 (1.6%) | 618 (99.4%) |
| 65 to 74 Years | 340 (90.7%) | 273 (72.8%) |
| 75 Years and over | 164 (100.0%) | 134 (81.7%) |
| Total | 557 (24.1%) | 2,072 (89.6%) |
Disability Status by Sex by Age in Kure Beach
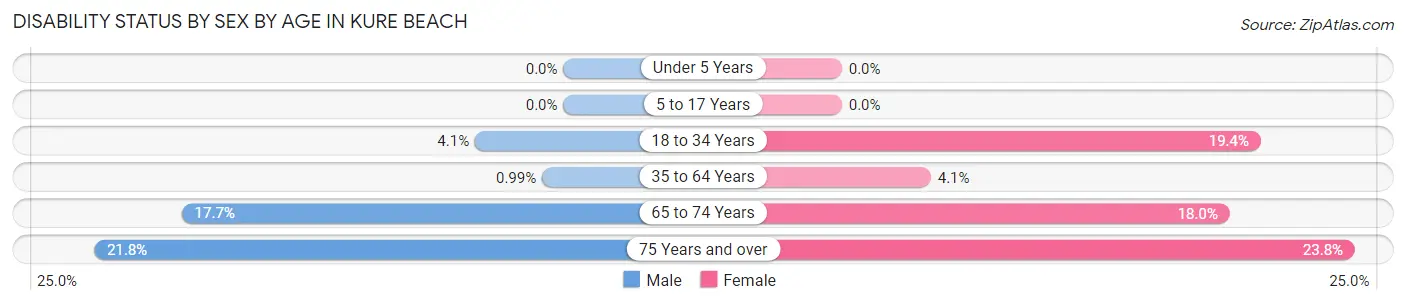
| Age Bracket | Male | Female |
| Under 5 Years | 0 (0.0%) | 0 (0.0%) |
| 5 to 17 Years | 0 (0.0%) | 0 (0.0%) |
| 18 to 34 Years | 5 (4.1%) | 28 (19.4%) |
| 35 to 64 Years | 6 (1.0%) | 26 (4.1%) |
| 65 to 74 Years | 31 (17.7%) | 36 (18.0%) |
| 75 Years and over | 22 (21.8%) | 15 (23.8%) |
Disability Class by Sex by Age in Kure Beach
Disability Class: Hearing Difficulty
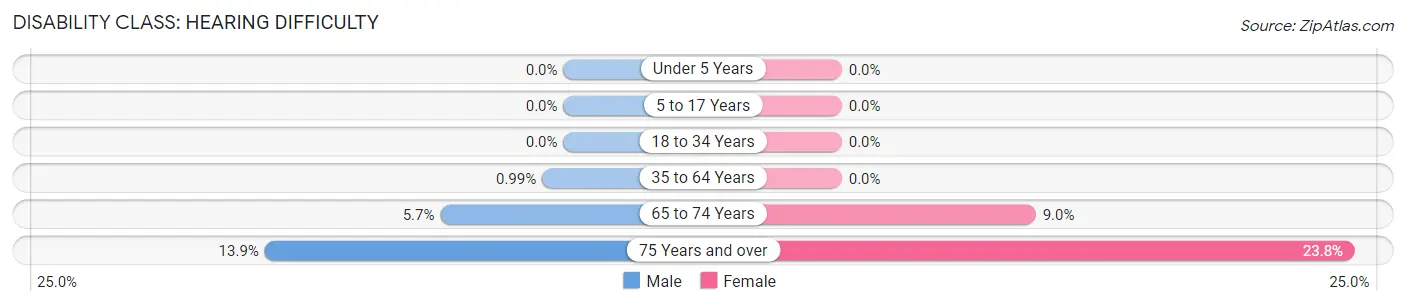
| Age Bracket | Male | Female |
| Under 5 Years | 0 (0.0%) | 0 (0.0%) |
| 5 to 17 Years | 0 (0.0%) | 0 (0.0%) |
| 18 to 34 Years | 0 (0.0%) | 0 (0.0%) |
| 35 to 64 Years | 6 (1.0%) | 0 (0.0%) |
| 65 to 74 Years | 10 (5.7%) | 18 (9.0%) |
| 75 Years and over | 14 (13.9%) | 15 (23.8%) |
Disability Class: Vision Difficulty
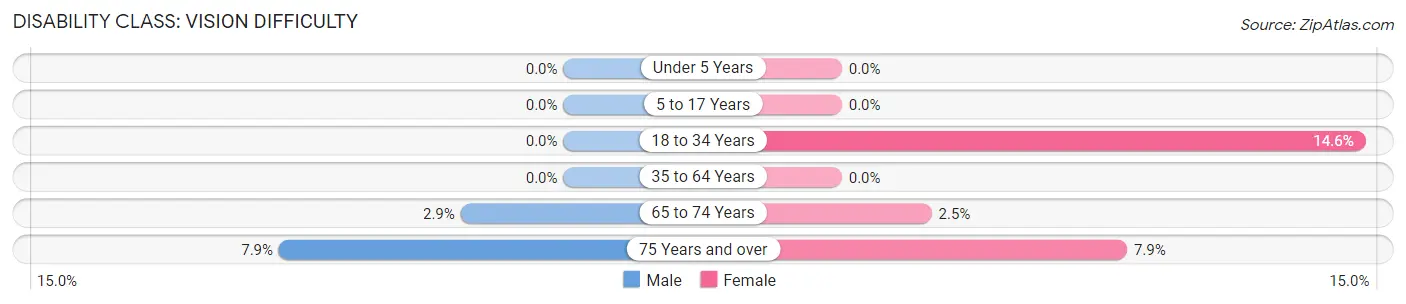
| Age Bracket | Male | Female |
| Under 5 Years | 0 (0.0%) | 0 (0.0%) |
| 5 to 17 Years | 0 (0.0%) | 0 (0.0%) |
| 18 to 34 Years | 0 (0.0%) | 21 (14.6%) |
| 35 to 64 Years | 0 (0.0%) | 0 (0.0%) |
| 65 to 74 Years | 5 (2.9%) | 5 (2.5%) |
| 75 Years and over | 8 (7.9%) | 5 (7.9%) |
Disability Class: Cognitive Difficulty
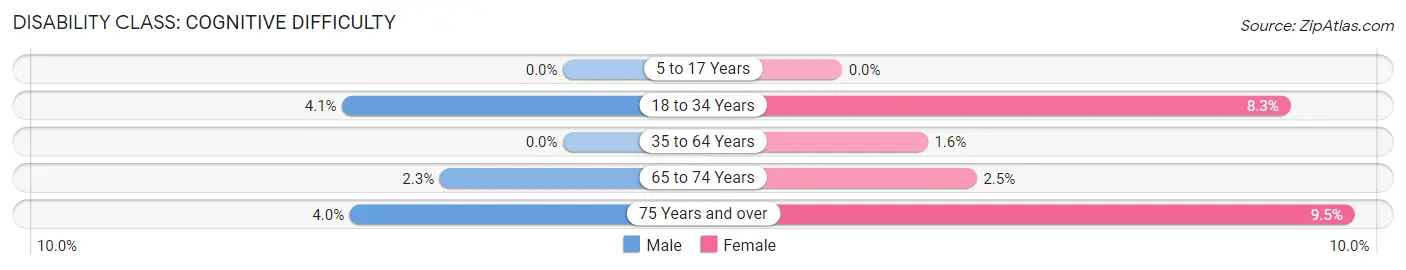
| Age Bracket | Male | Female |
| 5 to 17 Years | 0 (0.0%) | 0 (0.0%) |
| 18 to 34 Years | 5 (4.1%) | 12 (8.3%) |
| 35 to 64 Years | 0 (0.0%) | 10 (1.6%) |
| 65 to 74 Years | 4 (2.3%) | 5 (2.5%) |
| 75 Years and over | 4 (4.0%) | 6 (9.5%) |
Disability Class: Ambulatory Difficulty
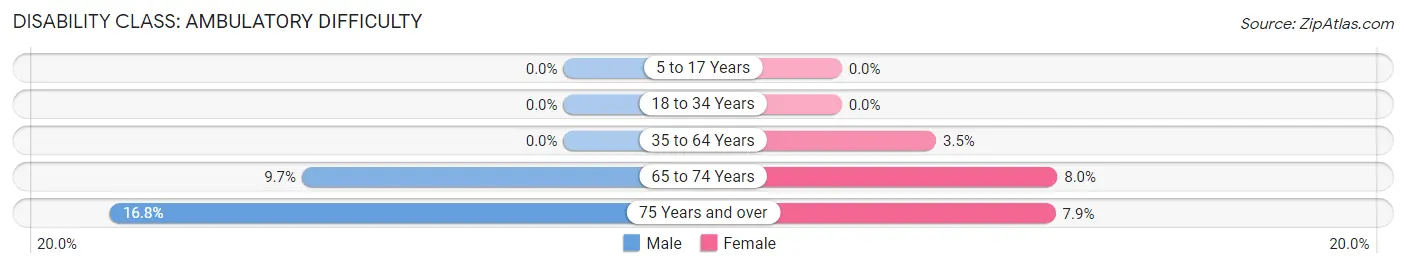
| Age Bracket | Male | Female |
| 5 to 17 Years | 0 (0.0%) | 0 (0.0%) |
| 18 to 34 Years | 0 (0.0%) | 0 (0.0%) |
| 35 to 64 Years | 0 (0.0%) | 22 (3.5%) |
| 65 to 74 Years | 17 (9.7%) | 16 (8.0%) |
| 75 Years and over | 17 (16.8%) | 5 (7.9%) |
Disability Class: Self-Care Difficulty
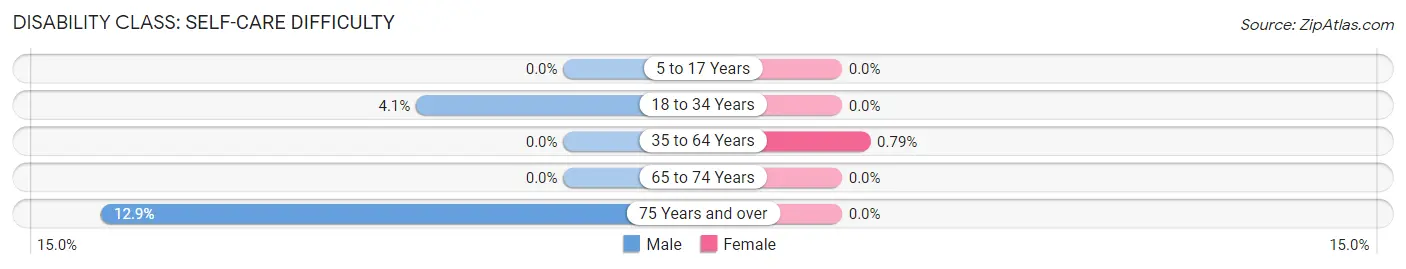
| Age Bracket | Male | Female |
| 5 to 17 Years | 0 (0.0%) | 0 (0.0%) |
| 18 to 34 Years | 5 (4.1%) | 0 (0.0%) |
| 35 to 64 Years | 0 (0.0%) | 5 (0.8%) |
| 65 to 74 Years | 0 (0.0%) | 0 (0.0%) |
| 75 Years and over | 13 (12.9%) | 0 (0.0%) |
Technology Access in Kure Beach
Computing Device Access in Kure Beach
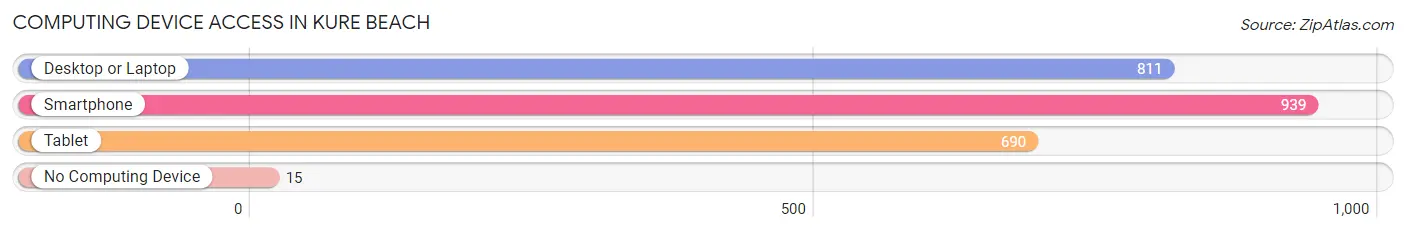
| Device Type | # Households | % Households |
| Desktop or Laptop | 811 | 83.4% |
| Smartphone | 939 | 96.5% |
| Tablet | 690 | 70.9% |
| No Computing Device | 15 | 1.5% |
| Total | 973 | 100.0% |
Internet Access in Kure Beach
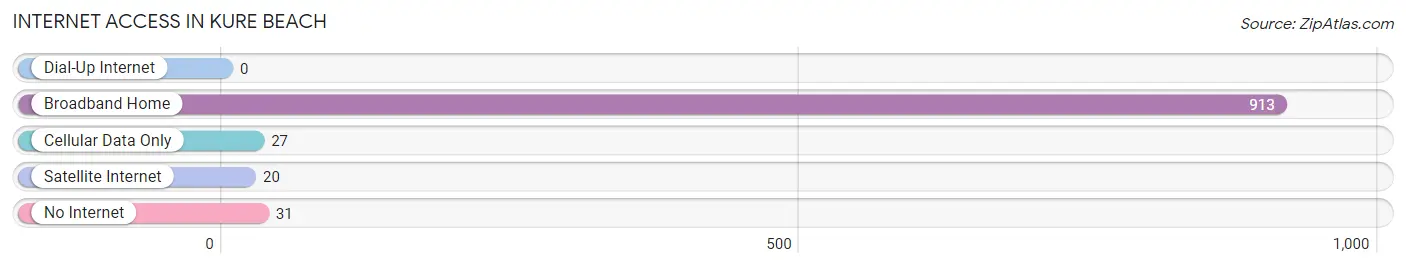
| Internet Type | # Households | % Households |
| Dial-Up Internet | 0 | 0.0% |
| Broadband Home | 913 | 93.8% |
| Cellular Data Only | 27 | 2.8% |
| Satellite Internet | 20 | 2.1% |
| No Internet | 31 | 3.2% |
| Total | 973 | 100.0% |
Kure Beach Summary
Kure Beach is a small town located in New Hanover County, North Carolina. It is situated on the Atlantic Ocean, just south of Wilmington. The town has a population of approximately 2,000 people and covers an area of 1.2 square miles.
History
Kure Beach was founded in 1887 by the Kure family, who had moved to the area from Germany. The family purchased a large tract of land and began to develop the area. The town was named after the Kure family and was incorporated in 1949.
The town has a long history of fishing and shrimping, and the Kure family was instrumental in developing the local fishing industry. In the early 1900s, the Kure family built a pier and a fish house, which were used to process and ship seafood. The pier was also used as a recreational area for swimming and fishing.
In the 1950s, Kure Beach began to develop as a tourist destination. The town was promoted as a family-friendly beach resort, and many hotels and restaurants were built to accommodate the influx of visitors. The town also became a popular spot for fishing and shrimping.
Geography
Kure Beach is located on the Atlantic Ocean, just south of Wilmington. The town is situated on a barrier island, which is separated from the mainland by the Intracoastal Waterway. The town is bordered by the Atlantic Ocean to the east and the Intracoastal Waterway to the west.
The town has a humid subtropical climate, with hot, humid summers and mild winters. The average temperature in the summer is around 80 degrees Fahrenheit, and the average temperature in the winter is around 50 degrees Fahrenheit.
Economy
Kure Beach’s economy is largely based on tourism and fishing. The town is a popular destination for beachgoers, and there are several hotels, restaurants, and shops in the area. The town also has a thriving fishing industry, and many of the local restaurants serve fresh seafood.
The town is also home to several businesses, including a marina, a boat repair shop, and a charter fishing business. The town also has a small airport, which is used for private planes and helicopters.
Demographics
Kure Beach has a population of approximately 2,000 people. The town is predominantly white, with about 90% of the population being Caucasian. The median household income is around $50,000, and the median home value is around $250,000.
The town is served by the New Hanover County School District, and there are several public schools in the area. The town also has a library, a post office, and a police station.
Kure Beach is a small town with a rich history and a vibrant economy. The town is a popular destination for beachgoers and fishermen, and it is a great place to live and work.
Common Questions
What is Per Capita Income in Kure Beach?
Per Capita income in Kure Beach is $59,415.
What is the Median Family Income in Kure Beach?
Median Family Income in Kure Beach is $106,250.
What is the Median Household income in Kure Beach?
Median Household Income in Kure Beach is $97,269.
What is Income or Wage Gap in Kure Beach?
Income or Wage Gap in Kure Beach is 58.6%.
Women in Kure Beach earn 41.4 cents for every dollar earned by a man.
What is Inequality or Gini Index in Kure Beach?
Inequality or Gini Index in Kure Beach is 0.42.
What is the Total Population of Kure Beach?
Total Population of Kure Beach is 2,313.
What is the Total Male Population of Kure Beach?
Total Male Population of Kure Beach is 1,118.
What is the Total Female Population of Kure Beach?
Total Female Population of Kure Beach is 1,195.
What is the Ratio of Males per 100 Females in Kure Beach?
There are 93.56 Males per 100 Females in Kure Beach.
What is the Ratio of Females per 100 Males in Kure Beach?
There are 106.89 Females per 100 Males in Kure Beach.
What is the Median Population Age in Kure Beach?
Median Population Age in Kure Beach is 55.1 Years.
What is the Average Family Size in Kure Beach
Average Family Size in Kure Beach is 2.6 People.
What is the Average Household Size in Kure Beach
Average Household Size in Kure Beach is 2.4 People.
How Large is the Labor Force in Kure Beach?
There are 1,253 People in the Labor Forcein in Kure Beach.
What is the Percentage of People in the Labor Force in Kure Beach?
60.0% of People are in the Labor Force in Kure Beach.
What is the Unemployment Rate in Kure Beach?
Unemployment Rate in Kure Beach is 1.2%.