Pink Hill, NC Map & Demographics
Pink Hill Map
Pink Hill Overview
$22,425
PER CAPITA INCOME
$43,333
AVG FAMILY INCOME
$43,074
AVG HOUSEHOLD INCOME
0.33
INEQUALITY / GINI INDEX
528
TOTAL POPULATION
305
MALE POPULATION
223
FEMALE POPULATION
136.77
MALES / 100 FEMALES
73.11
FEMALES / 100 MALES
49.0
MEDIAN AGE
2.6
AVG FAMILY SIZE
2.2
AVG HOUSEHOLD SIZE
260
LABOR FORCE [ PEOPLE ]
55.9%
PERCENT IN LABOR FORCE
4.2%
UNEMPLOYMENT RATE
Pink Hill Zip Codes
Pink Hill Area Codes
Income in Pink Hill
Income Overview in Pink Hill
Per Capita Income in Pink Hill is $22,425, while median incomes of families and households are $43,333 and $43,074 respectively.
| Characteristic | Number | Measure |
| Per Capita Income | 528 | $22,425 |
| Median Family Income | 140 | $43,333 |
| Mean Family Income | 140 | $47,998 |
| Median Household Income | 241 | $43,074 |
| Mean Household Income | 241 | $48,342 |
| Income Deficit | 140 | $0 |
| Wage / Income Gap (%) | 528 | 0.00% |
| Wage / Income Gap ($) | 528 | 100.00¢ per $1 |
| Gini / Inequality Index | 528 | 0.33 |
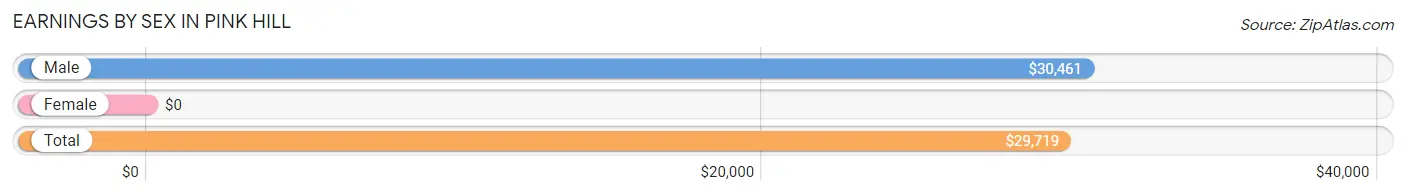
Earnings by Sex in Pink Hill
| Sex | Number | Average Earnings |
| Male | 196 (66.4%) | $30,461 |
| Female | 99 (33.6%) | $0 |
| Total | 295 (100.0%) | $29,719 |
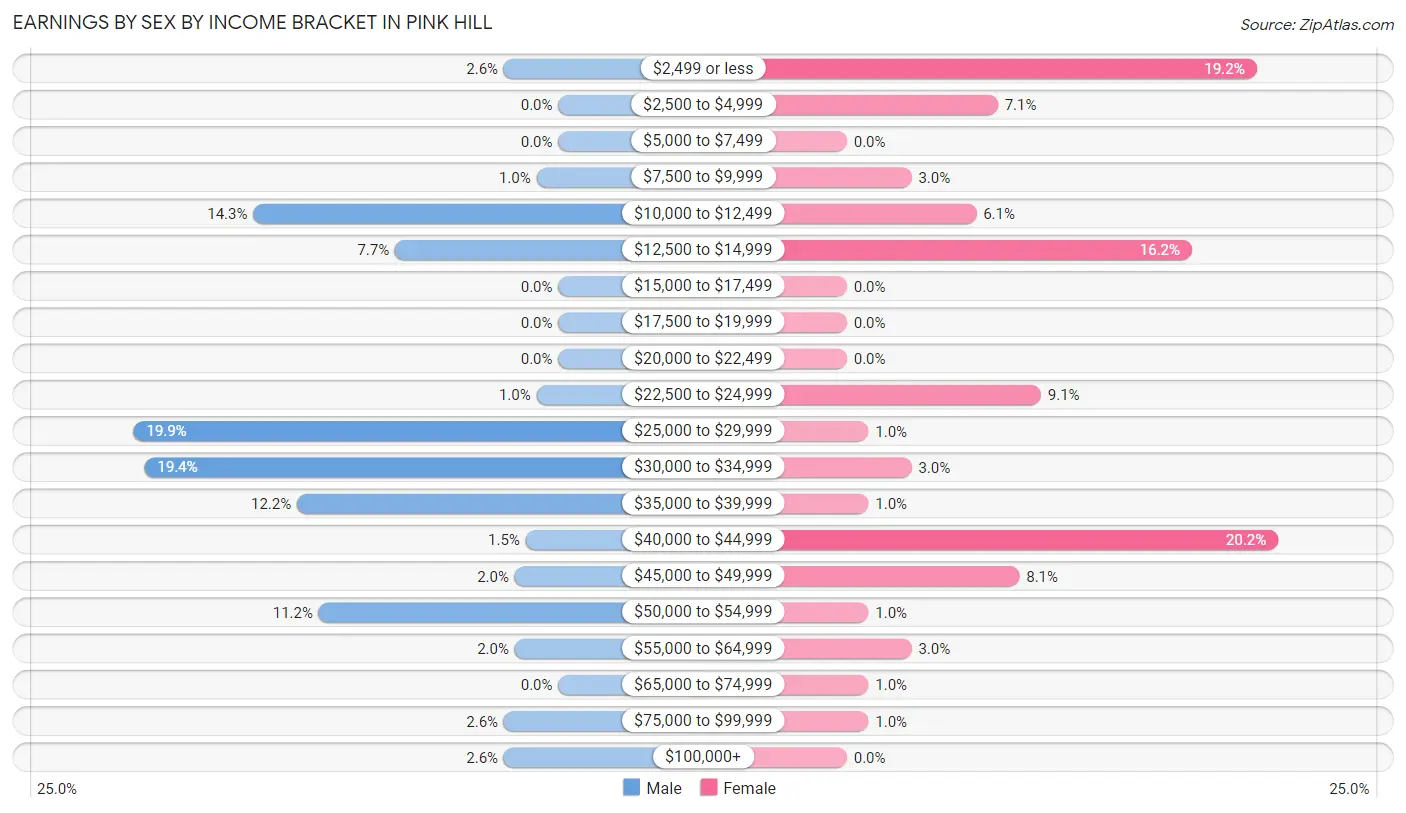
Earnings by Sex by Income Bracket in Pink Hill
The most common earnings brackets in Pink Hill are $25,000 to $29,999 for men (39 | 19.9%) and $40,000 to $44,999 for women (20 | 20.2%).
| Income | Male | Female |
| $2,499 or less | 5 (2.5%) | 19 (19.2%) |
| $2,500 to $4,999 | 0 (0.0%) | 7 (7.1%) |
| $5,000 to $7,499 | 0 (0.0%) | 0 (0.0%) |
| $7,500 to $9,999 | 2 (1.0%) | 3 (3.0%) |
| $10,000 to $12,499 | 28 (14.3%) | 6 (6.1%) |
| $12,500 to $14,999 | 15 (7.6%) | 16 (16.2%) |
| $15,000 to $17,499 | 0 (0.0%) | 0 (0.0%) |
| $17,500 to $19,999 | 0 (0.0%) | 0 (0.0%) |
| $20,000 to $22,499 | 0 (0.0%) | 0 (0.0%) |
| $22,500 to $24,999 | 2 (1.0%) | 9 (9.1%) |
| $25,000 to $29,999 | 39 (19.9%) | 1 (1.0%) |
| $30,000 to $34,999 | 38 (19.4%) | 3 (3.0%) |
| $35,000 to $39,999 | 24 (12.2%) | 1 (1.0%) |
| $40,000 to $44,999 | 3 (1.5%) | 20 (20.2%) |
| $45,000 to $49,999 | 4 (2.0%) | 8 (8.1%) |
| $50,000 to $54,999 | 22 (11.2%) | 1 (1.0%) |
| $55,000 to $64,999 | 4 (2.0%) | 3 (3.0%) |
| $65,000 to $74,999 | 0 (0.0%) | 1 (1.0%) |
| $75,000 to $99,999 | 5 (2.5%) | 1 (1.0%) |
| $100,000+ | 5 (2.5%) | 0 (0.0%) |
| Total | 196 (100.0%) | 99 (100.0%) |
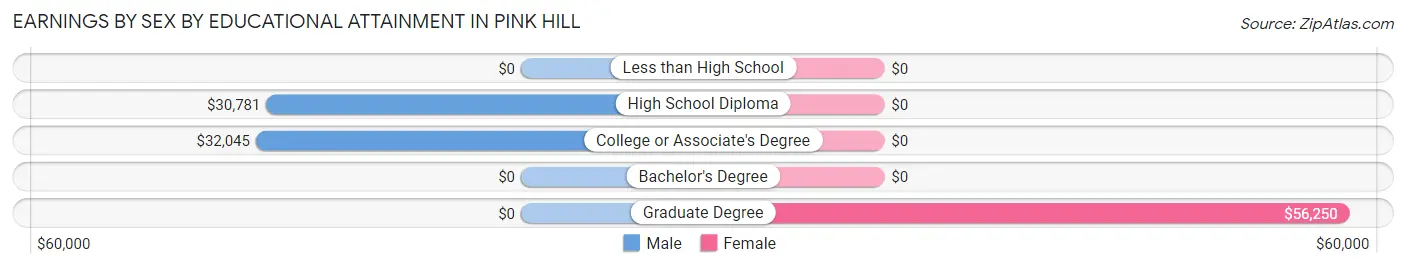
Earnings by Sex by Educational Attainment in Pink Hill
| Educational Attainment | Male Income | Female Income |
| Less than High School | - | - |
| High School Diploma | $30,781 | $0 |
| College or Associate's Degree | $32,045 | $0 |
| Bachelor's Degree | - | - |
| Graduate Degree | - | - |
| Total | $31,020 | $0 |
Family Income in Pink Hill
Family Income Brackets in Pink Hill
According to the Pink Hill family income data, there are 34 families falling into the $35,000 to $49,999 income range, which is the most common income bracket and makes up 24.3% of all families.
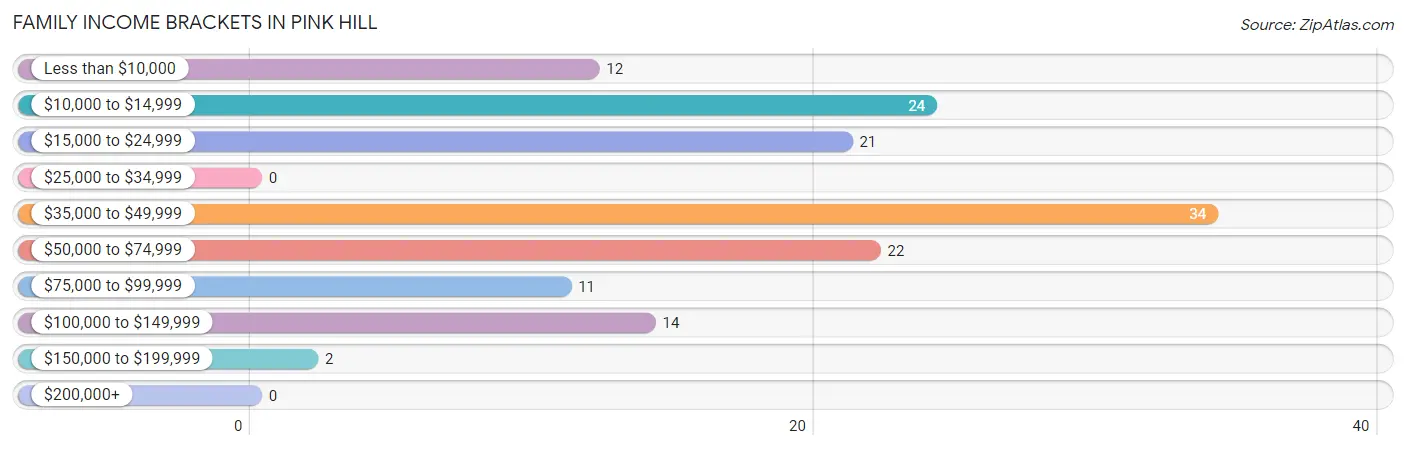
| Income Bracket | # Families | % Families |
| Less than $10,000 | 12 | 8.6% |
| $10,000 to $14,999 | 24 | 17.1% |
| $15,000 to $24,999 | 21 | 15.0% |
| $25,000 to $34,999 | 0 | 0.0% |
| $35,000 to $49,999 | 34 | 24.3% |
| $50,000 to $74,999 | 22 | 15.7% |
| $75,000 to $99,999 | 11 | 7.9% |
| $100,000 to $149,999 | 14 | 10.0% |
| $150,000 to $199,999 | 2 | 1.4% |
| $200,000+ | 0 | 0.0% |
Family Income by Famaliy Size in Pink Hill
2-person families (95 | 67.9%) account for the highest median family income in Pink Hill with $42,917 per family, while 2-person families (95 | 67.9%) have the highest median income of $21,458 per family member.
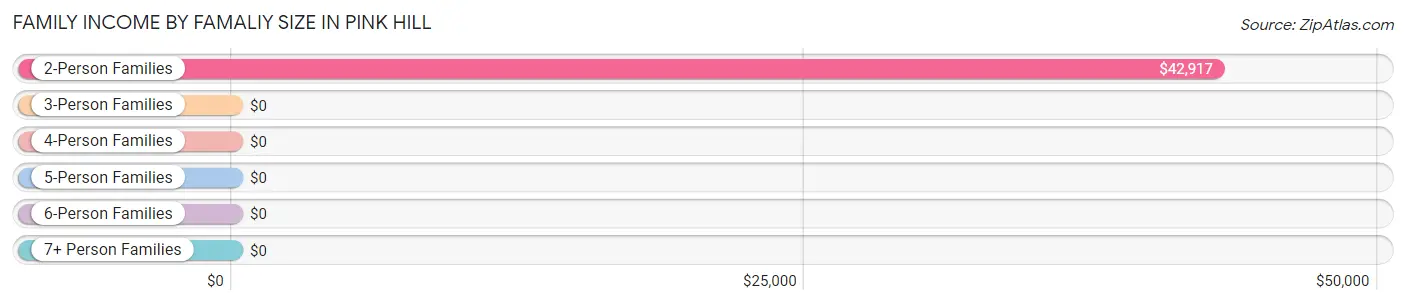
| Income Bracket | # Families | Median Income |
| 2-Person Families | 95 (67.9%) | $42,917 |
| 3-Person Families | 24 (17.1%) | $0 |
| 4-Person Families | 16 (11.4%) | $0 |
| 5-Person Families | 1 (0.7%) | $0 |
| 6-Person Families | 0 (0.0%) | $0 |
| 7+ Person Families | 4 (2.9%) | $0 |
| Total | 140 (100.0%) | $43,333 |
Family Income by Number of Earners in Pink Hill
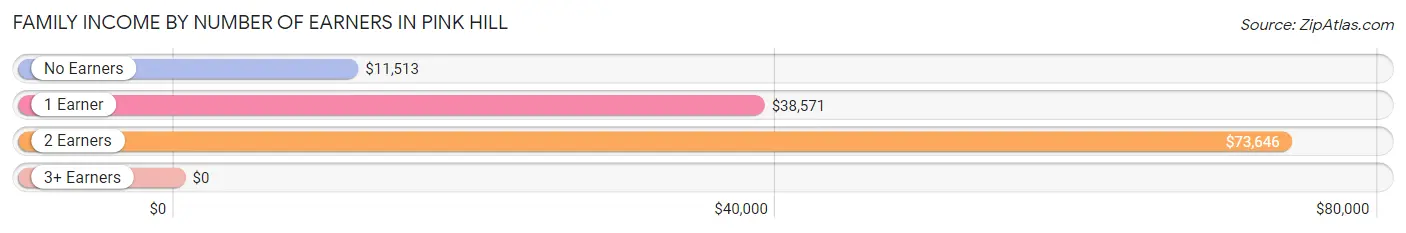
| Number of Earners | # Families | Median Income |
| No Earners | 23 (16.4%) | $11,513 |
| 1 Earner | 64 (45.7%) | $38,571 |
| 2 Earners | 47 (33.6%) | $73,646 |
| 3+ Earners | 6 (4.3%) | $0 |
| Total | 140 (100.0%) | $43,333 |
Household Income in Pink Hill
Household Income Brackets in Pink Hill
With 102 households falling in the category, the $35,000 to $49,999 income range is the most frequent in Pink Hill, accounting for 42.3% of all households.
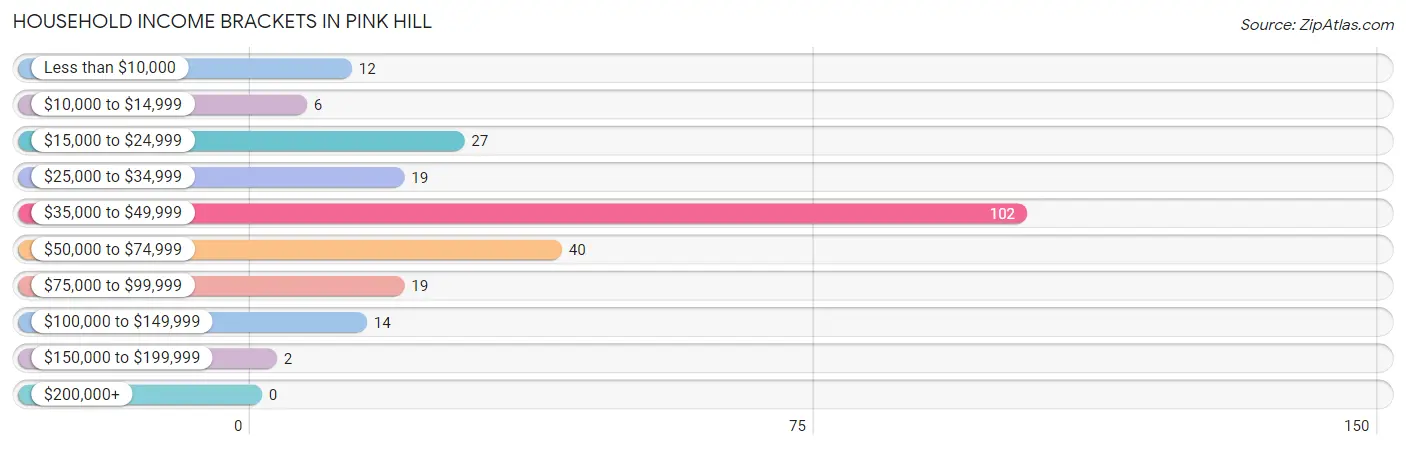
| Income Bracket | # Households | % Households |
| Less than $10,000 | 12 | 5.0% |
| $10,000 to $14,999 | 6 | 2.5% |
| $15,000 to $24,999 | 27 | 11.2% |
| $25,000 to $34,999 | 19 | 7.9% |
| $35,000 to $49,999 | 102 | 42.3% |
| $50,000 to $74,999 | 40 | 16.6% |
| $75,000 to $99,999 | 19 | 7.9% |
| $100,000 to $149,999 | 14 | 5.8% |
| $150,000 to $199,999 | 2 | 0.8% |
| $200,000+ | 0 | 0.0% |
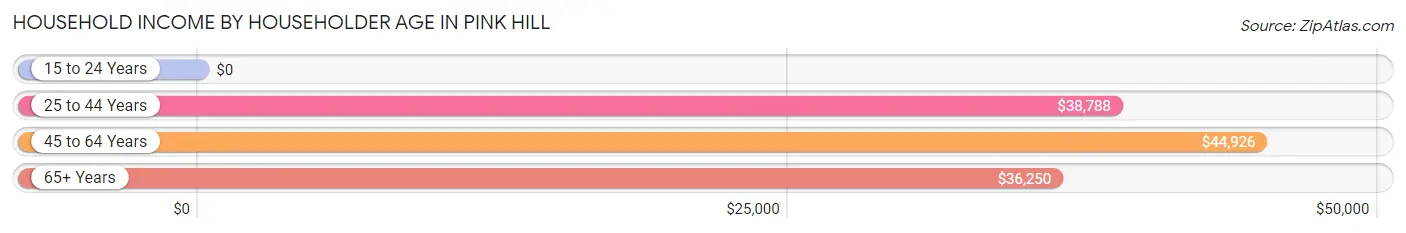
Household Income by Householder Age in Pink Hill
The median household income in Pink Hill is $43,074, with the highest median household income of $44,926 found in the 45 to 64 years age bracket for the primary householder. A total of 106 households (44.0%) fall into this category. Meanwhile, the 15 to 24 years age bracket for the primary householder has the lowest median household income of $0, with 17 households (7.0%) in this group.
| Income Bracket | # Households | Median Income |
| 15 to 24 Years | 17 (7.0%) | $0 |
| 25 to 44 Years | 60 (24.9%) | $38,788 |
| 45 to 64 Years | 106 (44.0%) | $44,926 |
| 65+ Years | 58 (24.1%) | $36,250 |
| Total | 241 (100.0%) | $43,074 |
Poverty in Pink Hill
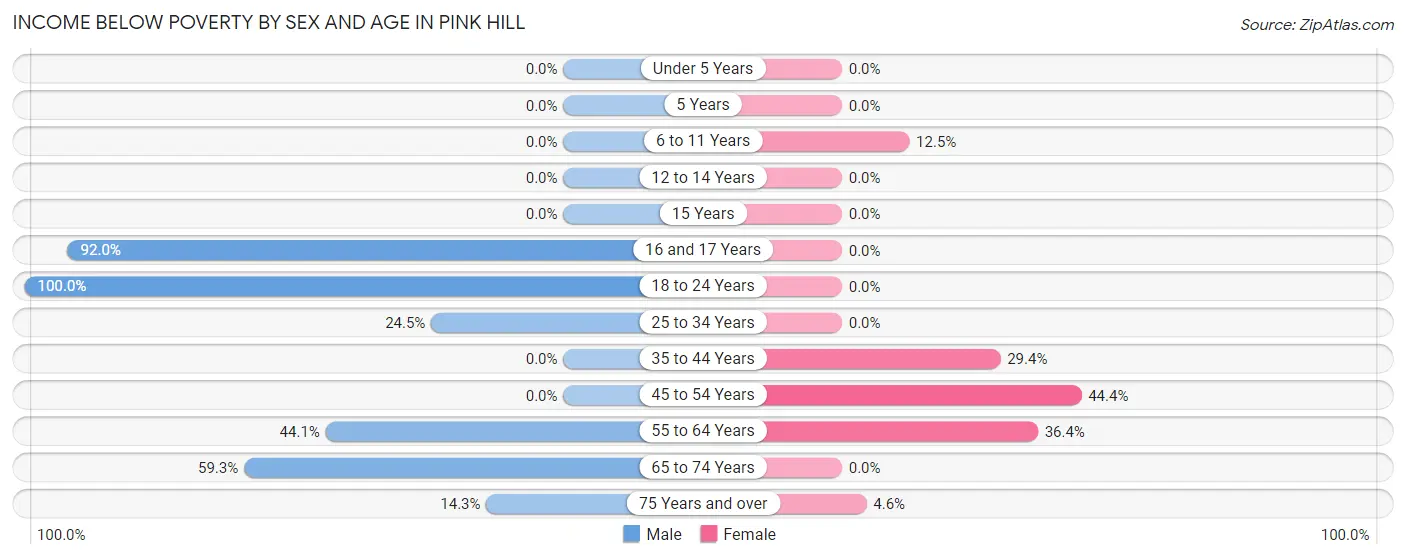
Income Below Poverty by Sex and Age in Pink Hill
With 33.4% poverty level for males and 25.6% for females among the residents of Pink Hill, 18 to 24 year old males and 45 to 54 year old females are the most vulnerable to poverty, with 18 males (100.0%) and 32 females (44.4%) in their respective age groups living below the poverty level.
| Age Bracket | Male | Female |
| Under 5 Years | 0 (0.0%) | 0 (0.0%) |
| 5 Years | 0 (0.0%) | 0 (0.0%) |
| 6 to 11 Years | 0 (0.0%) | 3 (12.5%) |
| 12 to 14 Years | 0 (0.0%) | 0 (0.0%) |
| 15 Years | 0 (0.0%) | 0 (0.0%) |
| 16 and 17 Years | 23 (92.0%) | 0 (0.0%) |
| 18 to 24 Years | 18 (100.0%) | 0 (0.0%) |
| 25 to 34 Years | 13 (24.5%) | 0 (0.0%) |
| 35 to 44 Years | 0 (0.0%) | 5 (29.4%) |
| 45 to 54 Years | 0 (0.0%) | 32 (44.4%) |
| 55 to 64 Years | 30 (44.1%) | 16 (36.4%) |
| 65 to 74 Years | 16 (59.3%) | 0 (0.0%) |
| 75 Years and over | 2 (14.3%) | 1 (4.5%) |
| Total | 102 (33.4%) | 57 (25.6%) |
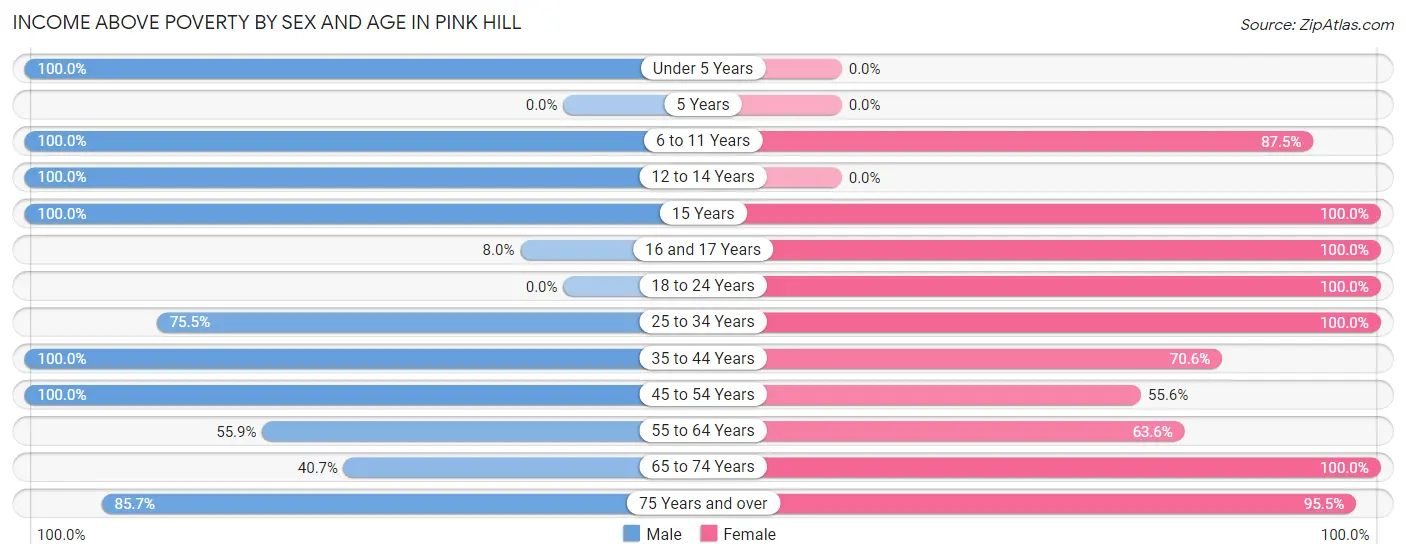
Income Above Poverty by Sex and Age in Pink Hill
According to the poverty statistics in Pink Hill, males aged under 5 years and females aged 15 years are the age groups that are most secure financially, with 100.0% of males and 100.0% of females in these age groups living above the poverty line.
| Age Bracket | Male | Female |
| Under 5 Years | 8 (100.0%) | 0 (0.0%) |
| 5 Years | 0 (0.0%) | 0 (0.0%) |
| 6 to 11 Years | 9 (100.0%) | 21 (87.5%) |
| 12 to 14 Years | 15 (100.0%) | 0 (0.0%) |
| 15 Years | 4 (100.0%) | 3 (100.0%) |
| 16 and 17 Years | 2 (8.0%) | 3 (100.0%) |
| 18 to 24 Years | 0 (0.0%) | 9 (100.0%) |
| 25 to 34 Years | 40 (75.5%) | 5 (100.0%) |
| 35 to 44 Years | 16 (100.0%) | 12 (70.6%) |
| 45 to 54 Years | 48 (100.0%) | 40 (55.6%) |
| 55 to 64 Years | 38 (55.9%) | 28 (63.6%) |
| 65 to 74 Years | 11 (40.7%) | 24 (100.0%) |
| 75 Years and over | 12 (85.7%) | 21 (95.5%) |
| Total | 203 (66.6%) | 166 (74.4%) |
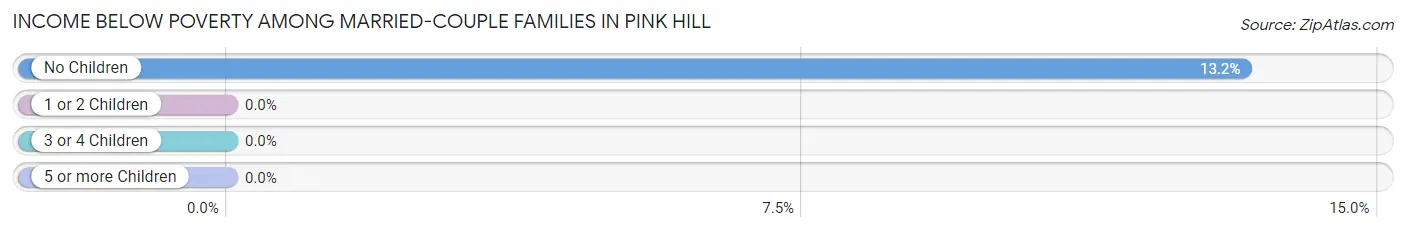
Income Below Poverty Among Married-Couple Families in Pink Hill
The poverty statistics for married-couple families in Pink Hill show that 10.1% or 9 of the total 89 families live below the poverty line. Families with no children have the highest poverty rate of 13.2%, comprising of 9 families. On the other hand, families with 1 or 2 children have the lowest poverty rate of 0.0%, which includes 0 families.
| Children | Above Poverty | Below Poverty |
| No Children | 59 (86.8%) | 9 (13.2%) |
| 1 or 2 Children | 16 (100.0%) | 0 (0.0%) |
| 3 or 4 Children | 1 (100.0%) | 0 (0.0%) |
| 5 or more Children | 4 (100.0%) | 0 (0.0%) |
| Total | 80 (89.9%) | 9 (10.1%) |
Income Below Poverty Among Single-Parent Households in Pink Hill
According to the poverty data in Pink Hill, 100.0% or 15 single-father households and 80.6% or 29 single-mother households are living below the poverty line. Among single-father households, those with no children have the highest poverty rate, with 15 households (100.0%) experiencing poverty. Likewise, among single-mother households, those with 1 or 2 children have the highest poverty rate, with 24 households (85.7%) falling below the poverty line.
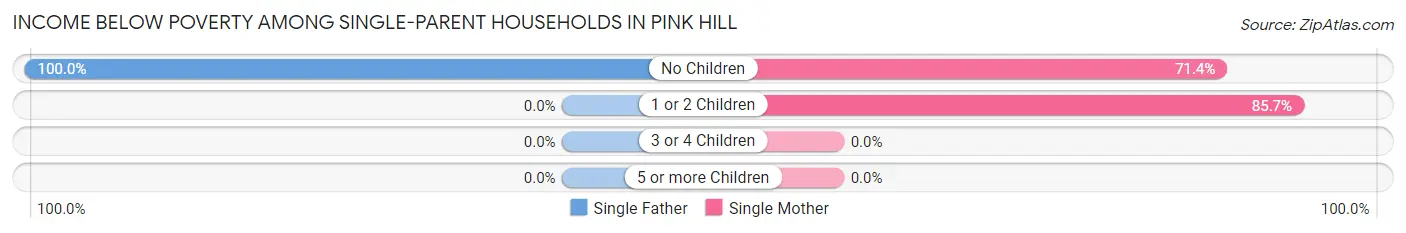
| Children | Single Father | Single Mother |
| No Children | 15 (100.0%) | 5 (71.4%) |
| 1 or 2 Children | 0 (0.0%) | 24 (85.7%) |
| 3 or 4 Children | 0 (0.0%) | 0 (0.0%) |
| 5 or more Children | 0 (0.0%) | 0 (0.0%) |
| Total | 15 (100.0%) | 29 (80.6%) |
Income Below Poverty Among Married-Couple vs Single-Parent Households in Pink Hill
The poverty data for Pink Hill shows that 9 of the married-couple family households (10.1%) and 44 of the single-parent households (86.3%) are living below the poverty level. Within the married-couple family households, those with no children have the highest poverty rate, with 9 households (13.2%) falling below the poverty line. Among the single-parent households, those with no children have the highest poverty rate, with 20 household (90.9%) living below poverty.
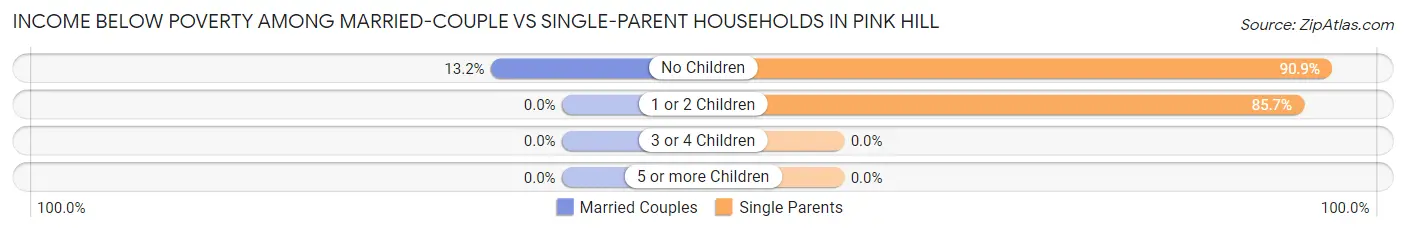
| Children | Married-Couple Families | Single-Parent Households |
| No Children | 9 (13.2%) | 20 (90.9%) |
| 1 or 2 Children | 0 (0.0%) | 24 (85.7%) |
| 3 or 4 Children | 0 (0.0%) | 0 (0.0%) |
| 5 or more Children | 0 (0.0%) | 0 (0.0%) |
| Total | 9 (10.1%) | 44 (86.3%) |
Race in Pink Hill
The most populous races in Pink Hill are White / Caucasian (345 | 65.3%), Hispanic or Latino (109 | 20.6%), and Some other Race (61 | 11.6%).
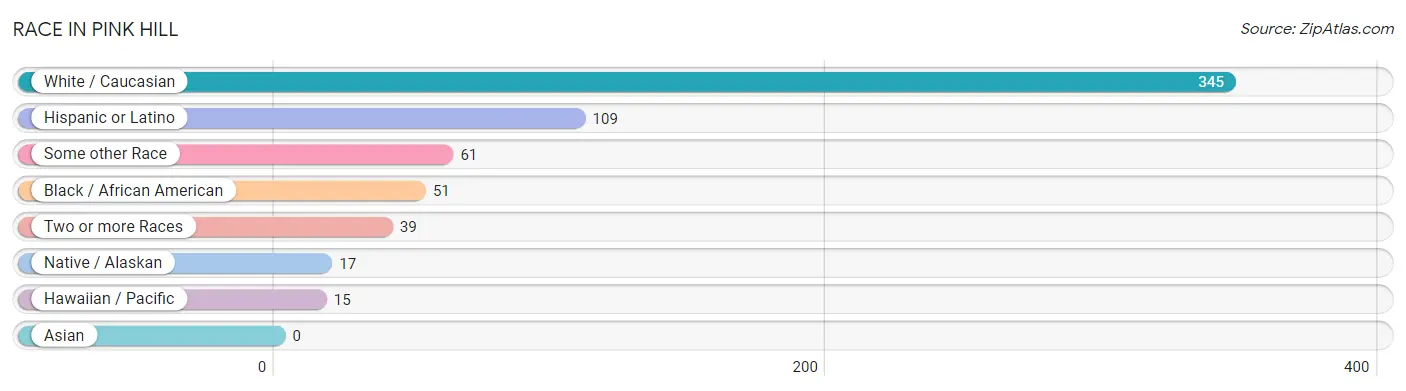
| Race | # Population | % Population |
| Asian | 0 | 0.0% |
| Black / African American | 51 | 9.7% |
| Hawaiian / Pacific | 15 | 2.8% |
| Hispanic or Latino | 109 | 20.6% |
| Native / Alaskan | 17 | 3.2% |
| White / Caucasian | 345 | 65.3% |
| Two or more Races | 39 | 7.4% |
| Some other Race | 61 | 11.6% |
| Total | 528 | 100.0% |
Ancestry in Pink Hill
The most populous ancestries reported in Pink Hill are Mexican (70 | 13.3%), English (59 | 11.2%), German (52 | 9.9%), American (51 | 9.7%), and Irish (40 | 7.6%), together accounting for 51.5% of all Pink Hill residents.
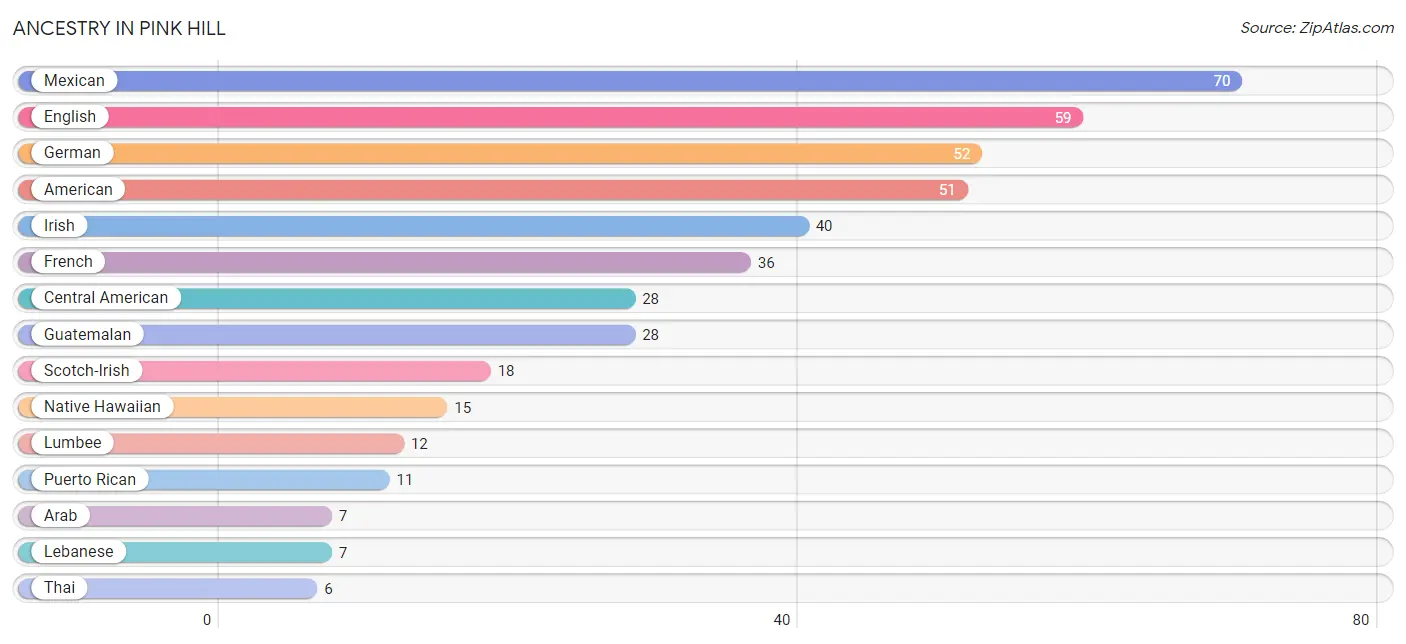
| Ancestry | # Population | % Population |
| African | 4 | 0.8% |
| American | 51 | 9.7% |
| Arab | 7 | 1.3% |
| Central American | 28 | 5.3% |
| Croatian | 3 | 0.6% |
| English | 59 | 11.2% |
| European | 3 | 0.6% |
| French | 36 | 6.8% |
| German | 52 | 9.9% |
| Guatemalan | 28 | 5.3% |
| Irish | 40 | 7.6% |
| Italian | 1 | 0.2% |
| Lebanese | 7 | 1.3% |
| Lumbee | 12 | 2.3% |
| Mexican | 70 | 13.3% |
| Mexican American Indian | 5 | 0.9% |
| Native Hawaiian | 15 | 2.8% |
| Puerto Rican | 11 | 2.1% |
| Scotch-Irish | 18 | 3.4% |
| Subsaharan African | 4 | 0.8% |
| Thai | 6 | 1.1% | View All 21 Rows |
Immigrants in Pink Hill
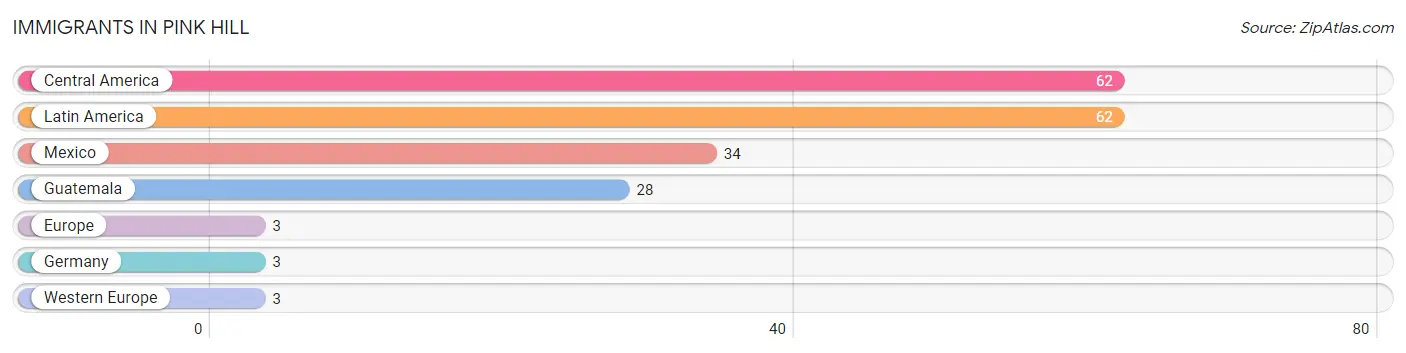
The most numerous immigrant groups reported in Pink Hill came from Central America (62 | 11.7%), Latin America (62 | 11.7%), Mexico (34 | 6.4%), Guatemala (28 | 5.3%), and Europe (3 | 0.6%), together accounting for 35.8% of all Pink Hill residents.
| Immigration Origin | # Population | % Population |
| Central America | 62 | 11.7% |
| Europe | 3 | 0.6% |
| Germany | 3 | 0.6% |
| Guatemala | 28 | 5.3% |
| Latin America | 62 | 11.7% |
| Mexico | 34 | 6.4% |
| Western Europe | 3 | 0.6% | View All 7 Rows |
Sex and Age in Pink Hill
Sex and Age in Pink Hill
The most populous age groups in Pink Hill are 30 to 34 Years (47 | 15.4%) for men and 50 to 54 Years (48 | 21.5%) for women.
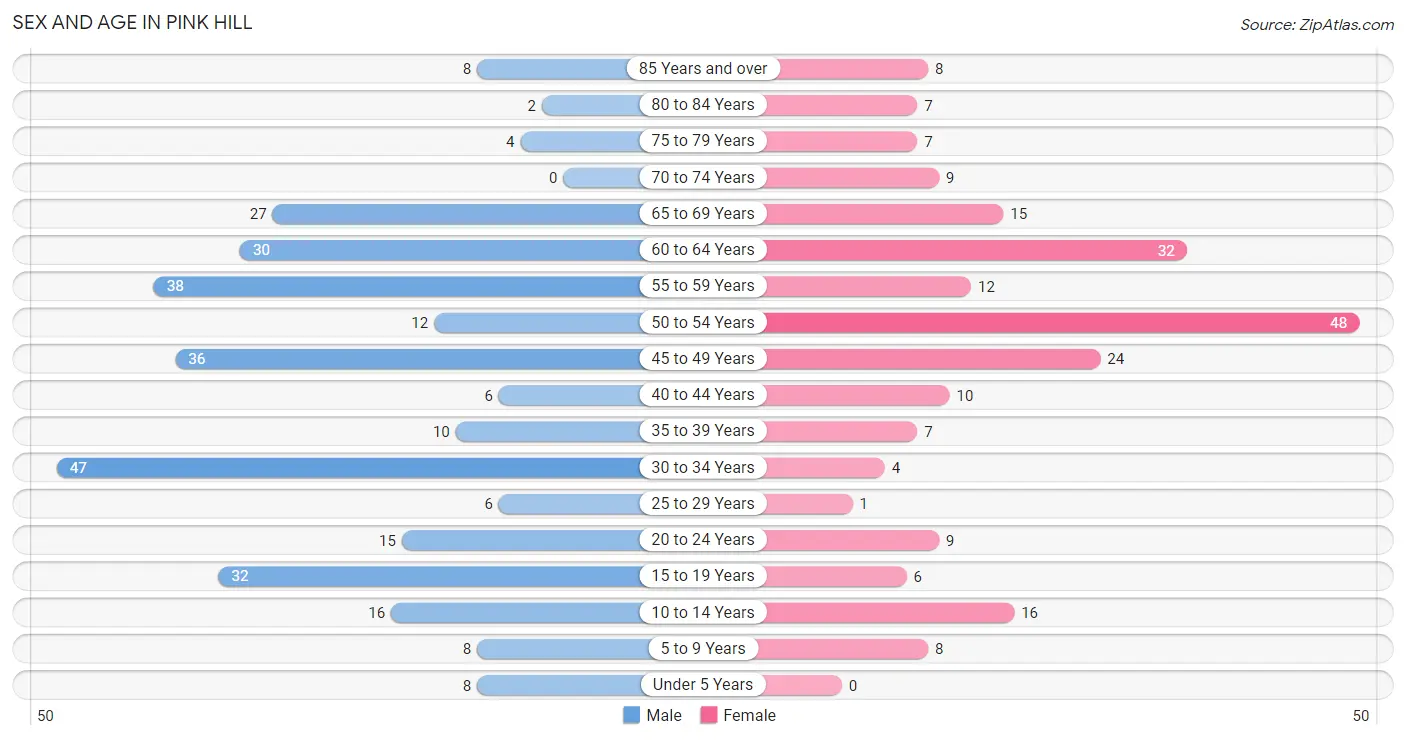
| Age Bracket | Male | Female |
| Under 5 Years | 8 (2.6%) | 0 (0.0%) |
| 5 to 9 Years | 8 (2.6%) | 8 (3.6%) |
| 10 to 14 Years | 16 (5.2%) | 16 (7.2%) |
| 15 to 19 Years | 32 (10.5%) | 6 (2.7%) |
| 20 to 24 Years | 15 (4.9%) | 9 (4.0%) |
| 25 to 29 Years | 6 (2.0%) | 1 (0.4%) |
| 30 to 34 Years | 47 (15.4%) | 4 (1.8%) |
| 35 to 39 Years | 10 (3.3%) | 7 (3.1%) |
| 40 to 44 Years | 6 (2.0%) | 10 (4.5%) |
| 45 to 49 Years | 36 (11.8%) | 24 (10.8%) |
| 50 to 54 Years | 12 (3.9%) | 48 (21.5%) |
| 55 to 59 Years | 38 (12.5%) | 12 (5.4%) |
| 60 to 64 Years | 30 (9.8%) | 32 (14.3%) |
| 65 to 69 Years | 27 (8.8%) | 15 (6.7%) |
| 70 to 74 Years | 0 (0.0%) | 9 (4.0%) |
| 75 to 79 Years | 4 (1.3%) | 7 (3.1%) |
| 80 to 84 Years | 2 (0.7%) | 7 (3.1%) |
| 85 Years and over | 8 (2.6%) | 8 (3.6%) |
| Total | 305 (100.0%) | 223 (100.0%) |
Families and Households in Pink Hill
Median Family Size in Pink Hill
The median family size in Pink Hill is 2.56 persons per family, with married-couple families (89 | 63.6%) accounting for the largest median family size of 2.76 persons per family. On the other hand, single female/mother families (36 | 25.7%) represent the smallest median family size with 2.14 persons per family.
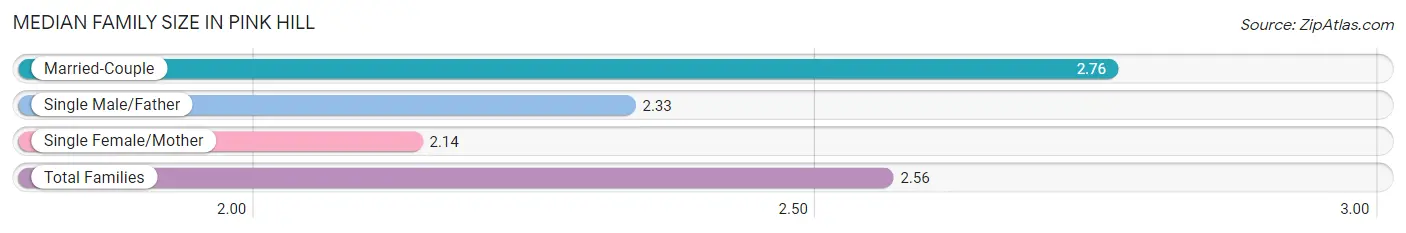
| Family Type | # Families | Family Size |
| Married-Couple | 89 (63.6%) | 2.76 |
| Single Male/Father | 15 (10.7%) | 2.33 |
| Single Female/Mother | 36 (25.7%) | 2.14 |
| Total Families | 140 (100.0%) | 2.56 |
Median Household Size in Pink Hill
The median household size in Pink Hill is 2.19 persons per household, with single female/mother households (36 | 14.9%) accounting for the largest median household size of 2.81 persons per household. non-family households (101 | 41.9%) represent the smallest median household size with 1.45 persons per household.
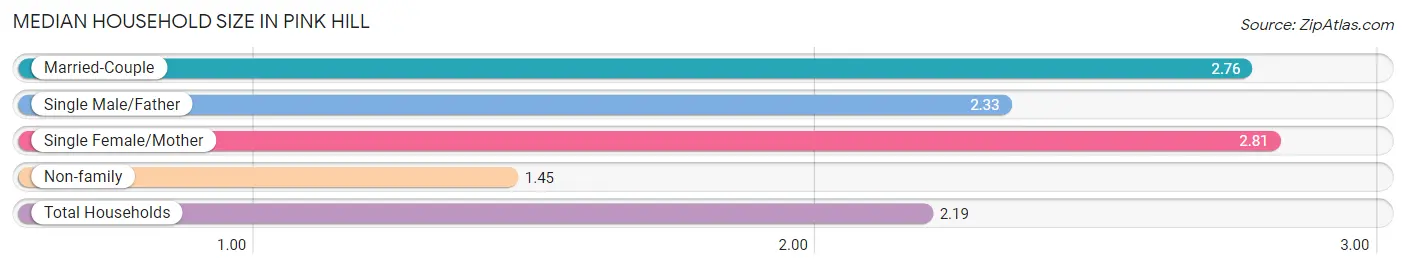
| Household Type | # Households | Household Size |
| Married-Couple | 89 (36.9%) | 2.76 |
| Single Male/Father | 15 (6.2%) | 2.33 |
| Single Female/Mother | 36 (14.9%) | 2.81 |
| Non-family | 101 (41.9%) | 1.45 |
| Total Households | 241 (100.0%) | 2.19 |
Household Size by Marriage Status in Pink Hill
Out of a total of 241 households in Pink Hill, 140 (58.1%) are family households, while 101 (41.9%) are nonfamily households. The most numerous type of family households are 2-person households, comprising 76, and the most common type of nonfamily households are 2-person households, comprising 52.
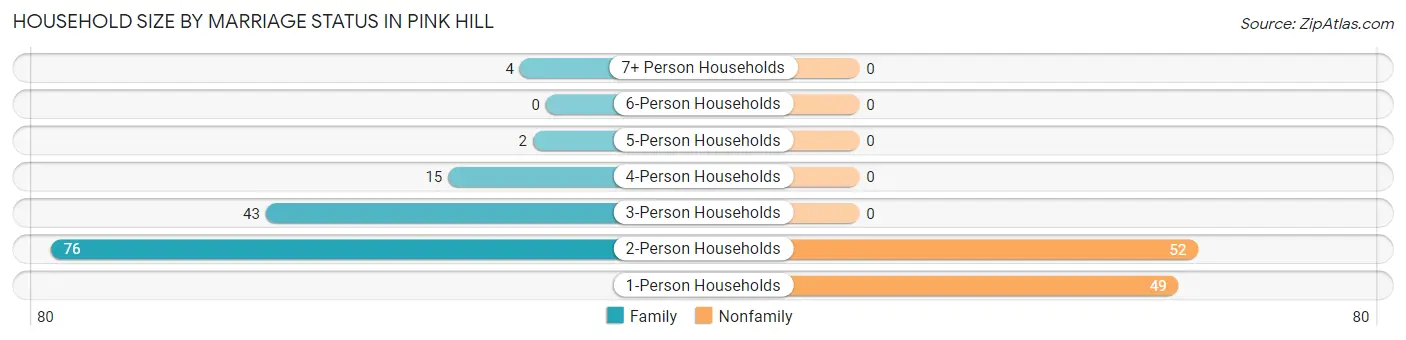
| Household Size | Family Households | Nonfamily Households |
| 1-Person Households | - | 49 (20.3%) |
| 2-Person Households | 76 (31.5%) | 52 (21.6%) |
| 3-Person Households | 43 (17.8%) | 0 (0.0%) |
| 4-Person Households | 15 (6.2%) | 0 (0.0%) |
| 5-Person Households | 2 (0.8%) | 0 (0.0%) |
| 6-Person Households | 0 (0.0%) | 0 (0.0%) |
| 7+ Person Households | 4 (1.7%) | 0 (0.0%) |
| Total | 140 (58.1%) | 101 (41.9%) |
Female Fertility in Pink Hill
Fertility by Age in Pink Hill
| Age Bracket | Women with Births | Births / 1,000 Women |
| 15 to 19 years | 0 (0.0%) | 0.0 |
| 20 to 34 years | 0 (0.0%) | 0.0 |
| 35 to 50 years | 0 (0.0%) | 0.0 |
| Total | 0 (0.0%) | 0.0 |
Fertility by Age by Marriage Status in Pink Hill
| Age Bracket | Married | Unmarried |
| 15 to 19 years | 0 (0.0%) | 0 (0.0%) |
| 20 to 34 years | 0 (0.0%) | 0 (0.0%) |
| 35 to 50 years | 0 (0.0%) | 0 (0.0%) |
| Total | 0 (0.0%) | 0 (0.0%) |
Fertility by Education in Pink Hill
| Educational Attainment | Women with Births | Births / 1,000 Women |
| Less than High School | 0 (0.0%) | 0.0 |
| High School Diploma | 0 (0.0%) | 0.0 |
| College or Associate's Degree | 0 (0.0%) | 0.0 |
| Bachelor's Degree | 0 (0.0%) | 0.0 |
| Graduate Degree | 0 (0.0%) | 0.0 |
| Total | 0 (0.0%) | 0.0 |
Fertility by Education by Marriage Status in Pink Hill
| Educational Attainment | Married | Unmarried |
| Less than High School | 0 (0.0%) | 0 (0.0%) |
| High School Diploma | 0 (0.0%) | 0 (0.0%) |
| College or Associate's Degree | 0 (0.0%) | 0 (0.0%) |
| Bachelor's Degree | 0 (0.0%) | 0 (0.0%) |
| Graduate Degree | 0 (0.0%) | 0 (0.0%) |
| Total | 0 (0.0%) | 0 (0.0%) |
Employment Characteristics in Pink Hill
Employment by Class of Employer in Pink Hill
Among the 227 employed individuals in Pink Hill, private company employees (121 | 53.3%), local government employees (34 | 15.0%), and state government employees (19 | 8.4%) make up the most common classes of employment.
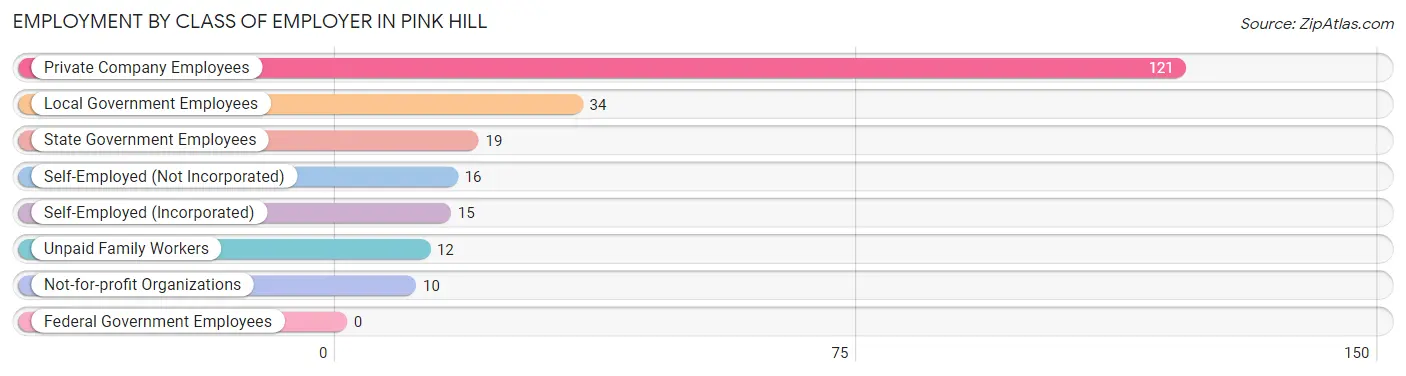
| Employer Class | # Employees | % Employees |
| Private Company Employees | 121 | 53.3% |
| Self-Employed (Incorporated) | 15 | 6.6% |
| Self-Employed (Not Incorporated) | 16 | 7.0% |
| Not-for-profit Organizations | 10 | 4.4% |
| Local Government Employees | 34 | 15.0% |
| State Government Employees | 19 | 8.4% |
| Federal Government Employees | 0 | 0.0% |
| Unpaid Family Workers | 12 | 5.3% |
| Total | 227 | 100.0% |
Employment Status by Age in Pink Hill
According to the labor force statistics for Pink Hill, out of the total population over 16 years of age (465), 55.9% or 260 individuals are in the labor force, with 4.2% or 11 of them unemployed. The age group with the highest labor force participation rate is 35 to 44 years, with 100.0% or 33 individuals in the labor force. Within the labor force, the 65 to 74 years age range has the highest percentage of unemployed individuals, with 25.0% or 4 of them being unemployed.
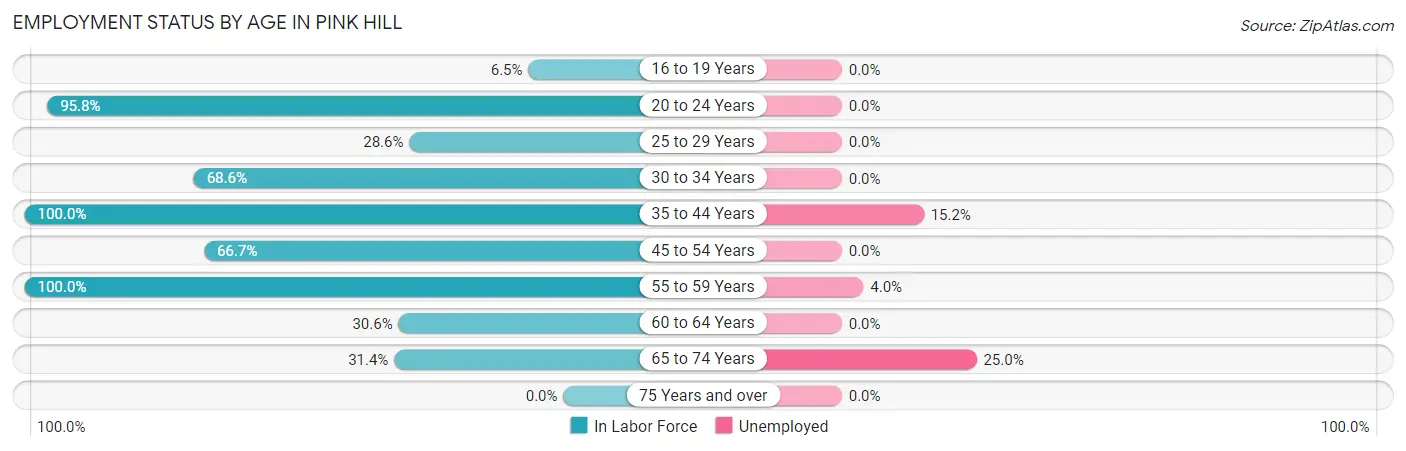
| Age Bracket | In Labor Force | Unemployed |
| 16 to 19 Years | 2 (6.5%) | 0 (0.0%) |
| 20 to 24 Years | 23 (95.8%) | 0 (0.0%) |
| 25 to 29 Years | 2 (28.6%) | 0 (0.0%) |
| 30 to 34 Years | 35 (68.6%) | 0 (0.0%) |
| 35 to 44 Years | 33 (100.0%) | 5 (15.2%) |
| 45 to 54 Years | 80 (66.7%) | 0 (0.0%) |
| 55 to 59 Years | 50 (100.0%) | 2 (4.0%) |
| 60 to 64 Years | 19 (30.6%) | 0 (0.0%) |
| 65 to 74 Years | 16 (31.4%) | 4 (25.0%) |
| 75 Years and over | 0 (0.0%) | 0 (0.0%) |
| Total | 260 (55.9%) | 11 (4.2%) |
Employment Status by Educational Attainment in Pink Hill
According to labor force statistics for Pink Hill, 67.8% of individuals (219) out of the total population between 25 and 64 years of age (323) are in the labor force, with 3.2% or 7 of them being unemployed. The group with the highest labor force participation rate are those with the educational attainment of bachelor's degree or higher, with 100.0% or 38 individuals in the labor force. Within the labor force, individuals with college / associate degree education have the highest percentage of unemployment, with 7.1% or 5 of them being unemployed.
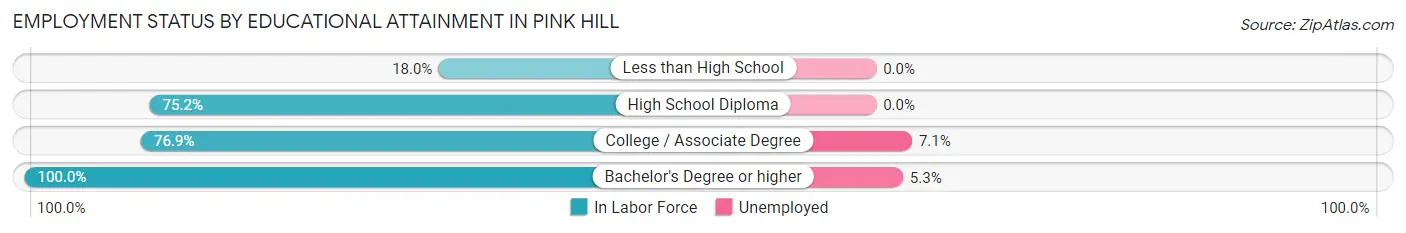
| Educational Attainment | In Labor Force | Unemployed |
| Less than High School | 11 (18.0%) | 0 (0.0%) |
| High School Diploma | 100 (75.2%) | 0 (0.0%) |
| College / Associate Degree | 70 (76.9%) | 6 (7.1%) |
| Bachelor's Degree or higher | 38 (100.0%) | 2 (5.3%) |
| Total | 219 (67.8%) | 10 (3.2%) |
Employment Occupations by Sex in Pink Hill
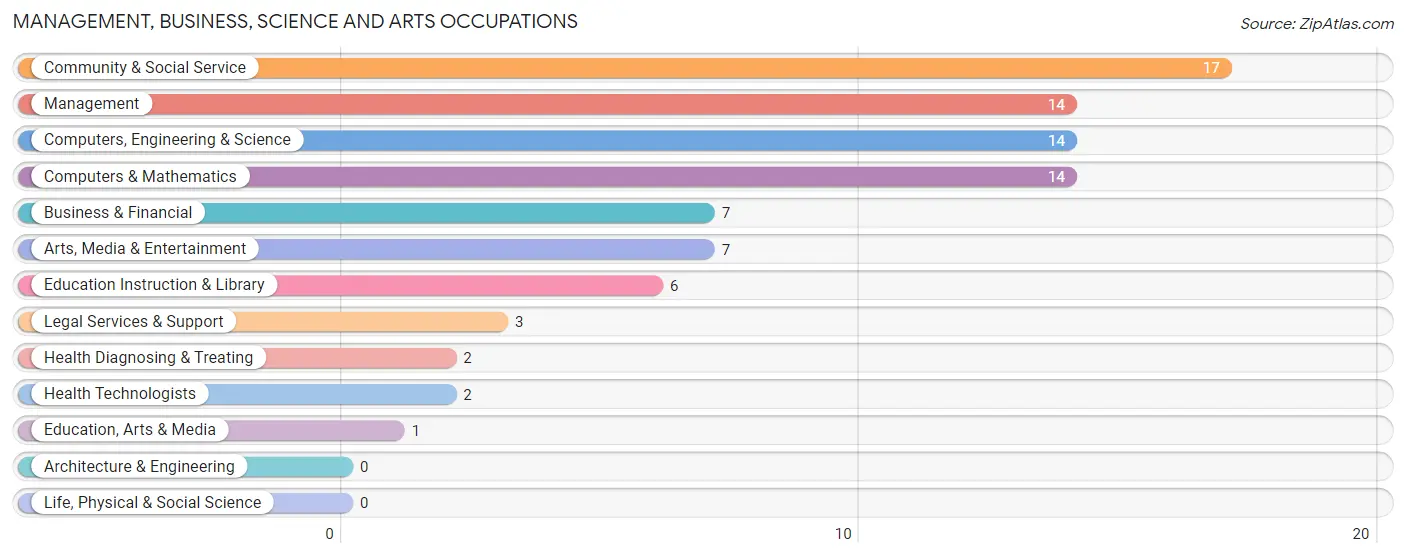
Management, Business, Science and Arts Occupations
The most common Management, Business, Science and Arts occupations in Pink Hill are Community & Social Service (17 | 6.8%), Management (14 | 5.6%), Computers, Engineering & Science (14 | 5.6%), Computers & Mathematics (14 | 5.6%), and Business & Financial (7 | 2.8%).
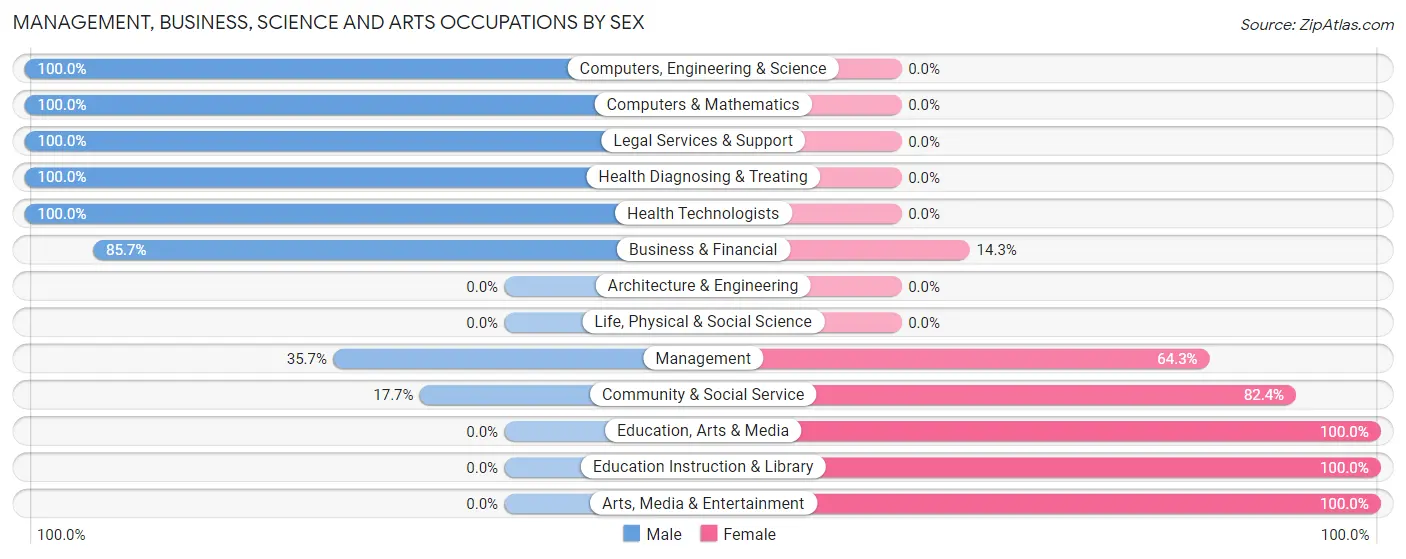
Management, Business, Science and Arts Occupations by Sex
Within the Management, Business, Science and Arts occupations in Pink Hill, the most male-oriented occupations are Computers, Engineering & Science (100.0%), Computers & Mathematics (100.0%), and Legal Services & Support (100.0%), while the most female-oriented occupations are Education, Arts & Media (100.0%), Education Instruction & Library (100.0%), and Arts, Media & Entertainment (100.0%).
| Occupation | Male | Female |
| Management | 5 (35.7%) | 9 (64.3%) |
| Business & Financial | 6 (85.7%) | 1 (14.3%) |
| Computers, Engineering & Science | 14 (100.0%) | 0 (0.0%) |
| Computers & Mathematics | 14 (100.0%) | 0 (0.0%) |
| Architecture & Engineering | 0 (0.0%) | 0 (0.0%) |
| Life, Physical & Social Science | 0 (0.0%) | 0 (0.0%) |
| Community & Social Service | 3 (17.6%) | 14 (82.4%) |
| Education, Arts & Media | 0 (0.0%) | 1 (100.0%) |
| Legal Services & Support | 3 (100.0%) | 0 (0.0%) |
| Education Instruction & Library | 0 (0.0%) | 6 (100.0%) |
| Arts, Media & Entertainment | 0 (0.0%) | 7 (100.0%) |
| Health Diagnosing & Treating | 2 (100.0%) | 0 (0.0%) |
| Health Technologists | 2 (100.0%) | 0 (0.0%) |
| Total (Category) | 30 (55.6%) | 24 (44.4%) |
| Total (Overall) | 159 (63.9%) | 90 (36.1%) |
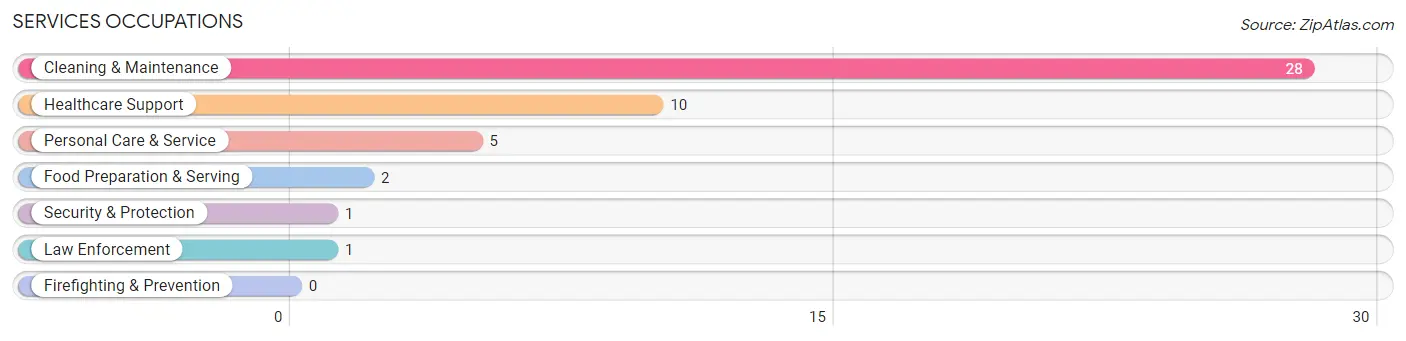
Services Occupations
The most common Services occupations in Pink Hill are Cleaning & Maintenance (28 | 11.2%), Healthcare Support (10 | 4.0%), Personal Care & Service (5 | 2.0%), Food Preparation & Serving (2 | 0.8%), and Security & Protection (1 | 0.4%).
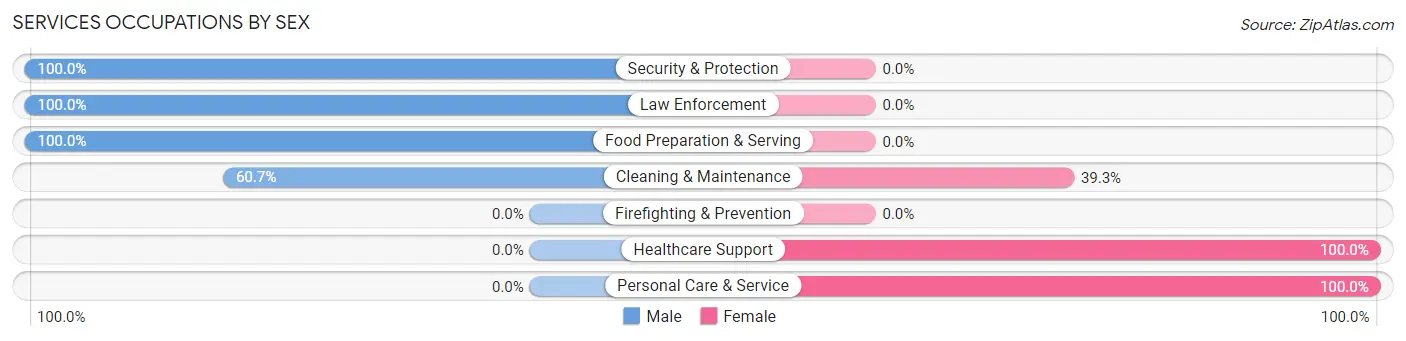
Services Occupations by Sex
Within the Services occupations in Pink Hill, the most male-oriented occupations are Security & Protection (100.0%), Law Enforcement (100.0%), and Food Preparation & Serving (100.0%), while the most female-oriented occupations are Healthcare Support (100.0%), Personal Care & Service (100.0%), and Cleaning & Maintenance (39.3%).
| Occupation | Male | Female |
| Healthcare Support | 0 (0.0%) | 10 (100.0%) |
| Security & Protection | 1 (100.0%) | 0 (0.0%) |
| Firefighting & Prevention | 0 (0.0%) | 0 (0.0%) |
| Law Enforcement | 1 (100.0%) | 0 (0.0%) |
| Food Preparation & Serving | 2 (100.0%) | 0 (0.0%) |
| Cleaning & Maintenance | 17 (60.7%) | 11 (39.3%) |
| Personal Care & Service | 0 (0.0%) | 5 (100.0%) |
| Total (Category) | 20 (43.5%) | 26 (56.5%) |
| Total (Overall) | 159 (63.9%) | 90 (36.1%) |
Sales and Office Occupations
The most common Sales and Office occupations in Pink Hill are Office & Administration (40 | 16.1%), and Sales & Related (15 | 6.0%).
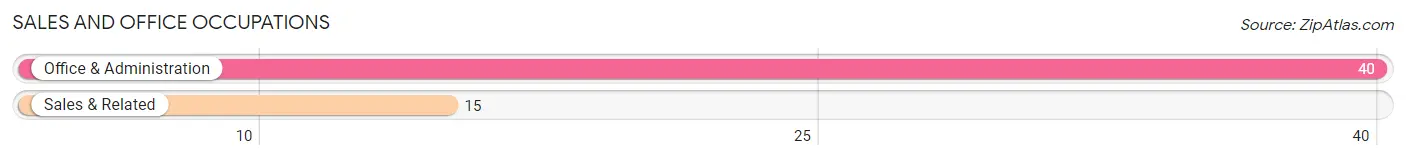
Sales and Office Occupations by Sex
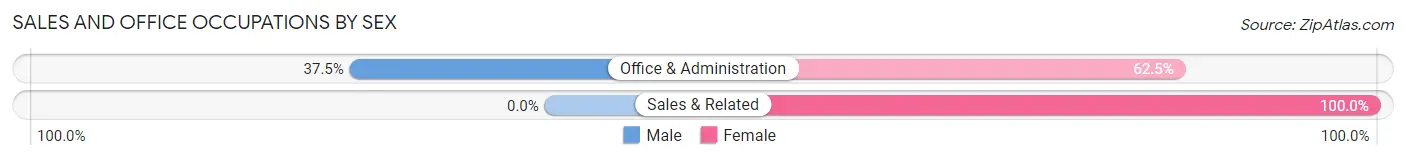
| Occupation | Male | Female |
| Sales & Related | 0 (0.0%) | 15 (100.0%) |
| Office & Administration | 15 (37.5%) | 25 (62.5%) |
| Total (Category) | 15 (27.3%) | 40 (72.7%) |
| Total (Overall) | 159 (63.9%) | 90 (36.1%) |
Natural Resources, Construction and Maintenance Occupations
The most common Natural Resources, Construction and Maintenance occupations in Pink Hill are Farming, Fishing & Forestry (33 | 13.3%), Construction & Extraction (29 | 11.7%), and Installation, Maintenance & Repair (3 | 1.2%).
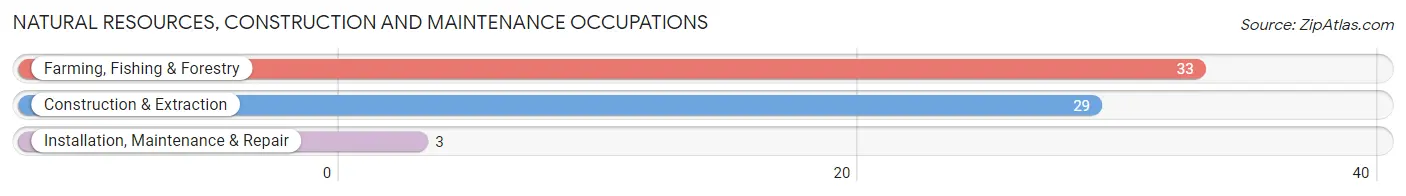
Natural Resources, Construction and Maintenance Occupations by Sex
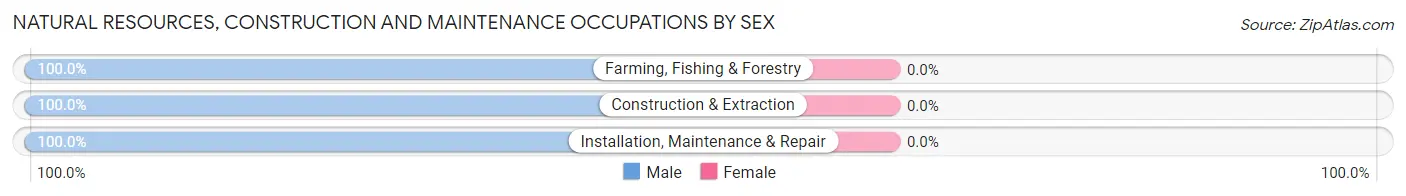
| Occupation | Male | Female |
| Farming, Fishing & Forestry | 33 (100.0%) | 0 (0.0%) |
| Construction & Extraction | 29 (100.0%) | 0 (0.0%) |
| Installation, Maintenance & Repair | 3 (100.0%) | 0 (0.0%) |
| Total (Category) | 65 (100.0%) | 0 (0.0%) |
| Total (Overall) | 159 (63.9%) | 90 (36.1%) |
Production, Transportation and Moving Occupations
The most common Production, Transportation and Moving occupations in Pink Hill are Production (17 | 6.8%), and Transportation (12 | 4.8%).
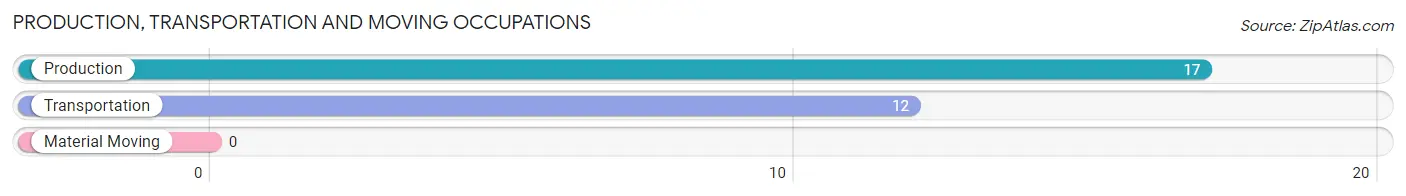
Production, Transportation and Moving Occupations by Sex
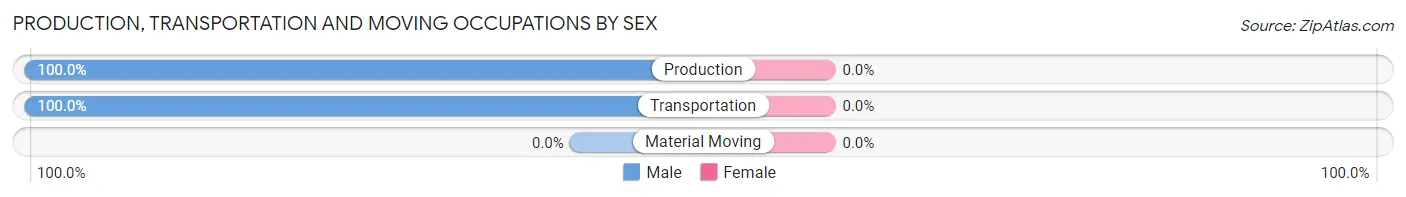
| Occupation | Male | Female |
| Production | 17 (100.0%) | 0 (0.0%) |
| Transportation | 12 (100.0%) | 0 (0.0%) |
| Material Moving | 0 (0.0%) | 0 (0.0%) |
| Total (Category) | 29 (100.0%) | 0 (0.0%) |
| Total (Overall) | 159 (63.9%) | 90 (36.1%) |
Employment Industries by Sex in Pink Hill
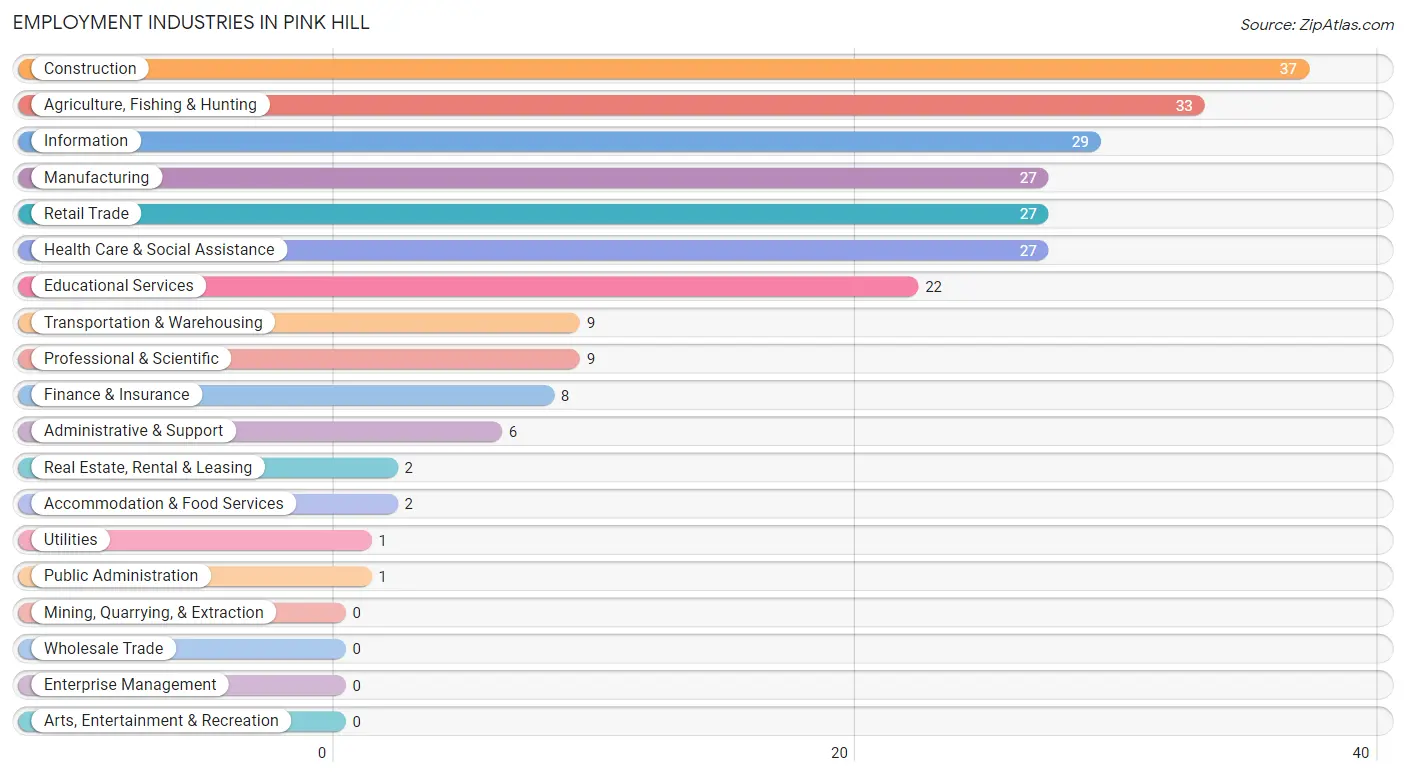
Employment Industries in Pink Hill
The major employment industries in Pink Hill include Construction (37 | 14.9%), Agriculture, Fishing & Hunting (33 | 13.3%), Information (29 | 11.7%), Manufacturing (27 | 10.8%), and Retail Trade (27 | 10.8%).
Employment Industries by Sex in Pink Hill
The Pink Hill industries that see more men than women are Agriculture, Fishing & Hunting (100.0%), Construction (100.0%), and Utilities (100.0%), whereas the industries that tend to have a higher number of women are Finance & Insurance (100.0%), Real Estate, Rental & Leasing (100.0%), and Health Care & Social Assistance (100.0%).
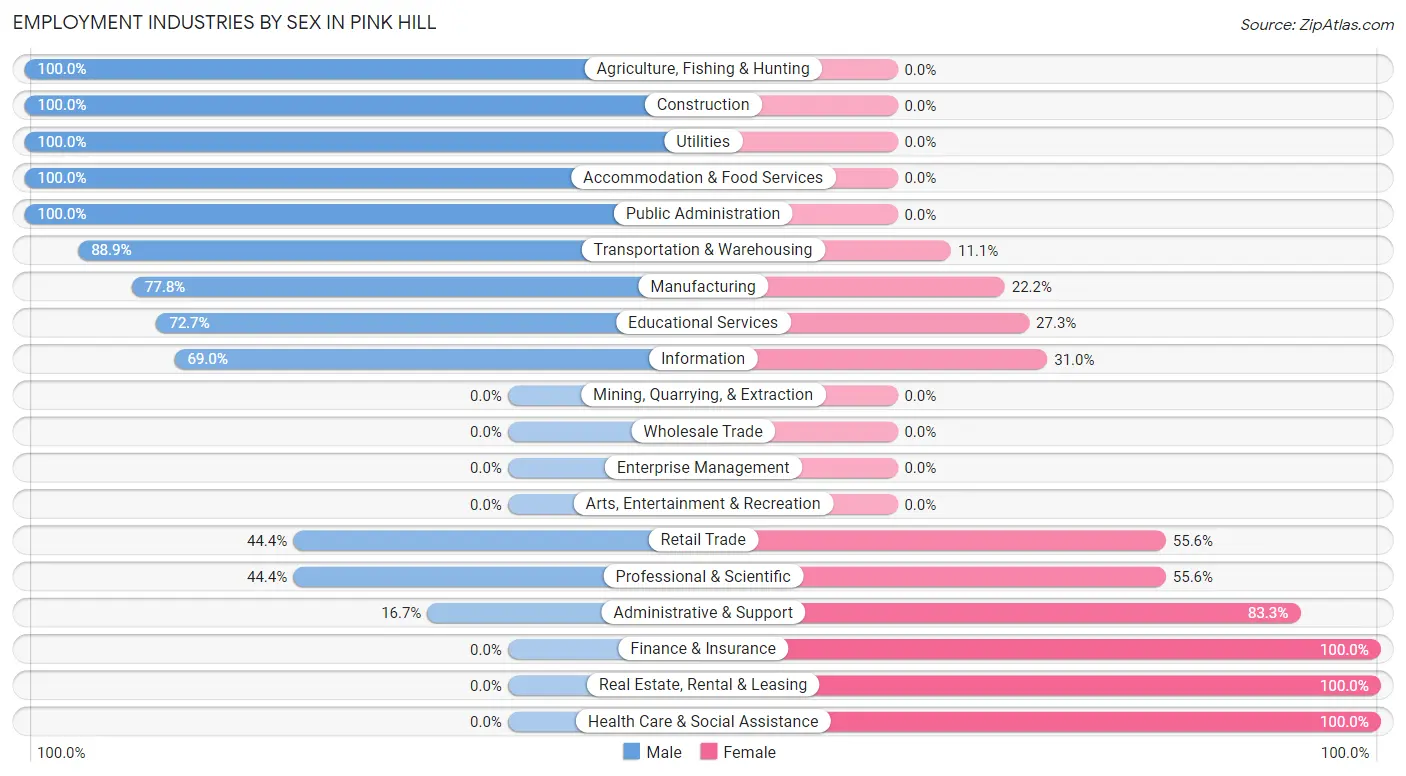
| Industry | Male | Female |
| Agriculture, Fishing & Hunting | 33 (100.0%) | 0 (0.0%) |
| Mining, Quarrying, & Extraction | 0 (0.0%) | 0 (0.0%) |
| Construction | 37 (100.0%) | 0 (0.0%) |
| Manufacturing | 21 (77.8%) | 6 (22.2%) |
| Wholesale Trade | 0 (0.0%) | 0 (0.0%) |
| Retail Trade | 12 (44.4%) | 15 (55.6%) |
| Transportation & Warehousing | 8 (88.9%) | 1 (11.1%) |
| Utilities | 1 (100.0%) | 0 (0.0%) |
| Information | 20 (69.0%) | 9 (31.0%) |
| Finance & Insurance | 0 (0.0%) | 8 (100.0%) |
| Real Estate, Rental & Leasing | 0 (0.0%) | 2 (100.0%) |
| Professional & Scientific | 4 (44.4%) | 5 (55.6%) |
| Enterprise Management | 0 (0.0%) | 0 (0.0%) |
| Administrative & Support | 1 (16.7%) | 5 (83.3%) |
| Educational Services | 16 (72.7%) | 6 (27.3%) |
| Health Care & Social Assistance | 0 (0.0%) | 27 (100.0%) |
| Arts, Entertainment & Recreation | 0 (0.0%) | 0 (0.0%) |
| Accommodation & Food Services | 2 (100.0%) | 0 (0.0%) |
| Public Administration | 1 (100.0%) | 0 (0.0%) |
| Total | 159 (63.9%) | 90 (36.1%) |
Education in Pink Hill
School Enrollment in Pink Hill
The most common levels of schooling among the 97 students in Pink Hill are high school (38 | 39.2%), middle school (24 | 24.7%), and elementary school (18 | 18.6%).
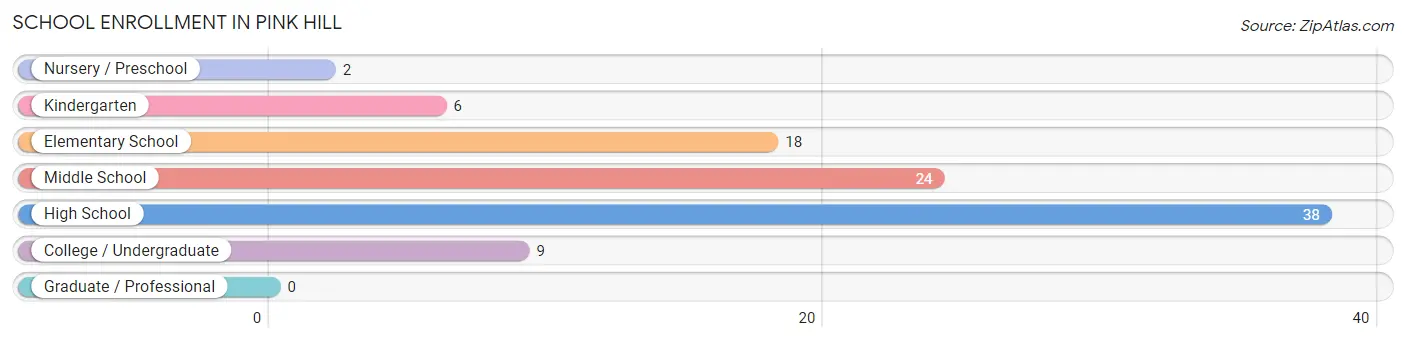
| School Level | # Students | % Students |
| Nursery / Preschool | 2 | 2.1% |
| Kindergarten | 6 | 6.2% |
| Elementary School | 18 | 18.6% |
| Middle School | 24 | 24.7% |
| High School | 38 | 39.2% |
| College / Undergraduate | 9 | 9.3% |
| Graduate / Professional | 0 | 0.0% |
| Total | 97 | 100.0% |
School Enrollment by Age by Funding Source in Pink Hill
Out of a total of 97 students who are enrolled in schools in Pink Hill, 30 (30.9%) attend a private institution, while the remaining 67 (69.1%) are enrolled in public schools. The age group of 3 to 4 year olds has the highest likelihood of being enrolled in private schools, with 2 (100.0% in the age bracket) enrolled. Conversely, the age group of 5 to 9 year old has the lowest likelihood of being enrolled in a private school, with 16 (100.0% in the age bracket) attending a public institution.
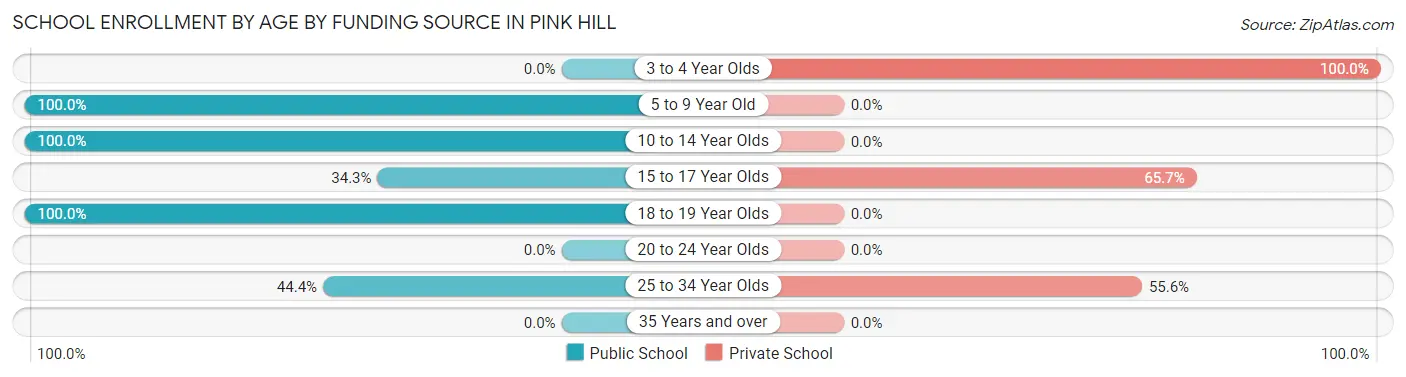
| Age Bracket | Public School | Private School |
| 3 to 4 Year Olds | 0 (0.0%) | 2 (100.0%) |
| 5 to 9 Year Old | 16 (100.0%) | 0 (0.0%) |
| 10 to 14 Year Olds | 32 (100.0%) | 0 (0.0%) |
| 15 to 17 Year Olds | 12 (34.3%) | 23 (65.7%) |
| 18 to 19 Year Olds | 3 (100.0%) | 0 (0.0%) |
| 20 to 24 Year Olds | 0 (0.0%) | 0 (0.0%) |
| 25 to 34 Year Olds | 4 (44.4%) | 5 (55.6%) |
| 35 Years and over | 0 (0.0%) | 0 (0.0%) |
| Total | 67 (69.1%) | 30 (30.9%) |
Educational Attainment by Field of Study in Pink Hill
Education (12 | 22.2%), business (11 | 20.4%), social sciences (9 | 16.7%), bio, nature & agricultural (7 | 13.0%), and science & technology (6 | 11.1%) are the most common fields of study among 54 individuals in Pink Hill who have obtained a bachelor's degree or higher.
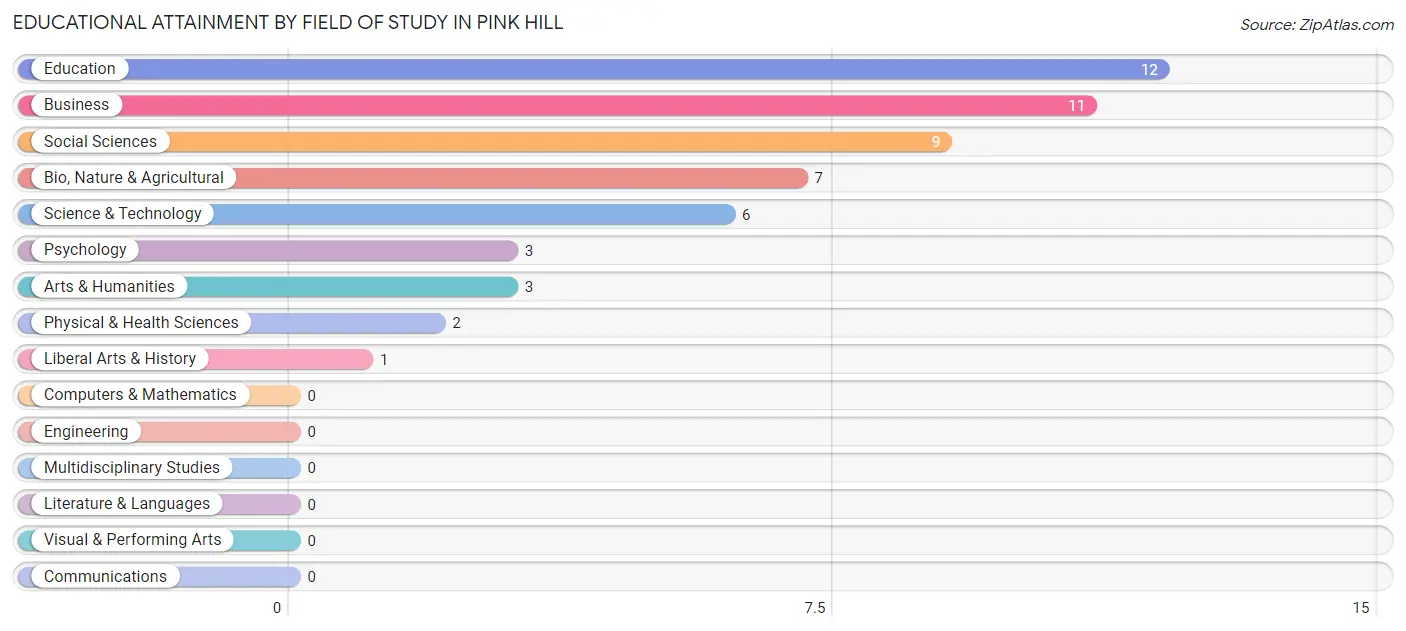
| Field of Study | # Graduates | % Graduates |
| Computers & Mathematics | 0 | 0.0% |
| Bio, Nature & Agricultural | 7 | 13.0% |
| Physical & Health Sciences | 2 | 3.7% |
| Psychology | 3 | 5.6% |
| Social Sciences | 9 | 16.7% |
| Engineering | 0 | 0.0% |
| Multidisciplinary Studies | 0 | 0.0% |
| Science & Technology | 6 | 11.1% |
| Business | 11 | 20.4% |
| Education | 12 | 22.2% |
| Literature & Languages | 0 | 0.0% |
| Liberal Arts & History | 1 | 1.8% |
| Visual & Performing Arts | 0 | 0.0% |
| Communications | 0 | 0.0% |
| Arts & Humanities | 3 | 5.6% |
| Total | 54 | 100.0% |
Transportation & Commute in Pink Hill
Vehicle Availability by Sex in Pink Hill
The most prevalent vehicle ownership categories in Pink Hill are males with 1 vehicle (58, accounting for 42.3%) and females with 1 vehicle (16, making up 64.4%).
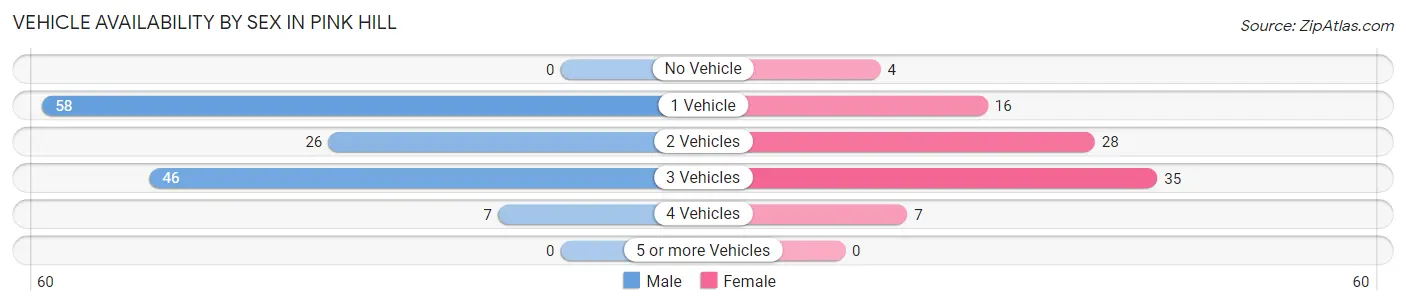
| Vehicles Available | Male | Female |
| No Vehicle | 0 (0.0%) | 4 (4.4%) |
| 1 Vehicle | 58 (42.3%) | 16 (17.8%) |
| 2 Vehicles | 26 (19.0%) | 28 (31.1%) |
| 3 Vehicles | 46 (33.6%) | 35 (38.9%) |
| 4 Vehicles | 7 (5.1%) | 7 (7.8%) |
| 5 or more Vehicles | 0 (0.0%) | 0 (0.0%) |
| Total | 137 (100.0%) | 90 (100.0%) |
Commute Time in Pink Hill
The most frequently occuring commute durations in Pink Hill are 15 to 19 minutes (49 commuters, 22.3%), 40 to 44 minutes (39 commuters, 17.7%), and 30 to 34 minutes (32 commuters, 14.5%).
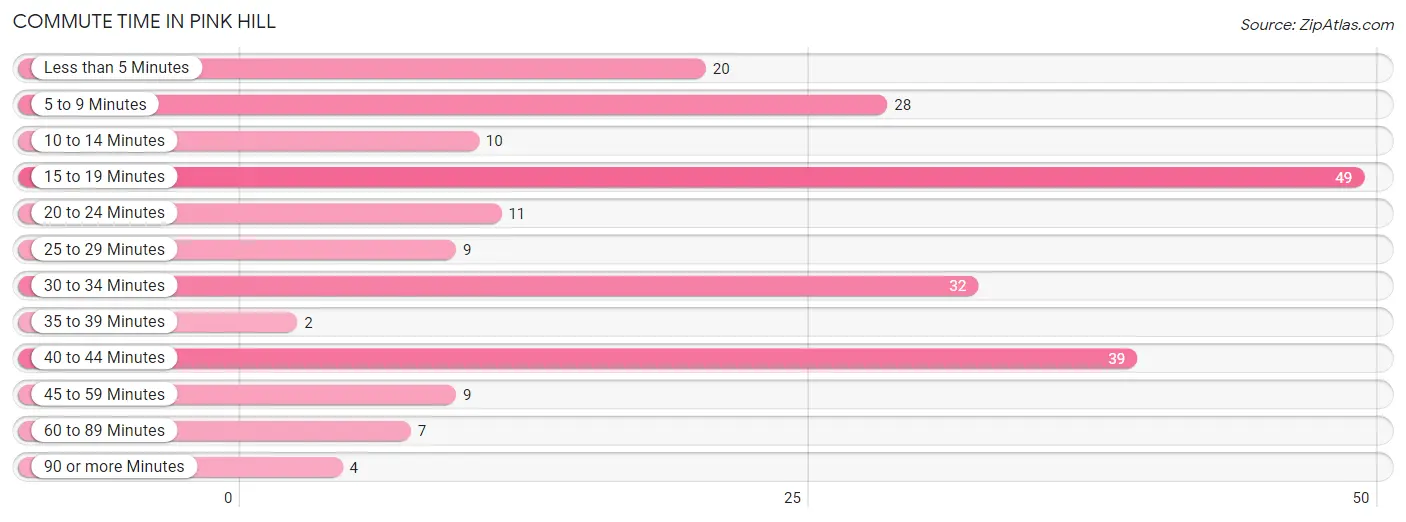
| Commute Time | # Commuters | % Commuters |
| Less than 5 Minutes | 20 | 9.1% |
| 5 to 9 Minutes | 28 | 12.7% |
| 10 to 14 Minutes | 10 | 4.5% |
| 15 to 19 Minutes | 49 | 22.3% |
| 20 to 24 Minutes | 11 | 5.0% |
| 25 to 29 Minutes | 9 | 4.1% |
| 30 to 34 Minutes | 32 | 14.5% |
| 35 to 39 Minutes | 2 | 0.9% |
| 40 to 44 Minutes | 39 | 17.7% |
| 45 to 59 Minutes | 9 | 4.1% |
| 60 to 89 Minutes | 7 | 3.2% |
| 90 or more Minutes | 4 | 1.8% |
Commute Time by Sex in Pink Hill
The most common commute times in Pink Hill are 15 to 19 minutes (43 commuters, 32.6%) for males and 5 to 9 minutes (24 commuters, 27.3%) for females.
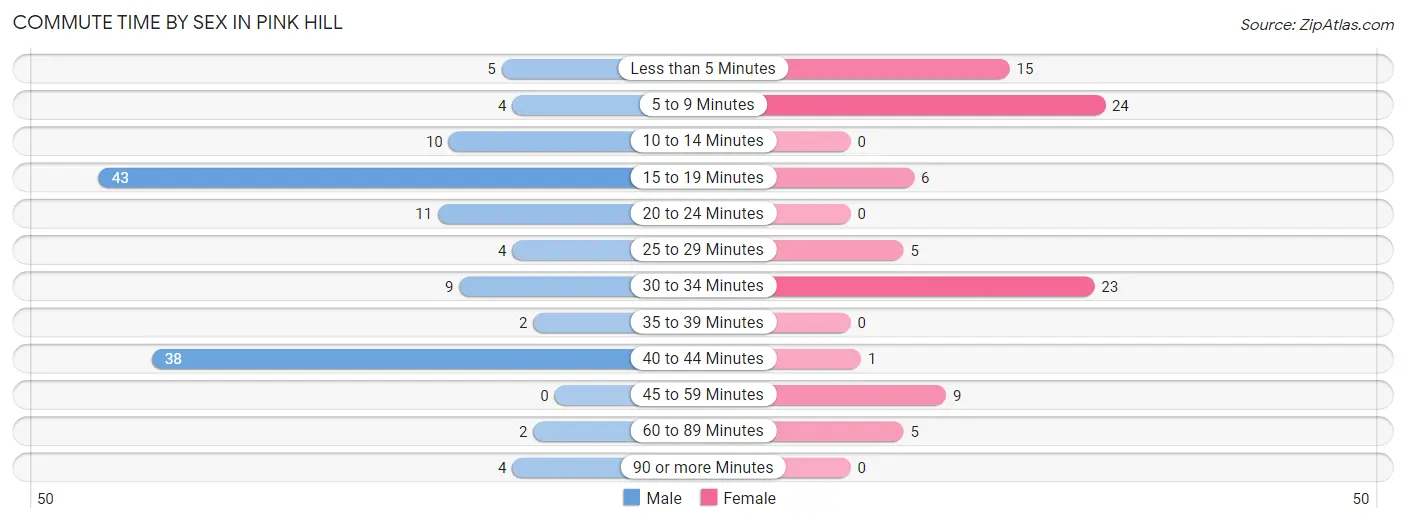
| Commute Time | Male | Female |
| Less than 5 Minutes | 5 (3.8%) | 15 (17.1%) |
| 5 to 9 Minutes | 4 (3.0%) | 24 (27.3%) |
| 10 to 14 Minutes | 10 (7.6%) | 0 (0.0%) |
| 15 to 19 Minutes | 43 (32.6%) | 6 (6.8%) |
| 20 to 24 Minutes | 11 (8.3%) | 0 (0.0%) |
| 25 to 29 Minutes | 4 (3.0%) | 5 (5.7%) |
| 30 to 34 Minutes | 9 (6.8%) | 23 (26.1%) |
| 35 to 39 Minutes | 2 (1.5%) | 0 (0.0%) |
| 40 to 44 Minutes | 38 (28.8%) | 1 (1.1%) |
| 45 to 59 Minutes | 0 (0.0%) | 9 (10.2%) |
| 60 to 89 Minutes | 2 (1.5%) | 5 (5.7%) |
| 90 or more Minutes | 4 (3.0%) | 0 (0.0%) |
Time of Departure to Work by Sex in Pink Hill
The most frequent times of departure to work in Pink Hill are 5:00 AM to 5:29 AM (37, 28.0%) for males and 4:00 PM to 11:59 PM (21, 23.9%) for females.
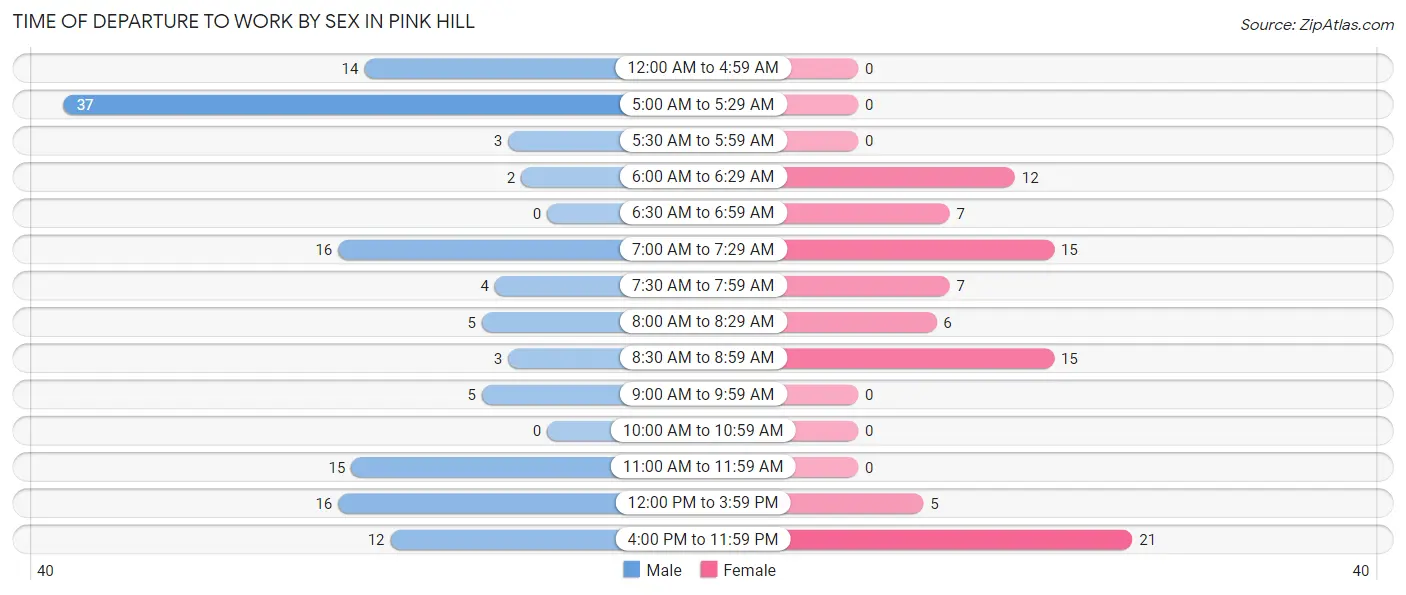
| Time of Departure | Male | Female |
| 12:00 AM to 4:59 AM | 14 (10.6%) | 0 (0.0%) |
| 5:00 AM to 5:29 AM | 37 (28.0%) | 0 (0.0%) |
| 5:30 AM to 5:59 AM | 3 (2.3%) | 0 (0.0%) |
| 6:00 AM to 6:29 AM | 2 (1.5%) | 12 (13.6%) |
| 6:30 AM to 6:59 AM | 0 (0.0%) | 7 (8.0%) |
| 7:00 AM to 7:29 AM | 16 (12.1%) | 15 (17.1%) |
| 7:30 AM to 7:59 AM | 4 (3.0%) | 7 (8.0%) |
| 8:00 AM to 8:29 AM | 5 (3.8%) | 6 (6.8%) |
| 8:30 AM to 8:59 AM | 3 (2.3%) | 15 (17.1%) |
| 9:00 AM to 9:59 AM | 5 (3.8%) | 0 (0.0%) |
| 10:00 AM to 10:59 AM | 0 (0.0%) | 0 (0.0%) |
| 11:00 AM to 11:59 AM | 15 (11.4%) | 0 (0.0%) |
| 12:00 PM to 3:59 PM | 16 (12.1%) | 5 (5.7%) |
| 4:00 PM to 11:59 PM | 12 (9.1%) | 21 (23.9%) |
| Total | 132 (100.0%) | 88 (100.0%) |
Housing Occupancy in Pink Hill
Occupancy by Ownership in Pink Hill
Of the total 241 dwellings in Pink Hill, owner-occupied units account for 126 (52.3%), while renter-occupied units make up 115 (47.7%).
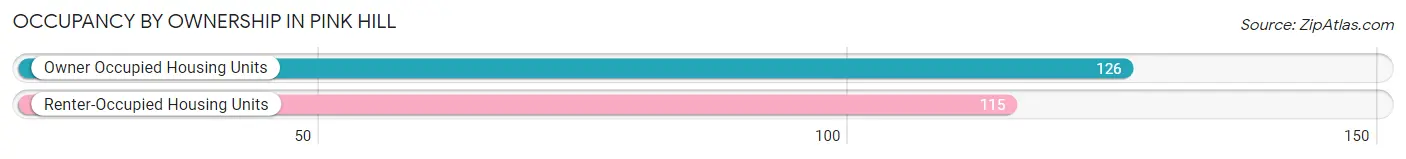
| Occupancy | # Housing Units | % Housing Units |
| Owner Occupied Housing Units | 126 | 52.3% |
| Renter-Occupied Housing Units | 115 | 47.7% |
| Total Occupied Housing Units | 241 | 100.0% |
Occupancy by Household Size in Pink Hill
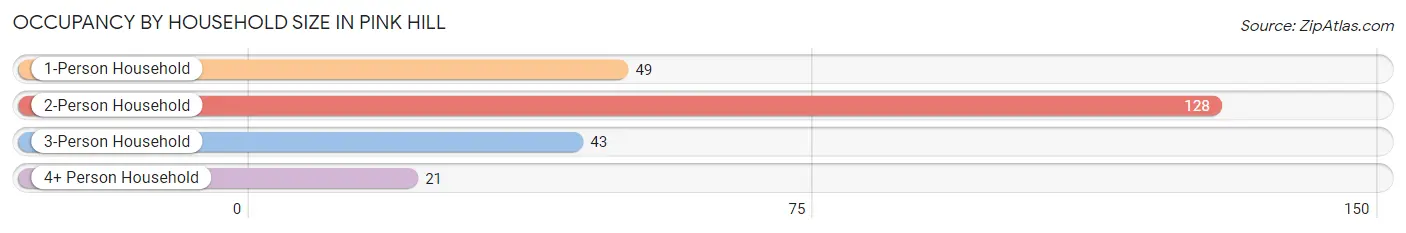
| Household Size | # Housing Units | % Housing Units |
| 1-Person Household | 49 | 20.3% |
| 2-Person Household | 128 | 53.1% |
| 3-Person Household | 43 | 17.8% |
| 4+ Person Household | 21 | 8.7% |
| Total Housing Units | 241 | 100.0% |
Occupancy by Ownership by Household Size in Pink Hill
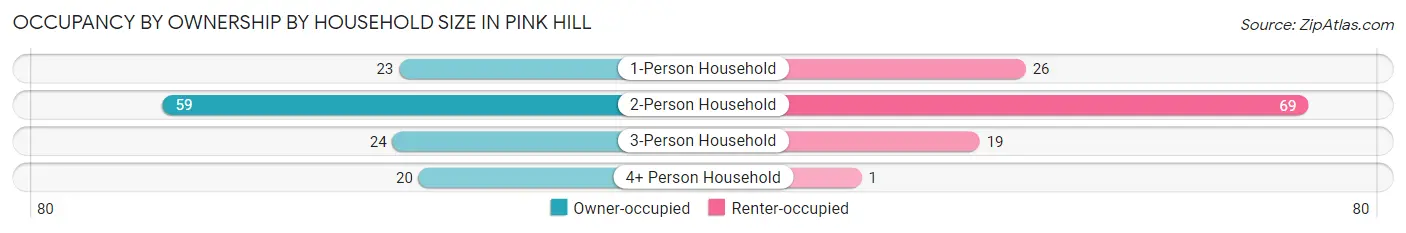
| Household Size | Owner-occupied | Renter-occupied |
| 1-Person Household | 23 (46.9%) | 26 (53.1%) |
| 2-Person Household | 59 (46.1%) | 69 (53.9%) |
| 3-Person Household | 24 (55.8%) | 19 (44.2%) |
| 4+ Person Household | 20 (95.2%) | 1 (4.8%) |
| Total Housing Units | 126 (52.3%) | 115 (47.7%) |
Occupancy by Educational Attainment in Pink Hill
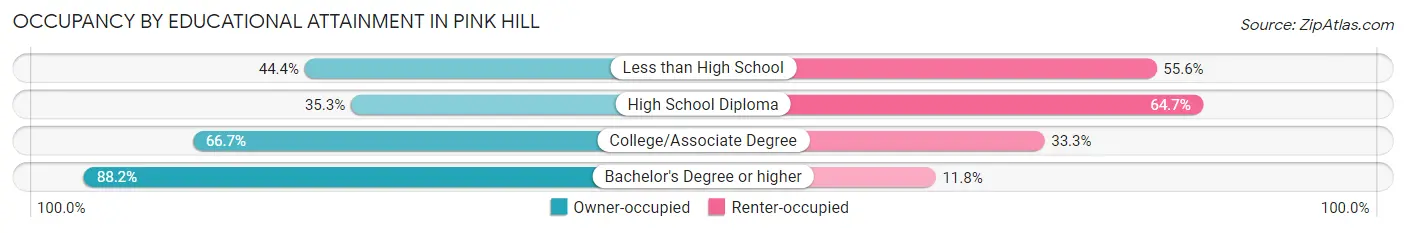
| Household Size | Owner-occupied | Renter-occupied |
| Less than High School | 20 (44.4%) | 25 (55.6%) |
| High School Diploma | 36 (35.3%) | 66 (64.7%) |
| College/Associate Degree | 40 (66.7%) | 20 (33.3%) |
| Bachelor's Degree or higher | 30 (88.2%) | 4 (11.8%) |
Occupancy by Age of Householder in Pink Hill
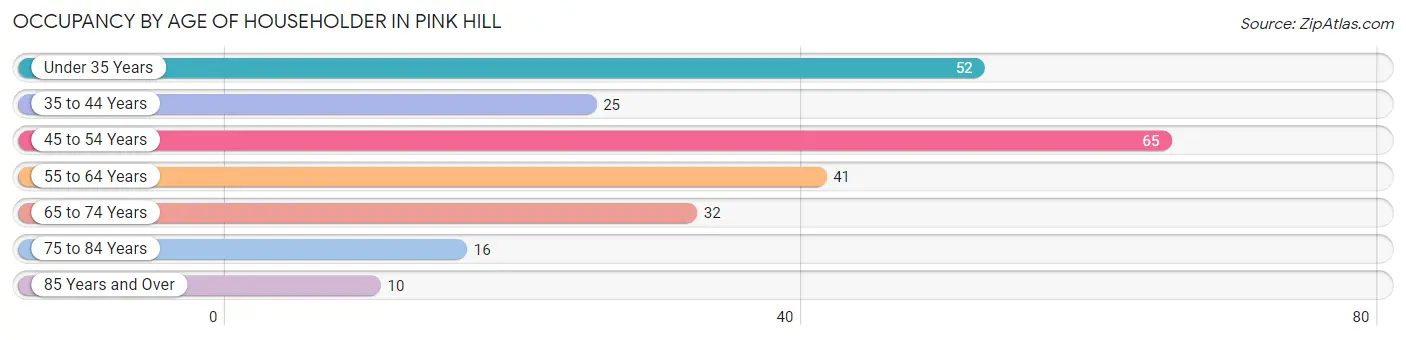
| Age Bracket | # Households | % Households |
| Under 35 Years | 52 | 21.6% |
| 35 to 44 Years | 25 | 10.4% |
| 45 to 54 Years | 65 | 27.0% |
| 55 to 64 Years | 41 | 17.0% |
| 65 to 74 Years | 32 | 13.3% |
| 75 to 84 Years | 16 | 6.6% |
| 85 Years and Over | 10 | 4.2% |
| Total | 241 | 100.0% |
Housing Finances in Pink Hill
Median Income by Occupancy in Pink Hill
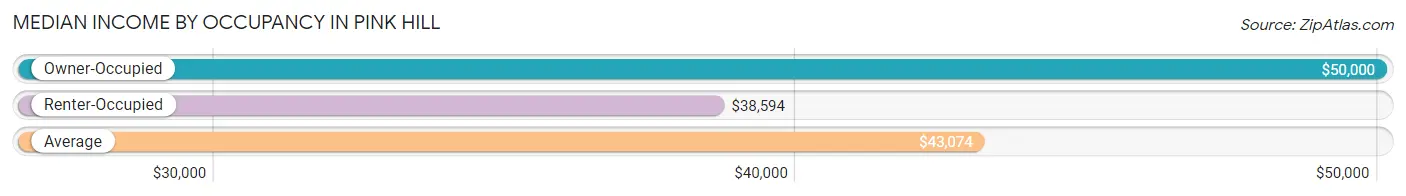
| Occupancy Type | # Households | Median Income |
| Owner-Occupied | 126 (52.3%) | $50,000 |
| Renter-Occupied | 115 (47.7%) | $38,594 |
| Average | 241 (100.0%) | $43,074 |
Occupancy by Householder Income Bracket in Pink Hill
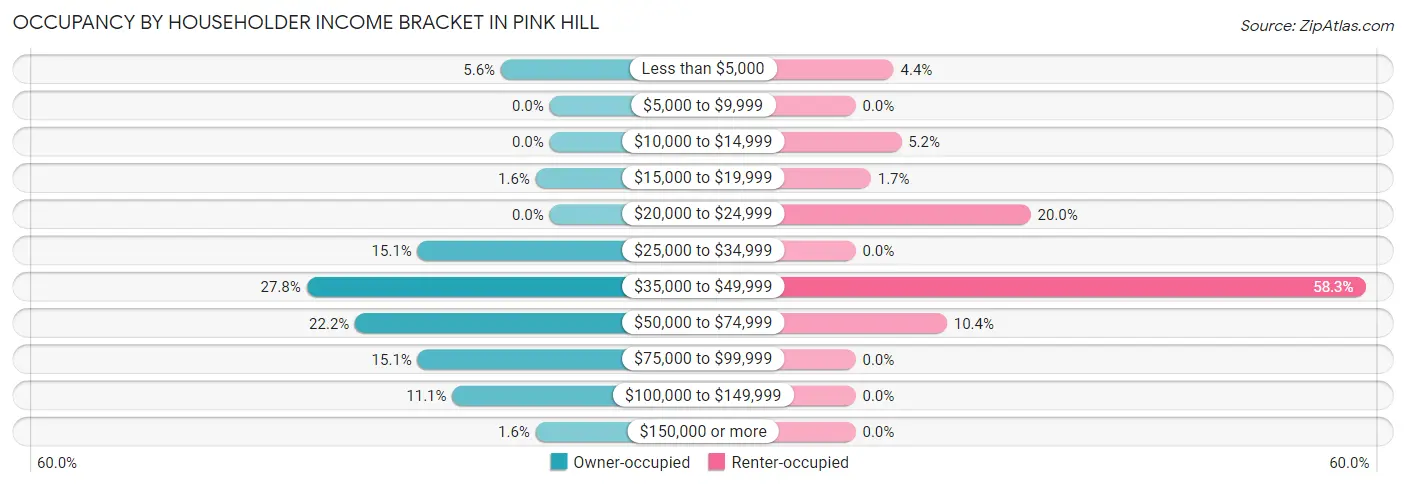
| Income Bracket | Owner-occupied | Renter-occupied |
| Less than $5,000 | 7 (5.6%) | 5 (4.3%) |
| $5,000 to $9,999 | 0 (0.0%) | 0 (0.0%) |
| $10,000 to $14,999 | 0 (0.0%) | 6 (5.2%) |
| $15,000 to $19,999 | 2 (1.6%) | 2 (1.7%) |
| $20,000 to $24,999 | 0 (0.0%) | 23 (20.0%) |
| $25,000 to $34,999 | 19 (15.1%) | 0 (0.0%) |
| $35,000 to $49,999 | 35 (27.8%) | 67 (58.3%) |
| $50,000 to $74,999 | 28 (22.2%) | 12 (10.4%) |
| $75,000 to $99,999 | 19 (15.1%) | 0 (0.0%) |
| $100,000 to $149,999 | 14 (11.1%) | 0 (0.0%) |
| $150,000 or more | 2 (1.6%) | 0 (0.0%) |
| Total | 126 (100.0%) | 115 (100.0%) |
Monthly Housing Cost Tiers in Pink Hill
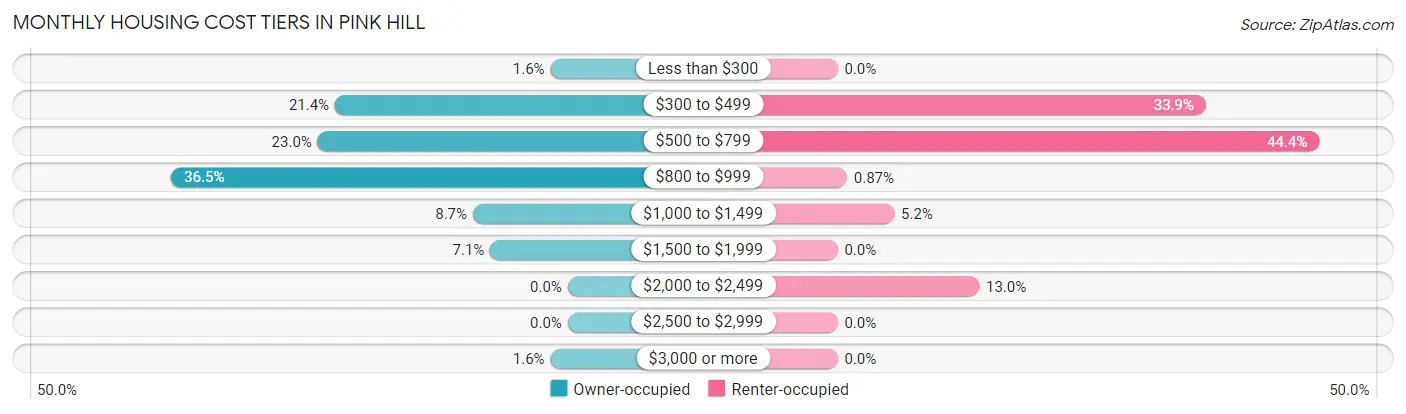
| Monthly Cost | Owner-occupied | Renter-occupied |
| Less than $300 | 2 (1.6%) | 0 (0.0%) |
| $300 to $499 | 27 (21.4%) | 39 (33.9%) |
| $500 to $799 | 29 (23.0%) | 51 (44.4%) |
| $800 to $999 | 46 (36.5%) | 1 (0.9%) |
| $1,000 to $1,499 | 11 (8.7%) | 6 (5.2%) |
| $1,500 to $1,999 | 9 (7.1%) | 0 (0.0%) |
| $2,000 to $2,499 | 0 (0.0%) | 15 (13.0%) |
| $2,500 to $2,999 | 0 (0.0%) | 0 (0.0%) |
| $3,000 or more | 2 (1.6%) | 0 (0.0%) |
| Total | 126 (100.0%) | 115 (100.0%) |
Physical Housing Characteristics in Pink Hill
Housing Structures in Pink Hill
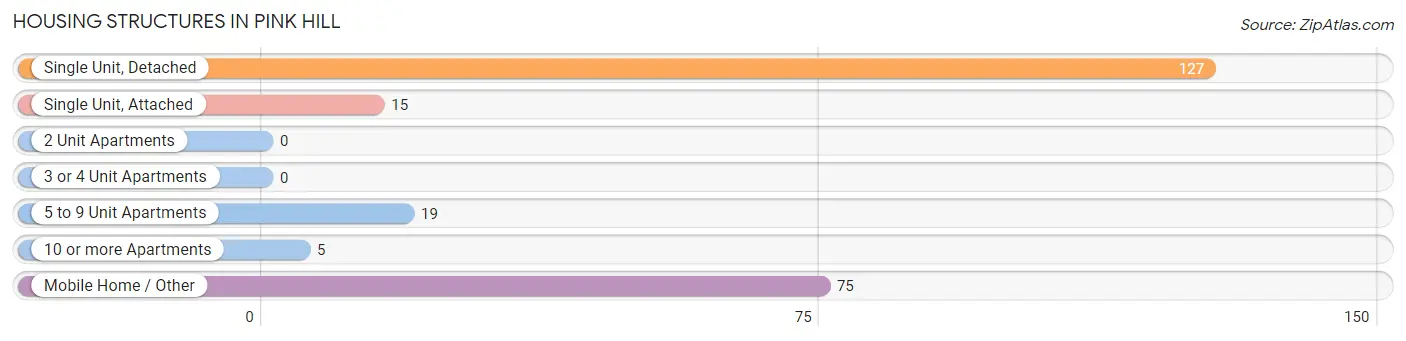
| Structure Type | # Housing Units | % Housing Units |
| Single Unit, Detached | 127 | 52.7% |
| Single Unit, Attached | 15 | 6.2% |
| 2 Unit Apartments | 0 | 0.0% |
| 3 or 4 Unit Apartments | 0 | 0.0% |
| 5 to 9 Unit Apartments | 19 | 7.9% |
| 10 or more Apartments | 5 | 2.1% |
| Mobile Home / Other | 75 | 31.1% |
| Total | 241 | 100.0% |
Housing Structures by Occupancy in Pink Hill
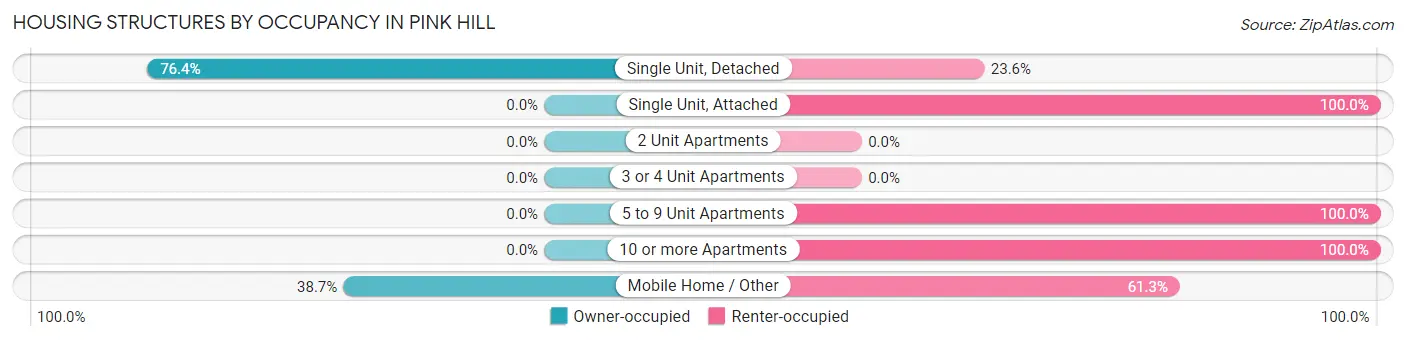
| Structure Type | Owner-occupied | Renter-occupied |
| Single Unit, Detached | 97 (76.4%) | 30 (23.6%) |
| Single Unit, Attached | 0 (0.0%) | 15 (100.0%) |
| 2 Unit Apartments | 0 (0.0%) | 0 (0.0%) |
| 3 or 4 Unit Apartments | 0 (0.0%) | 0 (0.0%) |
| 5 to 9 Unit Apartments | 0 (0.0%) | 19 (100.0%) |
| 10 or more Apartments | 0 (0.0%) | 5 (100.0%) |
| Mobile Home / Other | 29 (38.7%) | 46 (61.3%) |
| Total | 126 (52.3%) | 115 (47.7%) |
Housing Structures by Number of Rooms in Pink Hill
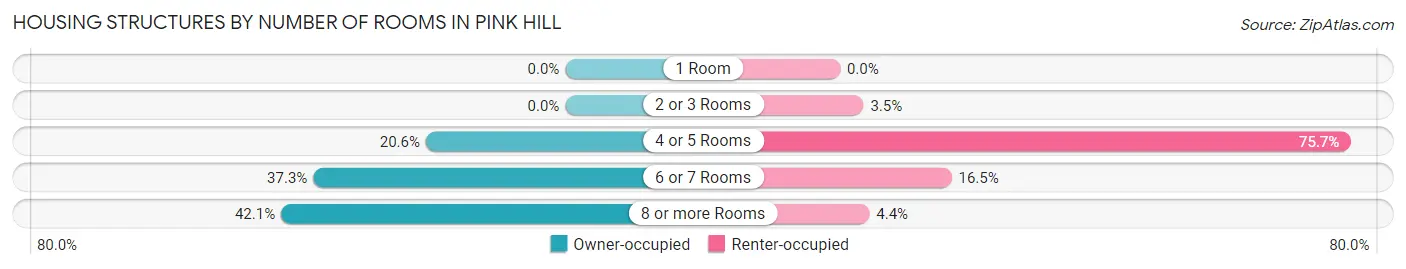
| Number of Rooms | Owner-occupied | Renter-occupied |
| 1 Room | 0 (0.0%) | 0 (0.0%) |
| 2 or 3 Rooms | 0 (0.0%) | 4 (3.5%) |
| 4 or 5 Rooms | 26 (20.6%) | 87 (75.6%) |
| 6 or 7 Rooms | 47 (37.3%) | 19 (16.5%) |
| 8 or more Rooms | 53 (42.1%) | 5 (4.3%) |
| Total | 126 (100.0%) | 115 (100.0%) |
Housing Structure by Heating Type in Pink Hill
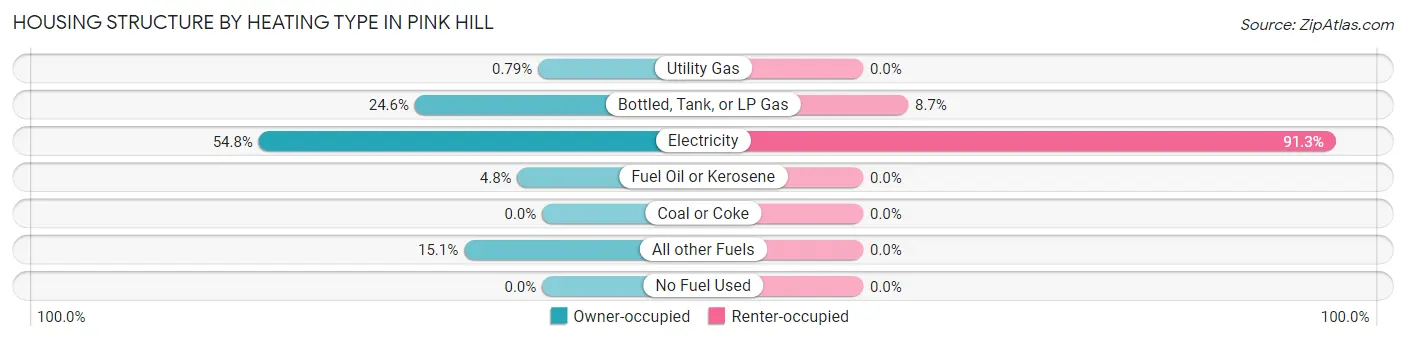
| Heating Type | Owner-occupied | Renter-occupied |
| Utility Gas | 1 (0.8%) | 0 (0.0%) |
| Bottled, Tank, or LP Gas | 31 (24.6%) | 10 (8.7%) |
| Electricity | 69 (54.8%) | 105 (91.3%) |
| Fuel Oil or Kerosene | 6 (4.8%) | 0 (0.0%) |
| Coal or Coke | 0 (0.0%) | 0 (0.0%) |
| All other Fuels | 19 (15.1%) | 0 (0.0%) |
| No Fuel Used | 0 (0.0%) | 0 (0.0%) |
| Total | 126 (100.0%) | 115 (100.0%) |
Household Vehicle Usage in Pink Hill
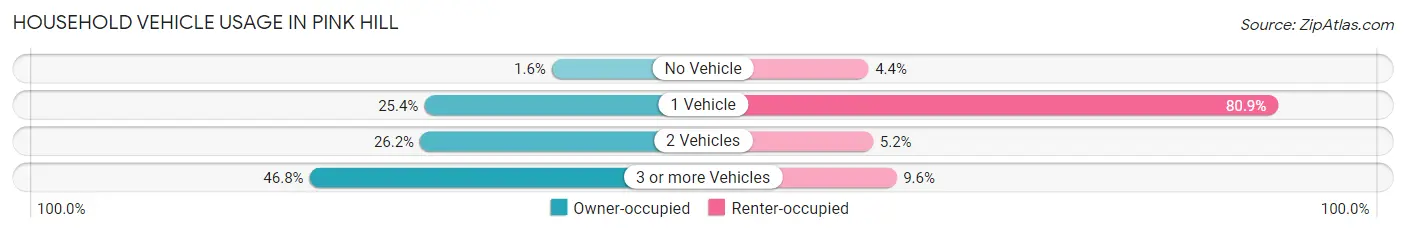
| Vehicles per Household | Owner-occupied | Renter-occupied |
| No Vehicle | 2 (1.6%) | 5 (4.3%) |
| 1 Vehicle | 32 (25.4%) | 93 (80.9%) |
| 2 Vehicles | 33 (26.2%) | 6 (5.2%) |
| 3 or more Vehicles | 59 (46.8%) | 11 (9.6%) |
| Total | 126 (100.0%) | 115 (100.0%) |
Real Estate & Mortgages in Pink Hill
Real Estate and Mortgage Overview in Pink Hill
| Characteristic | Without Mortgage | With Mortgage |
| Housing Units | 66 | 60 |
| Median Property Value | $73,300 | $0 |
| Median Household Income | $46,389 | $2 |
| Monthly Housing Costs | $525 | $2 |
| Real Estate Taxes | $838 | $0 |
Property Value by Mortgage Status in Pink Hill
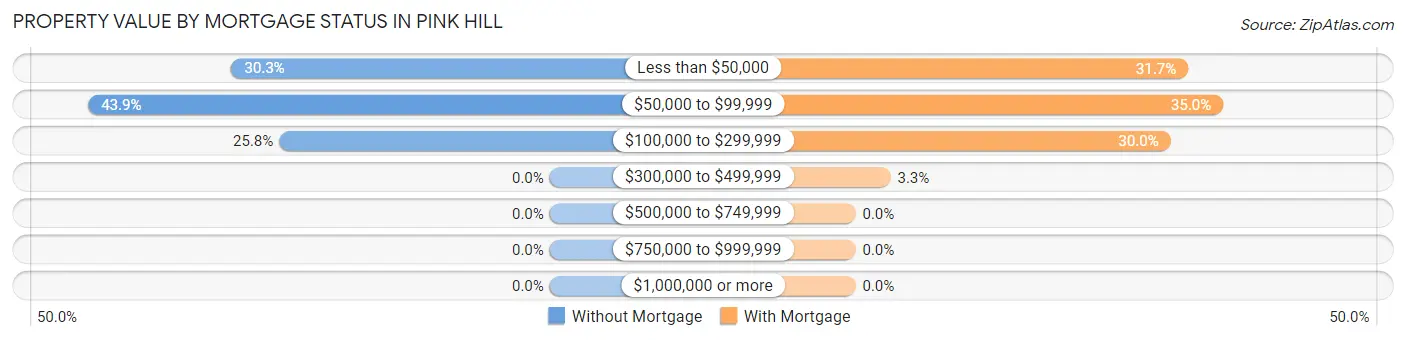
| Property Value | Without Mortgage | With Mortgage |
| Less than $50,000 | 20 (30.3%) | 19 (31.7%) |
| $50,000 to $99,999 | 29 (43.9%) | 21 (35.0%) |
| $100,000 to $299,999 | 17 (25.8%) | 18 (30.0%) |
| $300,000 to $499,999 | 0 (0.0%) | 2 (3.3%) |
| $500,000 to $749,999 | 0 (0.0%) | 0 (0.0%) |
| $750,000 to $999,999 | 0 (0.0%) | 0 (0.0%) |
| $1,000,000 or more | 0 (0.0%) | 0 (0.0%) |
| Total | 66 (100.0%) | 60 (100.0%) |
Household Income by Mortgage Status in Pink Hill
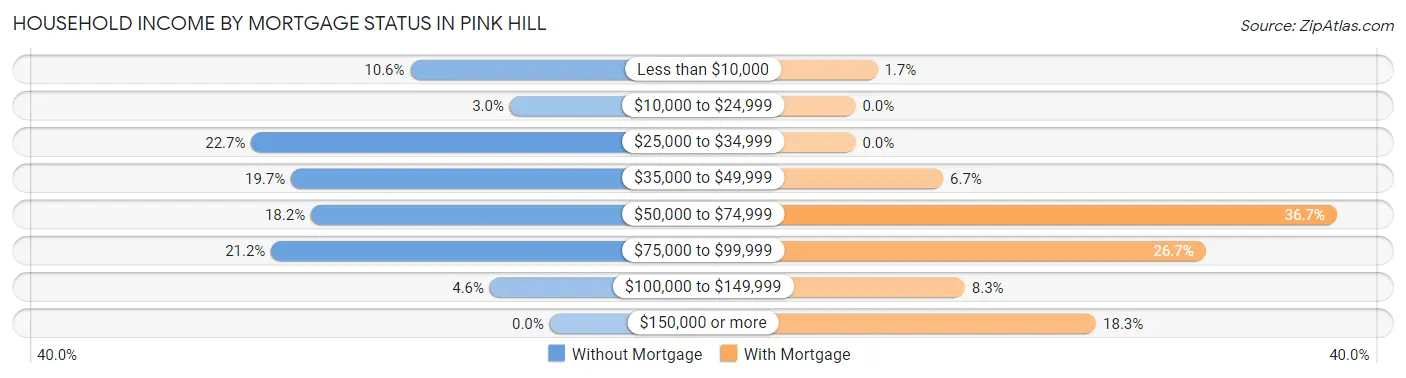
| Household Income | Without Mortgage | With Mortgage |
| Less than $10,000 | 7 (10.6%) | 1 (1.7%) |
| $10,000 to $24,999 | 2 (3.0%) | 0 (0.0%) |
| $25,000 to $34,999 | 15 (22.7%) | 0 (0.0%) |
| $35,000 to $49,999 | 13 (19.7%) | 4 (6.7%) |
| $50,000 to $74,999 | 12 (18.2%) | 22 (36.7%) |
| $75,000 to $99,999 | 14 (21.2%) | 16 (26.7%) |
| $100,000 to $149,999 | 3 (4.5%) | 5 (8.3%) |
| $150,000 or more | 0 (0.0%) | 11 (18.3%) |
| Total | 66 (100.0%) | 60 (100.0%) |
Property Value to Household Income Ratio in Pink Hill
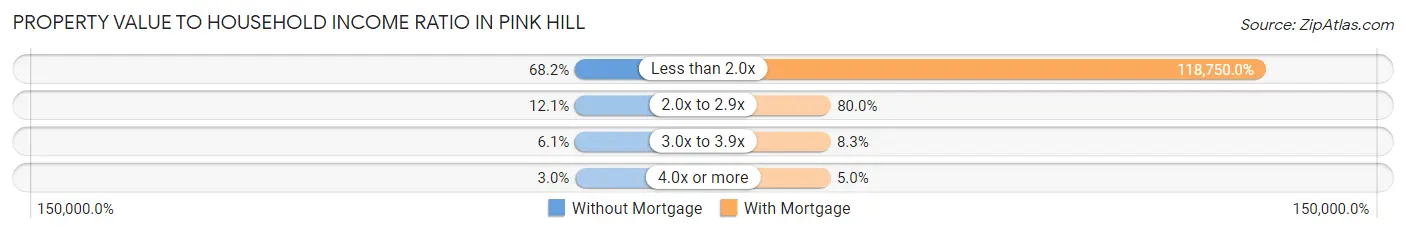
| Value-to-Income Ratio | Without Mortgage | With Mortgage |
| Less than 2.0x | 45 (68.2%) | 71,250 (118,750.0%) |
| 2.0x to 2.9x | 8 (12.1%) | 48 (80.0%) |
| 3.0x to 3.9x | 4 (6.1%) | 5 (8.3%) |
| 4.0x or more | 2 (3.0%) | 3 (5.0%) |
| Total | 66 (100.0%) | 60 (100.0%) |
Real Estate Taxes by Mortgage Status in Pink Hill
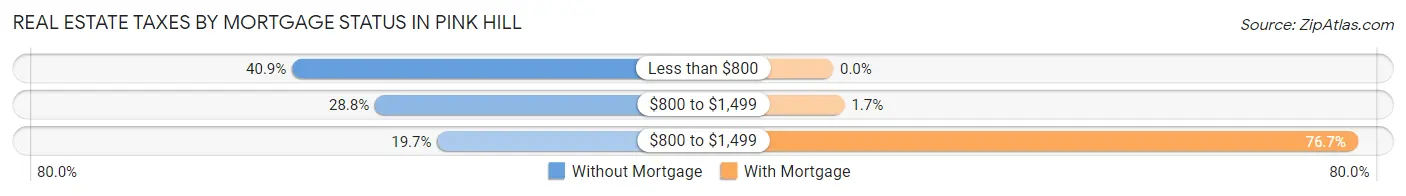
| Property Taxes | Without Mortgage | With Mortgage |
| Less than $800 | 27 (40.9%) | 0 (0.0%) |
| $800 to $1,499 | 19 (28.8%) | 1 (1.7%) |
| $800 to $1,499 | 13 (19.7%) | 46 (76.7%) |
| Total | 66 (100.0%) | 60 (100.0%) |
Health & Disability in Pink Hill
Health Insurance Coverage by Age in Pink Hill
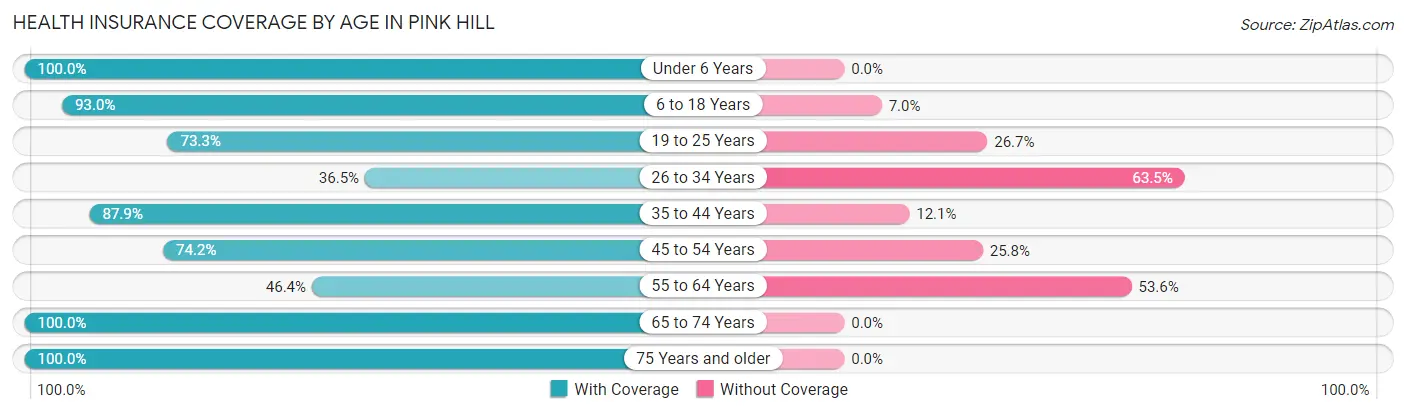
| Age Bracket | With Coverage | Without Coverage |
| Under 6 Years | 8 (100.0%) | 0 (0.0%) |
| 6 to 18 Years | 80 (93.0%) | 6 (7.0%) |
| 19 to 25 Years | 22 (73.3%) | 8 (26.7%) |
| 26 to 34 Years | 19 (36.5%) | 33 (63.5%) |
| 35 to 44 Years | 29 (87.9%) | 4 (12.1%) |
| 45 to 54 Years | 89 (74.2%) | 31 (25.8%) |
| 55 to 64 Years | 52 (46.4%) | 60 (53.6%) |
| 65 to 74 Years | 51 (100.0%) | 0 (0.0%) |
| 75 Years and older | 36 (100.0%) | 0 (0.0%) |
| Total | 386 (73.1%) | 142 (26.9%) |
Health Insurance Coverage by Citizenship Status in Pink Hill
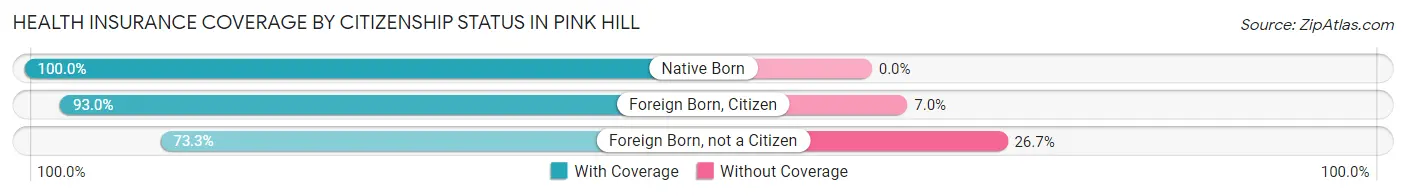
| Citizenship Status | With Coverage | Without Coverage |
| Native Born | 8 (100.0%) | 0 (0.0%) |
| Foreign Born, Citizen | 80 (93.0%) | 6 (7.0%) |
| Foreign Born, not a Citizen | 22 (73.3%) | 8 (26.7%) |
Health Insurance Coverage by Household Income in Pink Hill
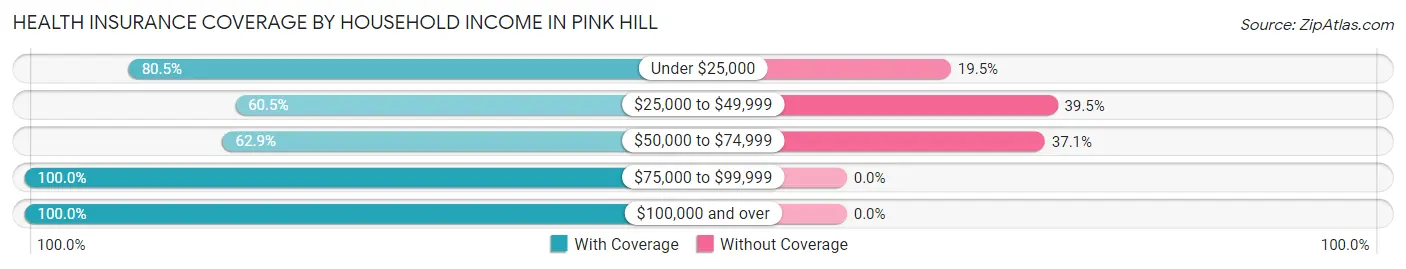
| Household Income | With Coverage | Without Coverage |
| Under $25,000 | 66 (80.5%) | 16 (19.5%) |
| $25,000 to $49,999 | 138 (60.5%) | 90 (39.5%) |
| $50,000 to $74,999 | 61 (62.9%) | 36 (37.1%) |
| $75,000 to $99,999 | 68 (100.0%) | 0 (0.0%) |
| $100,000 and over | 53 (100.0%) | 0 (0.0%) |
Public vs Private Health Insurance Coverage by Age in Pink Hill
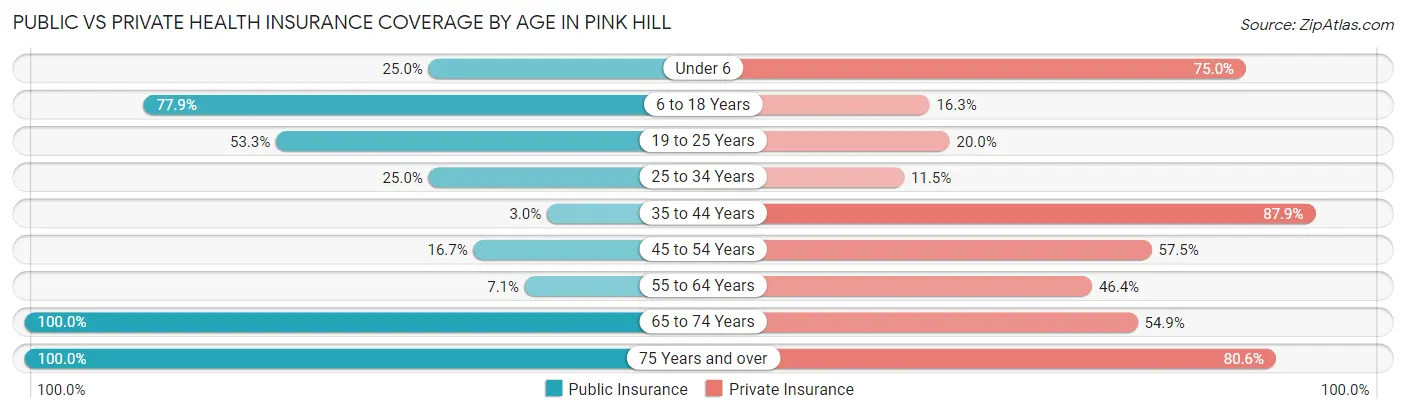
| Age Bracket | Public Insurance | Private Insurance |
| Under 6 | 2 (25.0%) | 6 (75.0%) |
| 6 to 18 Years | 67 (77.9%) | 14 (16.3%) |
| 19 to 25 Years | 16 (53.3%) | 6 (20.0%) |
| 25 to 34 Years | 13 (25.0%) | 6 (11.5%) |
| 35 to 44 Years | 1 (3.0%) | 29 (87.9%) |
| 45 to 54 Years | 20 (16.7%) | 69 (57.5%) |
| 55 to 64 Years | 8 (7.1%) | 52 (46.4%) |
| 65 to 74 Years | 51 (100.0%) | 28 (54.9%) |
| 75 Years and over | 36 (100.0%) | 29 (80.6%) |
| Total | 214 (40.5%) | 239 (45.3%) |
Disability Status by Sex by Age in Pink Hill
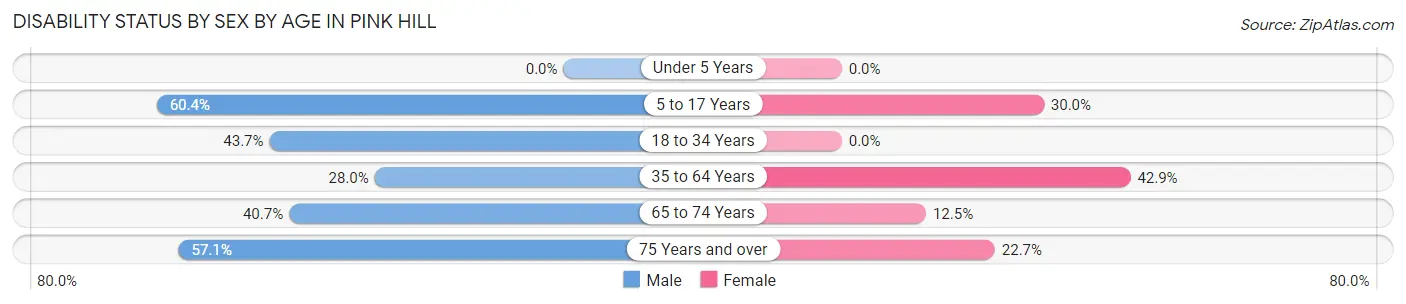
| Age Bracket | Male | Female |
| Under 5 Years | 0 (0.0%) | 0 (0.0%) |
| 5 to 17 Years | 32 (60.4%) | 9 (30.0%) |
| 18 to 34 Years | 31 (43.7%) | 0 (0.0%) |
| 35 to 64 Years | 37 (28.0%) | 57 (42.9%) |
| 65 to 74 Years | 11 (40.7%) | 3 (12.5%) |
| 75 Years and over | 8 (57.1%) | 5 (22.7%) |
Disability Class by Sex by Age in Pink Hill
Disability Class: Hearing Difficulty
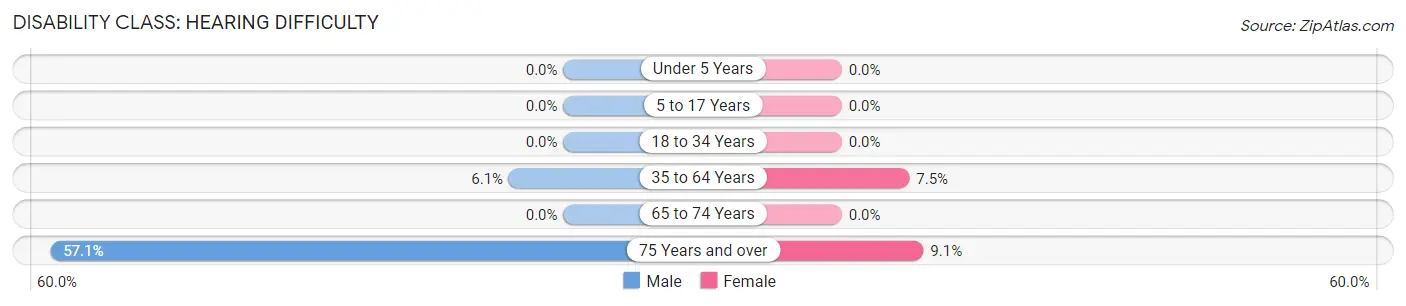
| Age Bracket | Male | Female |
| Under 5 Years | 0 (0.0%) | 0 (0.0%) |
| 5 to 17 Years | 0 (0.0%) | 0 (0.0%) |
| 18 to 34 Years | 0 (0.0%) | 0 (0.0%) |
| 35 to 64 Years | 8 (6.1%) | 10 (7.5%) |
| 65 to 74 Years | 0 (0.0%) | 0 (0.0%) |
| 75 Years and over | 8 (57.1%) | 2 (9.1%) |
Disability Class: Vision Difficulty
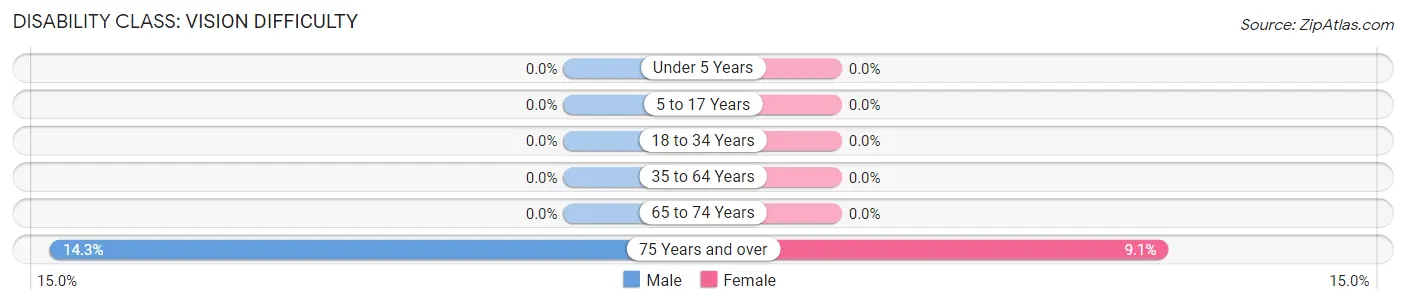
| Age Bracket | Male | Female |
| Under 5 Years | 0 (0.0%) | 0 (0.0%) |
| 5 to 17 Years | 0 (0.0%) | 0 (0.0%) |
| 18 to 34 Years | 0 (0.0%) | 0 (0.0%) |
| 35 to 64 Years | 0 (0.0%) | 0 (0.0%) |
| 65 to 74 Years | 0 (0.0%) | 0 (0.0%) |
| 75 Years and over | 2 (14.3%) | 2 (9.1%) |
Disability Class: Cognitive Difficulty
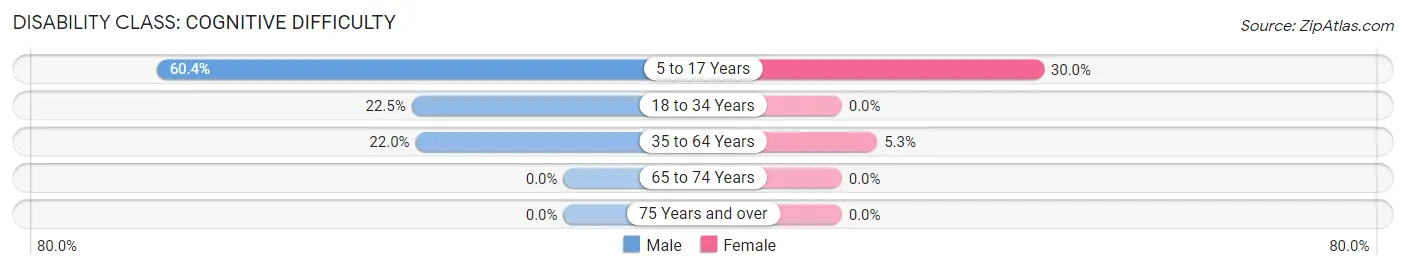
| Age Bracket | Male | Female |
| 5 to 17 Years | 32 (60.4%) | 9 (30.0%) |
| 18 to 34 Years | 16 (22.5%) | 0 (0.0%) |
| 35 to 64 Years | 29 (22.0%) | 7 (5.3%) |
| 65 to 74 Years | 0 (0.0%) | 0 (0.0%) |
| 75 Years and over | 0 (0.0%) | 0 (0.0%) |
Disability Class: Ambulatory Difficulty
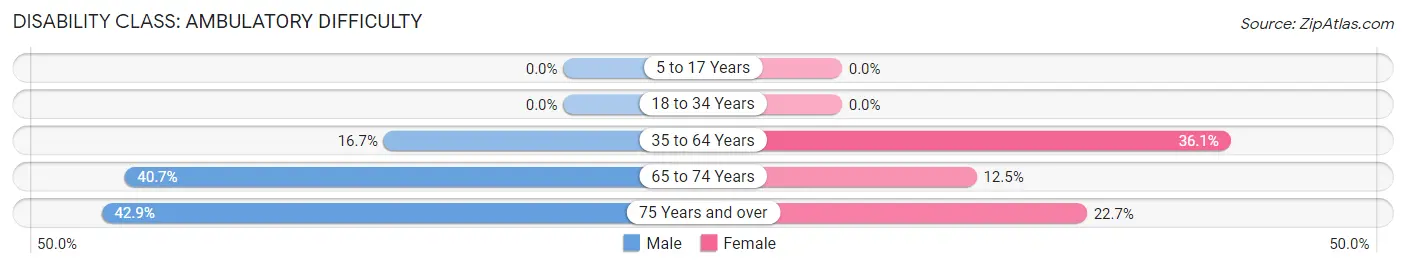
| Age Bracket | Male | Female |
| 5 to 17 Years | 0 (0.0%) | 0 (0.0%) |
| 18 to 34 Years | 0 (0.0%) | 0 (0.0%) |
| 35 to 64 Years | 22 (16.7%) | 48 (36.1%) |
| 65 to 74 Years | 11 (40.7%) | 3 (12.5%) |
| 75 Years and over | 6 (42.9%) | 5 (22.7%) |
Disability Class: Self-Care Difficulty
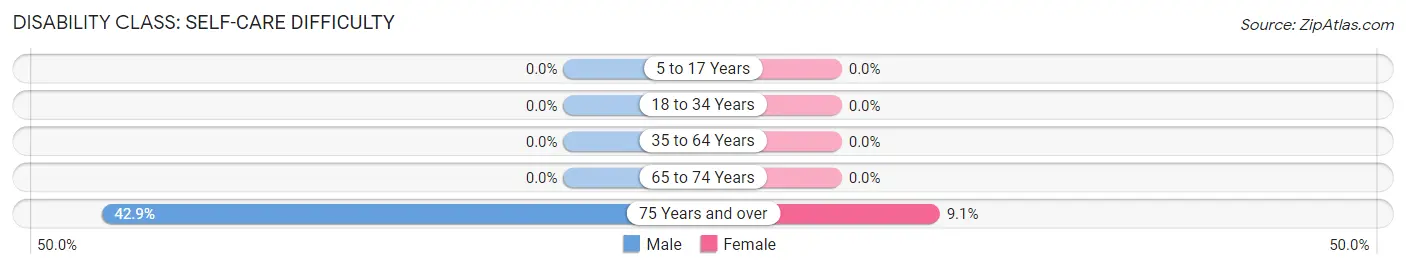
| Age Bracket | Male | Female |
| 5 to 17 Years | 0 (0.0%) | 0 (0.0%) |
| 18 to 34 Years | 0 (0.0%) | 0 (0.0%) |
| 35 to 64 Years | 0 (0.0%) | 0 (0.0%) |
| 65 to 74 Years | 0 (0.0%) | 0 (0.0%) |
| 75 Years and over | 6 (42.9%) | 2 (9.1%) |
Technology Access in Pink Hill
Computing Device Access in Pink Hill
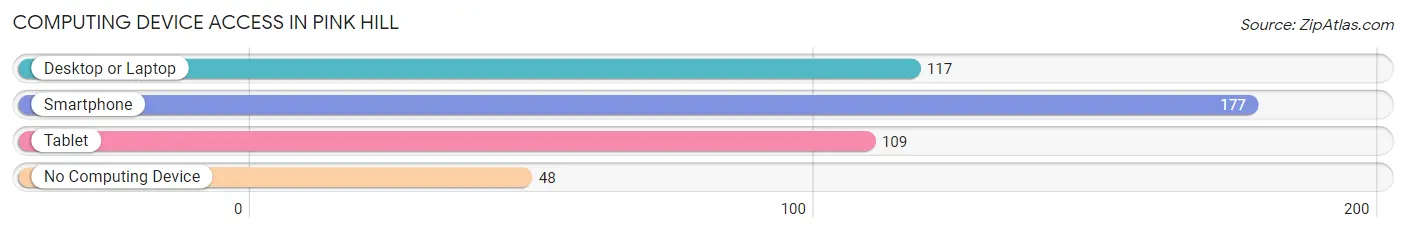
| Device Type | # Households | % Households |
| Desktop or Laptop | 117 | 48.5% |
| Smartphone | 177 | 73.4% |
| Tablet | 109 | 45.2% |
| No Computing Device | 48 | 19.9% |
| Total | 241 | 100.0% |
Internet Access in Pink Hill
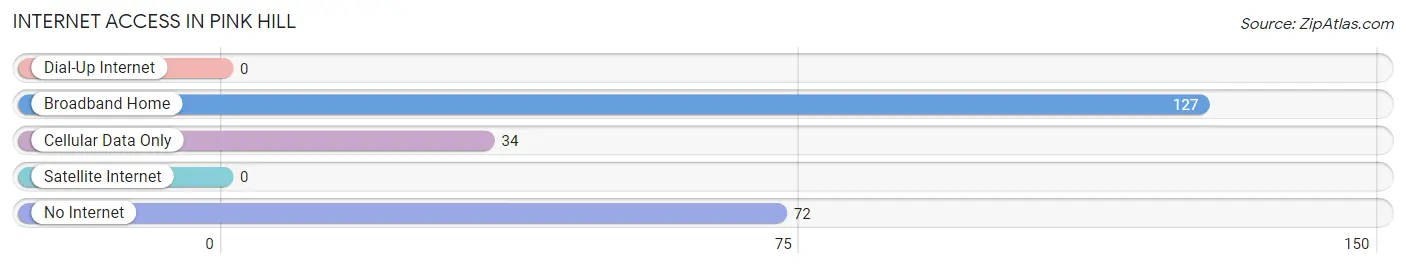
| Internet Type | # Households | % Households |
| Dial-Up Internet | 0 | 0.0% |
| Broadband Home | 127 | 52.7% |
| Cellular Data Only | 34 | 14.1% |
| Satellite Internet | 0 | 0.0% |
| No Internet | 72 | 29.9% |
| Total | 241 | 100.0% |
Pink Hill Summary
Hill, NC is a small town located in Lenoir County, North Carolina. It is situated in the foothills of the Blue Ridge Mountains and is part of the Hickory-Lenoir-Morganton Metropolitan Statistical Area. The town was founded in 1845 and is named after the nearby Pink Hill Creek. The population of Pink Hill was 1,845 at the 2010 census.
Geography
Pink Hill is located at 35°45'25" North, 77°45'25" West (35.756944, -77.756944). It is situated in the foothills of the Blue Ridge Mountains and is part of the Hickory-Lenoir-Morganton Metropolitan Statistical Area. The town is located at an elevation of 545 feet (166 m).
The town is located in the Piedmont region of North Carolina and is bordered by the towns of La Grange, Kinston, and Deep Run. The nearest major city is Greenville, which is located approximately 25 miles (40 km) to the east.
Climate
Pink Hill has a humid subtropical climate, with hot, humid summers and mild winters. The average annual temperature is 61.3°F (16.3°C). The average annual precipitation is 46.2 inches (117 cm).
Demographics
As of the 2010 census, there were 1,845 people, 717 households, and 486 families residing in the town. The population density was 545.3 people per square mile (210.9/km2). There were 790 housing units at an average density of 233.3 per square mile (90.1/km2). The racial makeup of the town was 79.2% White, 16.2% African American, 0.2% Native American, 0.7% Asian, 0.1% Pacific Islander, 2.2% from other races, and 1.6% from two or more races. Hispanic or Latino of any race were 4.2% of the population.
There were 717 households, out of which 28.2% had children under the age of 18 living with them, 46.2% were married couples living together, 15.2% had a female householder with no husband present, and 33.2% were non-families. 28.2% of all households were made up of individuals, and 12.2% had someone living alone who was 65 years of age or older. The average household size was 2.50 and the average family size was 3.04.
The median age in the town was 38.2 years. 24.2% of residents were under the age of 18; 8.2% were between the ages of 18 and 24; 24.2% were from 25 to 44; 27.2% were from 45 to 64; and 16.2% were 65 years of age or older. The gender makeup of the town was 48.2% male and 51.8% female.
Economy
The economy of Pink Hill is largely based on agriculture. The town is home to several farms, including tobacco, cotton, and soybean farms. The town also has a few small businesses, including a grocery store, a hardware store, and a few restaurants.
The town is also home to a few manufacturing companies, including a furniture manufacturer and a plastics manufacturer. The town is also home to a few small technology companies, including a software development company and a web design company.
The town is served by the Lenoir County Public Schools system. The town is also home to a few private schools, including a Christian school and a Montessori school.
Pink Hill is served by the Lenoir County Public Library system. The town is also home to a few museums, including the Pink Hill Historical Museum and the Pink Hill Art Museum.
Conclusion
Pink Hill, NC is a small town located in Lenoir County, North Carolina. It is situated in the foothills of the Blue Ridge Mountains and is part of the Hickory-Lenoir-Morganton Metropolitan Statistical Area. The town was founded in 1845 and is named after the nearby Pink Hill Creek. The population of Pink Hill was 1,845 at the 2010 census. The town has a humid subtropical climate, with hot, humid summers and mild winters. The economy of Pink Hill is largely based on agriculture, with a few small businesses and manufacturing companies. The town is served by the Lenoir County Public Schools system and is home to a few private schools, museums, and libraries.
Common Questions
What is Per Capita Income in Pink Hill?
Per Capita income in Pink Hill is $22,425.
What is the Median Family Income in Pink Hill?
Median Family Income in Pink Hill is $43,333.
What is the Median Household income in Pink Hill?
Median Household Income in Pink Hill is $43,074.
What is Inequality or Gini Index in Pink Hill?
Inequality or Gini Index in Pink Hill is 0.33.
What is the Total Population of Pink Hill?
Total Population of Pink Hill is 528.
What is the Total Male Population of Pink Hill?
Total Male Population of Pink Hill is 305.
What is the Total Female Population of Pink Hill?
Total Female Population of Pink Hill is 223.
What is the Ratio of Males per 100 Females in Pink Hill?
There are 136.77 Males per 100 Females in Pink Hill.
What is the Ratio of Females per 100 Males in Pink Hill?
There are 73.11 Females per 100 Males in Pink Hill.
What is the Median Population Age in Pink Hill?
Median Population Age in Pink Hill is 49.0 Years.
What is the Average Family Size in Pink Hill
Average Family Size in Pink Hill is 2.6 People.
What is the Average Household Size in Pink Hill
Average Household Size in Pink Hill is 2.2 People.
How Large is the Labor Force in Pink Hill?
There are 260 People in the Labor Forcein in Pink Hill.
What is the Percentage of People in the Labor Force in Pink Hill?
55.9% of People are in the Labor Force in Pink Hill.
What is the Unemployment Rate in Pink Hill?
Unemployment Rate in Pink Hill is 4.2%.