Matthews, NC Map & Demographics
Matthews Map
Matthews Overview
$47,972
PER CAPITA INCOME
$125,116
AVG FAMILY INCOME
$103,405
AVG HOUSEHOLD INCOME
34.4%
WAGE / INCOME GAP [ % ]
65.6¢/ $1
WAGE / INCOME GAP [ $ ]
0.40
INEQUALITY / GINI INDEX
29,613
TOTAL POPULATION
14,750
MALE POPULATION
14,863
FEMALE POPULATION
99.24
MALES / 100 FEMALES
100.77
FEMALES / 100 MALES
39.5
MEDIAN AGE
3.1
AVG FAMILY SIZE
2.6
AVG HOUSEHOLD SIZE
16,242
LABOR FORCE [ PEOPLE ]
67.1%
PERCENT IN LABOR FORCE
3.0%
UNEMPLOYMENT RATE
Income in Matthews
Income Overview in Matthews
Per Capita Income in Matthews is $47,972, while median incomes of families and households are $125,116 and $103,405 respectively.
| Characteristic | Number | Measure |
| Per Capita Income | 29,613 | $47,972 |
| Median Family Income | 8,022 | $125,116 |
| Mean Family Income | 8,022 | $144,776 |
| Median Household Income | 11,061 | $103,405 |
| Mean Household Income | 11,061 | $124,723 |
| Income Deficit | 8,022 | $0 |
| Wage / Income Gap (%) | 29,613 | 34.43% |
| Wage / Income Gap ($) | 29,613 | 65.57¢ per $1 |
| Gini / Inequality Index | 29,613 | 0.40 |
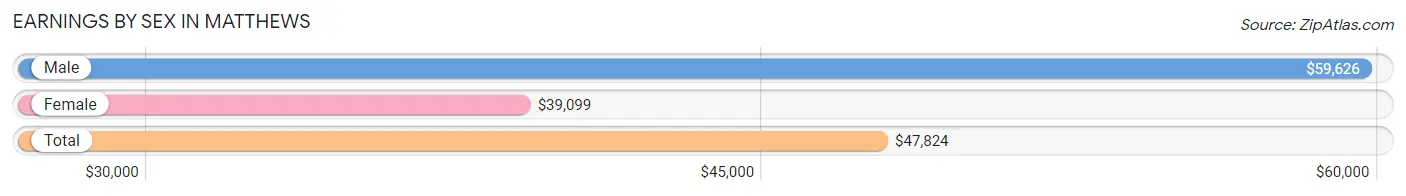
Earnings by Sex in Matthews
Average Earnings in Matthews are $47,824, $59,626 for men and $39,099 for women, a difference of 34.4%.
| Sex | Number | Average Earnings |
| Male | 9,052 (53.9%) | $59,626 |
| Female | 7,746 (46.1%) | $39,099 |
| Total | 16,798 (100.0%) | $47,824 |
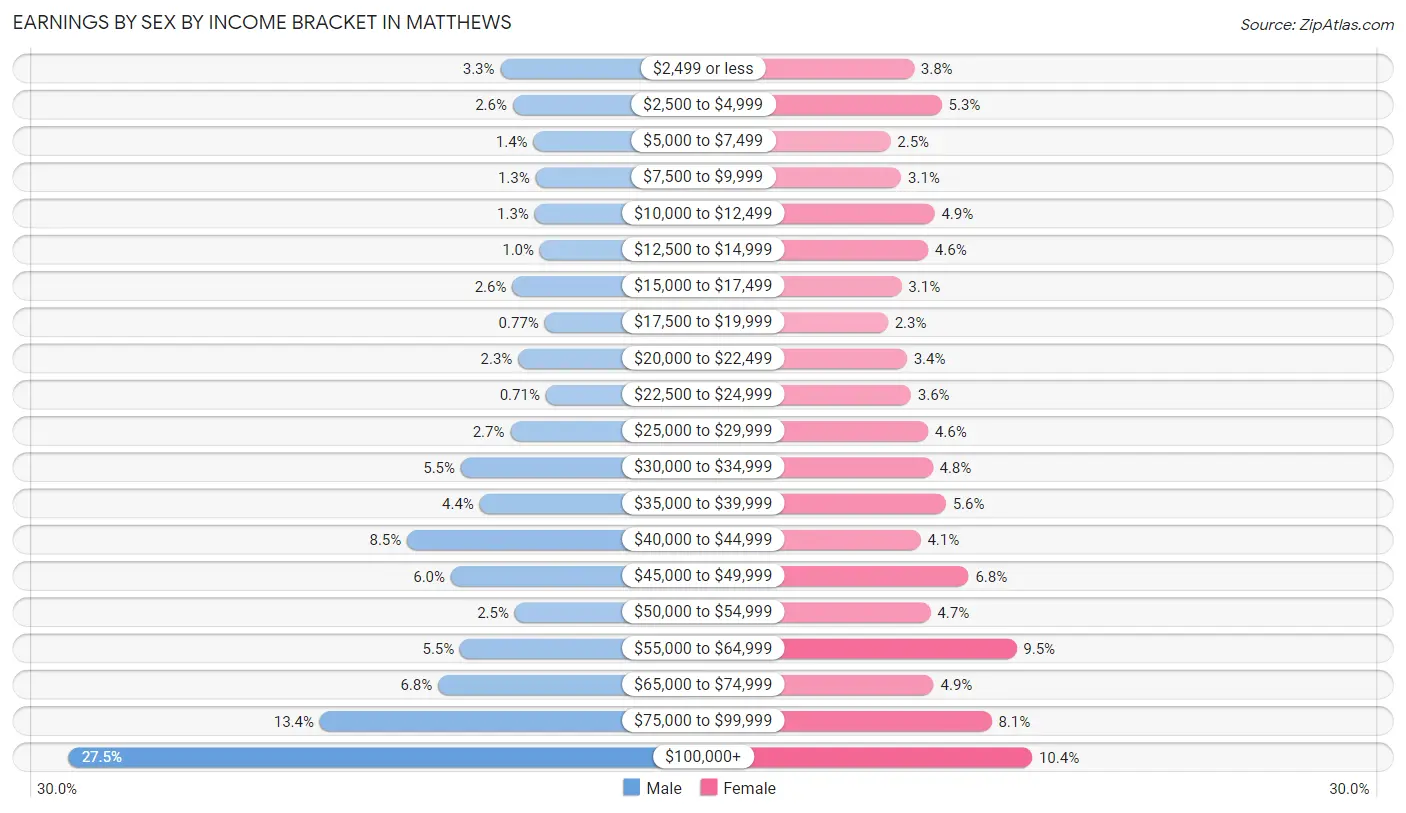
Earnings by Sex by Income Bracket in Matthews
The most common earnings brackets in Matthews are $100,000+ for men (2,491 | 27.5%) and $100,000+ for women (806 | 10.4%).
| Income | Male | Female |
| $2,499 or less | 295 (3.3%) | 292 (3.8%) |
| $2,500 to $4,999 | 232 (2.6%) | 413 (5.3%) |
| $5,000 to $7,499 | 127 (1.4%) | 190 (2.5%) |
| $7,500 to $9,999 | 116 (1.3%) | 236 (3.0%) |
| $10,000 to $12,499 | 120 (1.3%) | 382 (4.9%) |
| $12,500 to $14,999 | 94 (1.0%) | 353 (4.6%) |
| $15,000 to $17,499 | 234 (2.6%) | 238 (3.1%) |
| $17,500 to $19,999 | 70 (0.8%) | 178 (2.3%) |
| $20,000 to $22,499 | 205 (2.3%) | 261 (3.4%) |
| $22,500 to $24,999 | 64 (0.7%) | 279 (3.6%) |
| $25,000 to $29,999 | 244 (2.7%) | 353 (4.6%) |
| $30,000 to $34,999 | 496 (5.5%) | 373 (4.8%) |
| $35,000 to $39,999 | 400 (4.4%) | 431 (5.6%) |
| $40,000 to $44,999 | 769 (8.5%) | 321 (4.1%) |
| $45,000 to $49,999 | 547 (6.0%) | 530 (6.8%) |
| $50,000 to $54,999 | 222 (2.5%) | 364 (4.7%) |
| $55,000 to $64,999 | 500 (5.5%) | 738 (9.5%) |
| $65,000 to $74,999 | 612 (6.8%) | 378 (4.9%) |
| $75,000 to $99,999 | 1,214 (13.4%) | 630 (8.1%) |
| $100,000+ | 2,491 (27.5%) | 806 (10.4%) |
| Total | 9,052 (100.0%) | 7,746 (100.0%) |
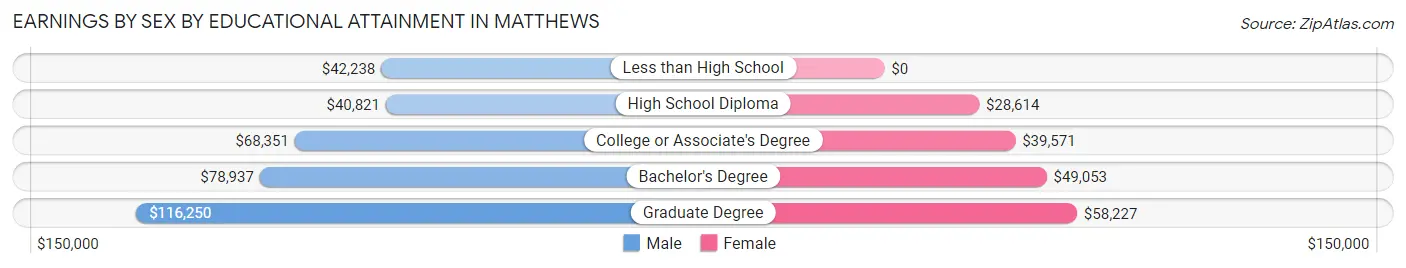
Earnings by Sex by Educational Attainment in Matthews
Average earnings in Matthews are $69,721 for men and $45,664 for women, a difference of 34.5%. Men with an educational attainment of graduate degree enjoy the highest average annual earnings of $116,250, while those with high school diploma education earn the least with $40,821. Women with an educational attainment of graduate degree earn the most with the average annual earnings of $58,227, while those with high school diploma education have the smallest earnings of $28,614.
| Educational Attainment | Male Income | Female Income |
| Less than High School | $42,238 | $0 |
| High School Diploma | $40,821 | $28,614 |
| College or Associate's Degree | $68,351 | $39,571 |
| Bachelor's Degree | $78,937 | $49,053 |
| Graduate Degree | $116,250 | $58,227 |
| Total | $69,721 | $45,664 |
Family Income in Matthews
Family Income Brackets in Matthews
According to the Matthews family income data, there are 2,310 families falling into the $100,000 to $149,999 income range, which is the most common income bracket and makes up 28.8% of all families. Conversely, the $10,000 to $14,999 income bracket is the least frequent group with only 24 families (0.3%) belonging to this category.
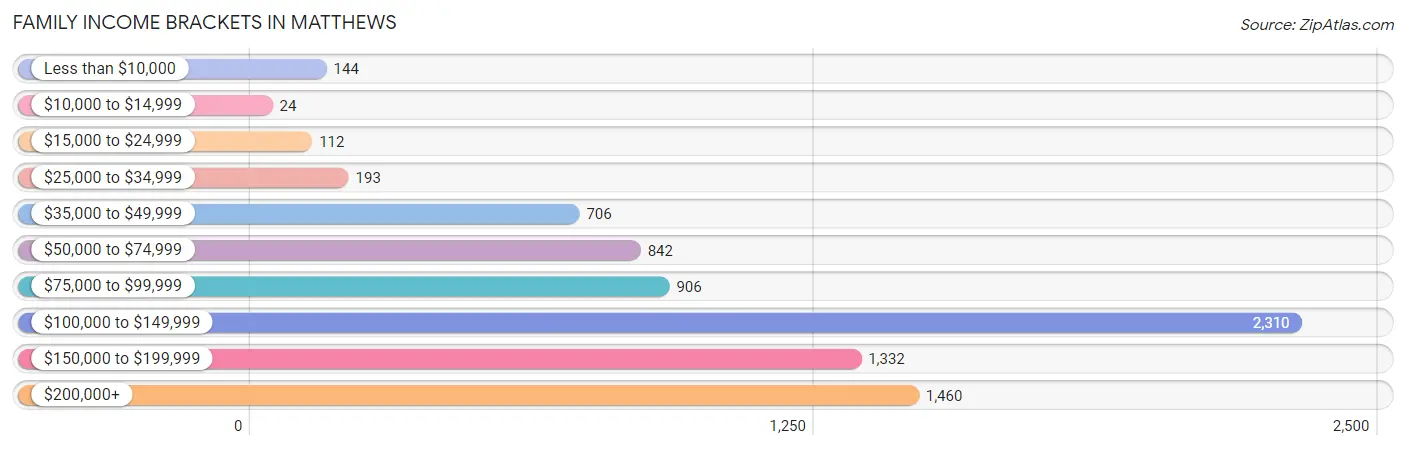
| Income Bracket | # Families | % Families |
| Less than $10,000 | 144 | 1.8% |
| $10,000 to $14,999 | 24 | 0.3% |
| $15,000 to $24,999 | 112 | 1.4% |
| $25,000 to $34,999 | 193 | 2.4% |
| $35,000 to $49,999 | 706 | 8.8% |
| $50,000 to $74,999 | 842 | 10.5% |
| $75,000 to $99,999 | 906 | 11.3% |
| $100,000 to $149,999 | 2,310 | 28.8% |
| $150,000 to $199,999 | 1,332 | 16.6% |
| $200,000+ | 1,460 | 18.2% |
Family Income by Famaliy Size in Matthews
6-person families (201 | 2.5%) account for the highest median family income in Matthews with $190,625 per family, while 2-person families (3,795 | 47.3%) have the highest median income of $55,262 per family member.
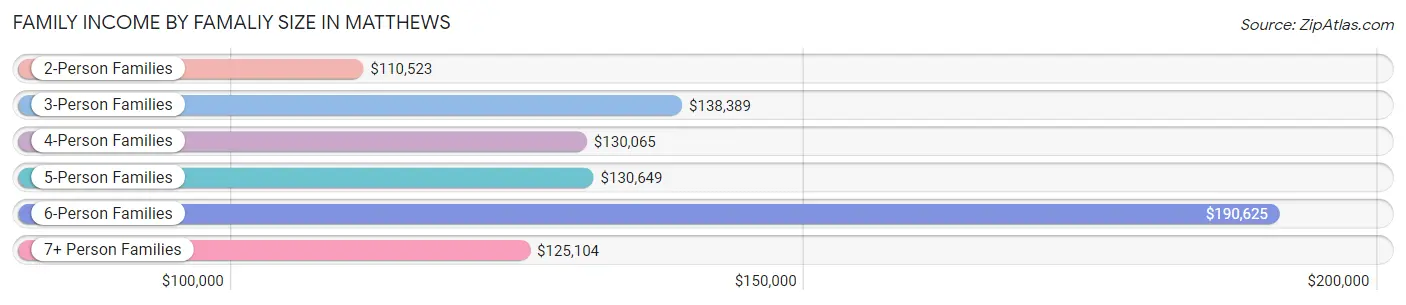
| Income Bracket | # Families | Median Income |
| 2-Person Families | 3,795 (47.3%) | $110,523 |
| 3-Person Families | 1,824 (22.7%) | $138,389 |
| 4-Person Families | 1,605 (20.0%) | $130,065 |
| 5-Person Families | 520 (6.5%) | $130,649 |
| 6-Person Families | 201 (2.5%) | $190,625 |
| 7+ Person Families | 77 (1.0%) | $125,104 |
| Total | 8,022 (100.0%) | $125,116 |
Family Income by Number of Earners in Matthews
The median family income in Matthews is $125,116, with families comprising 2 earners (3,771) having the highest median family income of $140,021, while families with no earners (1,157) have the lowest median family income of $70,670, accounting for 47.0% and 14.4% of families, respectively.
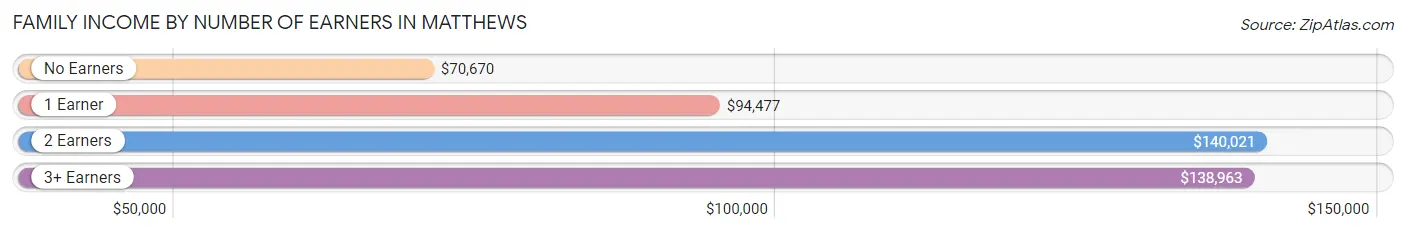
| Number of Earners | # Families | Median Income |
| No Earners | 1,157 (14.4%) | $70,670 |
| 1 Earner | 2,038 (25.4%) | $94,477 |
| 2 Earners | 3,771 (47.0%) | $140,021 |
| 3+ Earners | 1,056 (13.2%) | $138,963 |
| Total | 8,022 (100.0%) | $125,116 |
Household Income in Matthews
Household Income Brackets in Matthews
With 2,699 households falling in the category, the $100,000 to $149,999 income range is the most frequent in Matthews, accounting for 24.4% of all households. In contrast, only 133 households (1.2%) fall into the $10,000 to $14,999 income bracket, making it the least populous group.
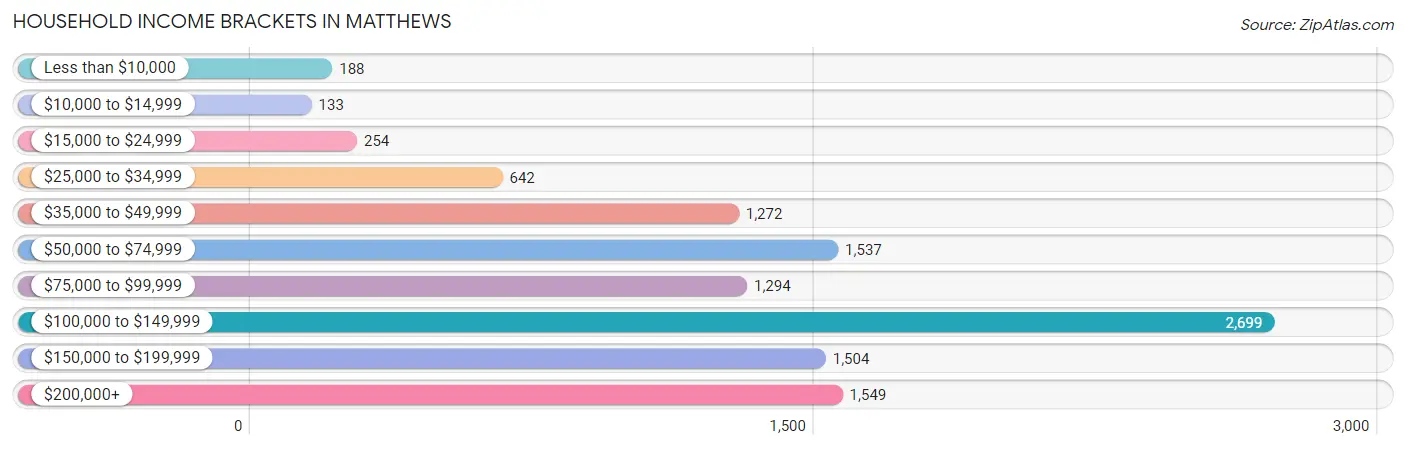
| Income Bracket | # Households | % Households |
| Less than $10,000 | 188 | 1.7% |
| $10,000 to $14,999 | 133 | 1.2% |
| $15,000 to $24,999 | 254 | 2.3% |
| $25,000 to $34,999 | 642 | 5.8% |
| $35,000 to $49,999 | 1,272 | 11.5% |
| $50,000 to $74,999 | 1,537 | 13.9% |
| $75,000 to $99,999 | 1,294 | 11.7% |
| $100,000 to $149,999 | 2,699 | 24.4% |
| $150,000 to $199,999 | 1,504 | 13.6% |
| $200,000+ | 1,549 | 14.0% |
Household Income by Householder Age in Matthews
The median household income in Matthews is $103,405, with the highest median household income of $129,950 found in the 45 to 64 years age bracket for the primary householder. A total of 3,932 households (35.5%) fall into this category. Meanwhile, the 15 to 24 years age bracket for the primary householder has the lowest median household income of $43,644, with 273 households (2.5%) in this group.
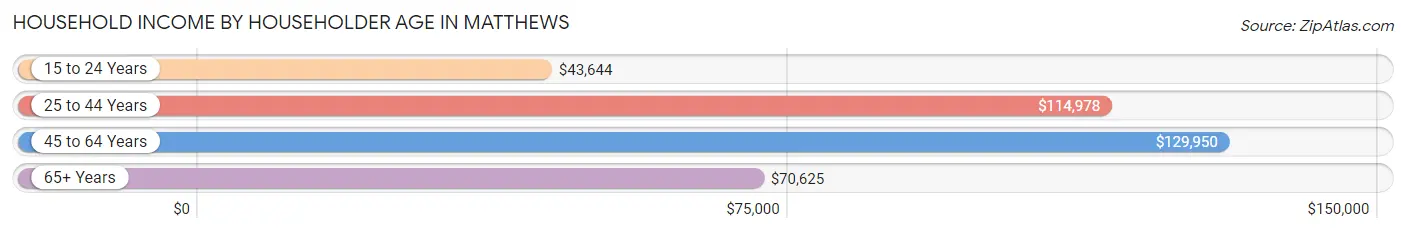
| Income Bracket | # Households | Median Income |
| 15 to 24 Years | 273 (2.5%) | $43,644 |
| 25 to 44 Years | 3,663 (33.1%) | $114,978 |
| 45 to 64 Years | 3,932 (35.5%) | $129,950 |
| 65+ Years | 3,193 (28.9%) | $70,625 |
| Total | 11,061 (100.0%) | $103,405 |
Poverty in Matthews
Income Below Poverty by Sex and Age in Matthews
With 4.4% poverty level for males and 5.1% for females among the residents of Matthews, 18 to 24 year old males and 16 and 17 year old females are the most vulnerable to poverty, with 222 males (19.7%) and 78 females (21.4%) in their respective age groups living below the poverty level.
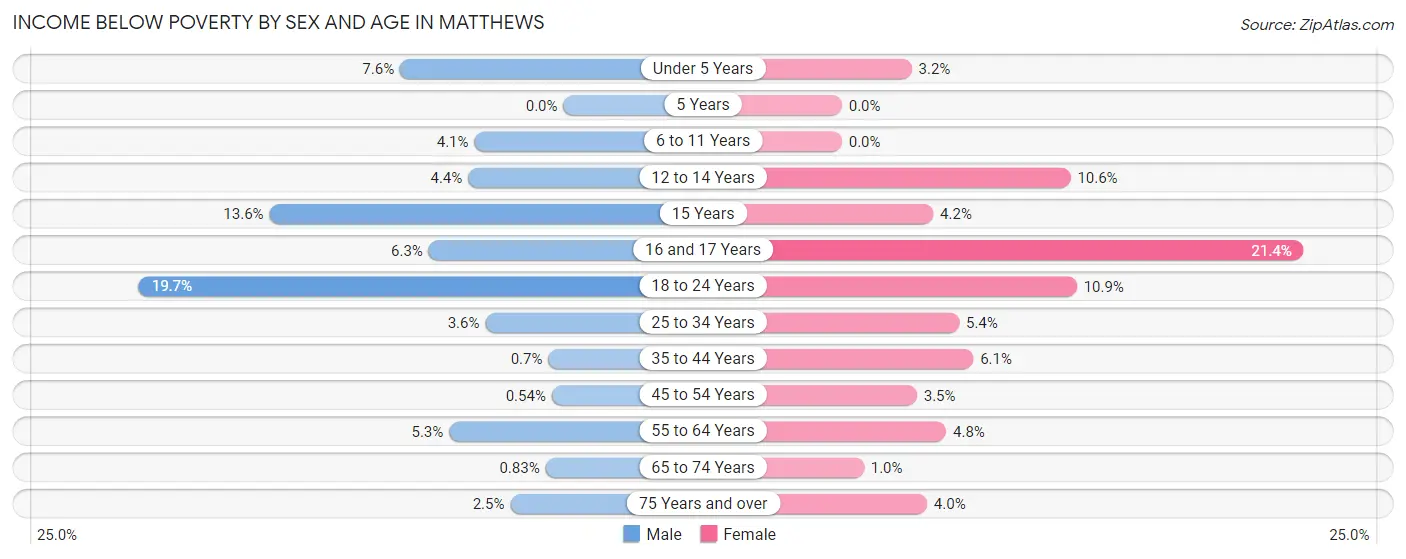
| Age Bracket | Male | Female |
| Under 5 Years | 79 (7.6%) | 27 (3.2%) |
| 5 Years | 0 (0.0%) | 0 (0.0%) |
| 6 to 11 Years | 35 (4.1%) | 0 (0.0%) |
| 12 to 14 Years | 20 (4.4%) | 57 (10.6%) |
| 15 Years | 27 (13.6%) | 7 (4.2%) |
| 16 and 17 Years | 17 (6.2%) | 78 (21.4%) |
| 18 to 24 Years | 222 (19.7%) | 134 (10.9%) |
| 25 to 34 Years | 90 (3.6%) | 118 (5.4%) |
| 35 to 44 Years | 13 (0.7%) | 95 (6.1%) |
| 45 to 54 Years | 11 (0.5%) | 69 (3.5%) |
| 55 to 64 Years | 92 (5.3%) | 85 (4.8%) |
| 65 to 74 Years | 10 (0.8%) | 14 (1.0%) |
| 75 Years and over | 26 (2.5%) | 67 (4.0%) |
| Total | 642 (4.4%) | 751 (5.1%) |
Income Above Poverty by Sex and Age in Matthews
According to the poverty statistics in Matthews, males aged 5 years and females aged 5 years are the age groups that are most secure financially, with 100.0% of males and 100.0% of females in these age groups living above the poverty line.
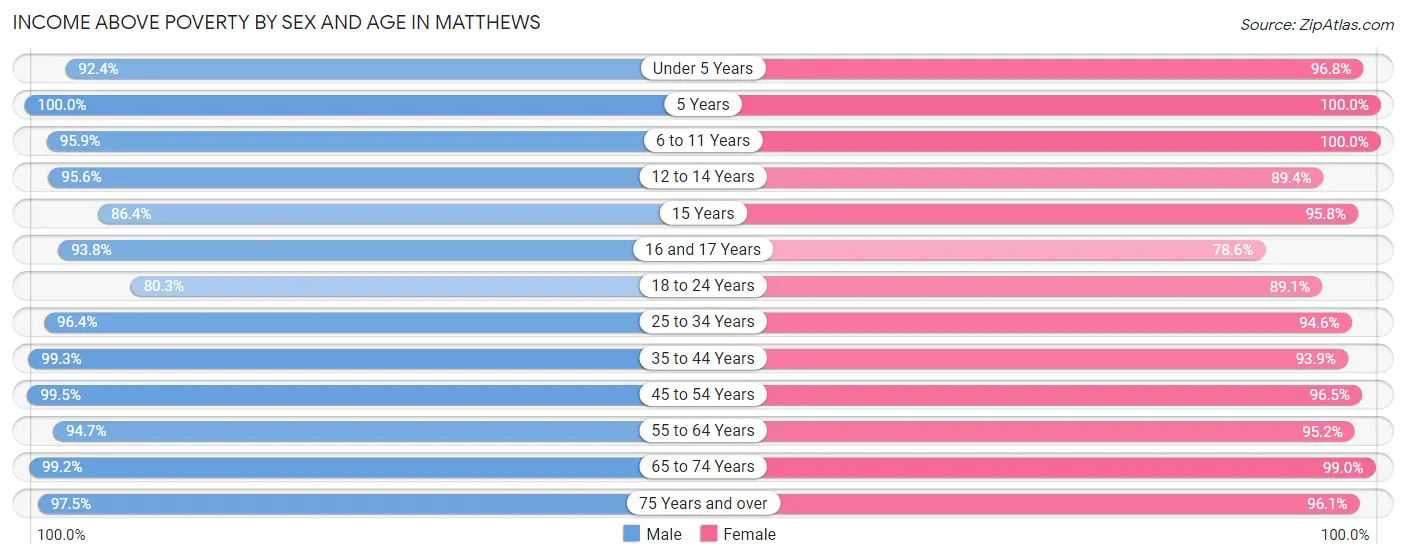
| Age Bracket | Male | Female |
| Under 5 Years | 963 (92.4%) | 807 (96.8%) |
| 5 Years | 271 (100.0%) | 101 (100.0%) |
| 6 to 11 Years | 813 (95.9%) | 887 (100.0%) |
| 12 to 14 Years | 432 (95.6%) | 480 (89.4%) |
| 15 Years | 171 (86.4%) | 158 (95.8%) |
| 16 and 17 Years | 255 (93.8%) | 286 (78.6%) |
| 18 to 24 Years | 905 (80.3%) | 1,095 (89.1%) |
| 25 to 34 Years | 2,397 (96.4%) | 2,052 (94.6%) |
| 35 to 44 Years | 1,839 (99.3%) | 1,462 (93.9%) |
| 45 to 54 Years | 2,041 (99.5%) | 1,913 (96.5%) |
| 55 to 64 Years | 1,643 (94.7%) | 1,672 (95.2%) |
| 65 to 74 Years | 1,195 (99.2%) | 1,363 (99.0%) |
| 75 Years and over | 1,031 (97.5%) | 1,631 (96.1%) |
| Total | 13,956 (95.6%) | 13,907 (94.9%) |
Income Below Poverty Among Married-Couple Families in Matthews
The poverty statistics for married-couple families in Matthews show that 0.9% or 62 of the total 6,621 families live below the poverty line. Families with 3 or 4 children have the highest poverty rate of 2.0%, comprising of 9 families. On the other hand, families with 5 or more children have the lowest poverty rate of 0.0%, which includes 0 families.
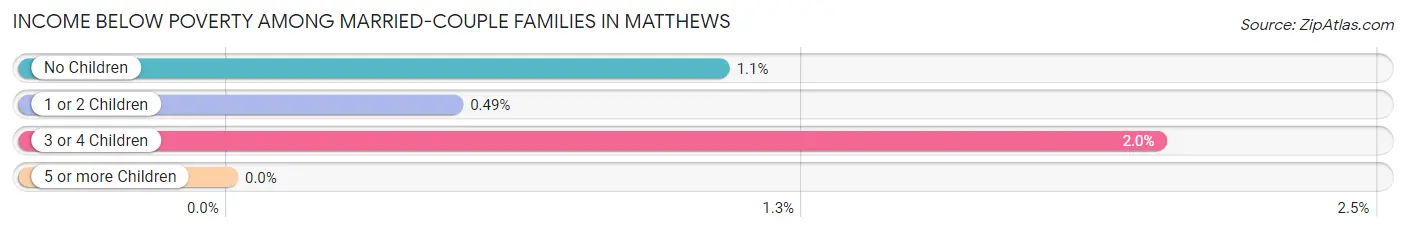
| Children | Above Poverty | Below Poverty |
| No Children | 3,871 (98.9%) | 42 (1.1%) |
| 1 or 2 Children | 2,246 (99.5%) | 11 (0.5%) |
| 3 or 4 Children | 436 (98.0%) | 9 (2.0%) |
| 5 or more Children | 6 (100.0%) | 0 (0.0%) |
| Total | 6,559 (99.1%) | 62 (0.9%) |
Income Below Poverty Among Single-Parent Households in Matthews
According to the poverty data in Matthews, 4.6% or 21 single-father households and 20.9% or 197 single-mother households are living below the poverty line. Among single-father households, those with 1 or 2 children have the highest poverty rate, with 9 households (7.4%) experiencing poverty. Likewise, among single-mother households, those with 1 or 2 children have the highest poverty rate, with 173 households (35.8%) falling below the poverty line.
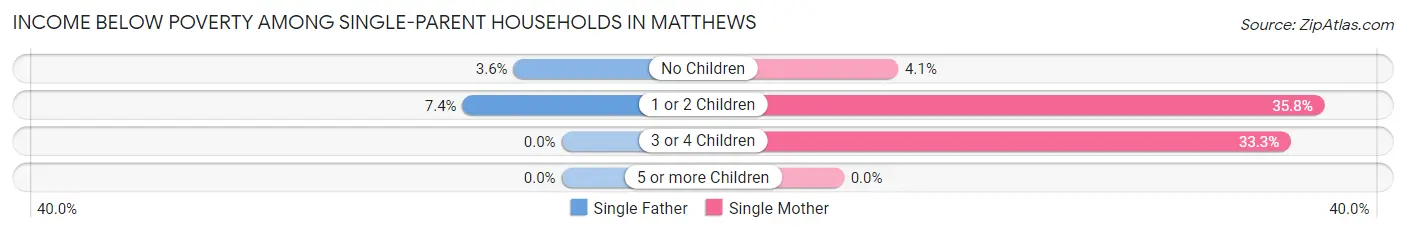
| Children | Single Father | Single Mother |
| No Children | 12 (3.6%) | 18 (4.1%) |
| 1 or 2 Children | 9 (7.4%) | 173 (35.8%) |
| 3 or 4 Children | 0 (0.0%) | 6 (33.3%) |
| 5 or more Children | 0 (0.0%) | 0 (0.0%) |
| Total | 21 (4.6%) | 197 (20.9%) |
Income Below Poverty Among Married-Couple vs Single-Parent Households in Matthews
The poverty data for Matthews shows that 62 of the married-couple family households (0.9%) and 218 of the single-parent households (15.6%) are living below the poverty level. Within the married-couple family households, those with 3 or 4 children have the highest poverty rate, with 9 households (2.0%) falling below the poverty line. Among the single-parent households, those with 3 or 4 children have the highest poverty rate, with 6 household (33.3%) living below poverty.
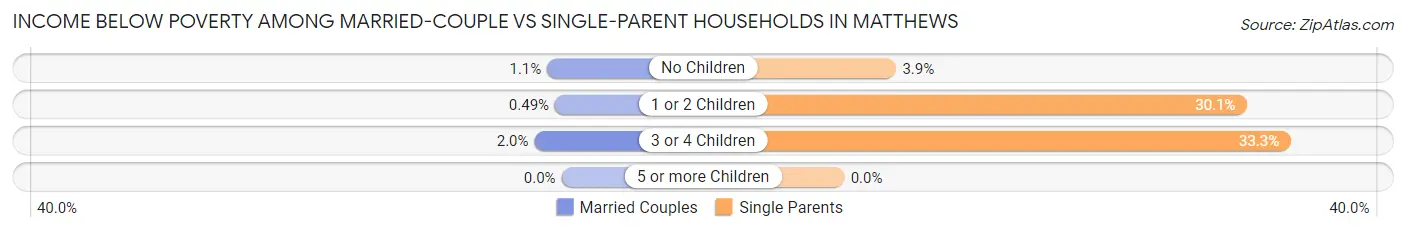
| Children | Married-Couple Families | Single-Parent Households |
| No Children | 42 (1.1%) | 30 (3.9%) |
| 1 or 2 Children | 11 (0.5%) | 182 (30.1%) |
| 3 or 4 Children | 9 (2.0%) | 6 (33.3%) |
| 5 or more Children | 0 (0.0%) | 0 (0.0%) |
| Total | 62 (0.9%) | 218 (15.6%) |
Race in Matthews
The most populous races in Matthews are White / Caucasian (21,792 | 73.6%), Black / African American (3,592 | 12.1%), and Hispanic or Latino (1,842 | 6.2%).
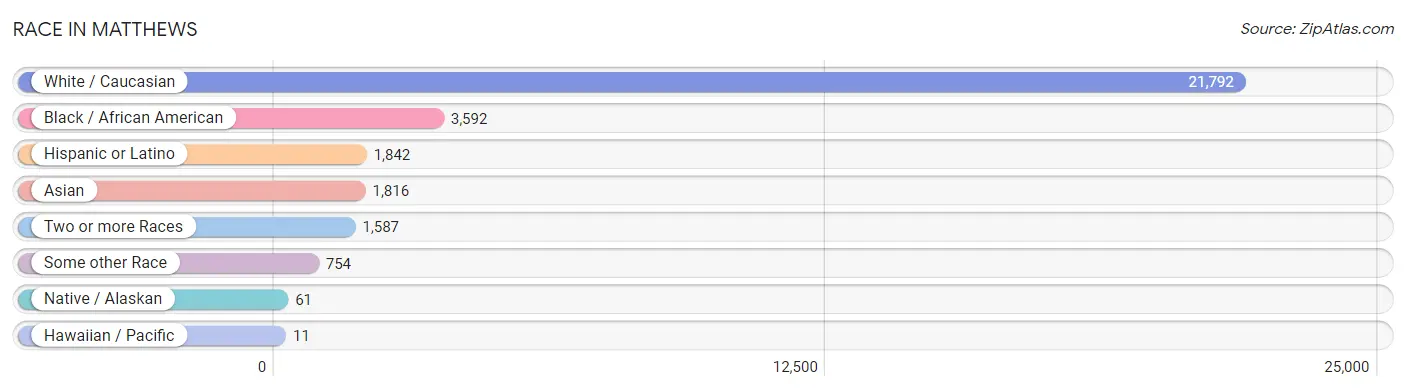
| Race | # Population | % Population |
| Asian | 1,816 | 6.1% |
| Black / African American | 3,592 | 12.1% |
| Hawaiian / Pacific | 11 | 0.0% |
| Hispanic or Latino | 1,842 | 6.2% |
| Native / Alaskan | 61 | 0.2% |
| White / Caucasian | 21,792 | 73.6% |
| Two or more Races | 1,587 | 5.4% |
| Some other Race | 754 | 2.5% |
| Total | 29,613 | 100.0% |
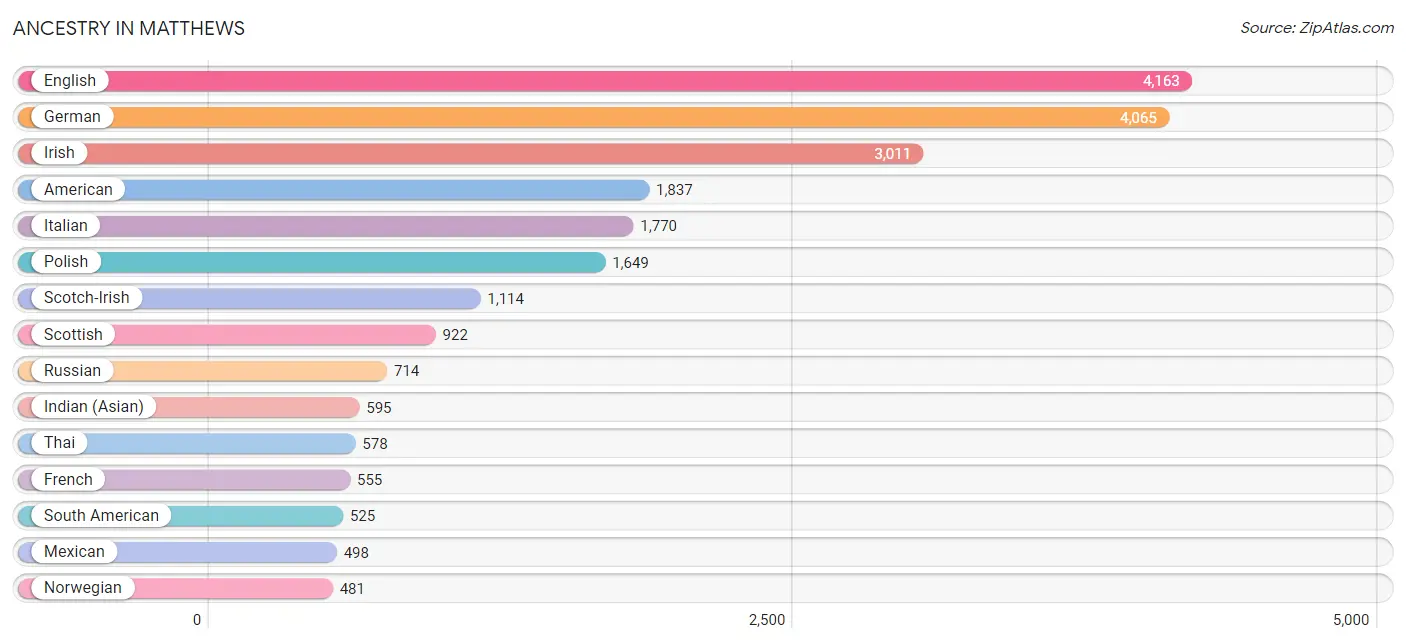
Ancestry in Matthews
The most populous ancestries reported in Matthews are English (4,163 | 14.1%), German (4,065 | 13.7%), Irish (3,011 | 10.2%), American (1,837 | 6.2%), and Italian (1,770 | 6.0%), together accounting for 50.1% of all Matthews residents.
| Ancestry | # Population | % Population |
| African | 100 | 0.3% |
| Alaskan Athabascan | 11 | 0.0% |
| Albanian | 127 | 0.4% |
| American | 1,837 | 6.2% |
| Arab | 217 | 0.7% |
| Argentinean | 80 | 0.3% |
| Armenian | 25 | 0.1% |
| Austrian | 84 | 0.3% |
| Belgian | 6 | 0.0% |
| Bermudan | 22 | 0.1% |
| Bhutanese | 90 | 0.3% |
| Blackfeet | 12 | 0.0% |
| Brazilian | 170 | 0.6% |
| British | 108 | 0.4% |
| Bulgarian | 48 | 0.2% |
| Burmese | 162 | 0.5% |
| Canadian | 9 | 0.0% |
| Central American | 233 | 0.8% |
| Cherokee | 88 | 0.3% |
| Colombian | 159 | 0.5% |
| Costa Rican | 20 | 0.1% |
| Croatian | 21 | 0.1% |
| Cuban | 57 | 0.2% |
| Czech | 91 | 0.3% |
| Czechoslovakian | 25 | 0.1% |
| Danish | 16 | 0.1% |
| Dominican | 235 | 0.8% |
| Dutch | 243 | 0.8% |
| Eastern European | 125 | 0.4% |
| Ecuadorian | 120 | 0.4% |
| Egyptian | 4 | 0.0% |
| English | 4,163 | 14.1% |
| European | 355 | 1.2% |
| Finnish | 18 | 0.1% |
| French | 555 | 1.9% |
| French Canadian | 38 | 0.1% |
| German | 4,065 | 13.7% |
| Greek | 106 | 0.4% |
| Guatemalan | 11 | 0.0% |
| Haitian | 64 | 0.2% |
| Honduran | 62 | 0.2% |
| Hungarian | 192 | 0.6% |
| Indian (Asian) | 595 | 2.0% |
| Indonesian | 53 | 0.2% |
| Iranian | 13 | 0.0% |
| Irish | 3,011 | 10.2% |
| Iroquois | 5 | 0.0% |
| Israeli | 105 | 0.4% |
| Italian | 1,770 | 6.0% |
| Jamaican | 100 | 0.3% |
| Jordanian | 11 | 0.0% |
| Korean | 160 | 0.5% |
| Lebanese | 26 | 0.1% |
| Lithuanian | 85 | 0.3% |
| Lumbee | 90 | 0.3% |
| Maltese | 10 | 0.0% |
| Mexican | 498 | 1.7% |
| Mexican American Indian | 81 | 0.3% |
| Nigerian | 31 | 0.1% |
| Norwegian | 481 | 1.6% |
| Paiute | 3 | 0.0% |
| Palestinian | 17 | 0.1% |
| Panamanian | 51 | 0.2% |
| Peruvian | 69 | 0.2% |
| Polish | 1,649 | 5.6% |
| Portuguese | 88 | 0.3% |
| Pueblo | 3 | 0.0% |
| Puerto Rican | 255 | 0.9% |
| Romanian | 431 | 1.5% |
| Russian | 714 | 2.4% |
| Salvadoran | 89 | 0.3% |
| Samoan | 11 | 0.0% |
| Scandinavian | 35 | 0.1% |
| Scotch-Irish | 1,114 | 3.8% |
| Scottish | 922 | 3.1% |
| Serbian | 32 | 0.1% |
| Slavic | 24 | 0.1% |
| Slovak | 42 | 0.1% |
| Slovene | 31 | 0.1% |
| South African | 10 | 0.0% |
| South American | 525 | 1.8% |
| Spaniard | 21 | 0.1% |
| Spanish | 12 | 0.0% |
| Sri Lankan | 170 | 0.6% |
| Subsaharan African | 227 | 0.8% |
| Sudanese | 13 | 0.0% |
| Swedish | 319 | 1.1% |
| Swiss | 65 | 0.2% |
| Syrian | 117 | 0.4% |
| Thai | 578 | 1.9% |
| Ukrainian | 181 | 0.6% |
| Venezuelan | 97 | 0.3% |
| Welsh | 282 | 0.9% |
| West Indian | 20 | 0.1% |
| Yugoslavian | 21 | 0.1% | View All 95 Rows |
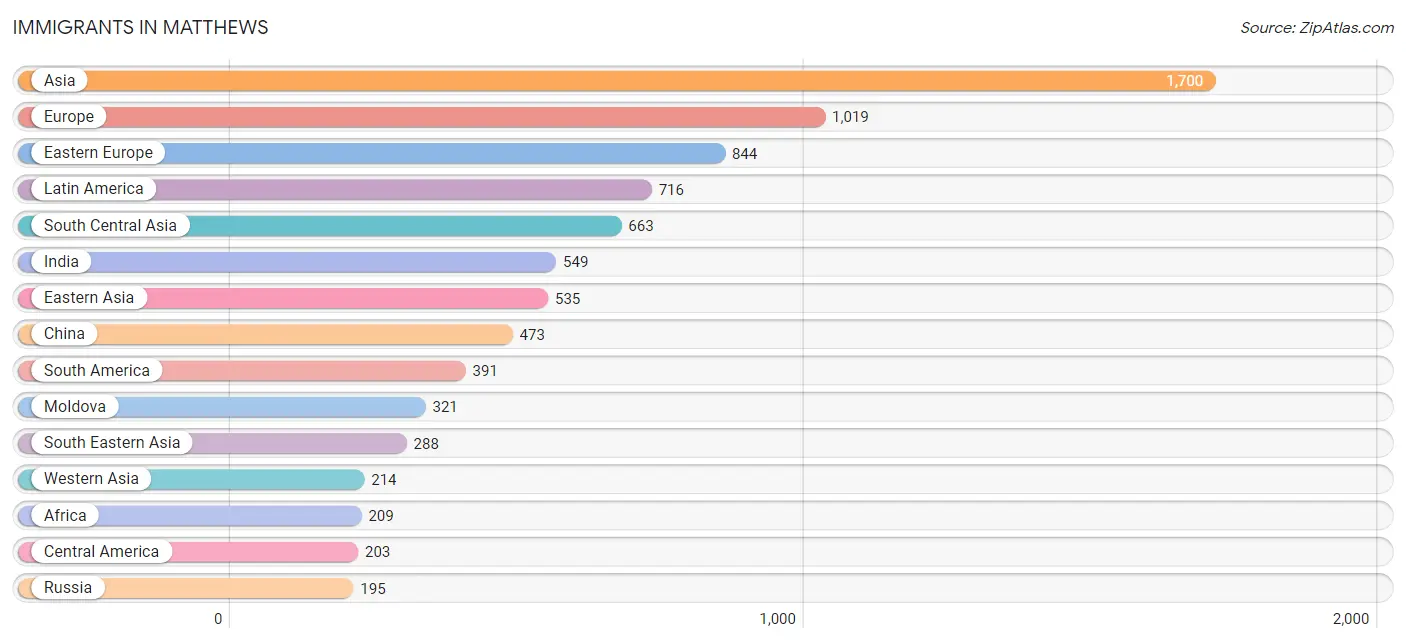
Immigrants in Matthews
The most numerous immigrant groups reported in Matthews came from Asia (1,700 | 5.7%), Europe (1,019 | 3.4%), Eastern Europe (844 | 2.9%), Latin America (716 | 2.4%), and South Central Asia (663 | 2.2%), together accounting for 16.7% of all Matthews residents.
| Immigration Origin | # Population | % Population |
| Africa | 209 | 0.7% |
| Albania | 108 | 0.4% |
| Argentina | 31 | 0.1% |
| Asia | 1,700 | 5.7% |
| Australia | 10 | 0.0% |
| Belarus | 57 | 0.2% |
| Bosnia and Herzegovina | 27 | 0.1% |
| Brazil | 82 | 0.3% |
| Canada | 45 | 0.2% |
| Caribbean | 122 | 0.4% |
| Central America | 203 | 0.7% |
| China | 473 | 1.6% |
| Colombia | 89 | 0.3% |
| Costa Rica | 7 | 0.0% |
| Cuba | 41 | 0.1% |
| Dominican Republic | 25 | 0.1% |
| Eastern Africa | 19 | 0.1% |
| Eastern Asia | 535 | 1.8% |
| Eastern Europe | 844 | 2.9% |
| Ecuador | 43 | 0.2% |
| El Salvador | 22 | 0.1% |
| England | 32 | 0.1% |
| Europe | 1,019 | 3.4% |
| Germany | 16 | 0.1% |
| Greece | 11 | 0.0% |
| Guatemala | 11 | 0.0% |
| Honduras | 58 | 0.2% |
| Hungary | 22 | 0.1% |
| India | 549 | 1.8% |
| Ireland | 25 | 0.1% |
| Israel | 73 | 0.3% |
| Italy | 36 | 0.1% |
| Jamaica | 56 | 0.2% |
| Japan | 2 | 0.0% |
| Jordan | 21 | 0.1% |
| Kazakhstan | 20 | 0.1% |
| Korea | 60 | 0.2% |
| Latin America | 716 | 2.4% |
| Malaysia | 23 | 0.1% |
| Mexico | 87 | 0.3% |
| Middle Africa | 72 | 0.2% |
| Moldova | 321 | 1.1% |
| Nepal | 23 | 0.1% |
| Netherlands | 15 | 0.1% |
| Nigeria | 20 | 0.1% |
| Northern Africa | 13 | 0.0% |
| Northern Europe | 97 | 0.3% |
| Oceania | 10 | 0.0% |
| Pakistan | 71 | 0.2% |
| Panama | 18 | 0.1% |
| Peru | 65 | 0.2% |
| Philippines | 67 | 0.2% |
| Poland | 10 | 0.0% |
| Romania | 37 | 0.1% |
| Russia | 195 | 0.7% |
| Serbia | 12 | 0.0% |
| South Africa | 85 | 0.3% |
| South America | 391 | 1.3% |
| South Central Asia | 663 | 2.2% |
| South Eastern Asia | 288 | 1.0% |
| Southern Europe | 47 | 0.2% |
| Sudan | 13 | 0.0% |
| Sweden | 7 | 0.0% |
| Syria | 65 | 0.2% |
| Taiwan | 28 | 0.1% |
| Uganda | 19 | 0.1% |
| Ukraine | 55 | 0.2% |
| Venezuela | 81 | 0.3% |
| Vietnam | 170 | 0.6% |
| Western Africa | 20 | 0.1% |
| Western Asia | 214 | 0.7% |
| Western Europe | 31 | 0.1% |
| Zaire | 48 | 0.2% | View All 73 Rows |
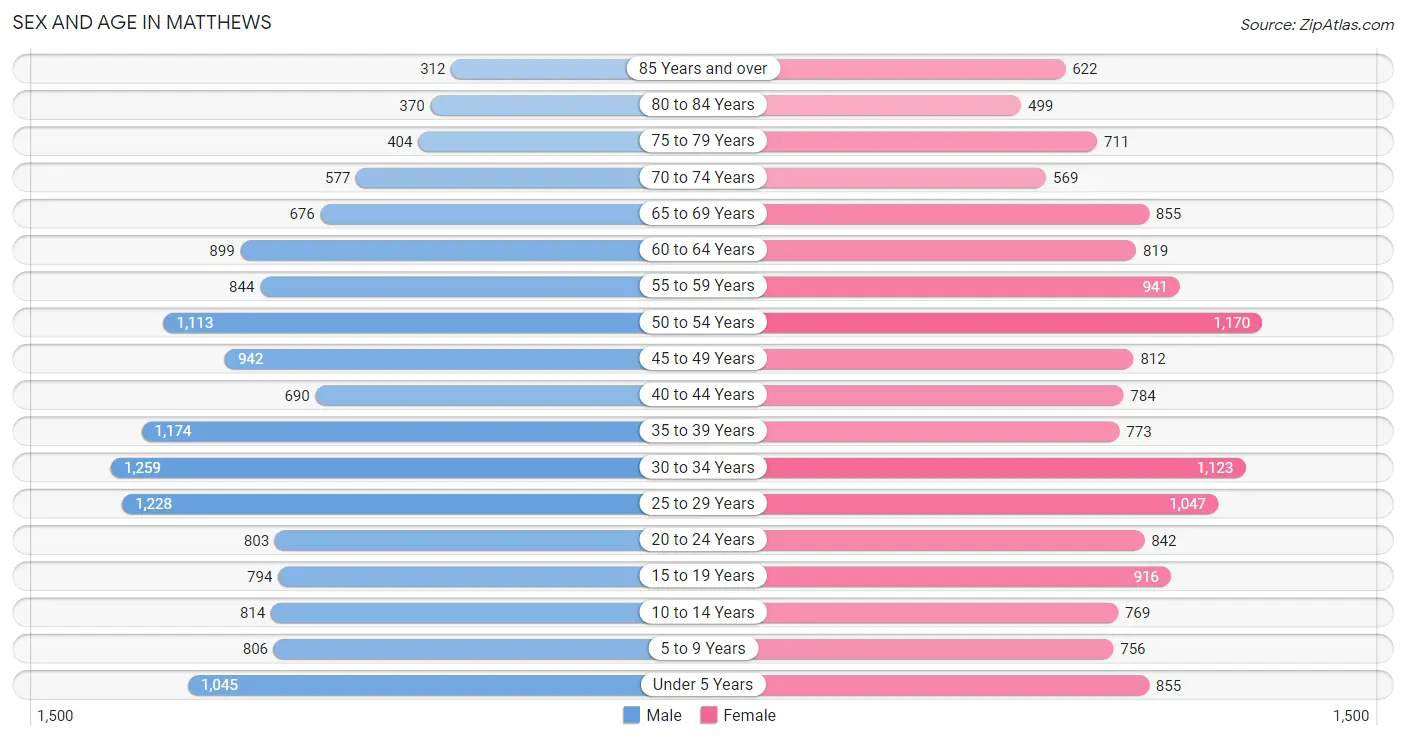
Sex and Age in Matthews
Sex and Age in Matthews
The most populous age groups in Matthews are 30 to 34 Years (1,259 | 8.5%) for men and 50 to 54 Years (1,170 | 7.9%) for women.
| Age Bracket | Male | Female |
| Under 5 Years | 1,045 (7.1%) | 855 (5.8%) |
| 5 to 9 Years | 806 (5.5%) | 756 (5.1%) |
| 10 to 14 Years | 814 (5.5%) | 769 (5.2%) |
| 15 to 19 Years | 794 (5.4%) | 916 (6.2%) |
| 20 to 24 Years | 803 (5.4%) | 842 (5.7%) |
| 25 to 29 Years | 1,228 (8.3%) | 1,047 (7.0%) |
| 30 to 34 Years | 1,259 (8.5%) | 1,123 (7.6%) |
| 35 to 39 Years | 1,174 (8.0%) | 773 (5.2%) |
| 40 to 44 Years | 690 (4.7%) | 784 (5.3%) |
| 45 to 49 Years | 942 (6.4%) | 812 (5.5%) |
| 50 to 54 Years | 1,113 (7.5%) | 1,170 (7.9%) |
| 55 to 59 Years | 844 (5.7%) | 941 (6.3%) |
| 60 to 64 Years | 899 (6.1%) | 819 (5.5%) |
| 65 to 69 Years | 676 (4.6%) | 855 (5.8%) |
| 70 to 74 Years | 577 (3.9%) | 569 (3.8%) |
| 75 to 79 Years | 404 (2.7%) | 711 (4.8%) |
| 80 to 84 Years | 370 (2.5%) | 499 (3.4%) |
| 85 Years and over | 312 (2.1%) | 622 (4.2%) |
| Total | 14,750 (100.0%) | 14,863 (100.0%) |
Families and Households in Matthews
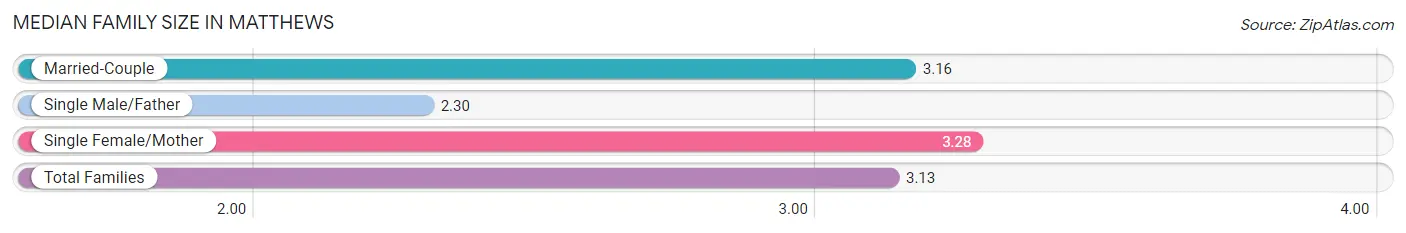
Median Family Size in Matthews
The median family size in Matthews is 3.13 persons per family, with single female/mother families (944 | 11.8%) accounting for the largest median family size of 3.28 persons per family. On the other hand, single male/father families (457 | 5.7%) represent the smallest median family size with 2.30 persons per family.
| Family Type | # Families | Family Size |
| Married-Couple | 6,621 (82.5%) | 3.16 |
| Single Male/Father | 457 (5.7%) | 2.30 |
| Single Female/Mother | 944 (11.8%) | 3.28 |
| Total Families | 8,022 (100.0%) | 3.13 |
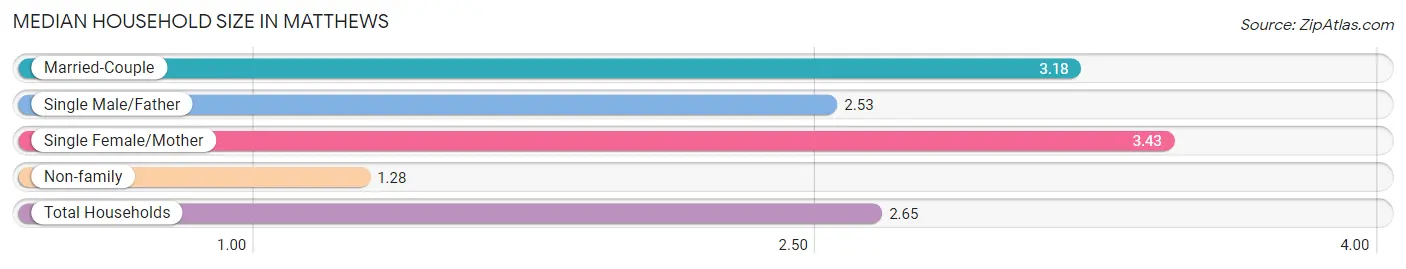
Median Household Size in Matthews
The median household size in Matthews is 2.65 persons per household, with single female/mother households (944 | 8.5%) accounting for the largest median household size of 3.43 persons per household. non-family households (3,039 | 27.5%) represent the smallest median household size with 1.28 persons per household.
| Household Type | # Households | Household Size |
| Married-Couple | 6,621 (59.9%) | 3.18 |
| Single Male/Father | 457 (4.1%) | 2.53 |
| Single Female/Mother | 944 (8.5%) | 3.43 |
| Non-family | 3,039 (27.5%) | 1.28 |
| Total Households | 11,061 (100.0%) | 2.65 |
Household Size by Marriage Status in Matthews
Out of a total of 11,061 households in Matthews, 8,022 (72.5%) are family households, while 3,039 (27.5%) are nonfamily households. The most numerous type of family households are 2-person households, comprising 3,653, and the most common type of nonfamily households are 1-person households, comprising 2,480.
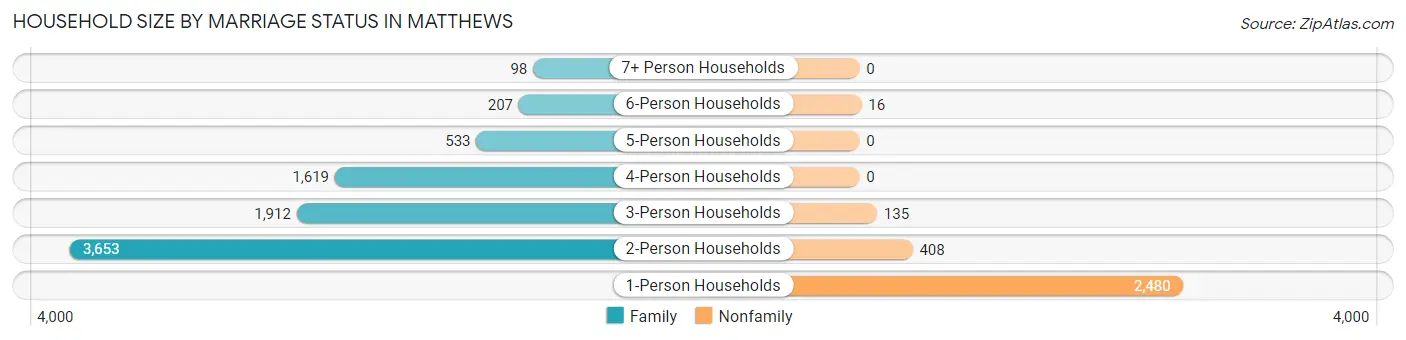
| Household Size | Family Households | Nonfamily Households |
| 1-Person Households | - | 2,480 (22.4%) |
| 2-Person Households | 3,653 (33.0%) | 408 (3.7%) |
| 3-Person Households | 1,912 (17.3%) | 135 (1.2%) |
| 4-Person Households | 1,619 (14.6%) | 0 (0.0%) |
| 5-Person Households | 533 (4.8%) | 0 (0.0%) |
| 6-Person Households | 207 (1.9%) | 16 (0.1%) |
| 7+ Person Households | 98 (0.9%) | 0 (0.0%) |
| Total | 8,022 (72.5%) | 3,039 (27.5%) |
Female Fertility in Matthews
Fertility by Age in Matthews
Average fertility rate in Matthews is 56.0 births per 1,000 women. Women in the age bracket of 20 to 34 years have the highest fertility rate with 85.0 births per 1,000 women. Women in the age bracket of 20 to 34 years acount for 69.2% of all women with births.
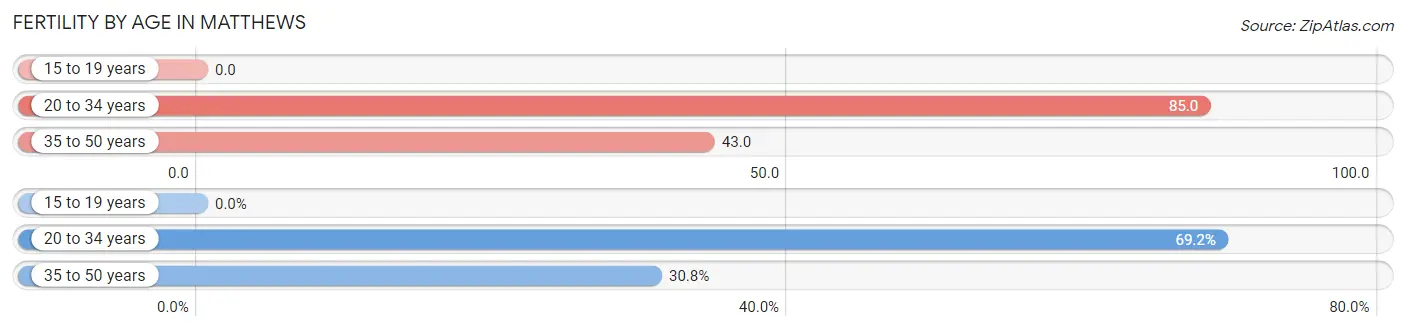
| Age Bracket | Women with Births | Births / 1,000 Women |
| 15 to 19 years | 0 (0.0%) | 0.0 |
| 20 to 34 years | 256 (69.2%) | 85.0 |
| 35 to 50 years | 114 (30.8%) | 43.0 |
| Total | 370 (100.0%) | 56.0 |
Fertility by Age by Marriage Status in Matthews
77.6% of women with births (370) in Matthews are married. The highest percentage of unmarried women with births falls into 20 to 34 years age bracket with 32.4% of them unmarried at the time of birth, while the lowest percentage of unmarried women with births belong to 35 to 50 years age bracket with 0.0% of them unmarried.
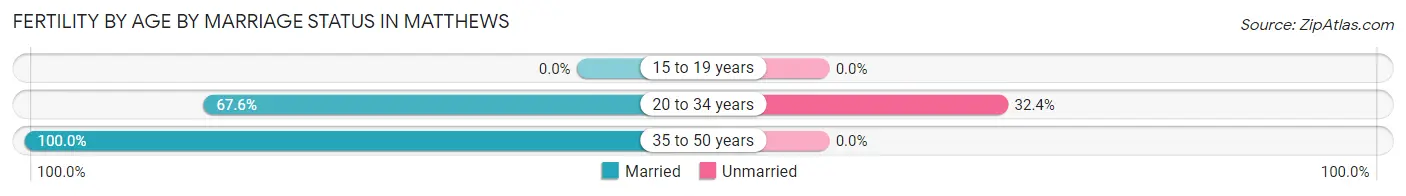
| Age Bracket | Married | Unmarried |
| 15 to 19 years | 0 (0.0%) | 0 (0.0%) |
| 20 to 34 years | 173 (67.6%) | 83 (32.4%) |
| 35 to 50 years | 114 (100.0%) | 0 (0.0%) |
| Total | 287 (77.6%) | 83 (22.4%) |
Fertility by Education in Matthews
Average fertility rate in Matthews is 56.0 births per 1,000 women. Women with the education attainment of bachelor's degree have the highest fertility rate of 76.0 births per 1,000 women, while women with the education attainment of less than high school have the lowest fertility at 14.0 births per 1,000 women. Women with the education attainment of bachelor's degree represent 54.9% of all women with births.
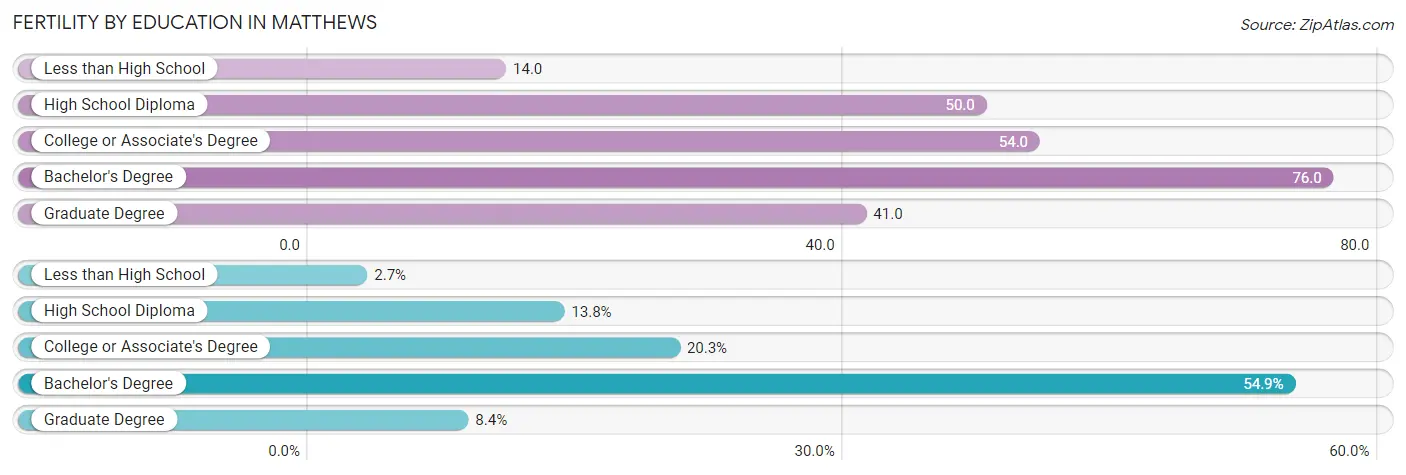
| Educational Attainment | Women with Births | Births / 1,000 Women |
| Less than High School | 10 (2.7%) | 14.0 |
| High School Diploma | 51 (13.8%) | 50.0 |
| College or Associate's Degree | 75 (20.3%) | 54.0 |
| Bachelor's Degree | 203 (54.9%) | 76.0 |
| Graduate Degree | 31 (8.4%) | 41.0 |
| Total | 370 (100.0%) | 56.0 |
Fertility by Education by Marriage Status in Matthews
22.4% of women with births in Matthews are unmarried. Women with the educational attainment of graduate degree are most likely to be married with 100.0% of them married at childbirth, while women with the educational attainment of less than high school are least likely to be married with 100.0% of them unmarried at childbirth.
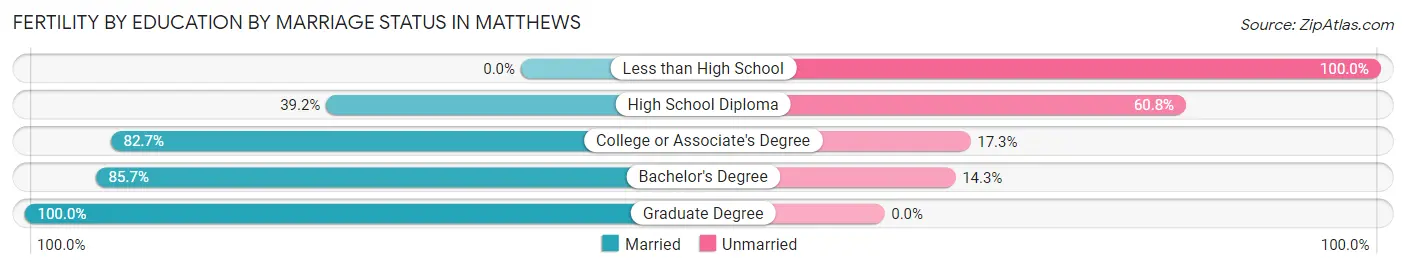
| Educational Attainment | Married | Unmarried |
| Less than High School | 0 (0.0%) | 10 (100.0%) |
| High School Diploma | 20 (39.2%) | 31 (60.8%) |
| College or Associate's Degree | 62 (82.7%) | 13 (17.3%) |
| Bachelor's Degree | 174 (85.7%) | 29 (14.3%) |
| Graduate Degree | 31 (100.0%) | 0 (0.0%) |
| Total | 287 (77.6%) | 83 (22.4%) |
Employment Characteristics in Matthews
Employment by Class of Employer in Matthews
Among the 15,649 employed individuals in Matthews, private company employees (10,918 | 69.8%), not-for-profit organizations (1,502 | 9.6%), and self-employed (not incorporated) (1,086 | 6.9%) make up the most common classes of employment.
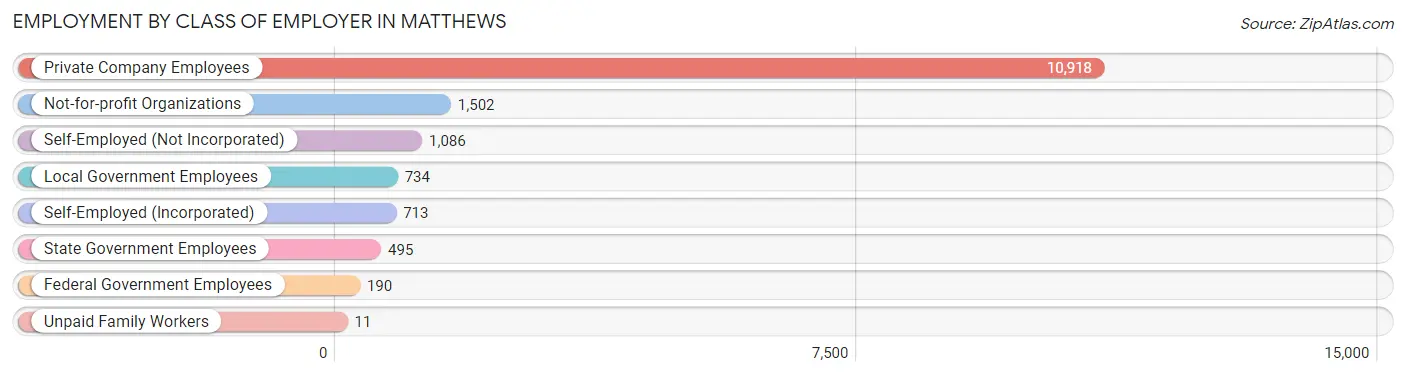
| Employer Class | # Employees | % Employees |
| Private Company Employees | 10,918 | 69.8% |
| Self-Employed (Incorporated) | 713 | 4.6% |
| Self-Employed (Not Incorporated) | 1,086 | 6.9% |
| Not-for-profit Organizations | 1,502 | 9.6% |
| Local Government Employees | 734 | 4.7% |
| State Government Employees | 495 | 3.2% |
| Federal Government Employees | 190 | 1.2% |
| Unpaid Family Workers | 11 | 0.1% |
| Total | 15,649 | 100.0% |
Employment Status by Age in Matthews
According to the labor force statistics for Matthews, out of the total population over 16 years of age (24,205), 67.1% or 16,242 individuals are in the labor force, with 3.0% or 487 of them unemployed. The age group with the highest labor force participation rate is 30 to 34 years, with 91.2% or 2,172 individuals in the labor force. Within the labor force, the 75 years and over age range has the highest percentage of unemployed individuals, with 13.4% or 40 of them being unemployed.
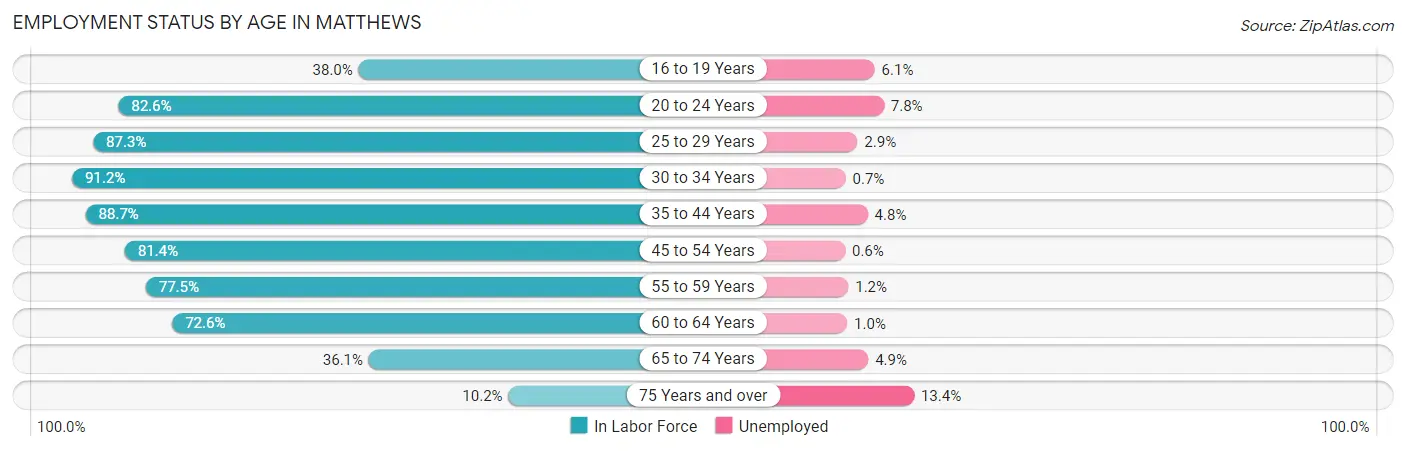
| Age Bracket | In Labor Force | Unemployed |
| 16 to 19 Years | 512 (38.0%) | 31 (6.1%) |
| 20 to 24 Years | 1,359 (82.6%) | 106 (7.8%) |
| 25 to 29 Years | 1,986 (87.3%) | 58 (2.9%) |
| 30 to 34 Years | 2,172 (91.2%) | 15 (0.7%) |
| 35 to 44 Years | 3,034 (88.7%) | 146 (4.8%) |
| 45 to 54 Years | 3,286 (81.4%) | 20 (0.6%) |
| 55 to 59 Years | 1,383 (77.5%) | 17 (1.2%) |
| 60 to 64 Years | 1,247 (72.6%) | 12 (1.0%) |
| 65 to 74 Years | 966 (36.1%) | 47 (4.9%) |
| 75 Years and over | 298 (10.2%) | 40 (13.4%) |
| Total | 16,242 (67.1%) | 487 (3.0%) |
Employment Status by Educational Attainment in Matthews
According to labor force statistics for Matthews, 83.9% of individuals (13,104) out of the total population between 25 and 64 years of age (15,618) are in the labor force, with 2.0% or 262 of them being unemployed. The group with the highest labor force participation rate are those with the educational attainment of bachelor's degree or higher, with 86.1% or 7,495 individuals in the labor force. Within the labor force, individuals with high school diploma education have the highest percentage of unemployment, with 5.6% or 103 of them being unemployed.
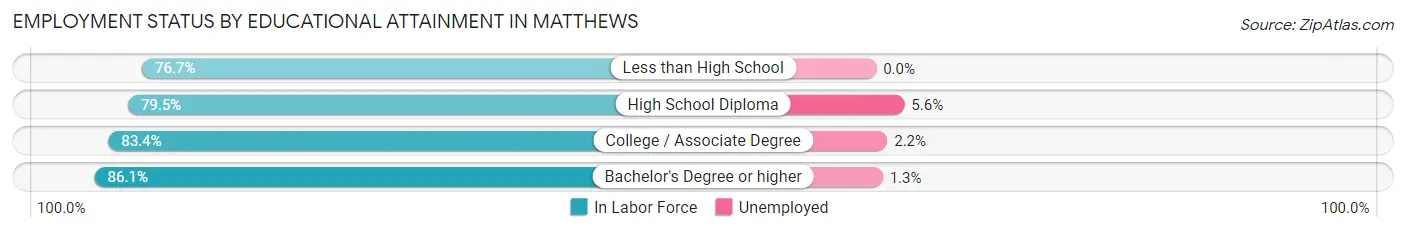
| Educational Attainment | In Labor Force | Unemployed |
| Less than High School | 680 (76.7%) | 0 (0.0%) |
| High School Diploma | 1,845 (79.5%) | 130 (5.6%) |
| College / Associate Degree | 3,090 (83.4%) | 82 (2.2%) |
| Bachelor's Degree or higher | 7,495 (86.1%) | 113 (1.3%) |
| Total | 13,104 (83.9%) | 312 (2.0%) |
Employment Occupations by Sex in Matthews
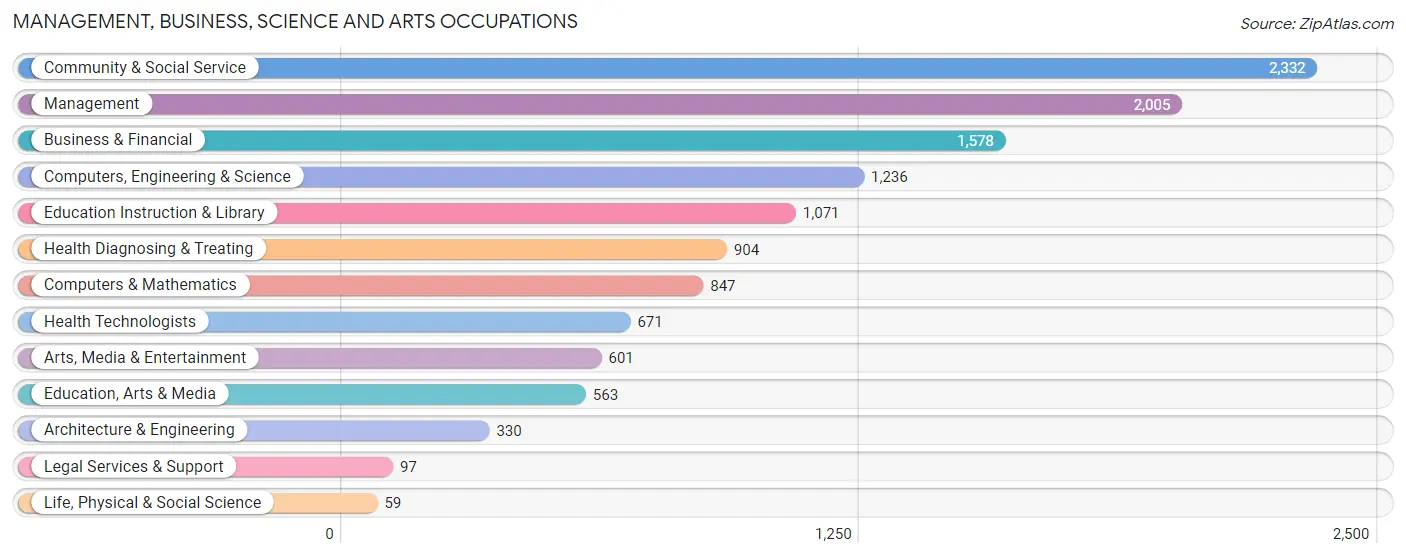
Management, Business, Science and Arts Occupations
The most common Management, Business, Science and Arts occupations in Matthews are Community & Social Service (2,332 | 14.8%), Management (2,005 | 12.7%), Business & Financial (1,578 | 10.0%), Computers, Engineering & Science (1,236 | 7.9%), and Education Instruction & Library (1,071 | 6.8%).
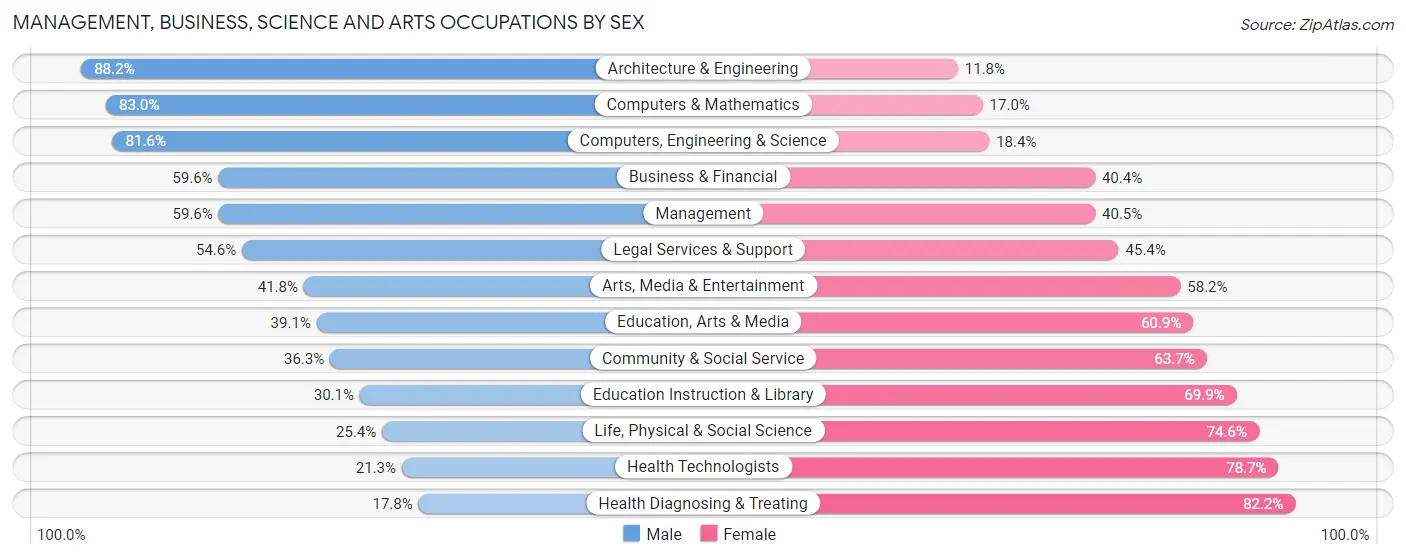
Management, Business, Science and Arts Occupations by Sex
Within the Management, Business, Science and Arts occupations in Matthews, the most male-oriented occupations are Architecture & Engineering (88.2%), Computers & Mathematics (83.0%), and Computers, Engineering & Science (81.6%), while the most female-oriented occupations are Health Diagnosing & Treating (82.2%), Health Technologists (78.7%), and Life, Physical & Social Science (74.6%).
| Occupation | Male | Female |
| Management | 1,194 (59.6%) | 811 (40.5%) |
| Business & Financial | 940 (59.6%) | 638 (40.4%) |
| Computers, Engineering & Science | 1,009 (81.6%) | 227 (18.4%) |
| Computers & Mathematics | 703 (83.0%) | 144 (17.0%) |
| Architecture & Engineering | 291 (88.2%) | 39 (11.8%) |
| Life, Physical & Social Science | 15 (25.4%) | 44 (74.6%) |
| Community & Social Service | 846 (36.3%) | 1,486 (63.7%) |
| Education, Arts & Media | 220 (39.1%) | 343 (60.9%) |
| Legal Services & Support | 53 (54.6%) | 44 (45.4%) |
| Education Instruction & Library | 322 (30.1%) | 749 (69.9%) |
| Arts, Media & Entertainment | 251 (41.8%) | 350 (58.2%) |
| Health Diagnosing & Treating | 161 (17.8%) | 743 (82.2%) |
| Health Technologists | 143 (21.3%) | 528 (78.7%) |
| Total (Category) | 4,150 (51.5%) | 3,905 (48.5%) |
| Total (Overall) | 8,649 (54.9%) | 7,106 (45.1%) |
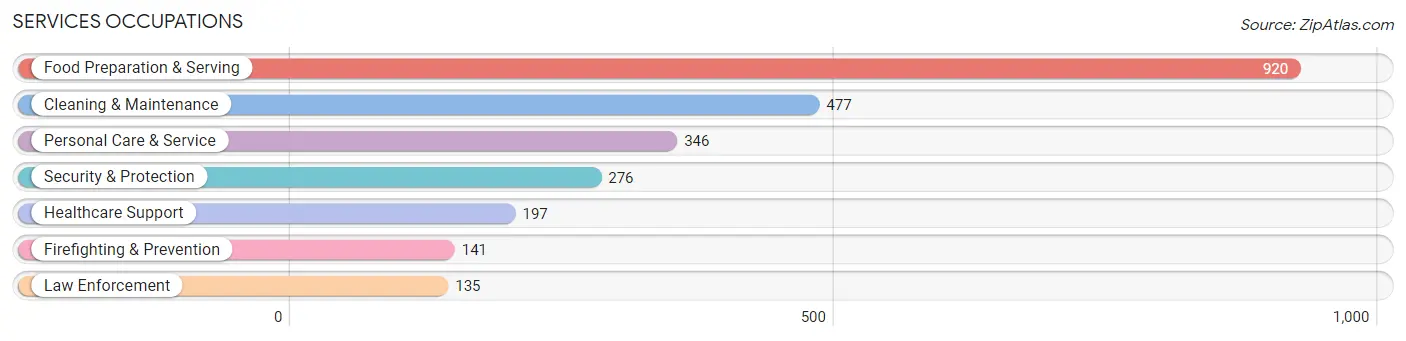
Services Occupations
The most common Services occupations in Matthews are Food Preparation & Serving (920 | 5.8%), Cleaning & Maintenance (477 | 3.0%), Personal Care & Service (346 | 2.2%), Security & Protection (276 | 1.8%), and Healthcare Support (197 | 1.3%).
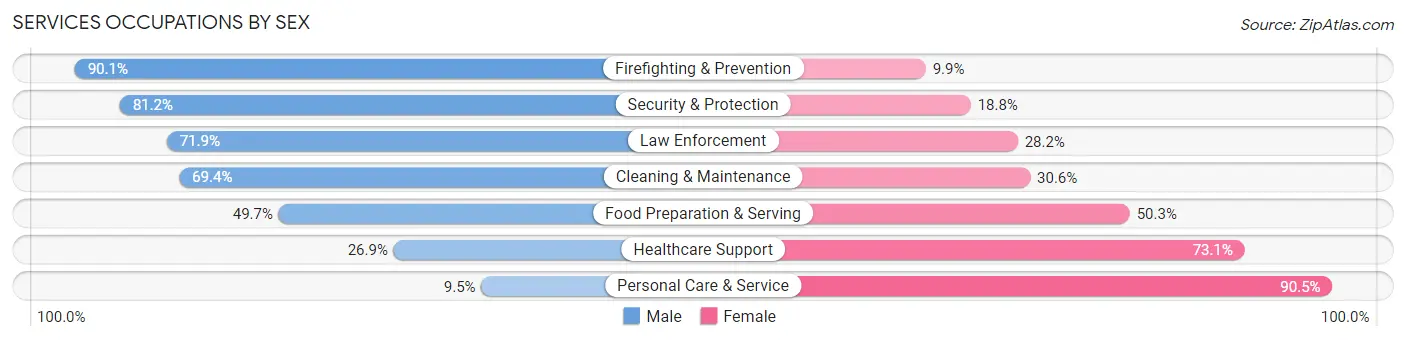
Services Occupations by Sex
Within the Services occupations in Matthews, the most male-oriented occupations are Firefighting & Prevention (90.1%), Security & Protection (81.2%), and Law Enforcement (71.9%), while the most female-oriented occupations are Personal Care & Service (90.5%), Healthcare Support (73.1%), and Food Preparation & Serving (50.3%).
| Occupation | Male | Female |
| Healthcare Support | 53 (26.9%) | 144 (73.1%) |
| Security & Protection | 224 (81.2%) | 52 (18.8%) |
| Firefighting & Prevention | 127 (90.1%) | 14 (9.9%) |
| Law Enforcement | 97 (71.9%) | 38 (28.1%) |
| Food Preparation & Serving | 457 (49.7%) | 463 (50.3%) |
| Cleaning & Maintenance | 331 (69.4%) | 146 (30.6%) |
| Personal Care & Service | 33 (9.5%) | 313 (90.5%) |
| Total (Category) | 1,098 (49.5%) | 1,118 (50.4%) |
| Total (Overall) | 8,649 (54.9%) | 7,106 (45.1%) |
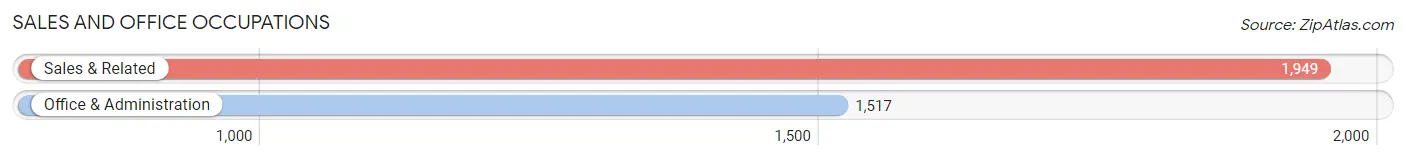
Sales and Office Occupations
The most common Sales and Office occupations in Matthews are Sales & Related (1,949 | 12.4%), and Office & Administration (1,517 | 9.6%).
Sales and Office Occupations by Sex
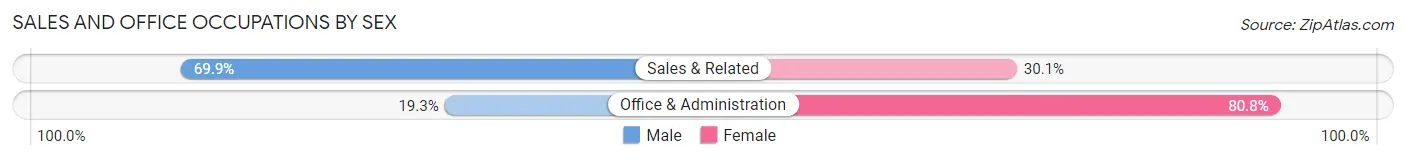
| Occupation | Male | Female |
| Sales & Related | 1,363 (69.9%) | 586 (30.1%) |
| Office & Administration | 292 (19.3%) | 1,225 (80.7%) |
| Total (Category) | 1,655 (47.7%) | 1,811 (52.2%) |
| Total (Overall) | 8,649 (54.9%) | 7,106 (45.1%) |
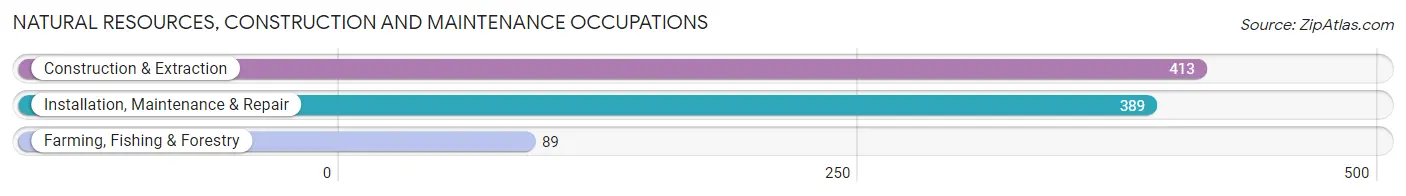
Natural Resources, Construction and Maintenance Occupations
The most common Natural Resources, Construction and Maintenance occupations in Matthews are Construction & Extraction (413 | 2.6%), Installation, Maintenance & Repair (389 | 2.5%), and Farming, Fishing & Forestry (89 | 0.6%).
Natural Resources, Construction and Maintenance Occupations by Sex
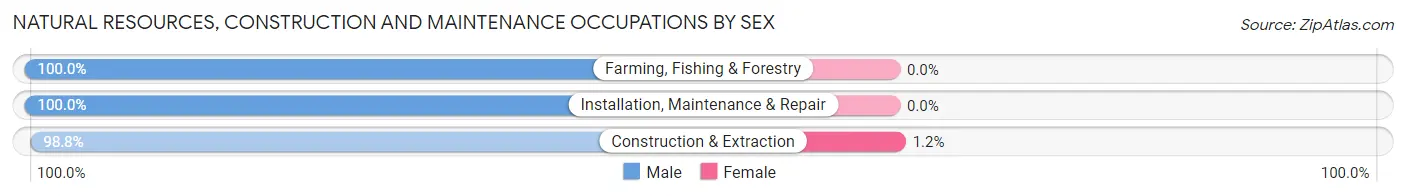
| Occupation | Male | Female |
| Farming, Fishing & Forestry | 89 (100.0%) | 0 (0.0%) |
| Construction & Extraction | 408 (98.8%) | 5 (1.2%) |
| Installation, Maintenance & Repair | 389 (100.0%) | 0 (0.0%) |
| Total (Category) | 886 (99.4%) | 5 (0.6%) |
| Total (Overall) | 8,649 (54.9%) | 7,106 (45.1%) |
Production, Transportation and Moving Occupations
The most common Production, Transportation and Moving occupations in Matthews are Material Moving (569 | 3.6%), Production (284 | 1.8%), and Transportation (274 | 1.7%).
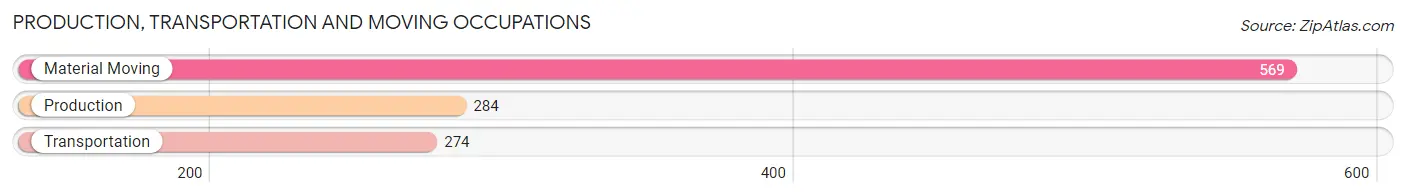
Production, Transportation and Moving Occupations by Sex
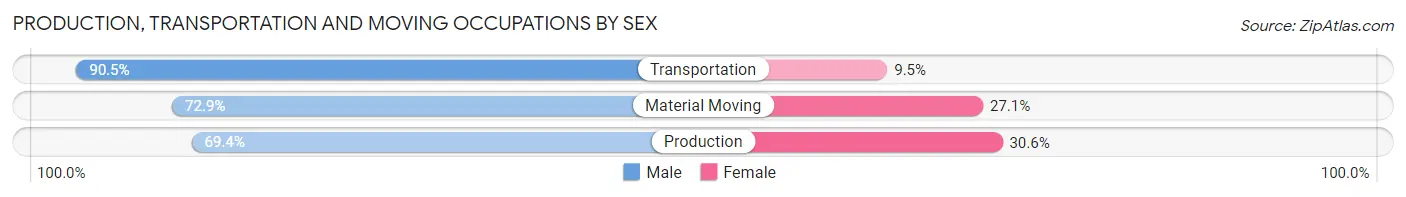
| Occupation | Male | Female |
| Production | 197 (69.4%) | 87 (30.6%) |
| Transportation | 248 (90.5%) | 26 (9.5%) |
| Material Moving | 415 (72.9%) | 154 (27.1%) |
| Total (Category) | 860 (76.3%) | 267 (23.7%) |
| Total (Overall) | 8,649 (54.9%) | 7,106 (45.1%) |
Employment Industries by Sex in Matthews
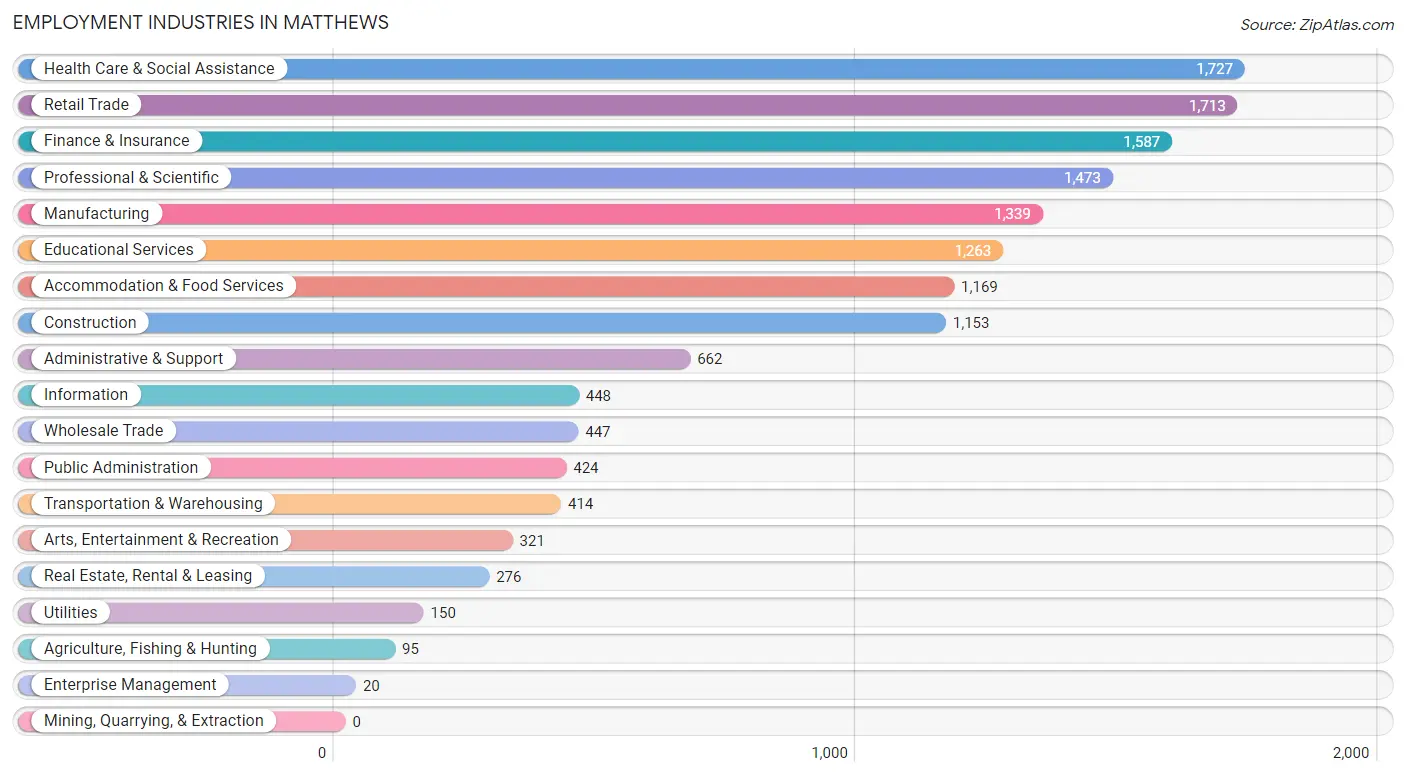
Employment Industries in Matthews
The major employment industries in Matthews include Health Care & Social Assistance (1,727 | 11.0%), Retail Trade (1,713 | 10.9%), Finance & Insurance (1,587 | 10.1%), Professional & Scientific (1,473 | 9.3%), and Manufacturing (1,339 | 8.5%).
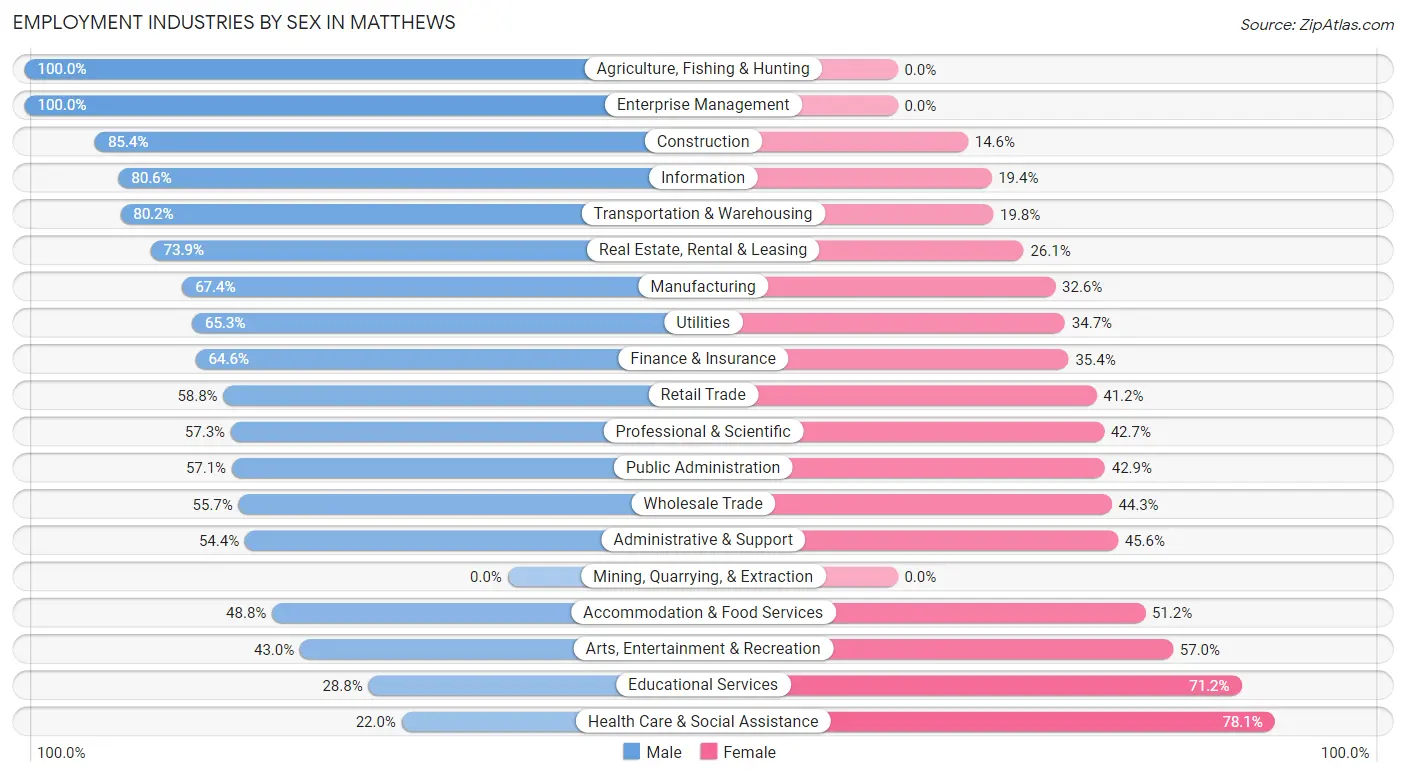
Employment Industries by Sex in Matthews
The Matthews industries that see more men than women are Agriculture, Fishing & Hunting (100.0%), Enterprise Management (100.0%), and Construction (85.4%), whereas the industries that tend to have a higher number of women are Health Care & Social Assistance (78.0%), Educational Services (71.2%), and Arts, Entertainment & Recreation (57.0%).
| Industry | Male | Female |
| Agriculture, Fishing & Hunting | 95 (100.0%) | 0 (0.0%) |
| Mining, Quarrying, & Extraction | 0 (0.0%) | 0 (0.0%) |
| Construction | 985 (85.4%) | 168 (14.6%) |
| Manufacturing | 902 (67.4%) | 437 (32.6%) |
| Wholesale Trade | 249 (55.7%) | 198 (44.3%) |
| Retail Trade | 1,008 (58.8%) | 705 (41.2%) |
| Transportation & Warehousing | 332 (80.2%) | 82 (19.8%) |
| Utilities | 98 (65.3%) | 52 (34.7%) |
| Information | 361 (80.6%) | 87 (19.4%) |
| Finance & Insurance | 1,025 (64.6%) | 562 (35.4%) |
| Real Estate, Rental & Leasing | 204 (73.9%) | 72 (26.1%) |
| Professional & Scientific | 844 (57.3%) | 629 (42.7%) |
| Enterprise Management | 20 (100.0%) | 0 (0.0%) |
| Administrative & Support | 360 (54.4%) | 302 (45.6%) |
| Educational Services | 364 (28.8%) | 899 (71.2%) |
| Health Care & Social Assistance | 379 (22.0%) | 1,348 (78.0%) |
| Arts, Entertainment & Recreation | 138 (43.0%) | 183 (57.0%) |
| Accommodation & Food Services | 570 (48.8%) | 599 (51.2%) |
| Public Administration | 242 (57.1%) | 182 (42.9%) |
| Total | 8,649 (54.9%) | 7,106 (45.1%) |
Education in Matthews
School Enrollment in Matthews
The most common levels of schooling among the 6,024 students in Matthews are high school (1,327 | 22.0%), college / undergraduate (1,235 | 20.5%), and middle school (1,126 | 18.7%).
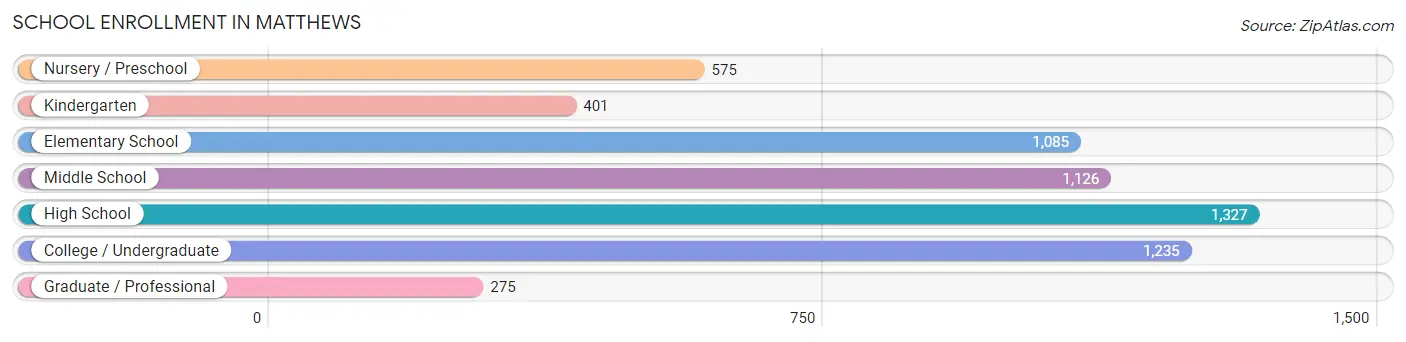
| School Level | # Students | % Students |
| Nursery / Preschool | 575 | 9.6% |
| Kindergarten | 401 | 6.7% |
| Elementary School | 1,085 | 18.0% |
| Middle School | 1,126 | 18.7% |
| High School | 1,327 | 22.0% |
| College / Undergraduate | 1,235 | 20.5% |
| Graduate / Professional | 275 | 4.6% |
| Total | 6,024 | 100.0% |
School Enrollment by Age by Funding Source in Matthews
Out of a total of 6,024 students who are enrolled in schools in Matthews, 1,223 (20.3%) attend a private institution, while the remaining 4,801 (79.7%) are enrolled in public schools. The age group of 3 to 4 year olds has the highest likelihood of being enrolled in private schools, with 355 (75.4% in the age bracket) enrolled. Conversely, the age group of 35 years and over has the lowest likelihood of being enrolled in a private school, with 178 (96.7% in the age bracket) attending a public institution.
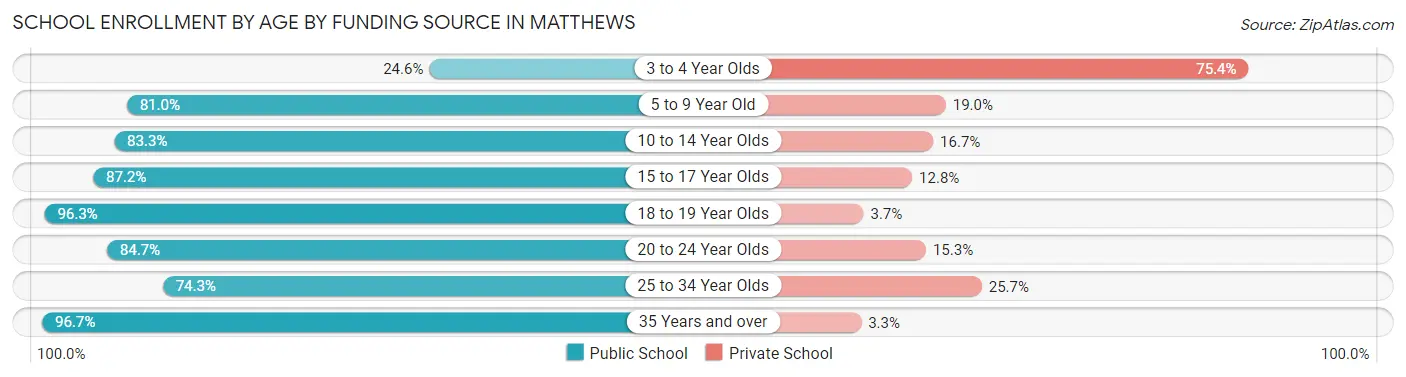
| Age Bracket | Public School | Private School |
| 3 to 4 Year Olds | 116 (24.6%) | 355 (75.4%) |
| 5 to 9 Year Old | 1,136 (81.0%) | 267 (19.0%) |
| 10 to 14 Year Olds | 1,280 (83.3%) | 256 (16.7%) |
| 15 to 17 Year Olds | 848 (87.2%) | 124 (12.8%) |
| 18 to 19 Year Olds | 390 (96.3%) | 15 (3.7%) |
| 20 to 24 Year Olds | 602 (84.7%) | 109 (15.3%) |
| 25 to 34 Year Olds | 254 (74.3%) | 88 (25.7%) |
| 35 Years and over | 178 (96.7%) | 6 (3.3%) |
| Total | 4,801 (79.7%) | 1,223 (20.3%) |
Educational Attainment by Field of Study in Matthews
Business (2,930 | 24.7%), education (1,316 | 11.1%), science & technology (868 | 7.3%), computers & mathematics (836 | 7.0%), and engineering (831 | 7.0%) are the most common fields of study among 11,857 individuals in Matthews who have obtained a bachelor's degree or higher.
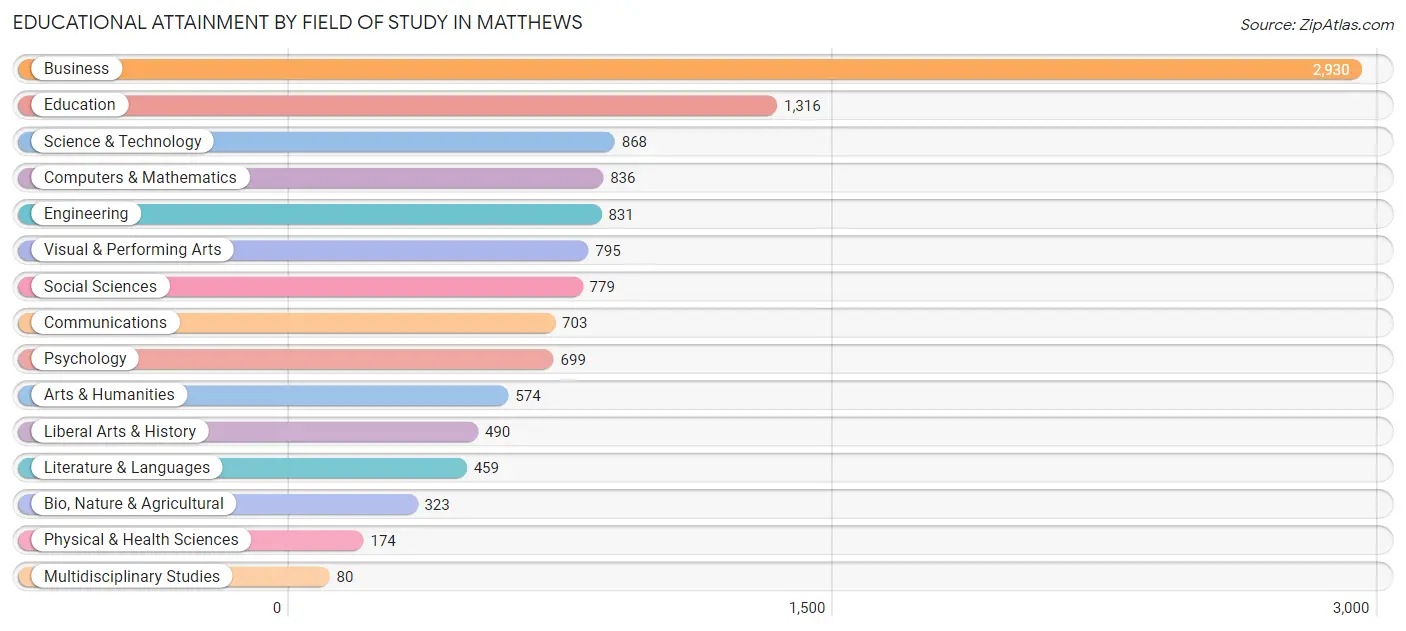
| Field of Study | # Graduates | % Graduates |
| Computers & Mathematics | 836 | 7.0% |
| Bio, Nature & Agricultural | 323 | 2.7% |
| Physical & Health Sciences | 174 | 1.5% |
| Psychology | 699 | 5.9% |
| Social Sciences | 779 | 6.6% |
| Engineering | 831 | 7.0% |
| Multidisciplinary Studies | 80 | 0.7% |
| Science & Technology | 868 | 7.3% |
| Business | 2,930 | 24.7% |
| Education | 1,316 | 11.1% |
| Literature & Languages | 459 | 3.9% |
| Liberal Arts & History | 490 | 4.1% |
| Visual & Performing Arts | 795 | 6.7% |
| Communications | 703 | 5.9% |
| Arts & Humanities | 574 | 4.8% |
| Total | 11,857 | 100.0% |
Transportation & Commute in Matthews
Vehicle Availability by Sex in Matthews
The most prevalent vehicle ownership categories in Matthews are males with 2 vehicles (4,384, accounting for 50.8%) and females with 2 vehicles (3,451, making up 62.5%).
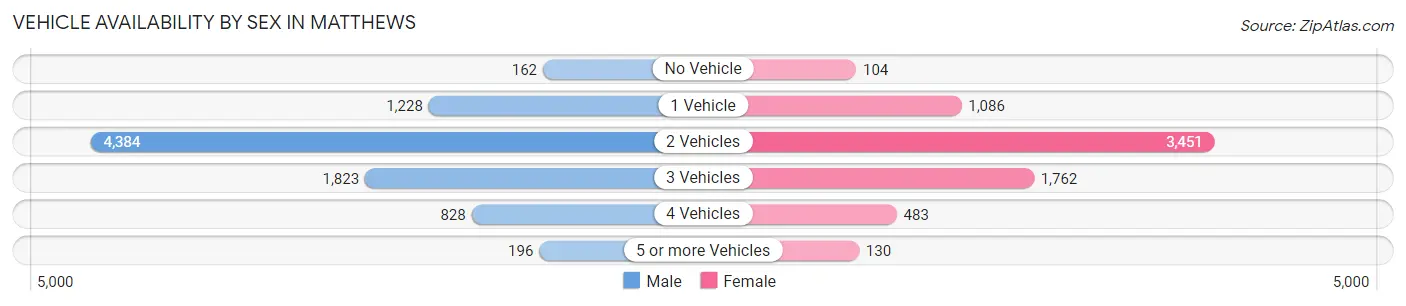
| Vehicles Available | Male | Female |
| No Vehicle | 162 (1.9%) | 104 (1.5%) |
| 1 Vehicle | 1,228 (14.2%) | 1,086 (15.5%) |
| 2 Vehicles | 4,384 (50.8%) | 3,451 (49.2%) |
| 3 Vehicles | 1,823 (21.1%) | 1,762 (25.1%) |
| 4 Vehicles | 828 (9.6%) | 483 (6.9%) |
| 5 or more Vehicles | 196 (2.3%) | 130 (1.8%) |
| Total | 8,621 (100.0%) | 7,016 (100.0%) |
Commute Time in Matthews
The most frequently occuring commute durations in Matthews are 30 to 34 minutes (2,452 commuters, 18.4%), 15 to 19 minutes (1,901 commuters, 14.3%), and 20 to 24 minutes (1,858 commuters, 14.0%).
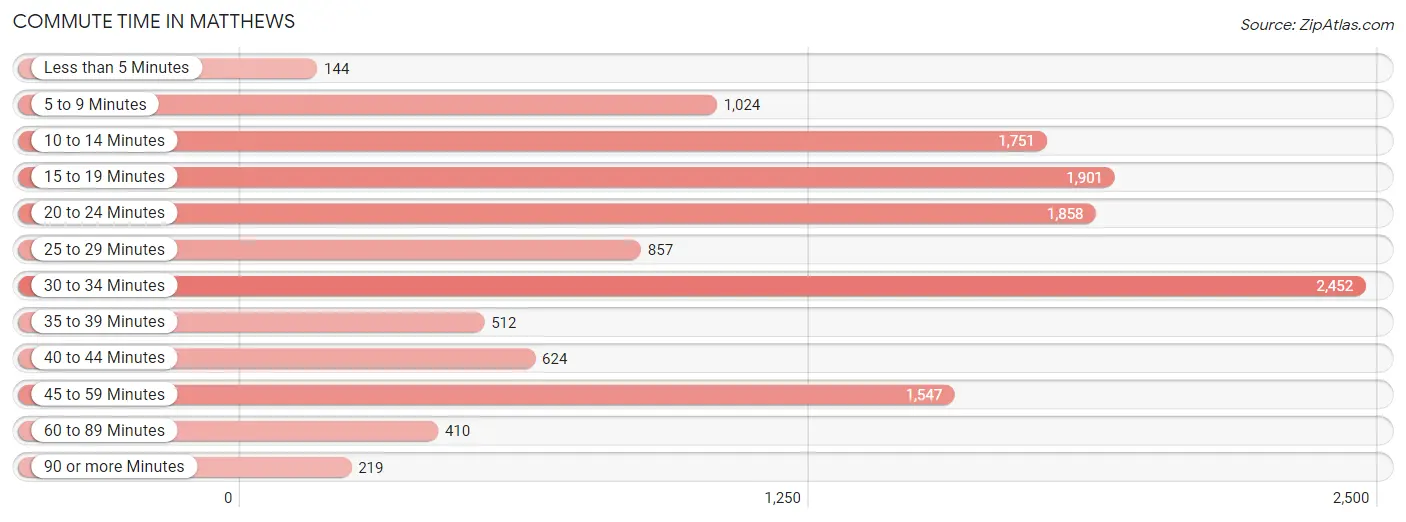
| Commute Time | # Commuters | % Commuters |
| Less than 5 Minutes | 144 | 1.1% |
| 5 to 9 Minutes | 1,024 | 7.7% |
| 10 to 14 Minutes | 1,751 | 13.2% |
| 15 to 19 Minutes | 1,901 | 14.3% |
| 20 to 24 Minutes | 1,858 | 14.0% |
| 25 to 29 Minutes | 857 | 6.4% |
| 30 to 34 Minutes | 2,452 | 18.4% |
| 35 to 39 Minutes | 512 | 3.8% |
| 40 to 44 Minutes | 624 | 4.7% |
| 45 to 59 Minutes | 1,547 | 11.6% |
| 60 to 89 Minutes | 410 | 3.1% |
| 90 or more Minutes | 219 | 1.7% |
Commute Time by Sex in Matthews
The most common commute times in Matthews are 30 to 34 minutes (1,212 commuters, 16.9%) for males and 30 to 34 minutes (1,240 commuters, 20.3%) for females.
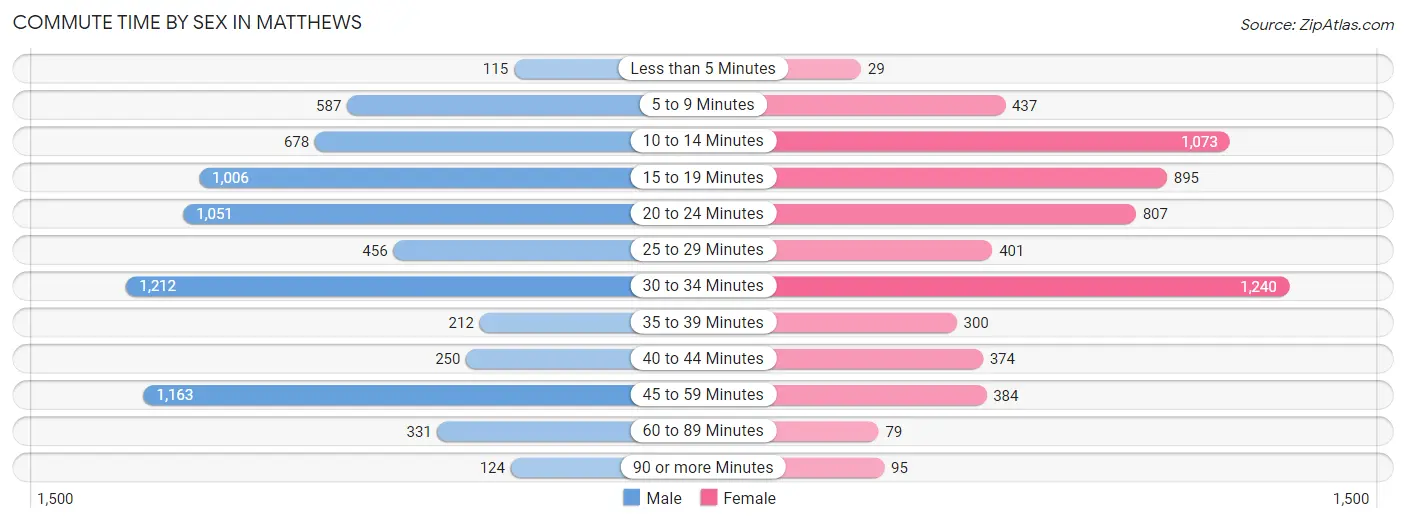
| Commute Time | Male | Female |
| Less than 5 Minutes | 115 (1.6%) | 29 (0.5%) |
| 5 to 9 Minutes | 587 (8.2%) | 437 (7.1%) |
| 10 to 14 Minutes | 678 (9.4%) | 1,073 (17.5%) |
| 15 to 19 Minutes | 1,006 (14.0%) | 895 (14.6%) |
| 20 to 24 Minutes | 1,051 (14.6%) | 807 (13.2%) |
| 25 to 29 Minutes | 456 (6.4%) | 401 (6.6%) |
| 30 to 34 Minutes | 1,212 (16.9%) | 1,240 (20.3%) |
| 35 to 39 Minutes | 212 (2.9%) | 300 (4.9%) |
| 40 to 44 Minutes | 250 (3.5%) | 374 (6.1%) |
| 45 to 59 Minutes | 1,163 (16.2%) | 384 (6.3%) |
| 60 to 89 Minutes | 331 (4.6%) | 79 (1.3%) |
| 90 or more Minutes | 124 (1.7%) | 95 (1.5%) |
Time of Departure to Work by Sex in Matthews
The most frequent times of departure to work in Matthews are 7:00 AM to 7:29 AM (1,226, 17.1%) for males and 7:00 AM to 7:29 AM (997, 16.3%) for females.
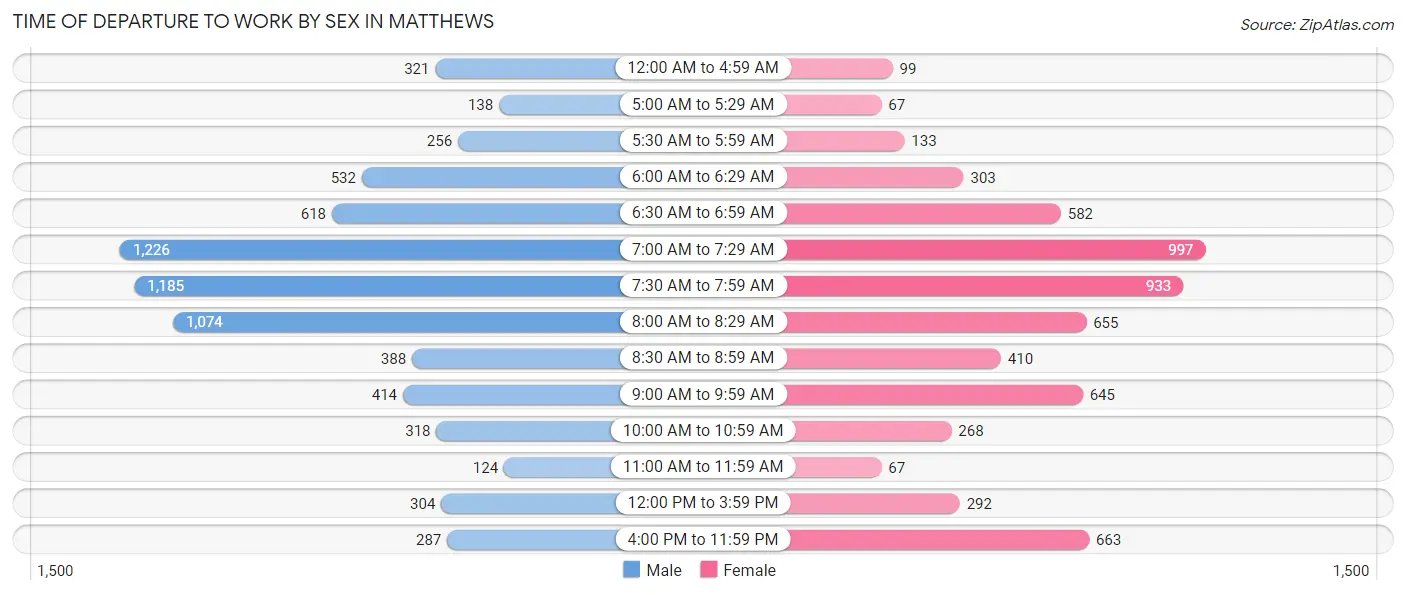
| Time of Departure | Male | Female |
| 12:00 AM to 4:59 AM | 321 (4.5%) | 99 (1.6%) |
| 5:00 AM to 5:29 AM | 138 (1.9%) | 67 (1.1%) |
| 5:30 AM to 5:59 AM | 256 (3.6%) | 133 (2.2%) |
| 6:00 AM to 6:29 AM | 532 (7.4%) | 303 (5.0%) |
| 6:30 AM to 6:59 AM | 618 (8.6%) | 582 (9.5%) |
| 7:00 AM to 7:29 AM | 1,226 (17.1%) | 997 (16.3%) |
| 7:30 AM to 7:59 AM | 1,185 (16.5%) | 933 (15.3%) |
| 8:00 AM to 8:29 AM | 1,074 (14.9%) | 655 (10.7%) |
| 8:30 AM to 8:59 AM | 388 (5.4%) | 410 (6.7%) |
| 9:00 AM to 9:59 AM | 414 (5.8%) | 645 (10.5%) |
| 10:00 AM to 10:59 AM | 318 (4.4%) | 268 (4.4%) |
| 11:00 AM to 11:59 AM | 124 (1.7%) | 67 (1.1%) |
| 12:00 PM to 3:59 PM | 304 (4.2%) | 292 (4.8%) |
| 4:00 PM to 11:59 PM | 287 (4.0%) | 663 (10.8%) |
| Total | 7,185 (100.0%) | 6,114 (100.0%) |
Housing Occupancy in Matthews
Occupancy by Ownership in Matthews
Of the total 11,061 dwellings in Matthews, owner-occupied units account for 7,415 (67.0%), while renter-occupied units make up 3,646 (33.0%).
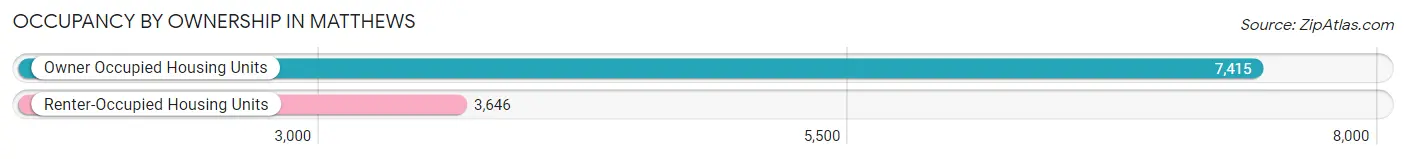
| Occupancy | # Housing Units | % Housing Units |
| Owner Occupied Housing Units | 7,415 | 67.0% |
| Renter-Occupied Housing Units | 3,646 | 33.0% |
| Total Occupied Housing Units | 11,061 | 100.0% |
Occupancy by Household Size in Matthews
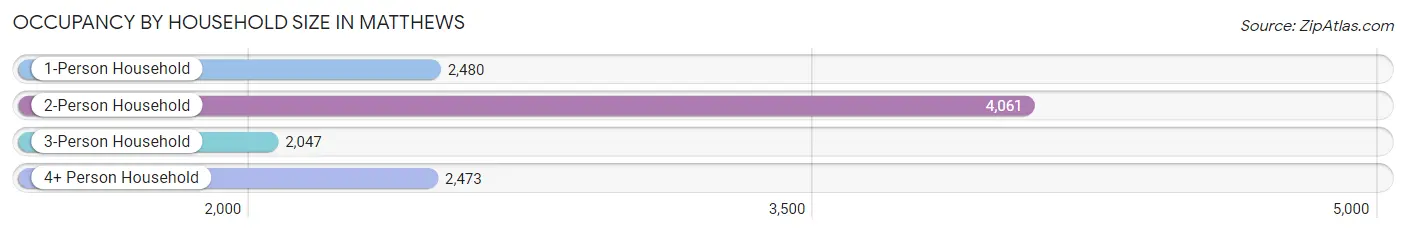
| Household Size | # Housing Units | % Housing Units |
| 1-Person Household | 2,480 | 22.4% |
| 2-Person Household | 4,061 | 36.7% |
| 3-Person Household | 2,047 | 18.5% |
| 4+ Person Household | 2,473 | 22.4% |
| Total Housing Units | 11,061 | 100.0% |
Occupancy by Ownership by Household Size in Matthews
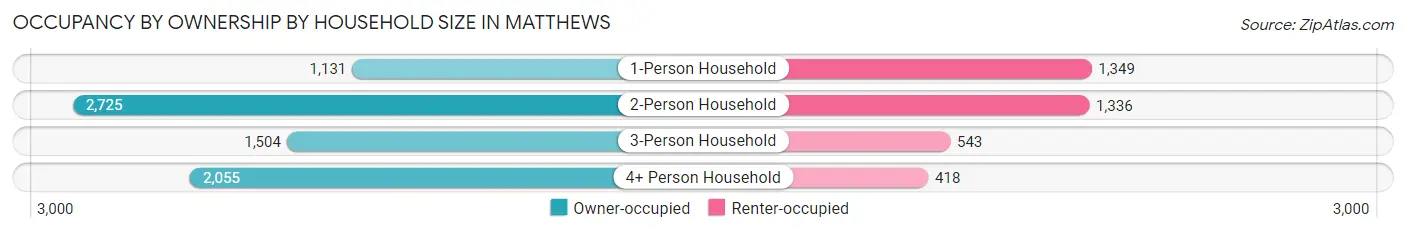
| Household Size | Owner-occupied | Renter-occupied |
| 1-Person Household | 1,131 (45.6%) | 1,349 (54.4%) |
| 2-Person Household | 2,725 (67.1%) | 1,336 (32.9%) |
| 3-Person Household | 1,504 (73.5%) | 543 (26.5%) |
| 4+ Person Household | 2,055 (83.1%) | 418 (16.9%) |
| Total Housing Units | 7,415 (67.0%) | 3,646 (33.0%) |
Occupancy by Educational Attainment in Matthews
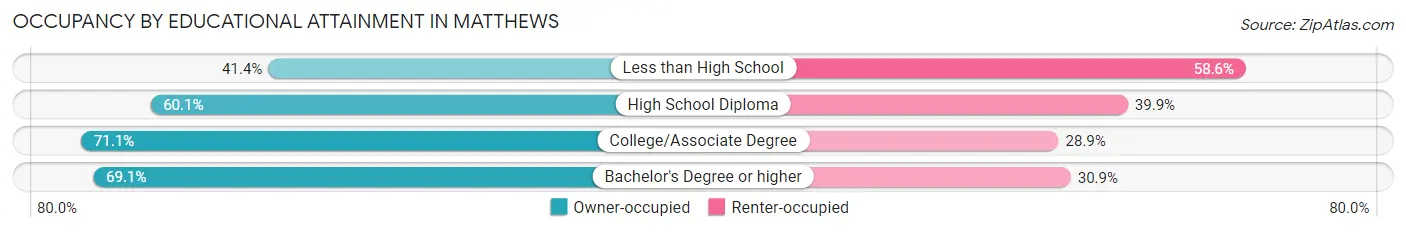
| Household Size | Owner-occupied | Renter-occupied |
| Less than High School | 235 (41.4%) | 333 (58.6%) |
| High School Diploma | 838 (60.1%) | 557 (39.9%) |
| College/Associate Degree | 1,947 (71.1%) | 793 (28.9%) |
| Bachelor's Degree or higher | 4,395 (69.1%) | 1,963 (30.9%) |
Occupancy by Age of Householder in Matthews
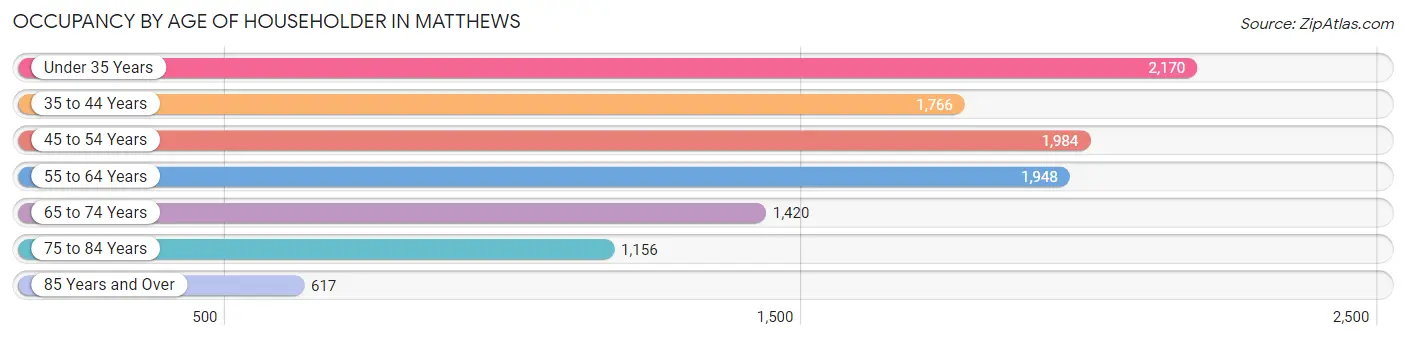
| Age Bracket | # Households | % Households |
| Under 35 Years | 2,170 | 19.6% |
| 35 to 44 Years | 1,766 | 16.0% |
| 45 to 54 Years | 1,984 | 17.9% |
| 55 to 64 Years | 1,948 | 17.6% |
| 65 to 74 Years | 1,420 | 12.8% |
| 75 to 84 Years | 1,156 | 10.4% |
| 85 Years and Over | 617 | 5.6% |
| Total | 11,061 | 100.0% |
Housing Finances in Matthews
Median Income by Occupancy in Matthews
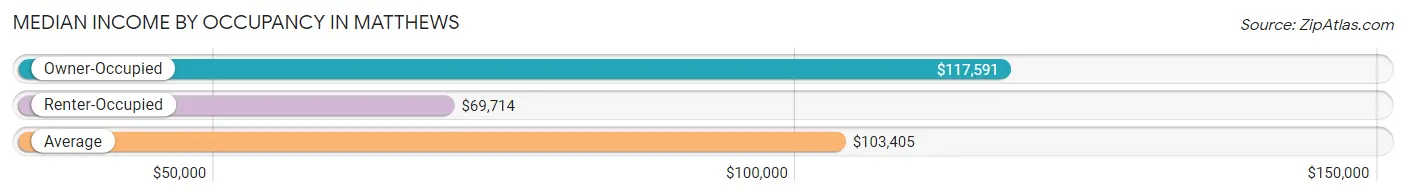
| Occupancy Type | # Households | Median Income |
| Owner-Occupied | 7,415 (67.0%) | $117,591 |
| Renter-Occupied | 3,646 (33.0%) | $69,714 |
| Average | 11,061 (100.0%) | $103,405 |
Occupancy by Householder Income Bracket in Matthews
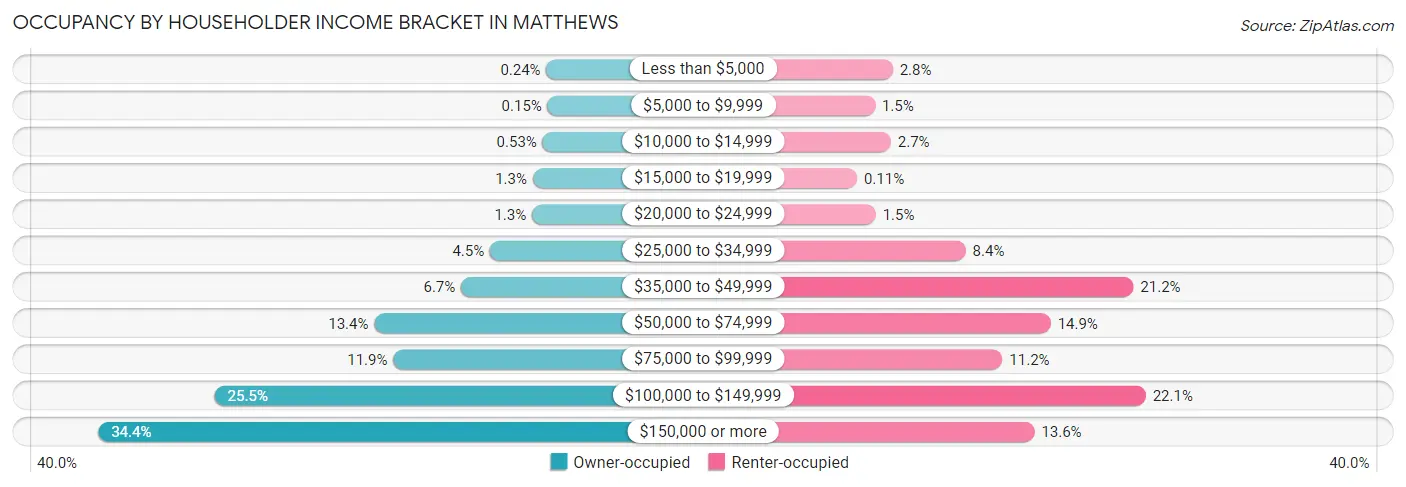
| Income Bracket | Owner-occupied | Renter-occupied |
| Less than $5,000 | 18 (0.2%) | 103 (2.8%) |
| $5,000 to $9,999 | 11 (0.2%) | 54 (1.5%) |
| $10,000 to $14,999 | 39 (0.5%) | 98 (2.7%) |
| $15,000 to $19,999 | 95 (1.3%) | 4 (0.1%) |
| $20,000 to $24,999 | 99 (1.3%) | 56 (1.5%) |
| $25,000 to $34,999 | 337 (4.5%) | 306 (8.4%) |
| $35,000 to $49,999 | 500 (6.7%) | 772 (21.2%) |
| $50,000 to $74,999 | 991 (13.4%) | 542 (14.9%) |
| $75,000 to $99,999 | 883 (11.9%) | 408 (11.2%) |
| $100,000 to $149,999 | 1,892 (25.5%) | 806 (22.1%) |
| $150,000 or more | 2,550 (34.4%) | 497 (13.6%) |
| Total | 7,415 (100.0%) | 3,646 (100.0%) |
Monthly Housing Cost Tiers in Matthews
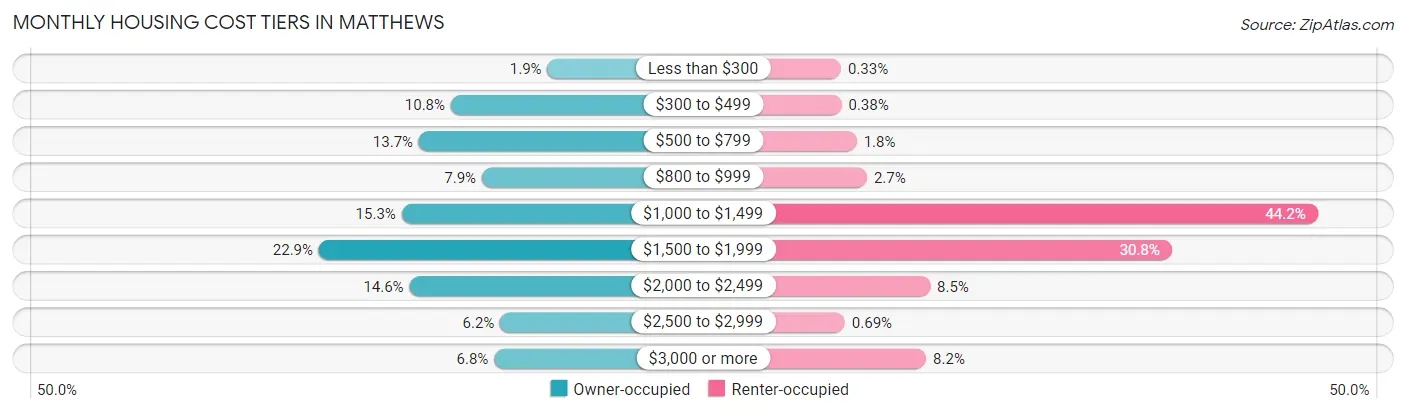
| Monthly Cost | Owner-occupied | Renter-occupied |
| Less than $300 | 139 (1.9%) | 12 (0.3%) |
| $300 to $499 | 798 (10.8%) | 14 (0.4%) |
| $500 to $799 | 1,016 (13.7%) | 65 (1.8%) |
| $800 to $999 | 586 (7.9%) | 99 (2.7%) |
| $1,000 to $1,499 | 1,134 (15.3%) | 1,611 (44.2%) |
| $1,500 to $1,999 | 1,699 (22.9%) | 1,122 (30.8%) |
| $2,000 to $2,499 | 1,080 (14.6%) | 311 (8.5%) |
| $2,500 to $2,999 | 461 (6.2%) | 25 (0.7%) |
| $3,000 or more | 502 (6.8%) | 298 (8.2%) |
| Total | 7,415 (100.0%) | 3,646 (100.0%) |
Physical Housing Characteristics in Matthews
Housing Structures in Matthews
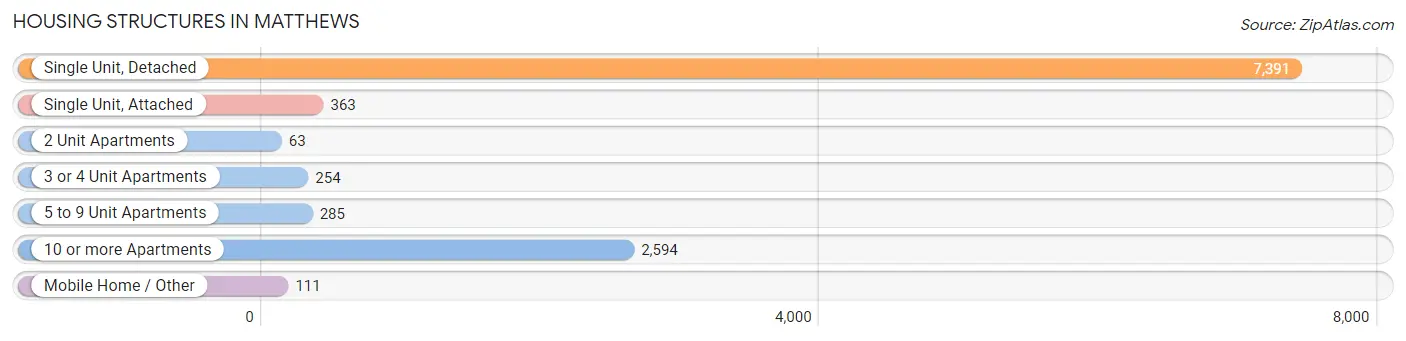
| Structure Type | # Housing Units | % Housing Units |
| Single Unit, Detached | 7,391 | 66.8% |
| Single Unit, Attached | 363 | 3.3% |
| 2 Unit Apartments | 63 | 0.6% |
| 3 or 4 Unit Apartments | 254 | 2.3% |
| 5 to 9 Unit Apartments | 285 | 2.6% |
| 10 or more Apartments | 2,594 | 23.4% |
| Mobile Home / Other | 111 | 1.0% |
| Total | 11,061 | 100.0% |
Housing Structures by Occupancy in Matthews
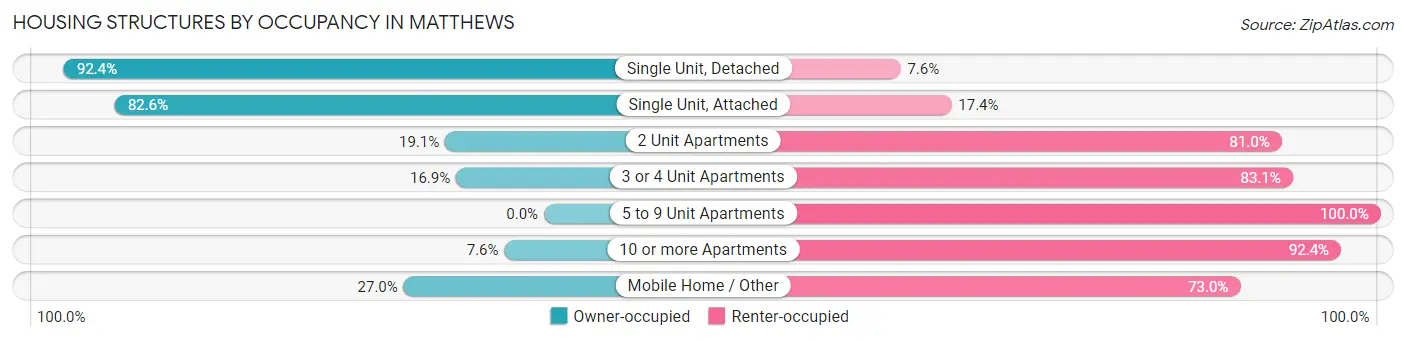
| Structure Type | Owner-occupied | Renter-occupied |
| Single Unit, Detached | 6,832 (92.4%) | 559 (7.6%) |
| Single Unit, Attached | 300 (82.6%) | 63 (17.4%) |
| 2 Unit Apartments | 12 (19.1%) | 51 (80.9%) |
| 3 or 4 Unit Apartments | 43 (16.9%) | 211 (83.1%) |
| 5 to 9 Unit Apartments | 0 (0.0%) | 285 (100.0%) |
| 10 or more Apartments | 198 (7.6%) | 2,396 (92.4%) |
| Mobile Home / Other | 30 (27.0%) | 81 (73.0%) |
| Total | 7,415 (67.0%) | 3,646 (33.0%) |
Housing Structures by Number of Rooms in Matthews
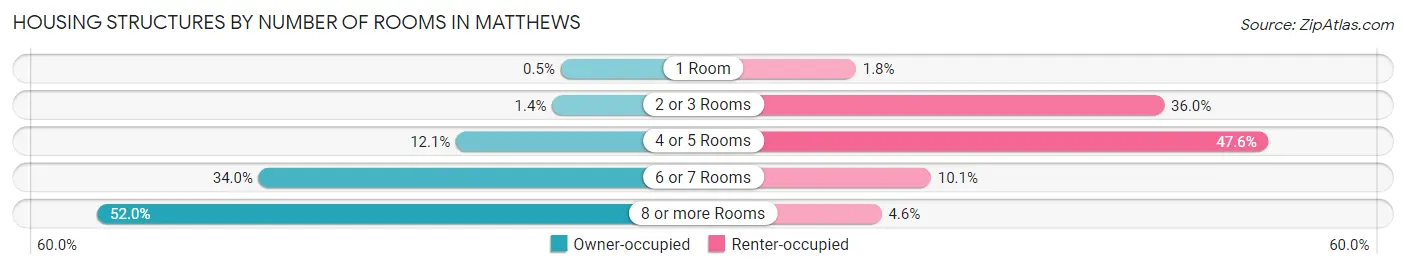
| Number of Rooms | Owner-occupied | Renter-occupied |
| 1 Room | 37 (0.5%) | 64 (1.8%) |
| 2 or 3 Rooms | 107 (1.4%) | 1,312 (36.0%) |
| 4 or 5 Rooms | 897 (12.1%) | 1,734 (47.6%) |
| 6 or 7 Rooms | 2,522 (34.0%) | 368 (10.1%) |
| 8 or more Rooms | 3,852 (51.9%) | 168 (4.6%) |
| Total | 7,415 (100.0%) | 3,646 (100.0%) |
Housing Structure by Heating Type in Matthews
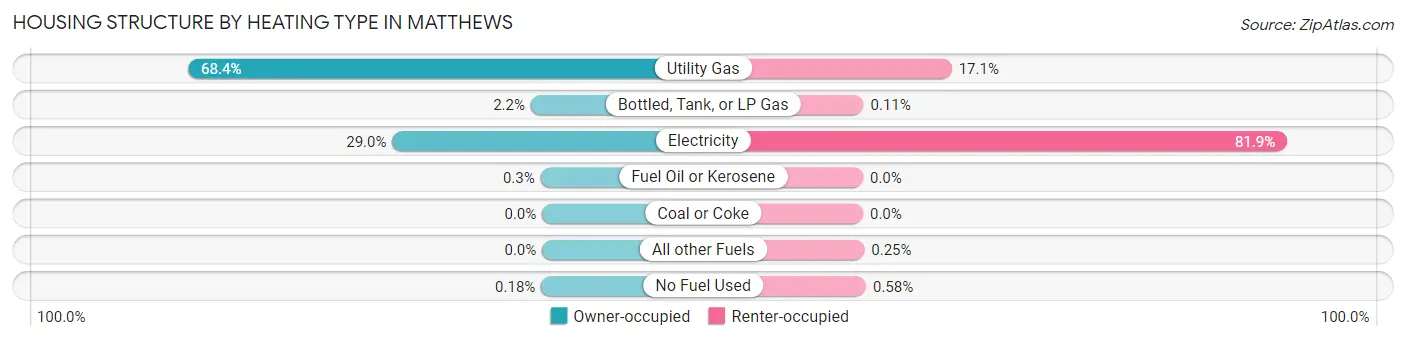
| Heating Type | Owner-occupied | Renter-occupied |
| Utility Gas | 5,071 (68.4%) | 625 (17.1%) |
| Bottled, Tank, or LP Gas | 162 (2.2%) | 4 (0.1%) |
| Electricity | 2,147 (28.9%) | 2,987 (81.9%) |
| Fuel Oil or Kerosene | 22 (0.3%) | 0 (0.0%) |
| Coal or Coke | 0 (0.0%) | 0 (0.0%) |
| All other Fuels | 0 (0.0%) | 9 (0.3%) |
| No Fuel Used | 13 (0.2%) | 21 (0.6%) |
| Total | 7,415 (100.0%) | 3,646 (100.0%) |
Household Vehicle Usage in Matthews
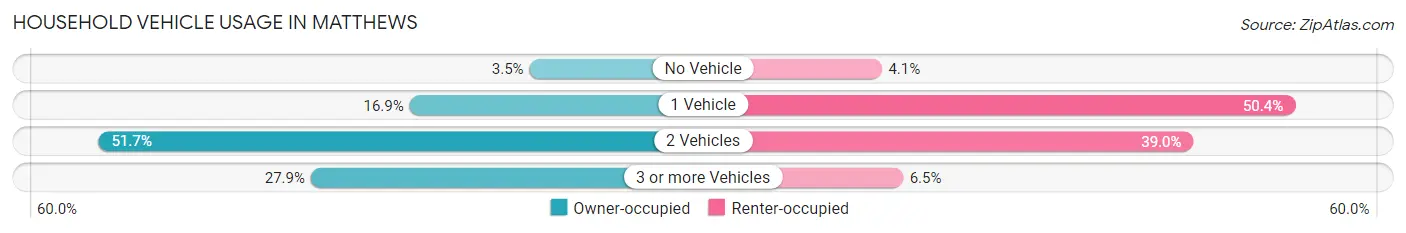
| Vehicles per Household | Owner-occupied | Renter-occupied |
| No Vehicle | 256 (3.5%) | 149 (4.1%) |
| 1 Vehicle | 1,252 (16.9%) | 1,838 (50.4%) |
| 2 Vehicles | 3,835 (51.7%) | 1,423 (39.0%) |
| 3 or more Vehicles | 2,072 (27.9%) | 236 (6.5%) |
| Total | 7,415 (100.0%) | 3,646 (100.0%) |
Real Estate & Mortgages in Matthews
Real Estate and Mortgage Overview in Matthews
| Characteristic | Without Mortgage | With Mortgage |
| Housing Units | 2,222 | 5,193 |
| Median Property Value | $347,100 | $366,300 |
| Median Household Income | $85,521 | $2,078 |
| Monthly Housing Costs | $549 | $492 |
| Real Estate Taxes | $2,724 | $38 |
Property Value by Mortgage Status in Matthews
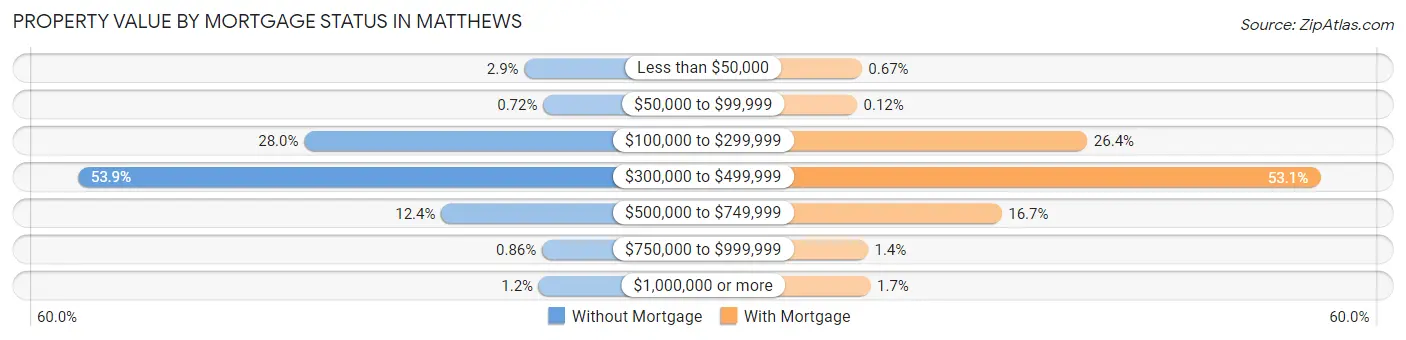
| Property Value | Without Mortgage | With Mortgage |
| Less than $50,000 | 64 (2.9%) | 35 (0.7%) |
| $50,000 to $99,999 | 16 (0.7%) | 6 (0.1%) |
| $100,000 to $299,999 | 623 (28.0%) | 1,373 (26.4%) |
| $300,000 to $499,999 | 1,198 (53.9%) | 2,757 (53.1%) |
| $500,000 to $749,999 | 275 (12.4%) | 865 (16.7%) |
| $750,000 to $999,999 | 19 (0.9%) | 71 (1.4%) |
| $1,000,000 or more | 27 (1.2%) | 86 (1.7%) |
| Total | 2,222 (100.0%) | 5,193 (100.0%) |
Household Income by Mortgage Status in Matthews
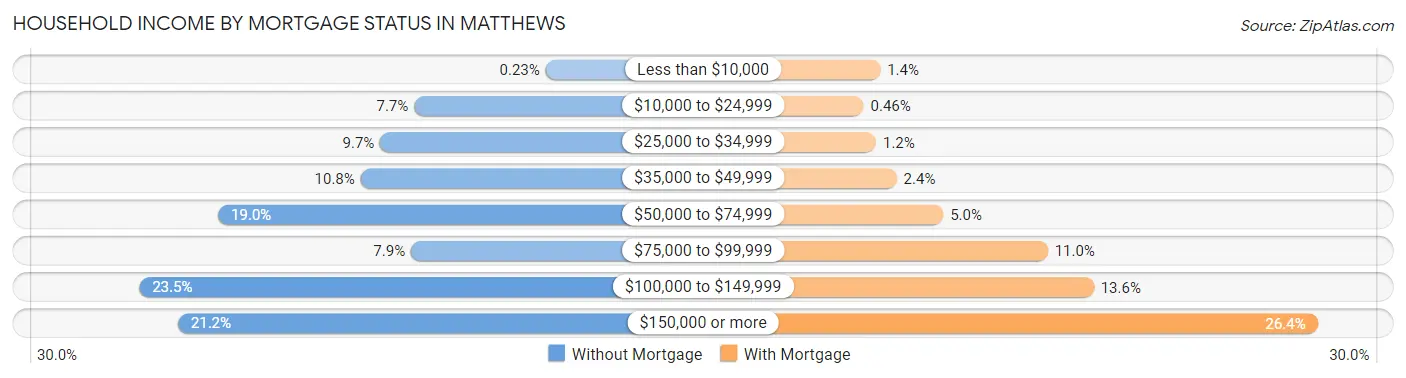
| Household Income | Without Mortgage | With Mortgage |
| Less than $10,000 | 5 (0.2%) | 73 (1.4%) |
| $10,000 to $24,999 | 172 (7.7%) | 24 (0.5%) |
| $25,000 to $34,999 | 215 (9.7%) | 61 (1.2%) |
| $35,000 to $49,999 | 240 (10.8%) | 122 (2.4%) |
| $50,000 to $74,999 | 421 (19.0%) | 260 (5.0%) |
| $75,000 to $99,999 | 176 (7.9%) | 570 (11.0%) |
| $100,000 to $149,999 | 521 (23.4%) | 707 (13.6%) |
| $150,000 or more | 472 (21.2%) | 1,371 (26.4%) |
| Total | 2,222 (100.0%) | 5,193 (100.0%) |
Property Value to Household Income Ratio in Matthews
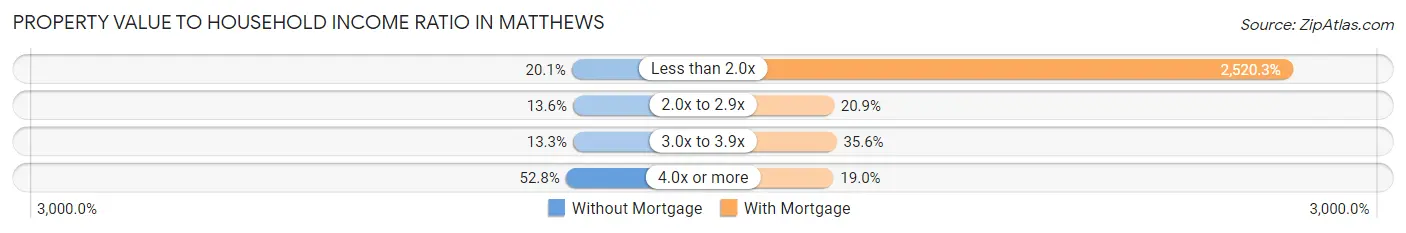
| Value-to-Income Ratio | Without Mortgage | With Mortgage |
| Less than 2.0x | 447 (20.1%) | 130,880 (2,520.3%) |
| 2.0x to 2.9x | 301 (13.6%) | 1,085 (20.9%) |
| 3.0x to 3.9x | 295 (13.3%) | 1,850 (35.6%) |
| 4.0x or more | 1,174 (52.8%) | 986 (19.0%) |
| Total | 2,222 (100.0%) | 5,193 (100.0%) |
Real Estate Taxes by Mortgage Status in Matthews
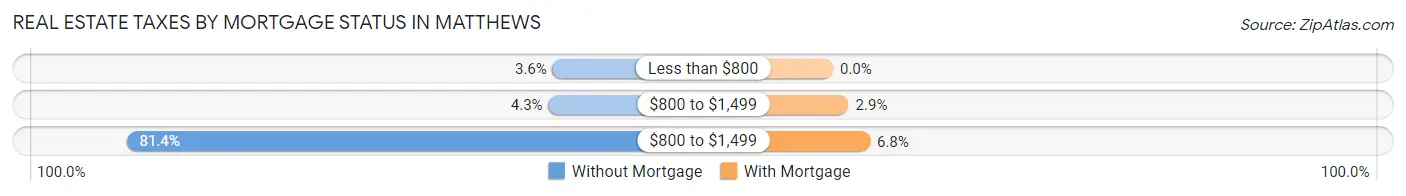
| Property Taxes | Without Mortgage | With Mortgage |
| Less than $800 | 79 (3.6%) | 0 (0.0%) |
| $800 to $1,499 | 96 (4.3%) | 148 (2.9%) |
| $800 to $1,499 | 1,808 (81.4%) | 351 (6.8%) |
| Total | 2,222 (100.0%) | 5,193 (100.0%) |
Health & Disability in Matthews
Health Insurance Coverage by Age in Matthews
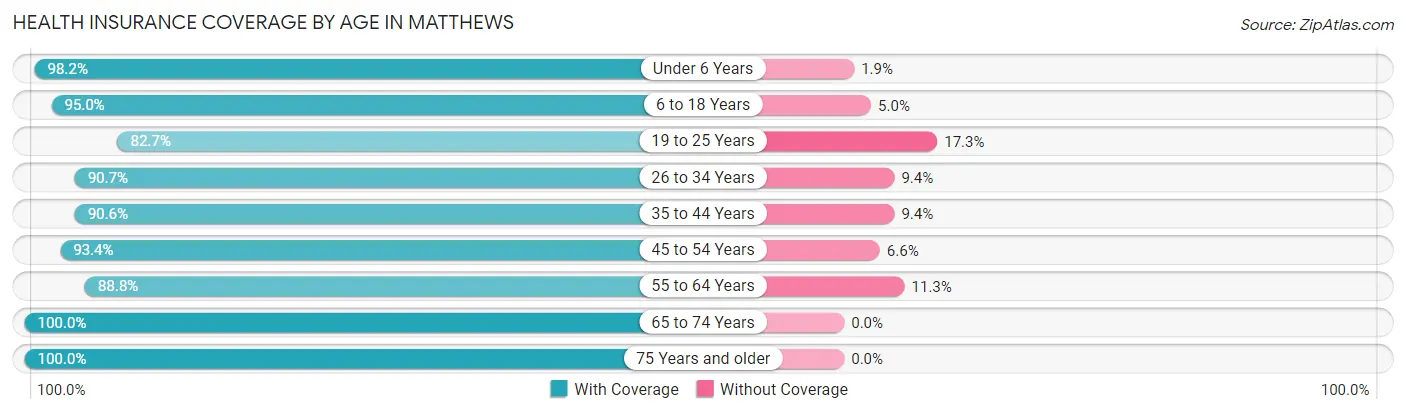
| Age Bracket | With Coverage | Without Coverage |
| Under 6 Years | 2,230 (98.2%) | 42 (1.8%) |
| 6 to 18 Years | 3,852 (95.0%) | 203 (5.0%) |
| 19 to 25 Years | 2,107 (82.7%) | 442 (17.3%) |
| 26 to 34 Years | 3,790 (90.6%) | 391 (9.3%) |
| 35 to 44 Years | 3,090 (90.6%) | 319 (9.4%) |
| 45 to 54 Years | 3,766 (93.4%) | 268 (6.6%) |
| 55 to 64 Years | 3,099 (88.7%) | 393 (11.3%) |
| 65 to 74 Years | 2,582 (100.0%) | 0 (0.0%) |
| 75 Years and older | 2,755 (100.0%) | 0 (0.0%) |
| Total | 27,271 (93.0%) | 2,058 (7.0%) |
Health Insurance Coverage by Citizenship Status in Matthews
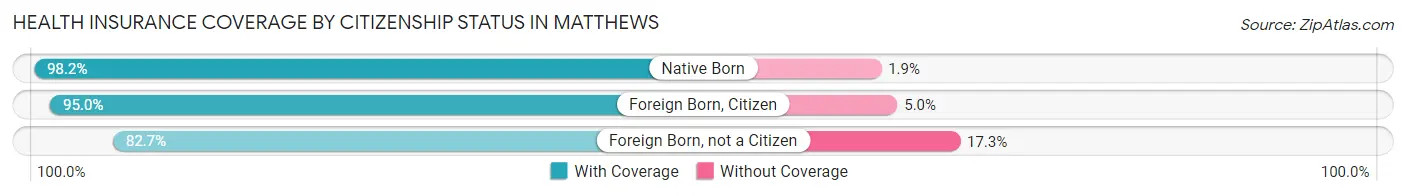
| Citizenship Status | With Coverage | Without Coverage |
| Native Born | 2,230 (98.2%) | 42 (1.8%) |
| Foreign Born, Citizen | 3,852 (95.0%) | 203 (5.0%) |
| Foreign Born, not a Citizen | 2,107 (82.7%) | 442 (17.3%) |
Health Insurance Coverage by Household Income in Matthews
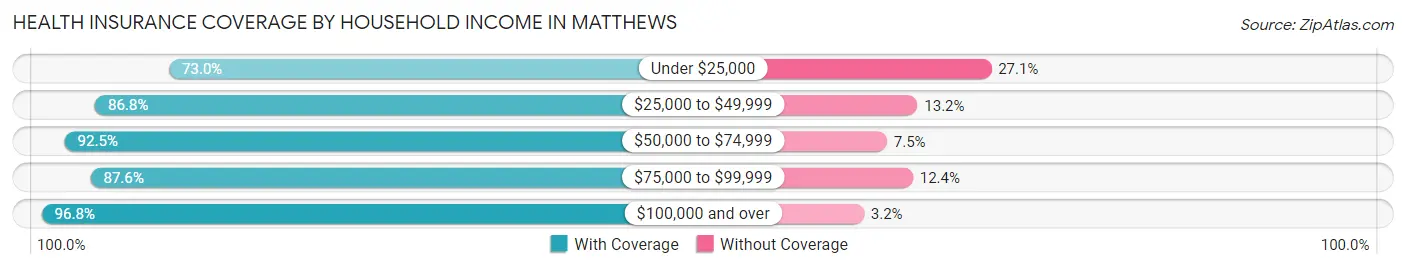
| Household Income | With Coverage | Without Coverage |
| Under $25,000 | 793 (73.0%) | 294 (27.1%) |
| $25,000 to $49,999 | 3,176 (86.8%) | 484 (13.2%) |
| $50,000 to $74,999 | 2,932 (92.5%) | 238 (7.5%) |
| $75,000 to $99,999 | 3,303 (87.6%) | 466 (12.4%) |
| $100,000 and over | 17,054 (96.8%) | 563 (3.2%) |
Public vs Private Health Insurance Coverage by Age in Matthews
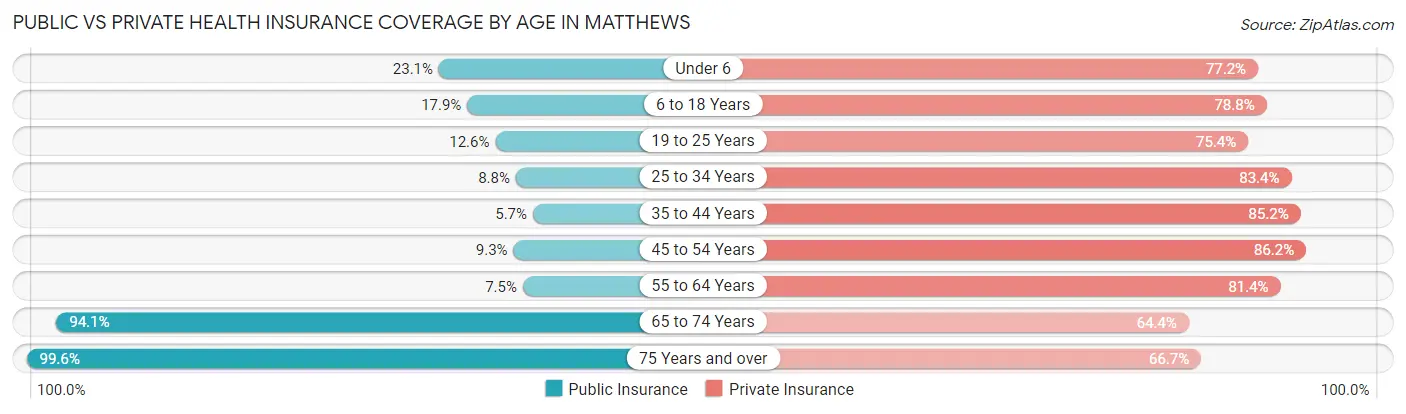
| Age Bracket | Public Insurance | Private Insurance |
| Under 6 | 525 (23.1%) | 1,755 (77.2%) |
| 6 to 18 Years | 724 (17.8%) | 3,196 (78.8%) |
| 19 to 25 Years | 322 (12.6%) | 1,922 (75.4%) |
| 25 to 34 Years | 369 (8.8%) | 3,488 (83.4%) |
| 35 to 44 Years | 193 (5.7%) | 2,903 (85.2%) |
| 45 to 54 Years | 374 (9.3%) | 3,476 (86.2%) |
| 55 to 64 Years | 263 (7.5%) | 2,843 (81.4%) |
| 65 to 74 Years | 2,430 (94.1%) | 1,663 (64.4%) |
| 75 Years and over | 2,745 (99.6%) | 1,837 (66.7%) |
| Total | 7,945 (27.1%) | 23,083 (78.7%) |
Disability Status by Sex by Age in Matthews
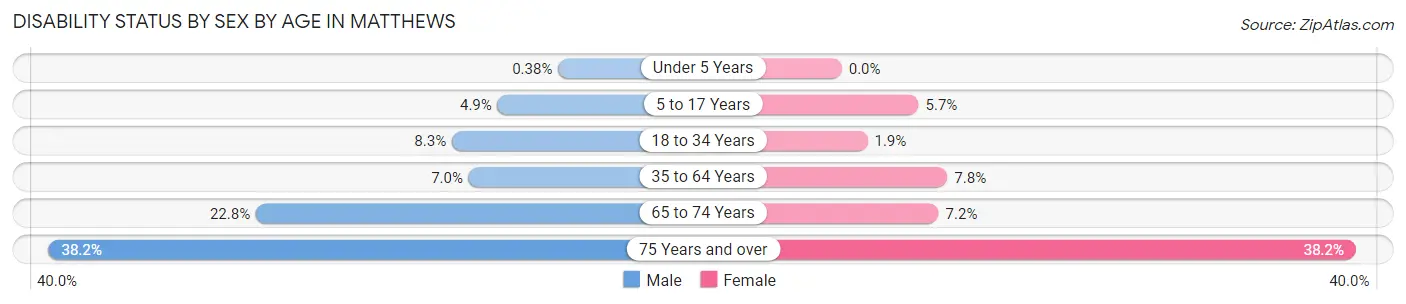
| Age Bracket | Male | Female |
| Under 5 Years | 4 (0.4%) | 0 (0.0%) |
| 5 to 17 Years | 102 (4.9%) | 117 (5.7%) |
| 18 to 34 Years | 299 (8.3%) | 65 (1.9%) |
| 35 to 64 Years | 396 (7.0%) | 415 (7.8%) |
| 65 to 74 Years | 275 (22.8%) | 99 (7.2%) |
| 75 Years and over | 404 (38.2%) | 648 (38.2%) |
Disability Class by Sex by Age in Matthews
Disability Class: Hearing Difficulty
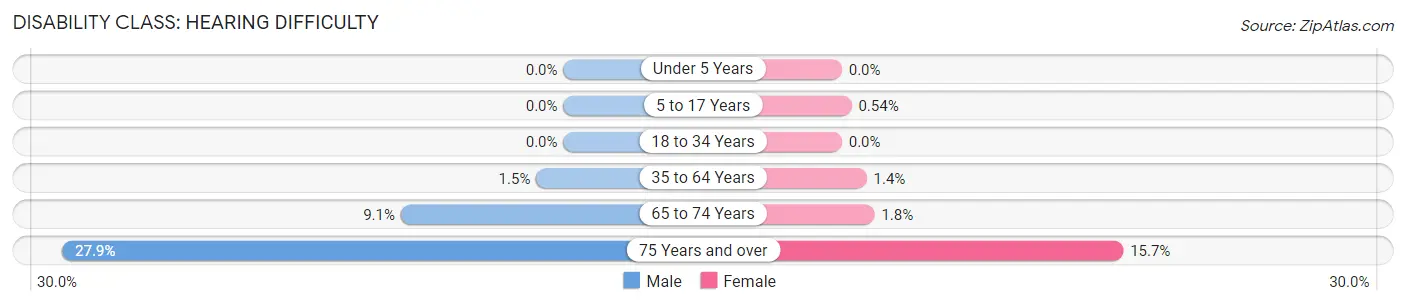
| Age Bracket | Male | Female |
| Under 5 Years | 0 (0.0%) | 0 (0.0%) |
| 5 to 17 Years | 0 (0.0%) | 11 (0.5%) |
| 18 to 34 Years | 0 (0.0%) | 0 (0.0%) |
| 35 to 64 Years | 85 (1.5%) | 73 (1.4%) |
| 65 to 74 Years | 109 (9.0%) | 25 (1.8%) |
| 75 Years and over | 295 (27.9%) | 266 (15.7%) |
Disability Class: Vision Difficulty
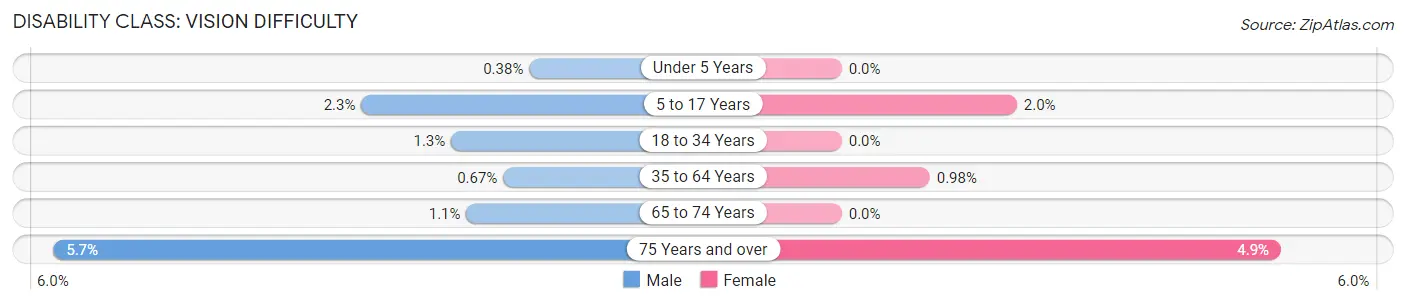
| Age Bracket | Male | Female |
| Under 5 Years | 4 (0.4%) | 0 (0.0%) |
| 5 to 17 Years | 47 (2.2%) | 40 (1.9%) |
| 18 to 34 Years | 45 (1.3%) | 0 (0.0%) |
| 35 to 64 Years | 38 (0.7%) | 52 (1.0%) |
| 65 to 74 Years | 13 (1.1%) | 0 (0.0%) |
| 75 Years and over | 60 (5.7%) | 83 (4.9%) |
Disability Class: Cognitive Difficulty
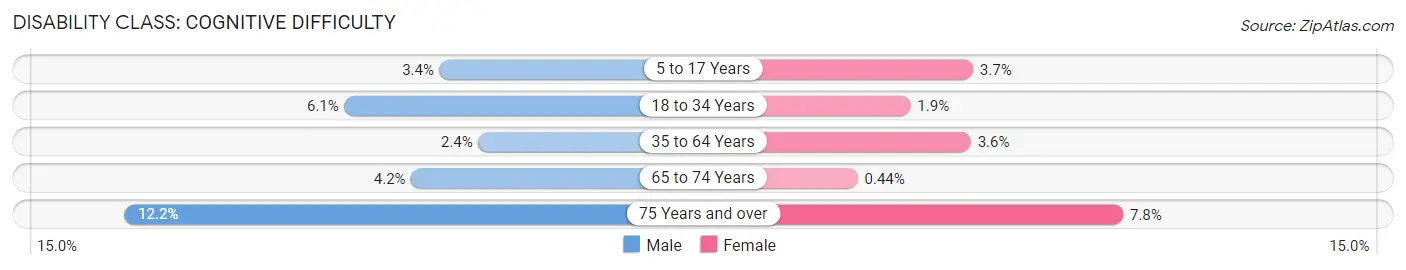
| Age Bracket | Male | Female |
| 5 to 17 Years | 72 (3.4%) | 75 (3.6%) |
| 18 to 34 Years | 220 (6.1%) | 65 (1.9%) |
| 35 to 64 Years | 133 (2.4%) | 190 (3.6%) |
| 65 to 74 Years | 51 (4.2%) | 6 (0.4%) |
| 75 Years and over | 129 (12.2%) | 133 (7.8%) |
Disability Class: Ambulatory Difficulty
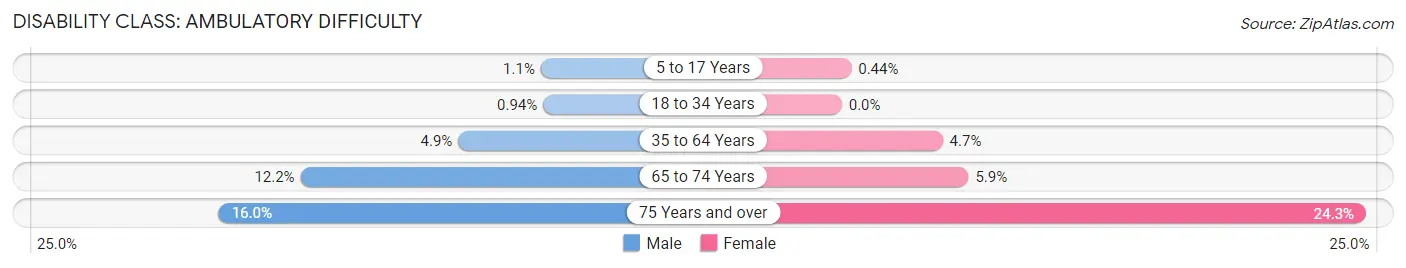
| Age Bracket | Male | Female |
| 5 to 17 Years | 22 (1.1%) | 9 (0.4%) |
| 18 to 34 Years | 34 (0.9%) | 0 (0.0%) |
| 35 to 64 Years | 275 (4.9%) | 248 (4.7%) |
| 65 to 74 Years | 147 (12.2%) | 81 (5.9%) |
| 75 Years and over | 169 (16.0%) | 413 (24.3%) |
Disability Class: Self-Care Difficulty
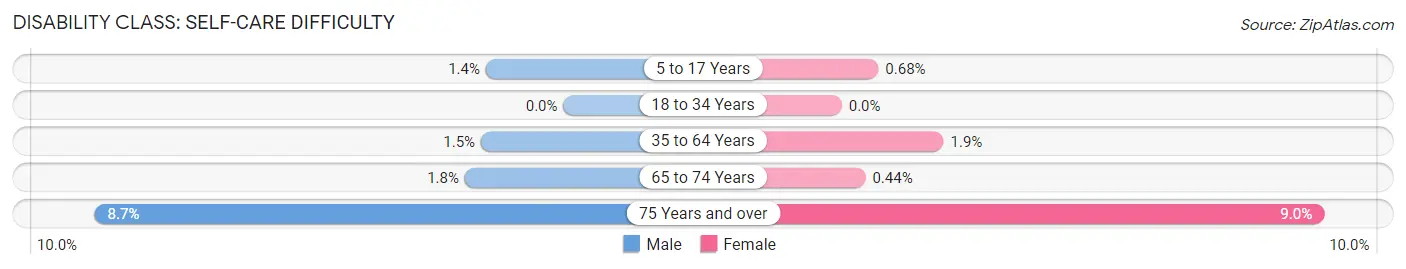
| Age Bracket | Male | Female |
| 5 to 17 Years | 30 (1.4%) | 14 (0.7%) |
| 18 to 34 Years | 0 (0.0%) | 0 (0.0%) |
| 35 to 64 Years | 86 (1.5%) | 100 (1.9%) |
| 65 to 74 Years | 22 (1.8%) | 6 (0.4%) |
| 75 Years and over | 92 (8.7%) | 152 (8.9%) |
Technology Access in Matthews
Computing Device Access in Matthews
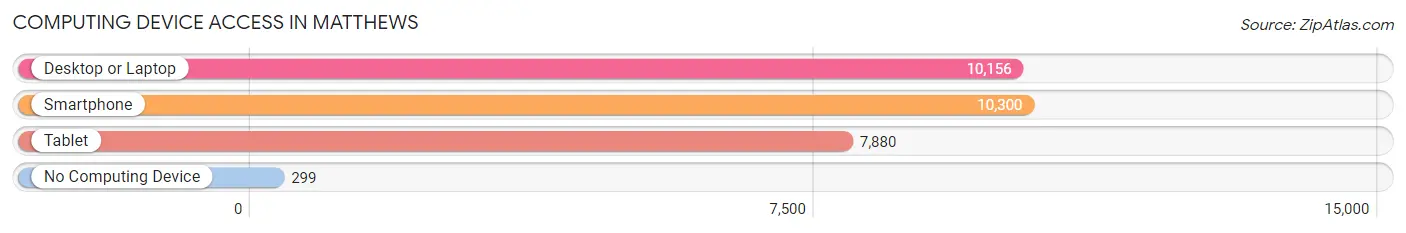
| Device Type | # Households | % Households |
| Desktop or Laptop | 10,156 | 91.8% |
| Smartphone | 10,300 | 93.1% |
| Tablet | 7,880 | 71.2% |
| No Computing Device | 299 | 2.7% |
| Total | 11,061 | 100.0% |
Internet Access in Matthews
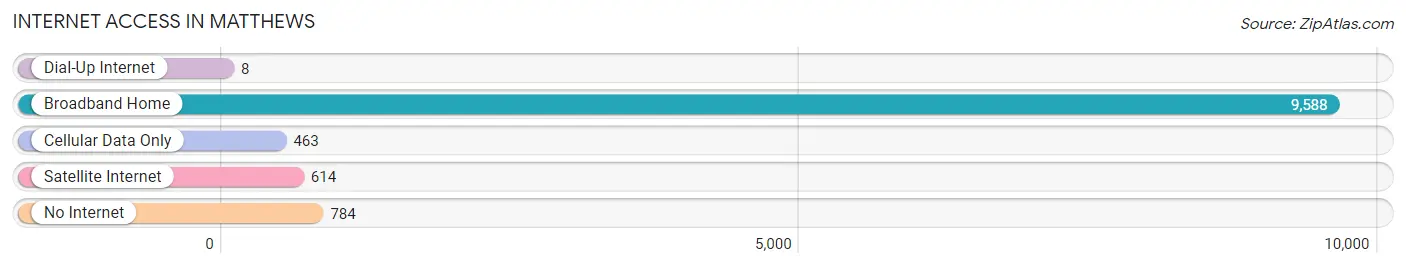
| Internet Type | # Households | % Households |
| Dial-Up Internet | 8 | 0.1% |
| Broadband Home | 9,588 | 86.7% |
| Cellular Data Only | 463 | 4.2% |
| Satellite Internet | 614 | 5.6% |
| No Internet | 784 | 7.1% |
| Total | 11,061 | 100.0% |
Matthews Summary
Matthews is a town located in Mecklenburg County, North Carolina. It is a suburb of Charlotte and is located approximately 10 miles southeast of the city. The population of Matthews was estimated to be 27,198 in 2019.
History
Matthews was founded in 1879 by a group of settlers from Union County, North Carolina. The town was named after Edward Watson Matthews, a local landowner and railroad official. The town was incorporated in 1879 and was originally known as Stumptown. The town was renamed Matthews in 1879 in honor of Edward Watson Matthews.
The town grew rapidly in the late 19th and early 20th centuries due to its proximity to Charlotte and the railroad. The town was home to several cotton mills and other industries. The town was also home to a large African American population, many of whom worked in the mills.
In the late 20th century, Matthews began to experience rapid growth due to its proximity to Charlotte and the growth of the Charlotte metropolitan area. The town has experienced significant population growth since the 1990s and is now one of the fastest growing towns in North Carolina.
Geography
Matthews is located in Mecklenburg County, North Carolina. It is located approximately 10 miles southeast of Charlotte. The town is situated on the banks of the Rocky River and is surrounded by rolling hills and forests. The town has a total area of 8.3 square miles, all of which is land.
The town has a humid subtropical climate, with hot, humid summers and mild winters. The average annual temperature is around 61 degrees Fahrenheit. The average annual precipitation is around 44 inches.
Economy
Matthews is a major economic center in the Charlotte metropolitan area. The town is home to several large employers, including Novant Health, Family Dollar, and Harris Teeter. The town is also home to several small businesses, including restaurants, retail stores, and professional services.
The town is also home to several large shopping centers, including Matthews Station and Matthews Town Center. The town is also home to several parks and recreational facilities, including Matthews Community Park and Matthews Nature Preserve.
Demographics
As of the 2019 census, the population of Matthews was estimated to be 27,198. The population is predominantly white (77.3%), with African Americans making up 15.2% of the population. Other racial groups include Asians (3.7%), Hispanics (2.3%), and Native Americans (0.3%).
The median household income in Matthews is $68,845, and the median home value is $269,400. The town has a poverty rate of 8.2%. The town is served by the Charlotte-Mecklenburg School District.
Conclusion
Matthews is a town located in Mecklenburg County, North Carolina. It is a suburb of Charlotte and is located approximately 10 miles southeast of the city. The population of Matthews was estimated to be 27,198 in 2019. The town has experienced significant population growth since the 1990s and is now one of the fastest growing towns in North Carolina. Matthews is a major economic center in the Charlotte metropolitan area, with several large employers and shopping centers. The population is predominantly white, with African Americans making up 15.2% of the population. The median household income in Matthews is $68,845, and the median home value is $269,400. The town is served by the Charlotte-Mecklenburg School District.
Common Questions
What is Per Capita Income in Matthews?
Per Capita income in Matthews is $47,972.
What is the Median Family Income in Matthews?
Median Family Income in Matthews is $125,116.
What is the Median Household income in Matthews?
Median Household Income in Matthews is $103,405.
What is Income or Wage Gap in Matthews?
Income or Wage Gap in Matthews is 34.4%.
Women in Matthews earn 65.6 cents for every dollar earned by a man.
What is Inequality or Gini Index in Matthews?
Inequality or Gini Index in Matthews is 0.40.
What is the Total Population of Matthews?
Total Population of Matthews is 29,613.
What is the Total Male Population of Matthews?
Total Male Population of Matthews is 14,750.
What is the Total Female Population of Matthews?
Total Female Population of Matthews is 14,863.
What is the Ratio of Males per 100 Females in Matthews?
There are 99.24 Males per 100 Females in Matthews.
What is the Ratio of Females per 100 Males in Matthews?
There are 100.77 Females per 100 Males in Matthews.
What is the Median Population Age in Matthews?
Median Population Age in Matthews is 39.5 Years.
What is the Average Family Size in Matthews
Average Family Size in Matthews is 3.1 People.
What is the Average Household Size in Matthews
Average Household Size in Matthews is 2.6 People.
How Large is the Labor Force in Matthews?
There are 16,242 People in the Labor Forcein in Matthews.
What is the Percentage of People in the Labor Force in Matthews?
67.1% of People are in the Labor Force in Matthews.
What is the Unemployment Rate in Matthews?
Unemployment Rate in Matthews is 3.0%.