Riverview Estates, MO Map & Demographics
Riverview Estates Map
Riverview Estates Overview
$45,247
PER CAPITA INCOME
$103,750
AVG FAMILY INCOME
$103,438
AVG HOUSEHOLD INCOME
67.5%
WAGE / INCOME GAP [ % ]
32.5¢/ $1
WAGE / INCOME GAP [ $ ]
0.32
INEQUALITY / GINI INDEX
89
TOTAL POPULATION
42
MALE POPULATION
47
FEMALE POPULATION
89.36
MALES / 100 FEMALES
111.90
FEMALES / 100 MALES
46.8
MEDIAN AGE
2.9
AVG FAMILY SIZE
2.9
AVG HOUSEHOLD SIZE
57
LABOR FORCE [ PEOPLE ]
69.5%
PERCENT IN LABOR FORCE
1.8%
UNEMPLOYMENT RATE
Income in Riverview Estates
Income Overview in Riverview Estates
Per Capita Income in Riverview Estates is $45,247, while median incomes of families and households are $103,750 and $103,438 respectively.
| Characteristic | Number | Measure |
| Per Capita Income | 89 | $45,247 |
| Median Family Income | 28 | $103,750 |
| Mean Family Income | 28 | $115,832 |
| Median Household Income | 31 | $103,438 |
| Mean Household Income | 31 | $126,087 |
| Income Deficit | 28 | $0 |
| Wage / Income Gap (%) | 89 | 67.50% |
| Wage / Income Gap ($) | 89 | 32.50¢ per $1 |
| Gini / Inequality Index | 89 | 0.32 |
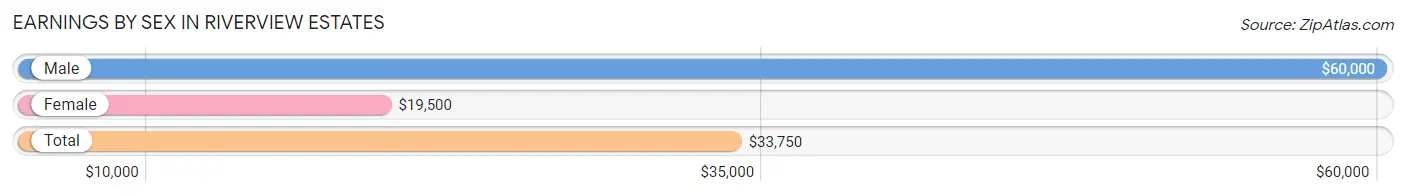
Earnings by Sex in Riverview Estates
Average Earnings in Riverview Estates are $33,750, $60,000 for men and $19,500 for women, a difference of 67.5%.
| Sex | Number | Average Earnings |
| Male | 30 (48.4%) | $60,000 |
| Female | 32 (51.6%) | $19,500 |
| Total | 62 (100.0%) | $33,750 |
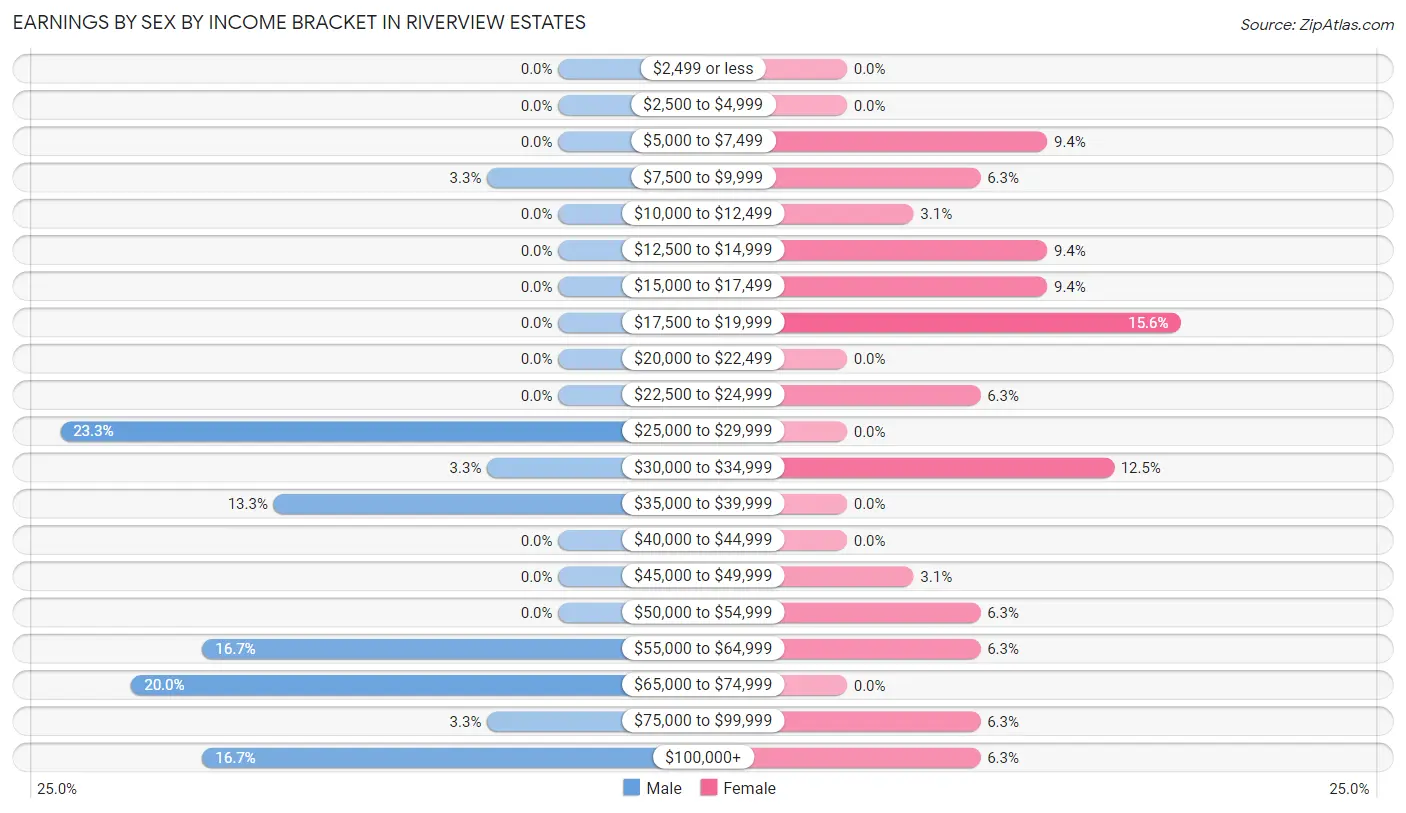
Earnings by Sex by Income Bracket in Riverview Estates
The most common earnings brackets in Riverview Estates are $25,000 to $29,999 for men (7 | 23.3%) and $17,500 to $19,999 for women (5 | 15.6%).
| Income | Male | Female |
| $2,499 or less | 0 (0.0%) | 0 (0.0%) |
| $2,500 to $4,999 | 0 (0.0%) | 0 (0.0%) |
| $5,000 to $7,499 | 0 (0.0%) | 3 (9.4%) |
| $7,500 to $9,999 | 1 (3.3%) | 2 (6.2%) |
| $10,000 to $12,499 | 0 (0.0%) | 1 (3.1%) |
| $12,500 to $14,999 | 0 (0.0%) | 3 (9.4%) |
| $15,000 to $17,499 | 0 (0.0%) | 3 (9.4%) |
| $17,500 to $19,999 | 0 (0.0%) | 5 (15.6%) |
| $20,000 to $22,499 | 0 (0.0%) | 0 (0.0%) |
| $22,500 to $24,999 | 0 (0.0%) | 2 (6.2%) |
| $25,000 to $29,999 | 7 (23.3%) | 0 (0.0%) |
| $30,000 to $34,999 | 1 (3.3%) | 4 (12.5%) |
| $35,000 to $39,999 | 4 (13.3%) | 0 (0.0%) |
| $40,000 to $44,999 | 0 (0.0%) | 0 (0.0%) |
| $45,000 to $49,999 | 0 (0.0%) | 1 (3.1%) |
| $50,000 to $54,999 | 0 (0.0%) | 2 (6.2%) |
| $55,000 to $64,999 | 5 (16.7%) | 2 (6.2%) |
| $65,000 to $74,999 | 6 (20.0%) | 0 (0.0%) |
| $75,000 to $99,999 | 1 (3.3%) | 2 (6.2%) |
| $100,000+ | 5 (16.7%) | 2 (6.2%) |
| Total | 30 (100.0%) | 32 (100.0%) |
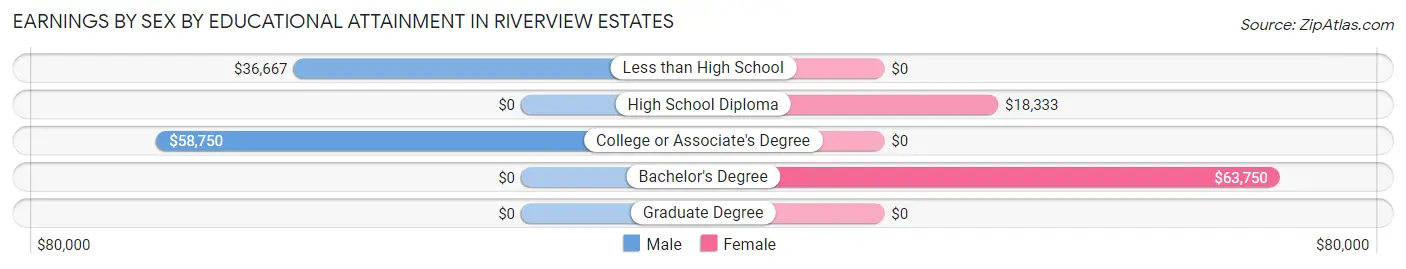
Earnings by Sex by Educational Attainment in Riverview Estates
| Educational Attainment | Male Income | Female Income |
| Less than High School | $36,667 | $0 |
| High School Diploma | - | - |
| College or Associate's Degree | $58,750 | $0 |
| Bachelor's Degree | - | - |
| Graduate Degree | - | - |
| Total | $67,500 | $0 |
Family Income in Riverview Estates
Family Income Brackets in Riverview Estates
According to the Riverview Estates family income data, there are 9 families falling into the $100,000 to $149,999 income range, which is the most common income bracket and makes up 32.1% of all families.
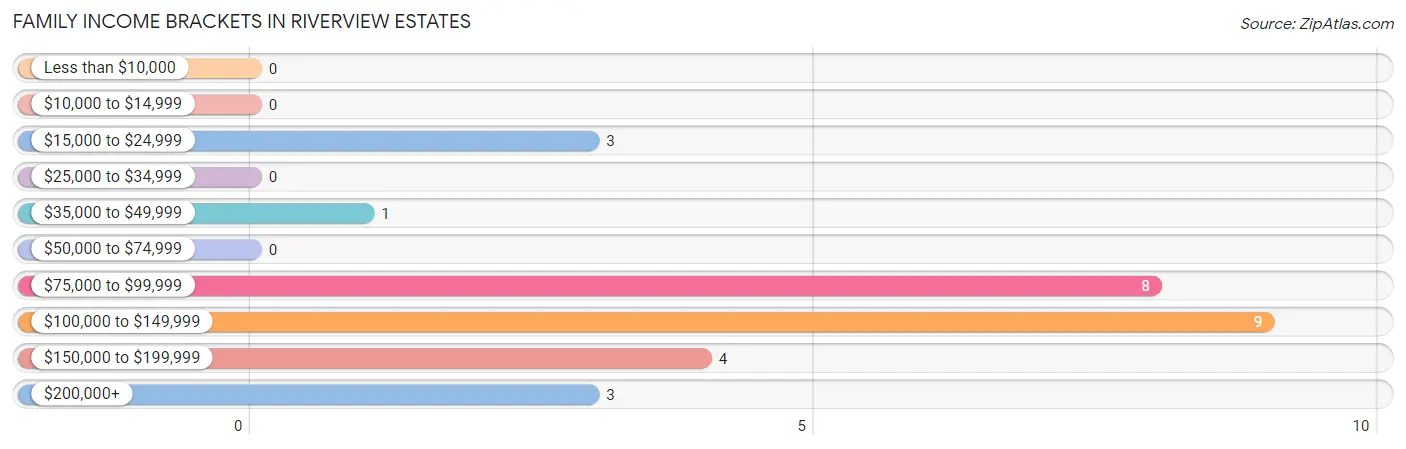
| Income Bracket | # Families | % Families |
| Less than $10,000 | 0 | 0.0% |
| $10,000 to $14,999 | 0 | 0.0% |
| $15,000 to $24,999 | 3 | 10.7% |
| $25,000 to $34,999 | 0 | 0.0% |
| $35,000 to $49,999 | 1 | 3.6% |
| $50,000 to $74,999 | 0 | 0.0% |
| $75,000 to $99,999 | 8 | 28.6% |
| $100,000 to $149,999 | 9 | 32.1% |
| $150,000 to $199,999 | 4 | 14.3% |
| $200,000+ | 3 | 10.7% |
Family Income by Famaliy Size in Riverview Estates
4-person families (4 | 14.3%) account for the highest median family income in Riverview Estates with $141,250 per family, while 2-person families (15 | 53.6%) have the highest median income of $52,032 per family member.
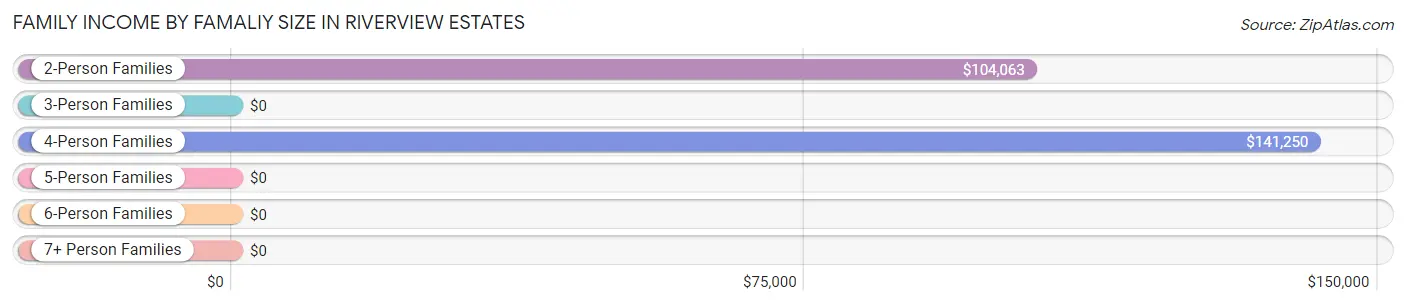
| Income Bracket | # Families | Median Income |
| 2-Person Families | 15 (53.6%) | $104,063 |
| 3-Person Families | 7 (25.0%) | $0 |
| 4-Person Families | 4 (14.3%) | $141,250 |
| 5-Person Families | 2 (7.1%) | $0 |
| 6-Person Families | 0 (0.0%) | $0 |
| 7+ Person Families | 0 (0.0%) | $0 |
| Total | 28 (100.0%) | $103,750 |
Family Income by Number of Earners in Riverview Estates
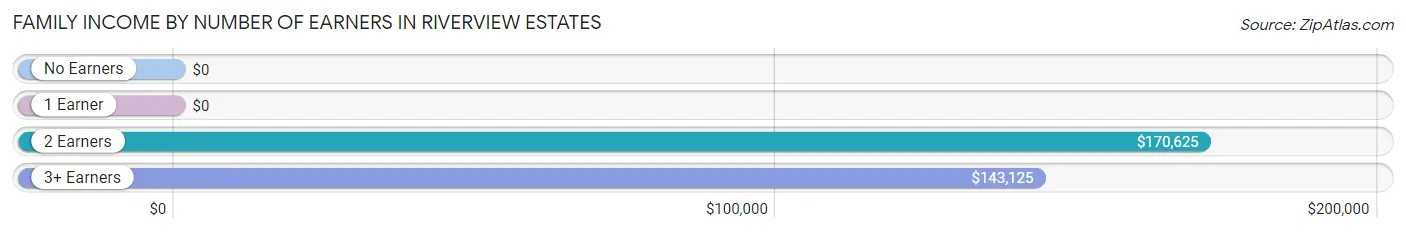
| Number of Earners | # Families | Median Income |
| No Earners | 4 (14.3%) | $0 |
| 1 Earner | 10 (35.7%) | $0 |
| 2 Earners | 7 (25.0%) | $170,625 |
| 3+ Earners | 7 (25.0%) | $143,125 |
| Total | 28 (100.0%) | $103,750 |
Household Income in Riverview Estates
Household Income Brackets in Riverview Estates
With 9 households falling in the category, the $100,000 to $149,999 income range is the most frequent in Riverview Estates, accounting for 29.0% of all households.
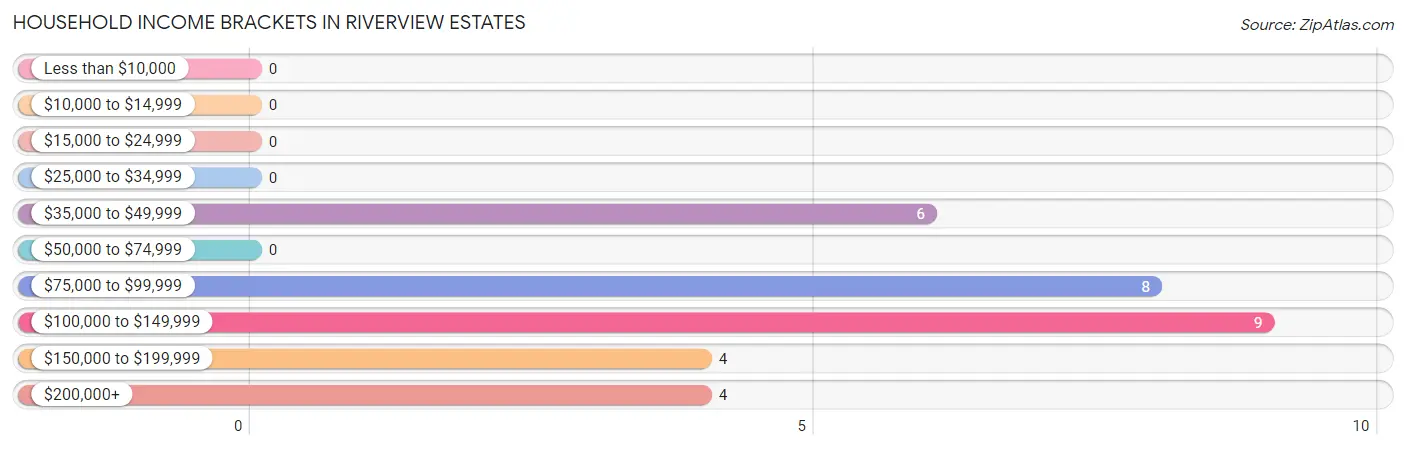
| Income Bracket | # Households | % Households |
| Less than $10,000 | 0 | 0.0% |
| $10,000 to $14,999 | 0 | 0.0% |
| $15,000 to $24,999 | 0 | 0.0% |
| $25,000 to $34,999 | 0 | 0.0% |
| $35,000 to $49,999 | 6 | 19.4% |
| $50,000 to $74,999 | 0 | 0.0% |
| $75,000 to $99,999 | 8 | 25.8% |
| $100,000 to $149,999 | 9 | 29.0% |
| $150,000 to $199,999 | 4 | 12.9% |
| $200,000+ | 4 | 12.9% |
Household Income by Householder Age in Riverview Estates
The median household income in Riverview Estates is $103,438, with the highest median household income of $143,750 found in the 45 to 64 years age bracket for the primary householder. A total of 16 households (51.6%) fall into this category.
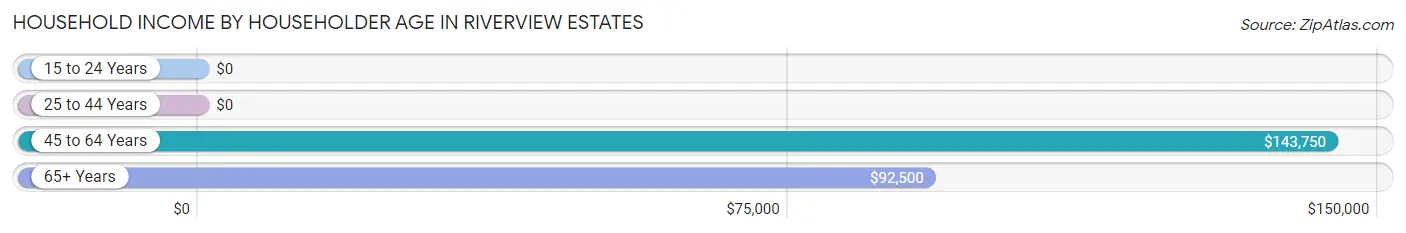
| Income Bracket | # Households | Median Income |
| 15 to 24 Years | 0 (0.0%) | $0 |
| 25 to 44 Years | 3 (9.7%) | $0 |
| 45 to 64 Years | 16 (51.6%) | $143,750 |
| 65+ Years | 12 (38.7%) | $92,500 |
| Total | 31 (100.0%) | $103,438 |
Poverty in Riverview Estates
Income Below Poverty by Sex and Age in Riverview Estates
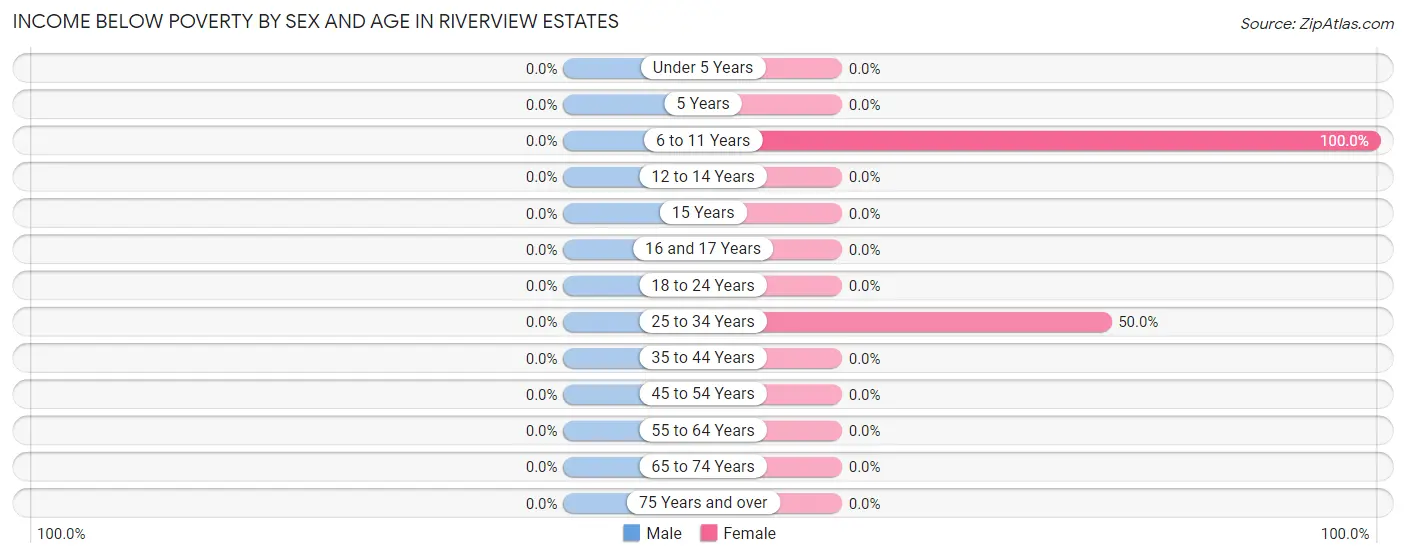
| Age Bracket | Male | Female |
| Under 5 Years | 0 (0.0%) | 0 (0.0%) |
| 5 Years | 0 (0.0%) | 0 (0.0%) |
| 6 to 11 Years | 0 (0.0%) | 3 (100.0%) |
| 12 to 14 Years | 0 (0.0%) | 0 (0.0%) |
| 15 Years | 0 (0.0%) | 0 (0.0%) |
| 16 and 17 Years | 0 (0.0%) | 0 (0.0%) |
| 18 to 24 Years | 0 (0.0%) | 0 (0.0%) |
| 25 to 34 Years | 0 (0.0%) | 3 (50.0%) |
| 35 to 44 Years | 0 (0.0%) | 0 (0.0%) |
| 45 to 54 Years | 0 (0.0%) | 0 (0.0%) |
| 55 to 64 Years | 0 (0.0%) | 0 (0.0%) |
| 65 to 74 Years | 0 (0.0%) | 0 (0.0%) |
| 75 Years and over | 0 (0.0%) | 0 (0.0%) |
| Total | 0 (0.0%) | 6 (12.8%) |
Income Above Poverty by Sex and Age in Riverview Estates
According to the poverty statistics in Riverview Estates, males aged under 5 years and females aged 15 years are the age groups that are most secure financially, with 100.0% of males and 100.0% of females in these age groups living above the poverty line.
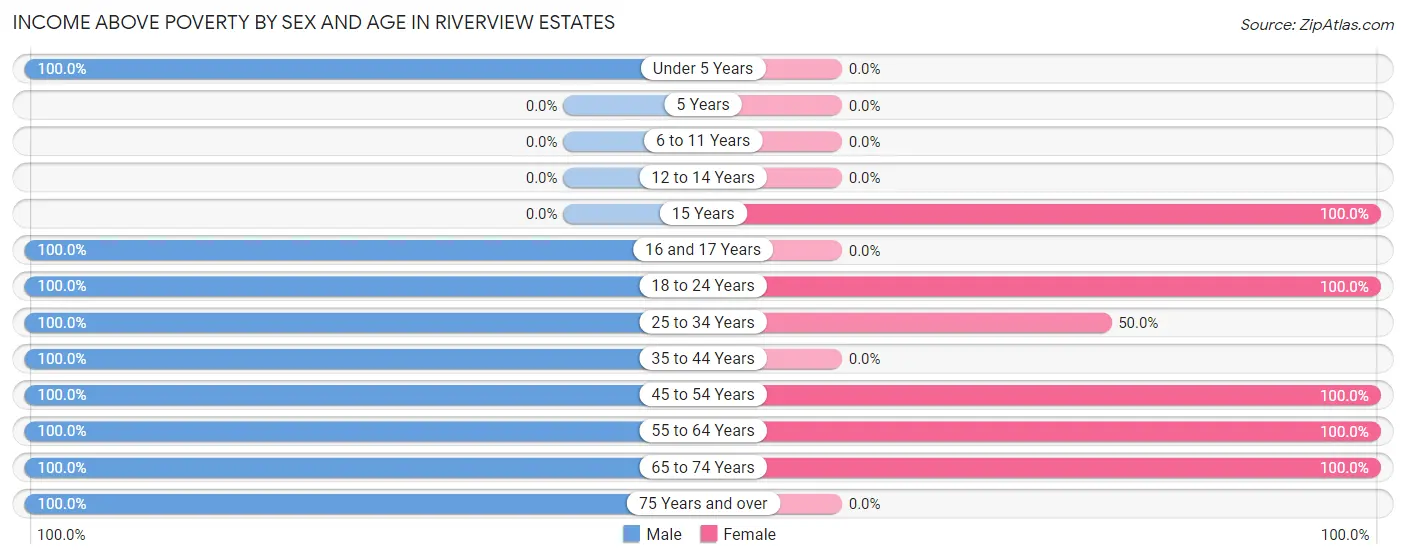
| Age Bracket | Male | Female |
| Under 5 Years | 2 (100.0%) | 0 (0.0%) |
| 5 Years | 0 (0.0%) | 0 (0.0%) |
| 6 to 11 Years | 0 (0.0%) | 0 (0.0%) |
| 12 to 14 Years | 0 (0.0%) | 0 (0.0%) |
| 15 Years | 0 (0.0%) | 2 (100.0%) |
| 16 and 17 Years | 2 (100.0%) | 0 (0.0%) |
| 18 to 24 Years | 6 (100.0%) | 11 (100.0%) |
| 25 to 34 Years | 9 (100.0%) | 3 (50.0%) |
| 35 to 44 Years | 2 (100.0%) | 0 (0.0%) |
| 45 to 54 Years | 6 (100.0%) | 8 (100.0%) |
| 55 to 64 Years | 7 (100.0%) | 10 (100.0%) |
| 65 to 74 Years | 6 (100.0%) | 7 (100.0%) |
| 75 Years and over | 2 (100.0%) | 0 (0.0%) |
| Total | 42 (100.0%) | 41 (87.2%) |
Income Below Poverty Among Married-Couple Families in Riverview Estates
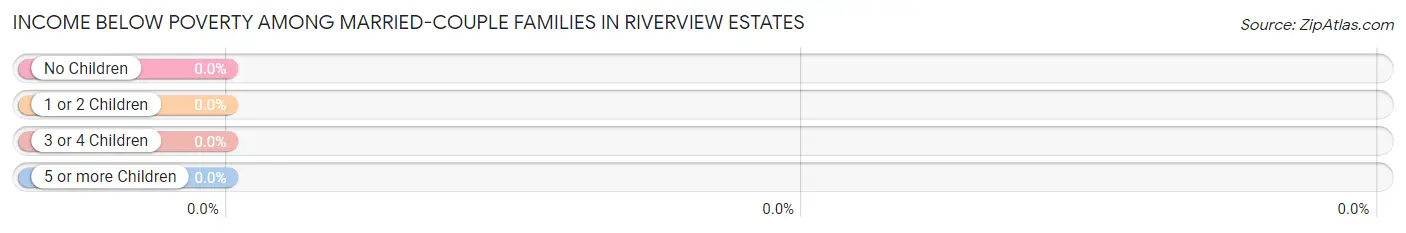
| Children | Above Poverty | Below Poverty |
| No Children | 17 (100.0%) | 0 (0.0%) |
| 1 or 2 Children | 4 (100.0%) | 0 (0.0%) |
| 3 or 4 Children | 0 (0.0%) | 0 (0.0%) |
| 5 or more Children | 0 (0.0%) | 0 (0.0%) |
| Total | 21 (100.0%) | 0 (0.0%) |
Income Below Poverty Among Single-Parent Households in Riverview Estates
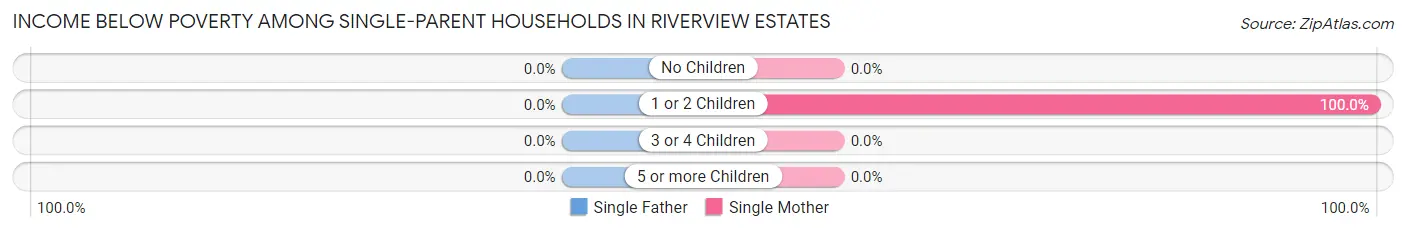
| Children | Single Father | Single Mother |
| No Children | 0 (0.0%) | 0 (0.0%) |
| 1 or 2 Children | 0 (0.0%) | 3 (100.0%) |
| 3 or 4 Children | 0 (0.0%) | 0 (0.0%) |
| 5 or more Children | 0 (0.0%) | 0 (0.0%) |
| Total | 0 (0.0%) | 3 (42.9%) |
Income Below Poverty Among Married-Couple vs Single-Parent Households in Riverview Estates
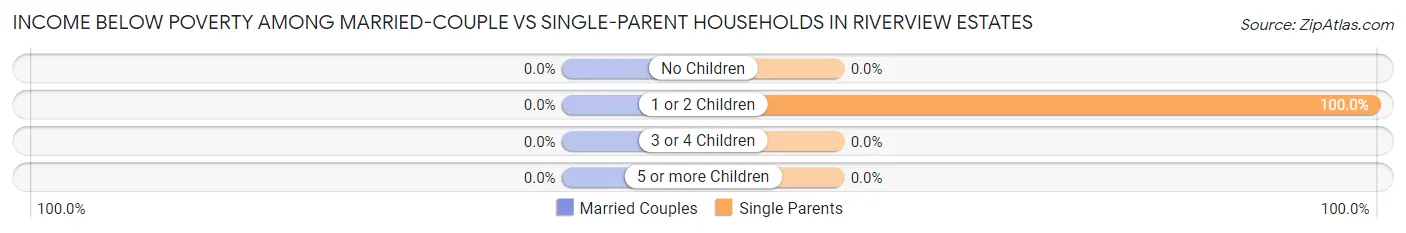
| Children | Married-Couple Families | Single-Parent Households |
| No Children | 0 (0.0%) | 0 (0.0%) |
| 1 or 2 Children | 0 (0.0%) | 3 (100.0%) |
| 3 or 4 Children | 0 (0.0%) | 0 (0.0%) |
| 5 or more Children | 0 (0.0%) | 0 (0.0%) |
| Total | 0 (0.0%) | 3 (42.9%) |
Race in Riverview Estates
The most populous races in Riverview Estates are White / Caucasian (76 | 85.4%), Hispanic or Latino (10 | 11.2%), and Two or more Races (8 | 9.0%).
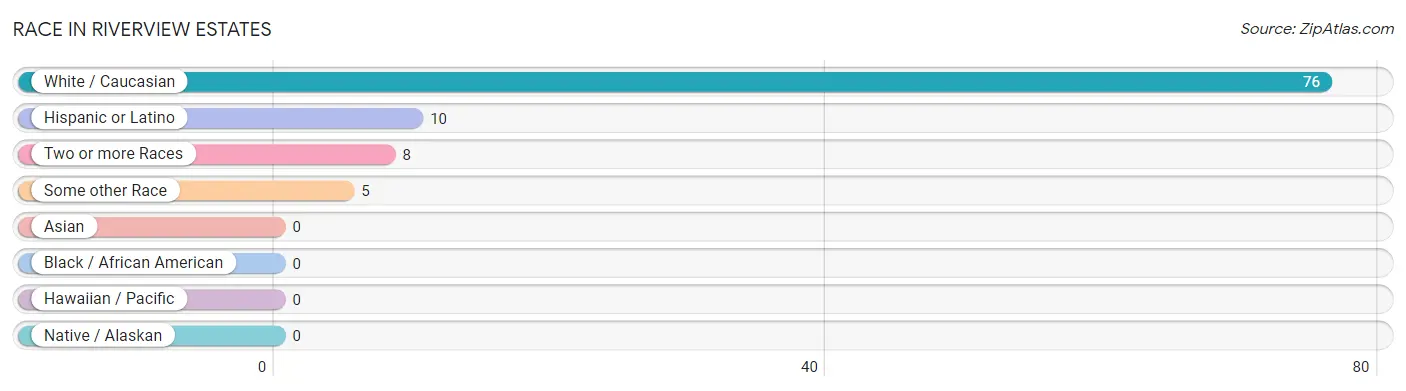
| Race | # Population | % Population |
| Asian | 0 | 0.0% |
| Black / African American | 0 | 0.0% |
| Hawaiian / Pacific | 0 | 0.0% |
| Hispanic or Latino | 10 | 11.2% |
| Native / Alaskan | 0 | 0.0% |
| White / Caucasian | 76 | 85.4% |
| Two or more Races | 8 | 9.0% |
| Some other Race | 5 | 5.6% |
| Total | 89 | 100.0% |
Ancestry in Riverview Estates
The most populous ancestries reported in Riverview Estates are German (26 | 29.2%), English (13 | 14.6%), American (12 | 13.5%), Finnish (11 | 12.4%), and Mexican (8 | 9.0%), together accounting for 78.7% of all Riverview Estates residents.
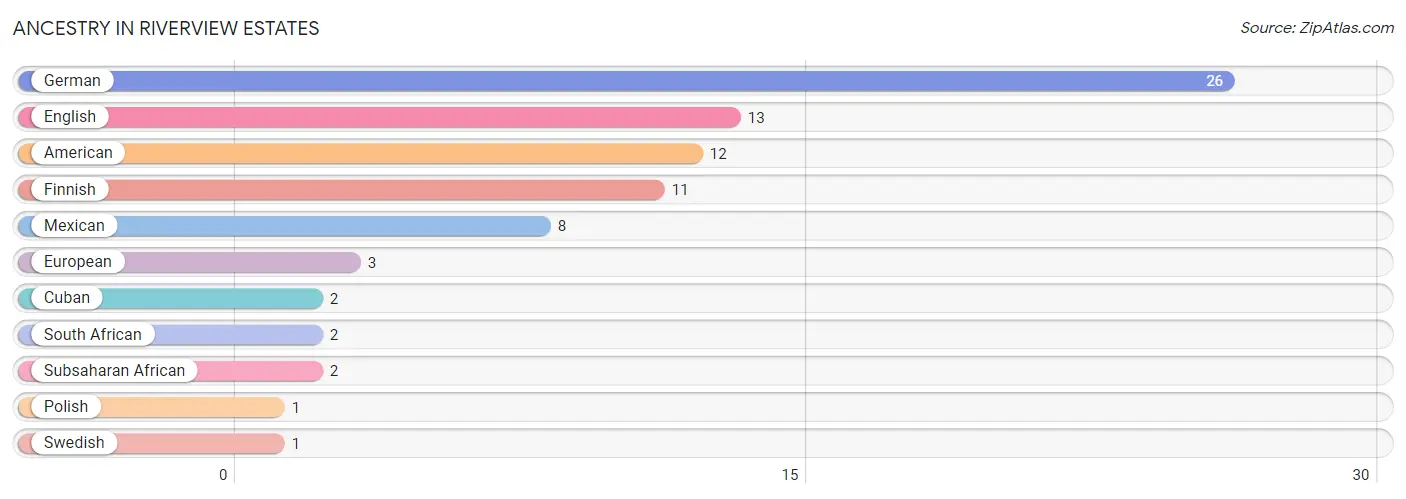
| Ancestry | # Population | % Population |
| American | 12 | 13.5% |
| Cuban | 2 | 2.2% |
| English | 13 | 14.6% |
| European | 3 | 3.4% |
| Finnish | 11 | 12.4% |
| German | 26 | 29.2% |
| Mexican | 8 | 9.0% |
| Polish | 1 | 1.1% |
| South African | 2 | 2.2% |
| Subsaharan African | 2 | 2.2% |
| Swedish | 1 | 1.1% | View All 11 Rows |
Immigrants in Riverview Estates
The most numerous immigrant groups reported in Riverview Estates came from Africa (3 | 3.4%), South Africa (3 | 3.4%), Central America (2 | 2.2%), Latin America (2 | 2.2%), and Mexico (2 | 2.2%), together accounting for 13.5% of all Riverview Estates residents.
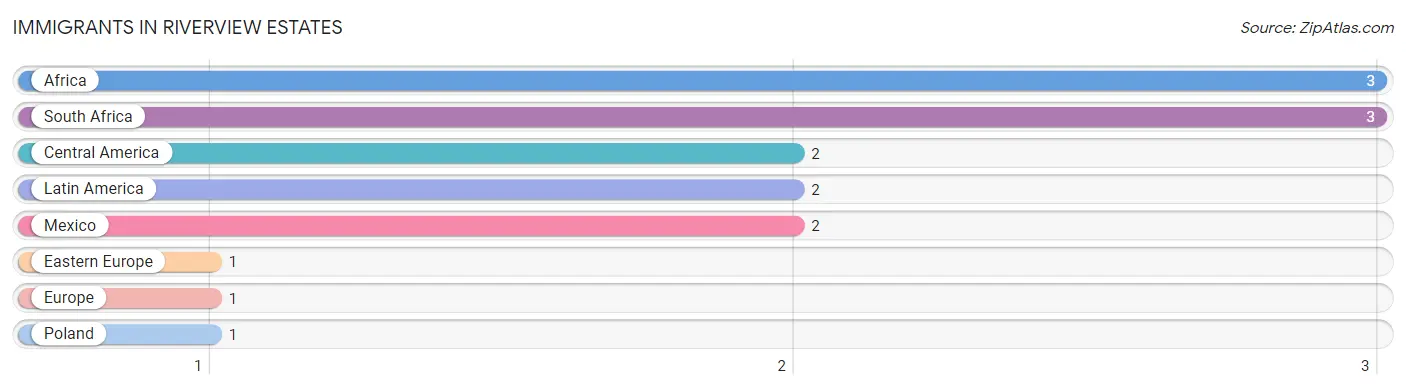
| Immigration Origin | # Population | % Population |
| Africa | 3 | 3.4% |
| Central America | 2 | 2.2% |
| Eastern Europe | 1 | 1.1% |
| Europe | 1 | 1.1% |
| Latin America | 2 | 2.2% |
| Mexico | 2 | 2.2% |
| Poland | 1 | 1.1% |
| South Africa | 3 | 3.4% | View All 8 Rows |
Sex and Age in Riverview Estates
Sex and Age in Riverview Estates
The most populous age groups in Riverview Estates are 15 to 19 Years (7 | 16.7%) for men and 20 to 24 Years (9 | 19.2%) for women.
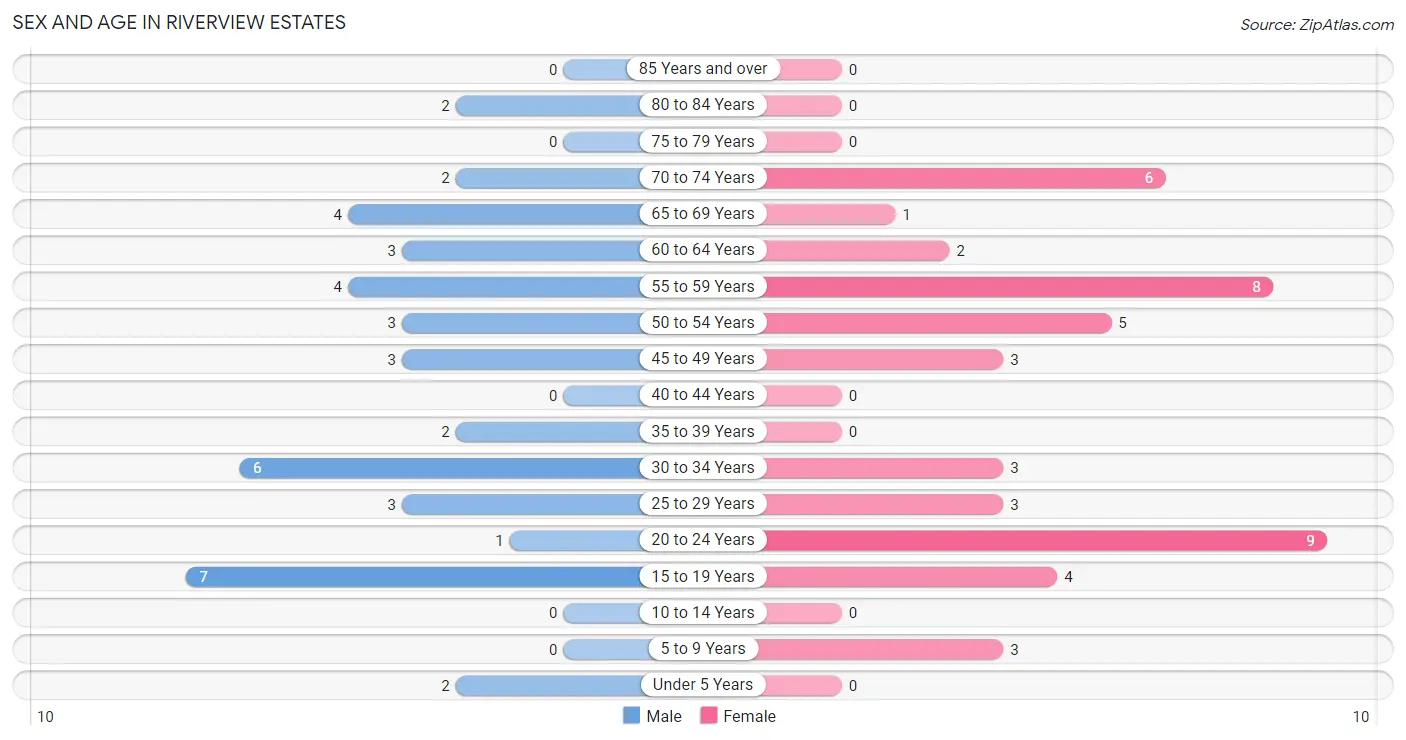
| Age Bracket | Male | Female |
| Under 5 Years | 2 (4.8%) | 0 (0.0%) |
| 5 to 9 Years | 0 (0.0%) | 3 (6.4%) |
| 10 to 14 Years | 0 (0.0%) | 0 (0.0%) |
| 15 to 19 Years | 7 (16.7%) | 4 (8.5%) |
| 20 to 24 Years | 1 (2.4%) | 9 (19.2%) |
| 25 to 29 Years | 3 (7.1%) | 3 (6.4%) |
| 30 to 34 Years | 6 (14.3%) | 3 (6.4%) |
| 35 to 39 Years | 2 (4.8%) | 0 (0.0%) |
| 40 to 44 Years | 0 (0.0%) | 0 (0.0%) |
| 45 to 49 Years | 3 (7.1%) | 3 (6.4%) |
| 50 to 54 Years | 3 (7.1%) | 5 (10.6%) |
| 55 to 59 Years | 4 (9.5%) | 8 (17.0%) |
| 60 to 64 Years | 3 (7.1%) | 2 (4.3%) |
| 65 to 69 Years | 4 (9.5%) | 1 (2.1%) |
| 70 to 74 Years | 2 (4.8%) | 6 (12.8%) |
| 75 to 79 Years | 0 (0.0%) | 0 (0.0%) |
| 80 to 84 Years | 2 (4.8%) | 0 (0.0%) |
| 85 Years and over | 0 (0.0%) | 0 (0.0%) |
| Total | 42 (100.0%) | 47 (100.0%) |
Families and Households in Riverview Estates
Median Family Size in Riverview Estates
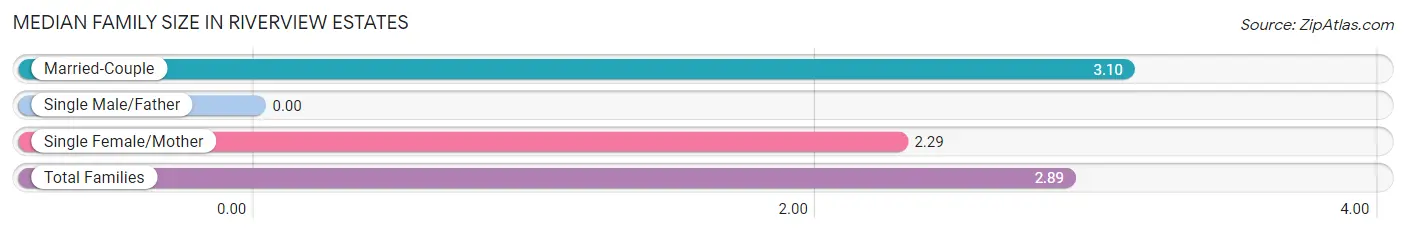
| Family Type | # Families | Family Size |
| Married-Couple | 21 (75.0%) | 3.10 |
| Single Male/Father | 0 (0.0%) | - |
| Single Female/Mother | 7 (25.0%) | 2.29 |
| Total Families | 28 (100.0%) | 2.89 |
Median Household Size in Riverview Estates
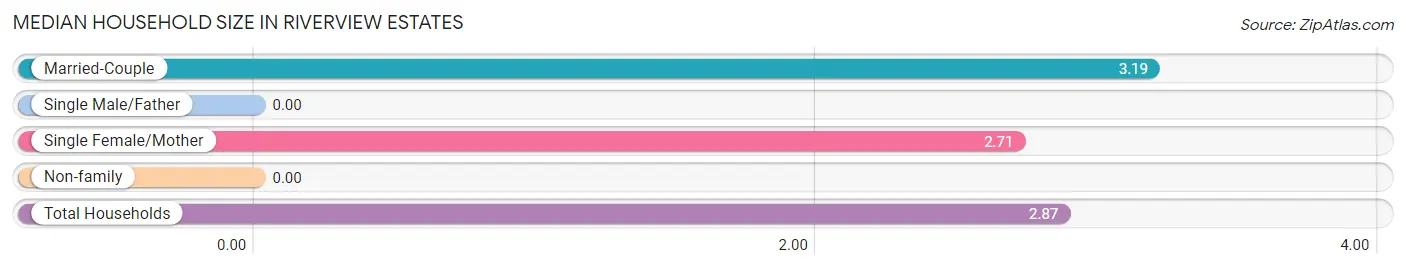
| Household Type | # Households | Household Size |
| Married-Couple | 21 (67.7%) | 3.19 |
| Single Male/Father | 0 (0.0%) | - |
| Single Female/Mother | 7 (22.6%) | 2.71 |
| Non-family | 3 (9.7%) | - |
| Total Households | 31 (100.0%) | 2.87 |
Household Size by Marriage Status in Riverview Estates
Out of a total of 31 households in Riverview Estates, 28 (90.3%) are family households, while 3 (9.7%) are nonfamily households. The most numerous type of family households are 2-person households, comprising 15, and the most common type of nonfamily households are 1-person households, comprising 3.
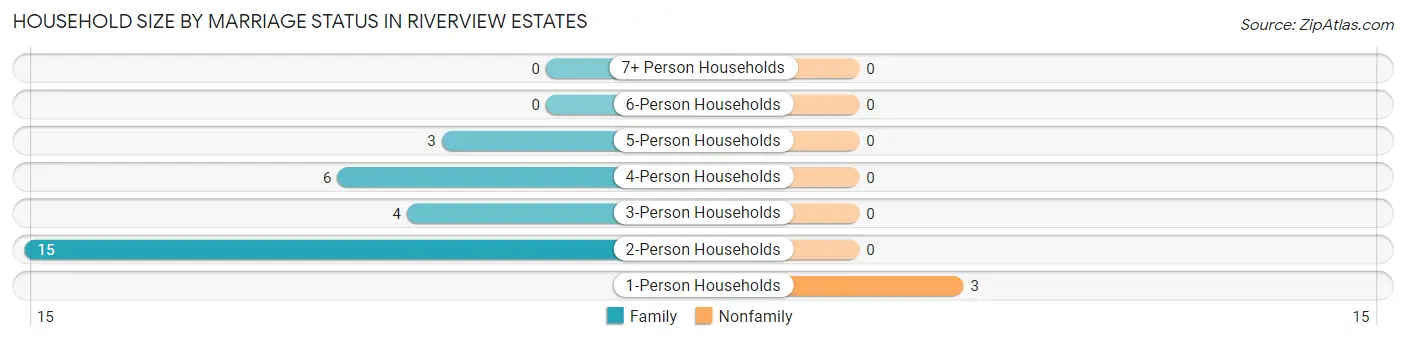
| Household Size | Family Households | Nonfamily Households |
| 1-Person Households | - | 3 (9.7%) |
| 2-Person Households | 15 (48.4%) | 0 (0.0%) |
| 3-Person Households | 4 (12.9%) | 0 (0.0%) |
| 4-Person Households | 6 (19.4%) | 0 (0.0%) |
| 5-Person Households | 3 (9.7%) | 0 (0.0%) |
| 6-Person Households | 0 (0.0%) | 0 (0.0%) |
| 7+ Person Households | 0 (0.0%) | 0 (0.0%) |
| Total | 28 (90.3%) | 3 (9.7%) |
Female Fertility in Riverview Estates
Fertility by Age in Riverview Estates
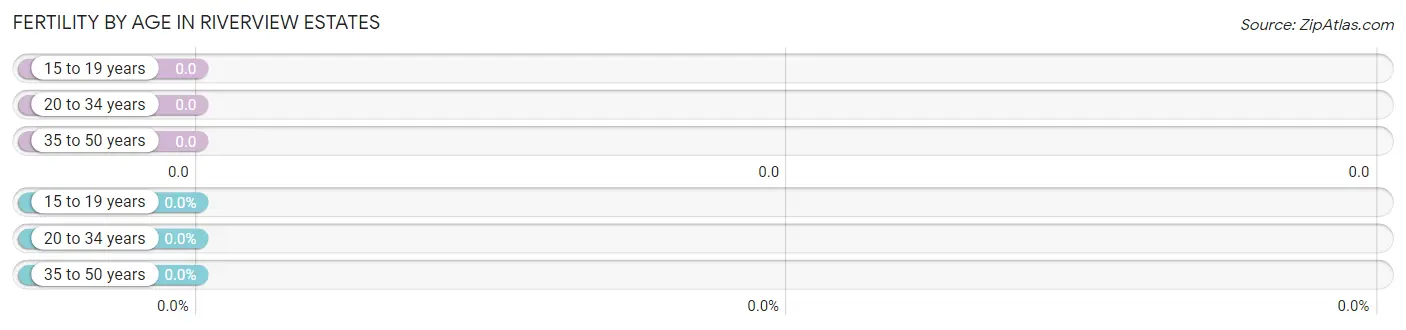
| Age Bracket | Women with Births | Births / 1,000 Women |
| 15 to 19 years | 0 (0.0%) | 0.0 |
| 20 to 34 years | 0 (0.0%) | 0.0 |
| 35 to 50 years | 0 (0.0%) | 0.0 |
| Total | 0 (0.0%) | 0.0 |
Fertility by Age by Marriage Status in Riverview Estates
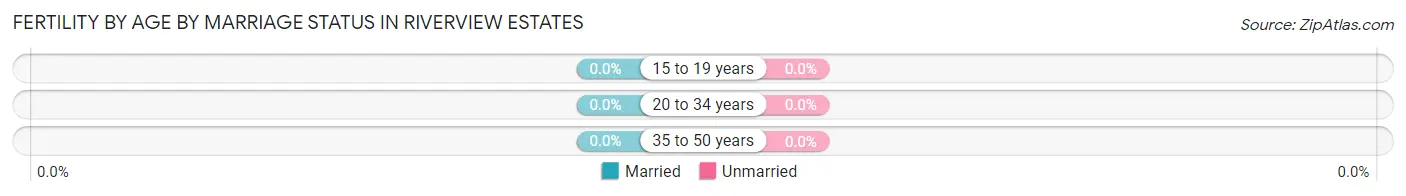
| Age Bracket | Married | Unmarried |
| 15 to 19 years | 0 (0.0%) | 0 (0.0%) |
| 20 to 34 years | 0 (0.0%) | 0 (0.0%) |
| 35 to 50 years | 0 (0.0%) | 0 (0.0%) |
| Total | 0 (0.0%) | 0 (0.0%) |
Fertility by Education in Riverview Estates
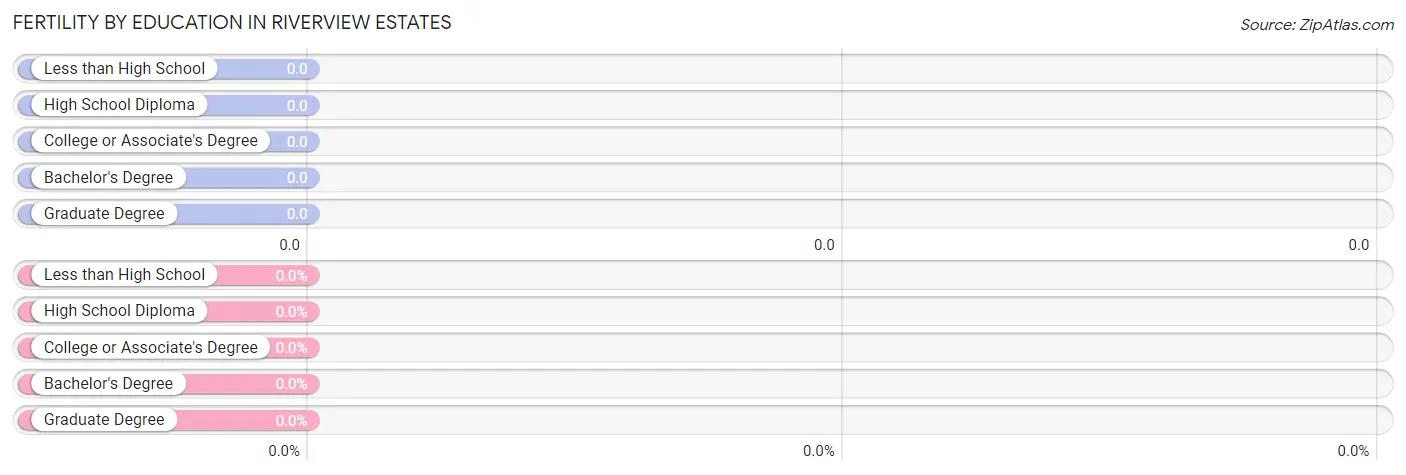
| Educational Attainment | Women with Births | Births / 1,000 Women |
| Less than High School | 0 (0.0%) | 0.0 |
| High School Diploma | 0 (0.0%) | 0.0 |
| College or Associate's Degree | 0 (0.0%) | 0.0 |
| Bachelor's Degree | 0 (0.0%) | 0.0 |
| Graduate Degree | 0 (0.0%) | 0.0 |
| Total | 0 (0.0%) | 0.0 |
Fertility by Education by Marriage Status in Riverview Estates
| Educational Attainment | Married | Unmarried |
| Less than High School | 0 (0.0%) | 0 (0.0%) |
| High School Diploma | 0 (0.0%) | 0 (0.0%) |
| College or Associate's Degree | 0 (0.0%) | 0 (0.0%) |
| Bachelor's Degree | 0 (0.0%) | 0 (0.0%) |
| Graduate Degree | 0 (0.0%) | 0 (0.0%) |
| Total | 0 (0.0%) | 0 (0.0%) |
Employment Characteristics in Riverview Estates
Employment by Class of Employer in Riverview Estates
Among the 56 employed individuals in Riverview Estates, private company employees (32 | 57.1%), not-for-profit organizations (12 | 21.4%), and local government employees (8 | 14.3%) make up the most common classes of employment.
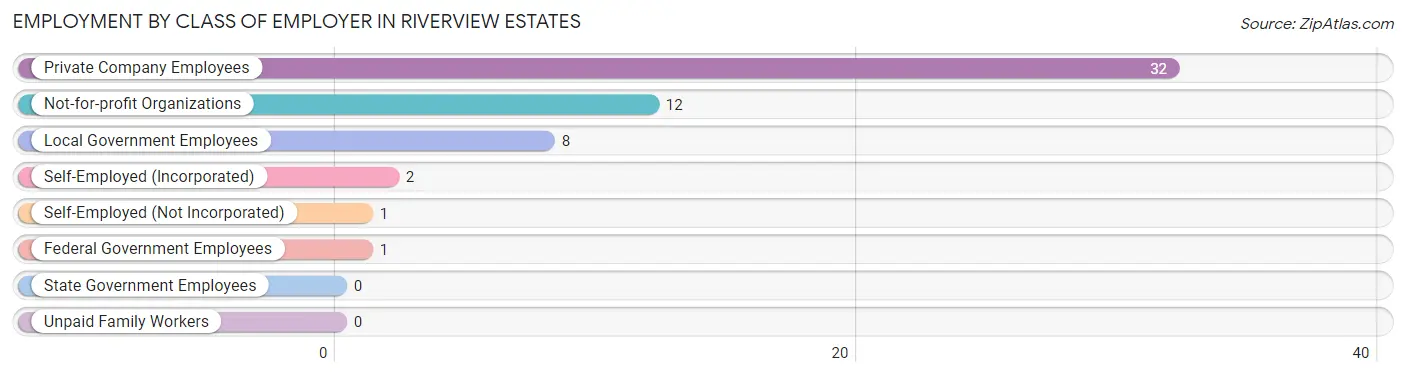
| Employer Class | # Employees | % Employees |
| Private Company Employees | 32 | 57.1% |
| Self-Employed (Incorporated) | 2 | 3.6% |
| Self-Employed (Not Incorporated) | 1 | 1.8% |
| Not-for-profit Organizations | 12 | 21.4% |
| Local Government Employees | 8 | 14.3% |
| State Government Employees | 0 | 0.0% |
| Federal Government Employees | 1 | 1.8% |
| Unpaid Family Workers | 0 | 0.0% |
| Total | 56 | 100.0% |
Employment Status by Age in Riverview Estates
According to the labor force statistics for Riverview Estates, out of the total population over 16 years of age (82), 69.5% or 57 individuals are in the labor force, with 1.8% or 1 of them unemployed. The age group with the highest labor force participation rate is 20 to 24 years, with 100.0% or 10 individuals in the labor force. Within the labor force, the 65 to 74 years age range has the highest percentage of unemployed individuals, with 33.3% or 1 of them being unemployed.
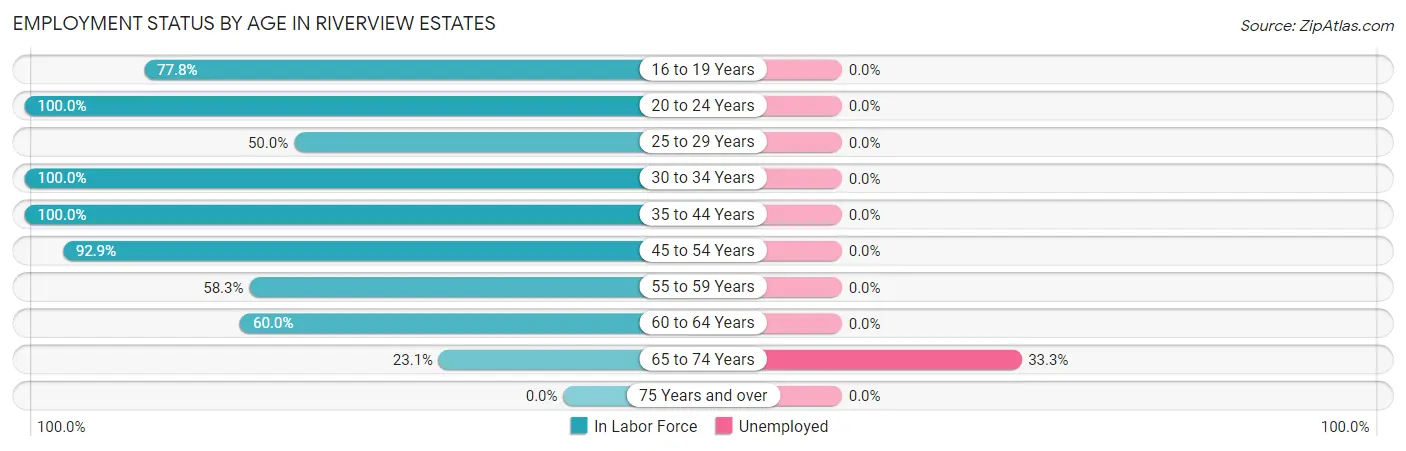
| Age Bracket | In Labor Force | Unemployed |
| 16 to 19 Years | 7 (77.8%) | 0 (0.0%) |
| 20 to 24 Years | 10 (100.0%) | 0 (0.0%) |
| 25 to 29 Years | 3 (50.0%) | 0 (0.0%) |
| 30 to 34 Years | 9 (100.0%) | 0 (0.0%) |
| 35 to 44 Years | 2 (100.0%) | 0 (0.0%) |
| 45 to 54 Years | 13 (92.9%) | 0 (0.0%) |
| 55 to 59 Years | 7 (58.3%) | 0 (0.0%) |
| 60 to 64 Years | 3 (60.0%) | 0 (0.0%) |
| 65 to 74 Years | 3 (23.1%) | 1 (33.3%) |
| 75 Years and over | 0 (0.0%) | 0 (0.0%) |
| Total | 57 (69.5%) | 1 (1.8%) |
Employment Status by Educational Attainment in Riverview Estates
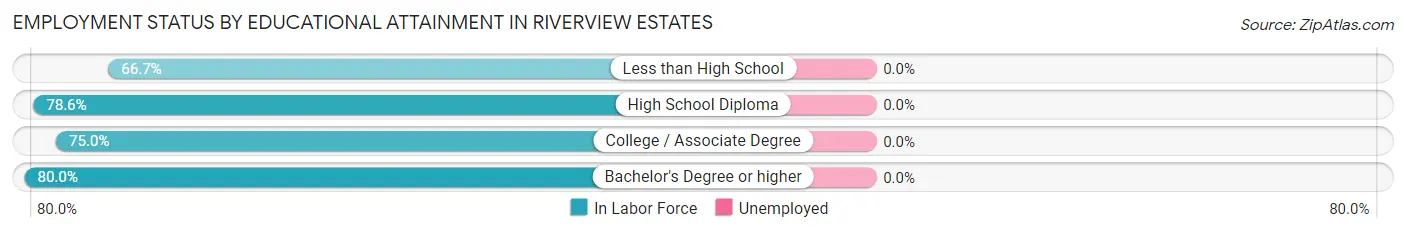
| Educational Attainment | In Labor Force | Unemployed |
| Less than High School | 4 (66.7%) | 0 (0.0%) |
| High School Diploma | 11 (78.6%) | 0 (0.0%) |
| College / Associate Degree | 6 (75.0%) | 0 (0.0%) |
| Bachelor's Degree or higher | 16 (80.0%) | 0 (0.0%) |
| Total | 37 (77.1%) | 0 (0.0%) |
Employment Occupations by Sex in Riverview Estates
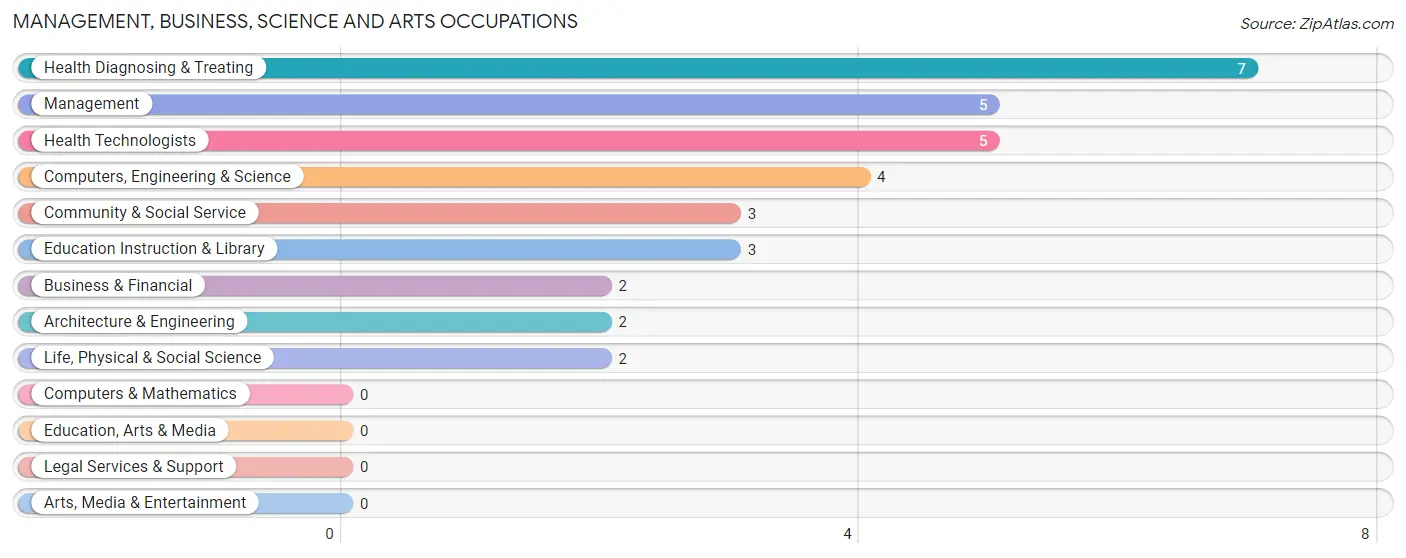
Management, Business, Science and Arts Occupations
The most common Management, Business, Science and Arts occupations in Riverview Estates are Health Diagnosing & Treating (7 | 12.5%), Management (5 | 8.9%), Health Technologists (5 | 8.9%), Computers, Engineering & Science (4 | 7.1%), and Community & Social Service (3 | 5.4%).
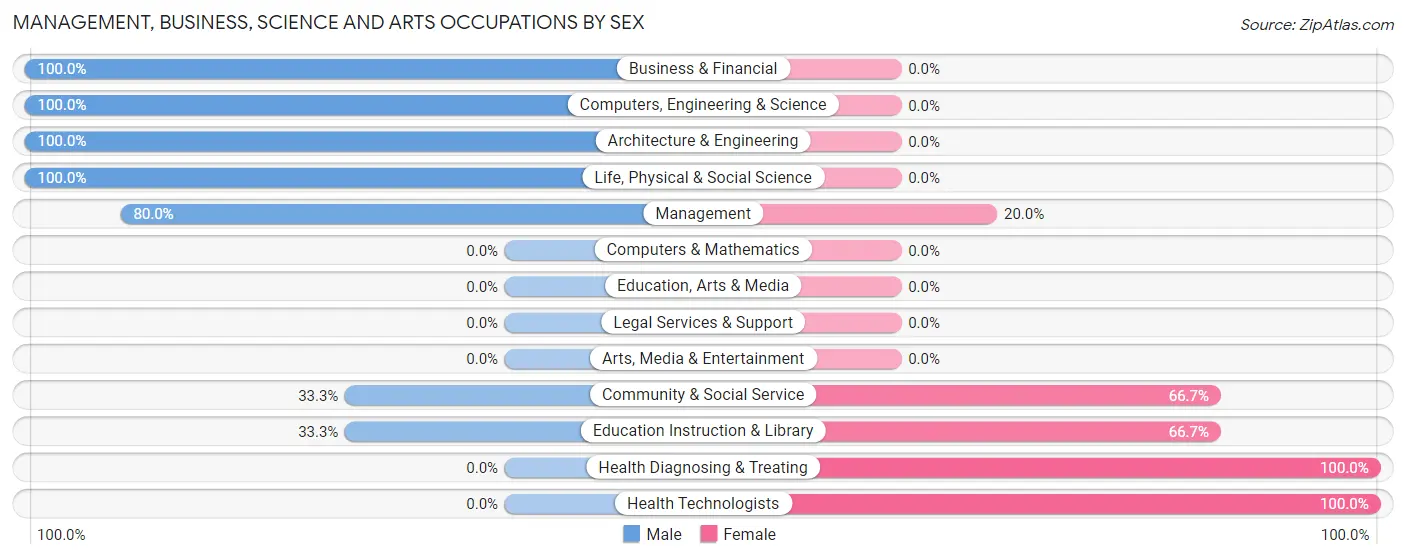
Management, Business, Science and Arts Occupations by Sex
Within the Management, Business, Science and Arts occupations in Riverview Estates, the most male-oriented occupations are Business & Financial (100.0%), Computers, Engineering & Science (100.0%), and Architecture & Engineering (100.0%), while the most female-oriented occupations are Health Diagnosing & Treating (100.0%), Health Technologists (100.0%), and Community & Social Service (66.7%).
| Occupation | Male | Female |
| Management | 4 (80.0%) | 1 (20.0%) |
| Business & Financial | 2 (100.0%) | 0 (0.0%) |
| Computers, Engineering & Science | 4 (100.0%) | 0 (0.0%) |
| Computers & Mathematics | 0 (0.0%) | 0 (0.0%) |
| Architecture & Engineering | 2 (100.0%) | 0 (0.0%) |
| Life, Physical & Social Science | 2 (100.0%) | 0 (0.0%) |
| Community & Social Service | 1 (33.3%) | 2 (66.7%) |
| Education, Arts & Media | 0 (0.0%) | 0 (0.0%) |
| Legal Services & Support | 0 (0.0%) | 0 (0.0%) |
| Education Instruction & Library | 1 (33.3%) | 2 (66.7%) |
| Arts, Media & Entertainment | 0 (0.0%) | 0 (0.0%) |
| Health Diagnosing & Treating | 0 (0.0%) | 7 (100.0%) |
| Health Technologists | 0 (0.0%) | 5 (100.0%) |
| Total (Category) | 11 (52.4%) | 10 (47.6%) |
| Total (Overall) | 28 (50.0%) | 28 (50.0%) |
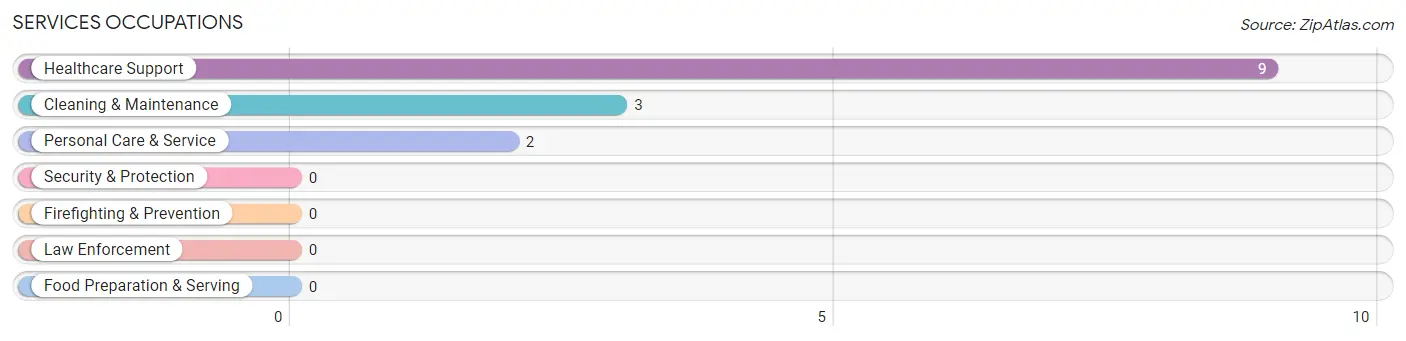
Services Occupations
The most common Services occupations in Riverview Estates are Healthcare Support (9 | 16.1%), Cleaning & Maintenance (3 | 5.4%), and Personal Care & Service (2 | 3.6%).
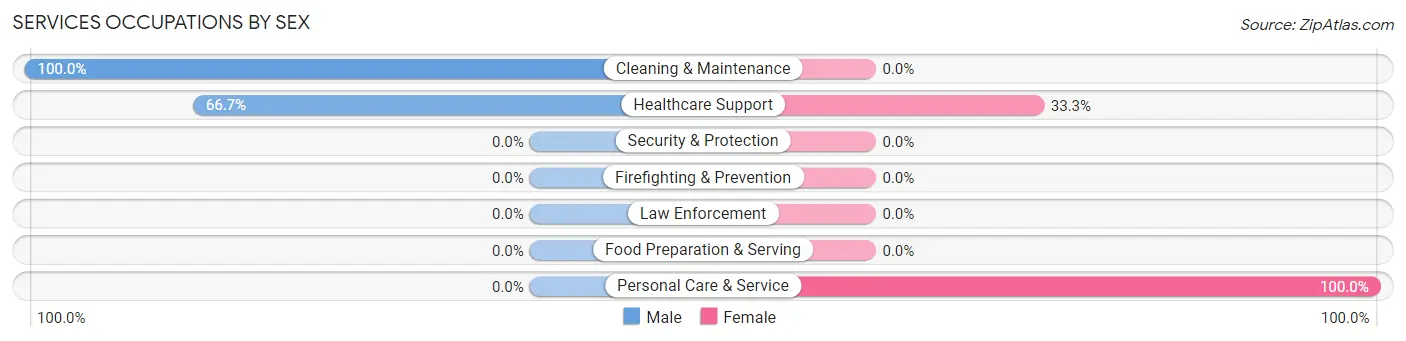
Services Occupations by Sex
Within the Services occupations in Riverview Estates, the most male-oriented occupations are Cleaning & Maintenance (100.0%), and Healthcare Support (66.7%), while the most female-oriented occupations are Personal Care & Service (100.0%), and Healthcare Support (33.3%).
| Occupation | Male | Female |
| Healthcare Support | 6 (66.7%) | 3 (33.3%) |
| Security & Protection | 0 (0.0%) | 0 (0.0%) |
| Firefighting & Prevention | 0 (0.0%) | 0 (0.0%) |
| Law Enforcement | 0 (0.0%) | 0 (0.0%) |
| Food Preparation & Serving | 0 (0.0%) | 0 (0.0%) |
| Cleaning & Maintenance | 3 (100.0%) | 0 (0.0%) |
| Personal Care & Service | 0 (0.0%) | 2 (100.0%) |
| Total (Category) | 9 (64.3%) | 5 (35.7%) |
| Total (Overall) | 28 (50.0%) | 28 (50.0%) |
Sales and Office Occupations
The most common Sales and Office occupations in Riverview Estates are Sales & Related (8 | 14.3%), and Office & Administration (5 | 8.9%).

Sales and Office Occupations by Sex

| Occupation | Male | Female |
| Sales & Related | 0 (0.0%) | 8 (100.0%) |
| Office & Administration | 2 (40.0%) | 3 (60.0%) |
| Total (Category) | 2 (15.4%) | 11 (84.6%) |
| Total (Overall) | 28 (50.0%) | 28 (50.0%) |
Natural Resources, Construction and Maintenance Occupations
The most common Natural Resources, Construction and Maintenance occupations in Riverview Estates are , and Construction & Extraction (2 | 3.6%).

Natural Resources, Construction and Maintenance Occupations by Sex

| Occupation | Male | Female |
| Farming, Fishing & Forestry | 0 (0.0%) | 0 (0.0%) |
| Construction & Extraction | 2 (100.0%) | 0 (0.0%) |
| Installation, Maintenance & Repair | 0 (0.0%) | 0 (0.0%) |
| Total (Category) | 2 (100.0%) | 0 (0.0%) |
| Total (Overall) | 28 (50.0%) | 28 (50.0%) |
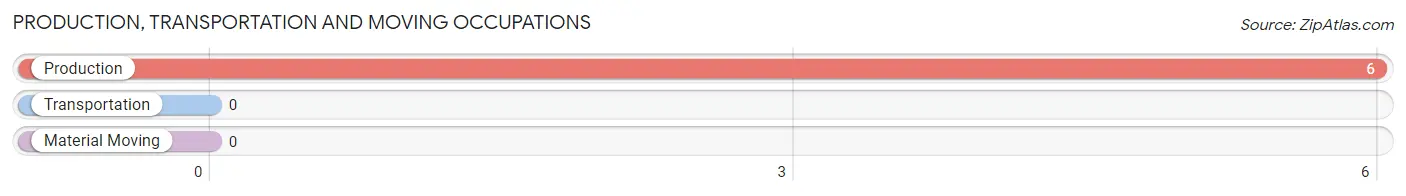
Production, Transportation and Moving Occupations
The most common Production, Transportation and Moving occupations in Riverview Estates are , and Production (6 | 10.7%).
Production, Transportation and Moving Occupations by Sex
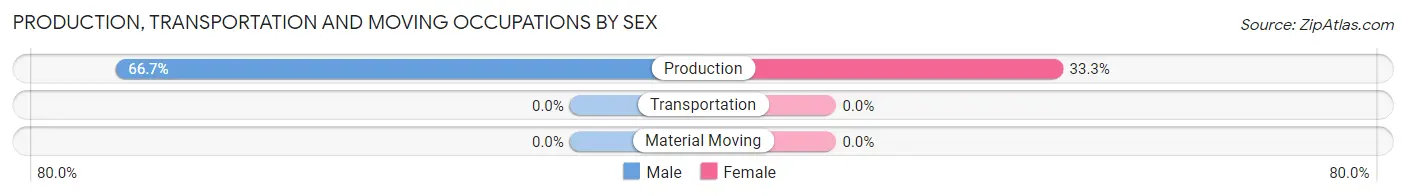
| Occupation | Male | Female |
| Production | 4 (66.7%) | 2 (33.3%) |
| Transportation | 0 (0.0%) | 0 (0.0%) |
| Material Moving | 0 (0.0%) | 0 (0.0%) |
| Total (Category) | 4 (66.7%) | 2 (33.3%) |
| Total (Overall) | 28 (50.0%) | 28 (50.0%) |
Employment Industries by Sex in Riverview Estates
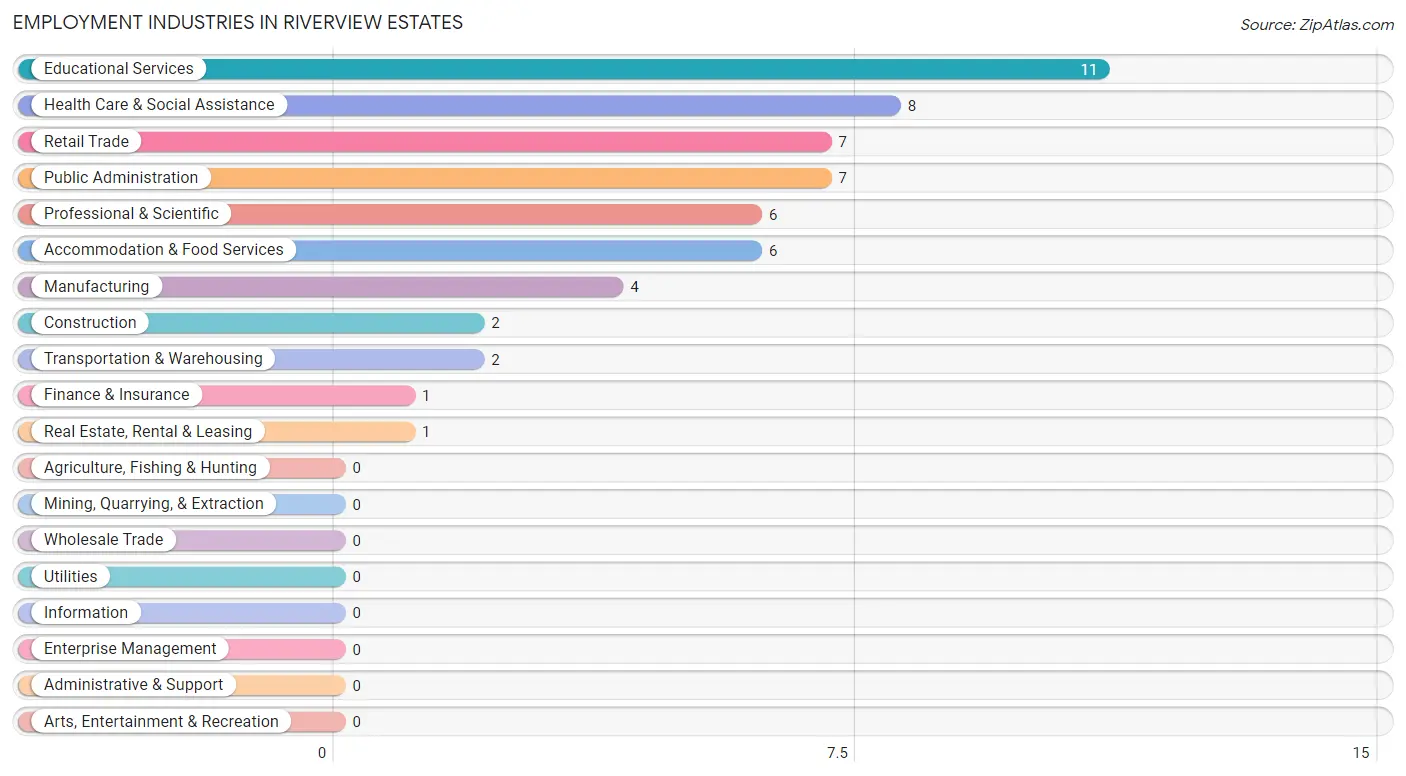
Employment Industries in Riverview Estates
The major employment industries in Riverview Estates include Educational Services (11 | 19.6%), Health Care & Social Assistance (8 | 14.3%), Retail Trade (7 | 12.5%), Public Administration (7 | 12.5%), and Professional & Scientific (6 | 10.7%).
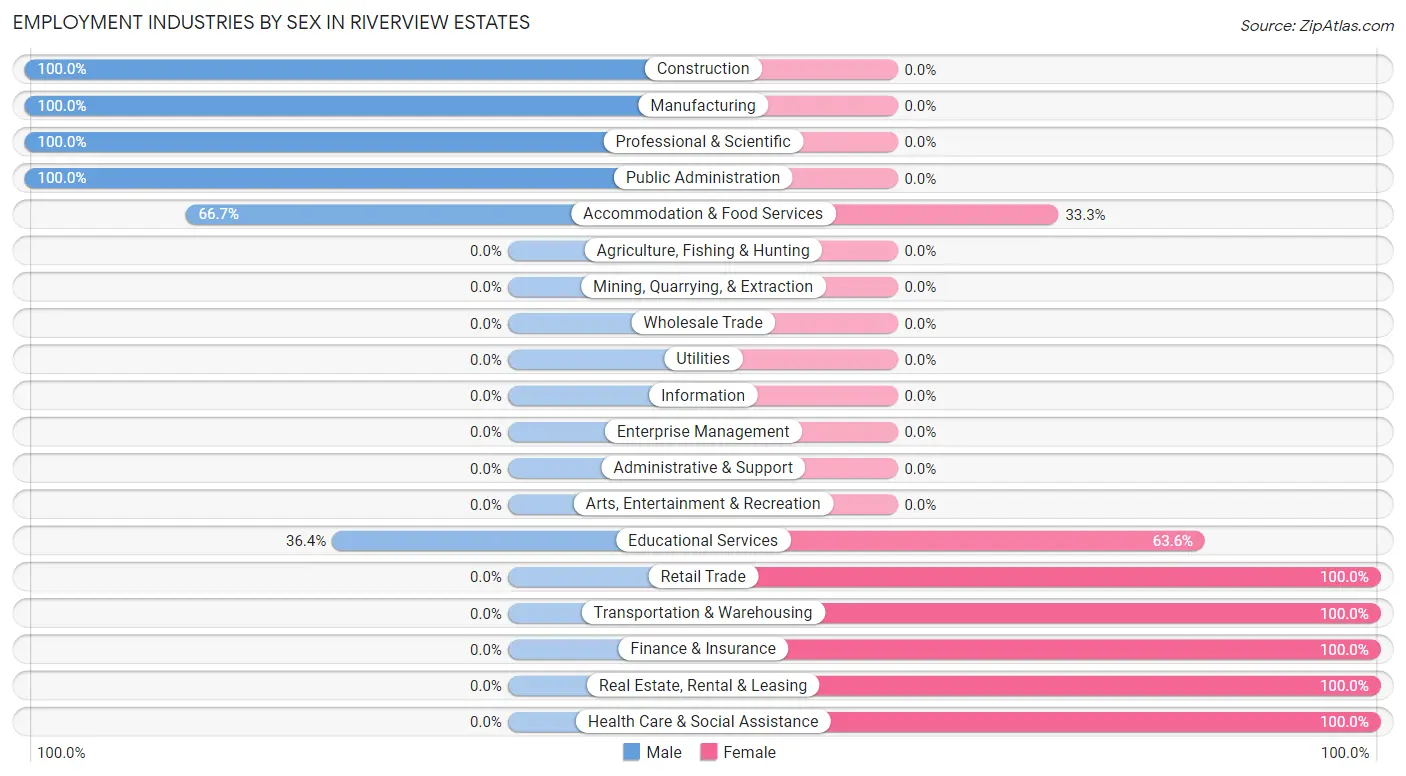
Employment Industries by Sex in Riverview Estates
The Riverview Estates industries that see more men than women are Construction (100.0%), Manufacturing (100.0%), and Professional & Scientific (100.0%), whereas the industries that tend to have a higher number of women are Retail Trade (100.0%), Transportation & Warehousing (100.0%), and Finance & Insurance (100.0%).
| Industry | Male | Female |
| Agriculture, Fishing & Hunting | 0 (0.0%) | 0 (0.0%) |
| Mining, Quarrying, & Extraction | 0 (0.0%) | 0 (0.0%) |
| Construction | 2 (100.0%) | 0 (0.0%) |
| Manufacturing | 4 (100.0%) | 0 (0.0%) |
| Wholesale Trade | 0 (0.0%) | 0 (0.0%) |
| Retail Trade | 0 (0.0%) | 7 (100.0%) |
| Transportation & Warehousing | 0 (0.0%) | 2 (100.0%) |
| Utilities | 0 (0.0%) | 0 (0.0%) |
| Information | 0 (0.0%) | 0 (0.0%) |
| Finance & Insurance | 0 (0.0%) | 1 (100.0%) |
| Real Estate, Rental & Leasing | 0 (0.0%) | 1 (100.0%) |
| Professional & Scientific | 6 (100.0%) | 0 (0.0%) |
| Enterprise Management | 0 (0.0%) | 0 (0.0%) |
| Administrative & Support | 0 (0.0%) | 0 (0.0%) |
| Educational Services | 4 (36.4%) | 7 (63.6%) |
| Health Care & Social Assistance | 0 (0.0%) | 8 (100.0%) |
| Arts, Entertainment & Recreation | 0 (0.0%) | 0 (0.0%) |
| Accommodation & Food Services | 4 (66.7%) | 2 (33.3%) |
| Public Administration | 7 (100.0%) | 0 (0.0%) |
| Total | 28 (50.0%) | 28 (50.0%) |
Education in Riverview Estates
School Enrollment in Riverview Estates
The most common levels of schooling among the 18 students in Riverview Estates are college / undergraduate (11 | 61.1%), high school (4 | 22.2%), and elementary school (3 | 16.7%).
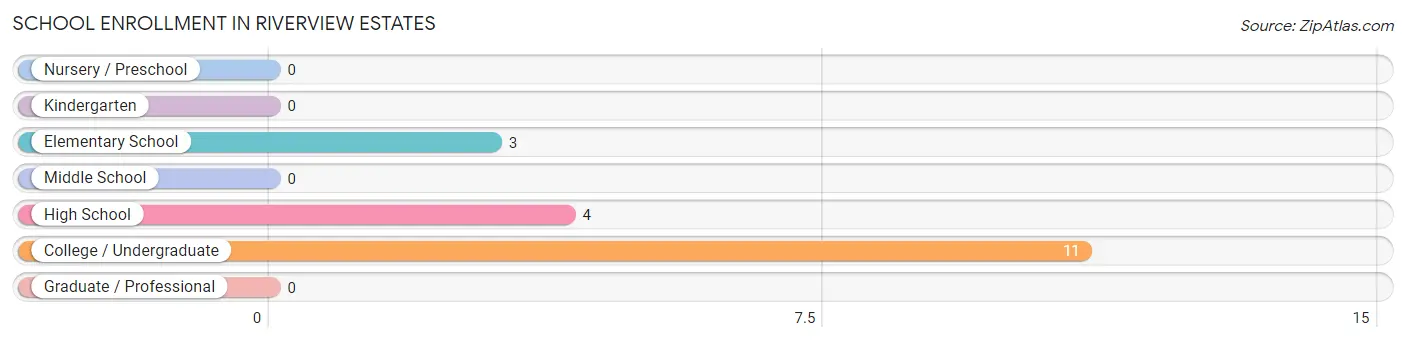
| School Level | # Students | % Students |
| Nursery / Preschool | 0 | 0.0% |
| Kindergarten | 0 | 0.0% |
| Elementary School | 3 | 16.7% |
| Middle School | 0 | 0.0% |
| High School | 4 | 22.2% |
| College / Undergraduate | 11 | 61.1% |
| Graduate / Professional | 0 | 0.0% |
| Total | 18 | 100.0% |
School Enrollment by Age by Funding Source in Riverview Estates
Out of a total of 18 students who are enrolled in schools in Riverview Estates, 5 (27.8%) attend a private institution, while the remaining 13 (72.2%) are enrolled in public schools. The age group of 20 to 24 year olds has the highest likelihood of being enrolled in private schools, with 3 (60.0% in the age bracket) enrolled. Conversely, the age group of 5 to 9 year old has the lowest likelihood of being enrolled in a private school, with 3 (100.0% in the age bracket) attending a public institution.
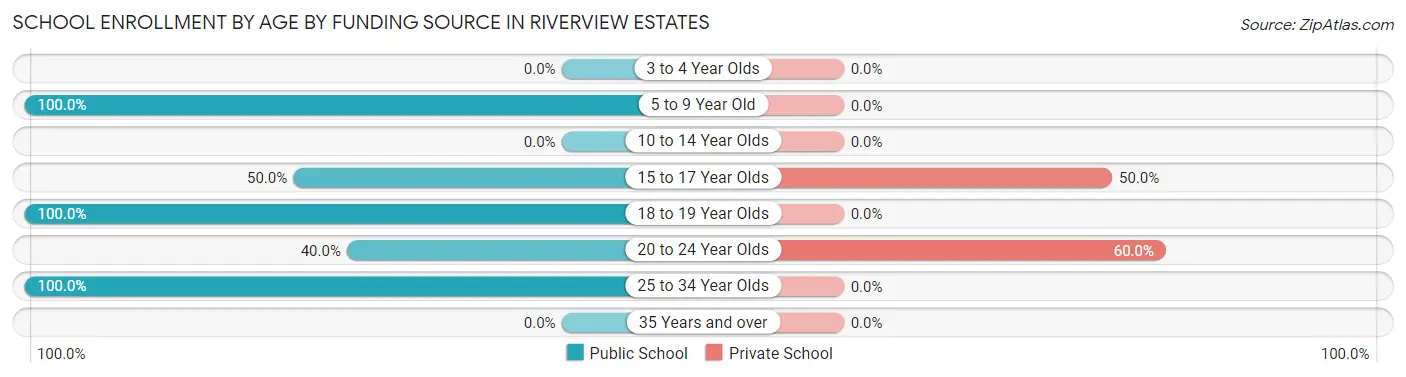
| Age Bracket | Public School | Private School |
| 3 to 4 Year Olds | 0 (0.0%) | 0 (0.0%) |
| 5 to 9 Year Old | 3 (100.0%) | 0 (0.0%) |
| 10 to 14 Year Olds | 0 (0.0%) | 0 (0.0%) |
| 15 to 17 Year Olds | 2 (50.0%) | 2 (50.0%) |
| 18 to 19 Year Olds | 3 (100.0%) | 0 (0.0%) |
| 20 to 24 Year Olds | 2 (40.0%) | 3 (60.0%) |
| 25 to 34 Year Olds | 3 (100.0%) | 0 (0.0%) |
| 35 Years and over | 0 (0.0%) | 0 (0.0%) |
| Total | 13 (72.2%) | 5 (27.8%) |
Educational Attainment by Field of Study in Riverview Estates
Science & technology (6 | 25.0%), bio, nature & agricultural (4 | 16.7%), business (4 | 16.7%), visual & performing arts (4 | 16.7%), and engineering (2 | 8.3%) are the most common fields of study among 24 individuals in Riverview Estates who have obtained a bachelor's degree or higher.
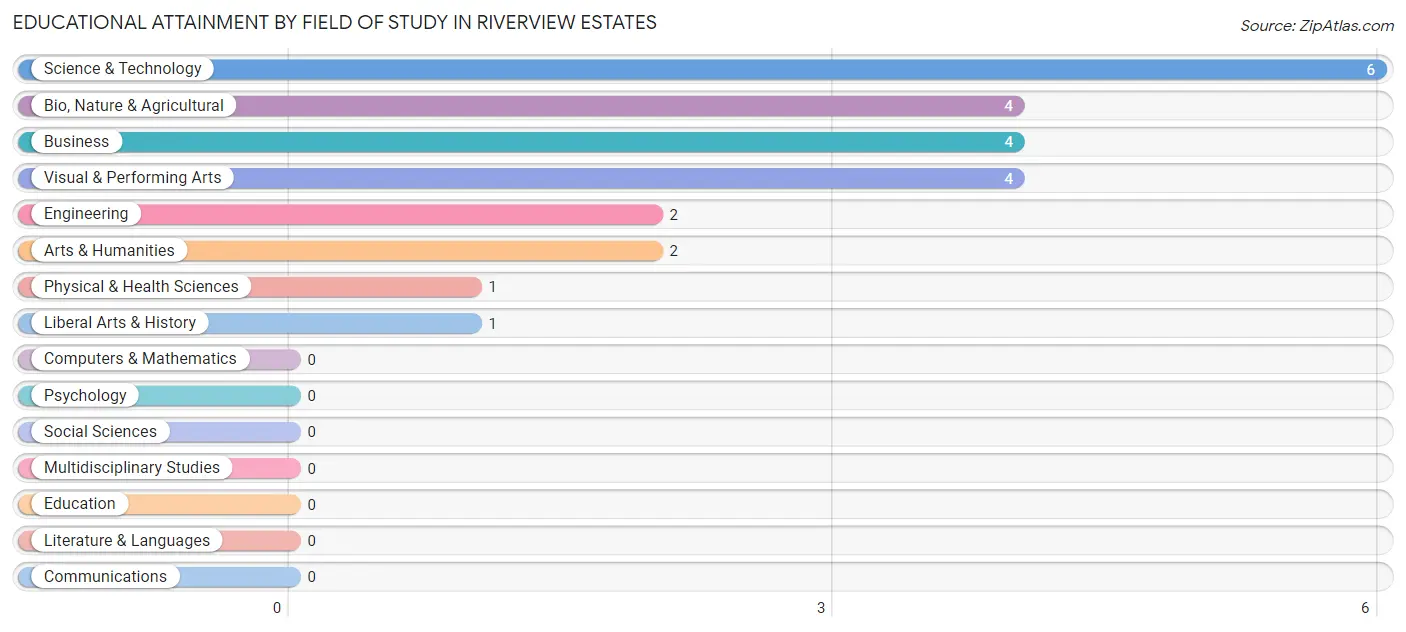
| Field of Study | # Graduates | % Graduates |
| Computers & Mathematics | 0 | 0.0% |
| Bio, Nature & Agricultural | 4 | 16.7% |
| Physical & Health Sciences | 1 | 4.2% |
| Psychology | 0 | 0.0% |
| Social Sciences | 0 | 0.0% |
| Engineering | 2 | 8.3% |
| Multidisciplinary Studies | 0 | 0.0% |
| Science & Technology | 6 | 25.0% |
| Business | 4 | 16.7% |
| Education | 0 | 0.0% |
| Literature & Languages | 0 | 0.0% |
| Liberal Arts & History | 1 | 4.2% |
| Visual & Performing Arts | 4 | 16.7% |
| Communications | 0 | 0.0% |
| Arts & Humanities | 2 | 8.3% |
| Total | 24 | 100.0% |
Transportation & Commute in Riverview Estates
Vehicle Availability by Sex in Riverview Estates
The most prevalent vehicle ownership categories in Riverview Estates are males with 3 vehicles (11, accounting for 39.3%) and females with 3 vehicles (10, making up 39.3%).
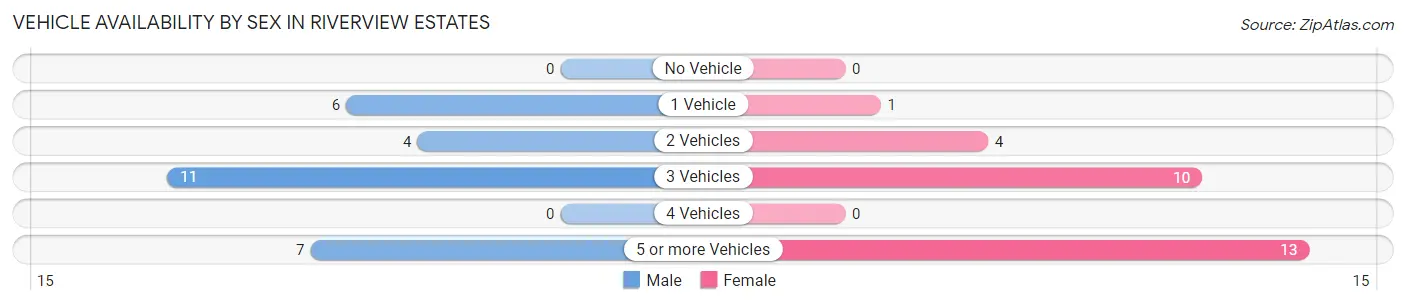
| Vehicles Available | Male | Female |
| No Vehicle | 0 (0.0%) | 0 (0.0%) |
| 1 Vehicle | 6 (21.4%) | 1 (3.6%) |
| 2 Vehicles | 4 (14.3%) | 4 (14.3%) |
| 3 Vehicles | 11 (39.3%) | 10 (35.7%) |
| 4 Vehicles | 0 (0.0%) | 0 (0.0%) |
| 5 or more Vehicles | 7 (25.0%) | 13 (46.4%) |
| Total | 28 (100.0%) | 28 (100.0%) |
Commute Time in Riverview Estates
The most frequently occuring commute durations in Riverview Estates are 20 to 24 minutes (16 commuters, 32.7%), 35 to 39 minutes (7 commuters, 14.3%), and 40 to 44 minutes (7 commuters, 14.3%).
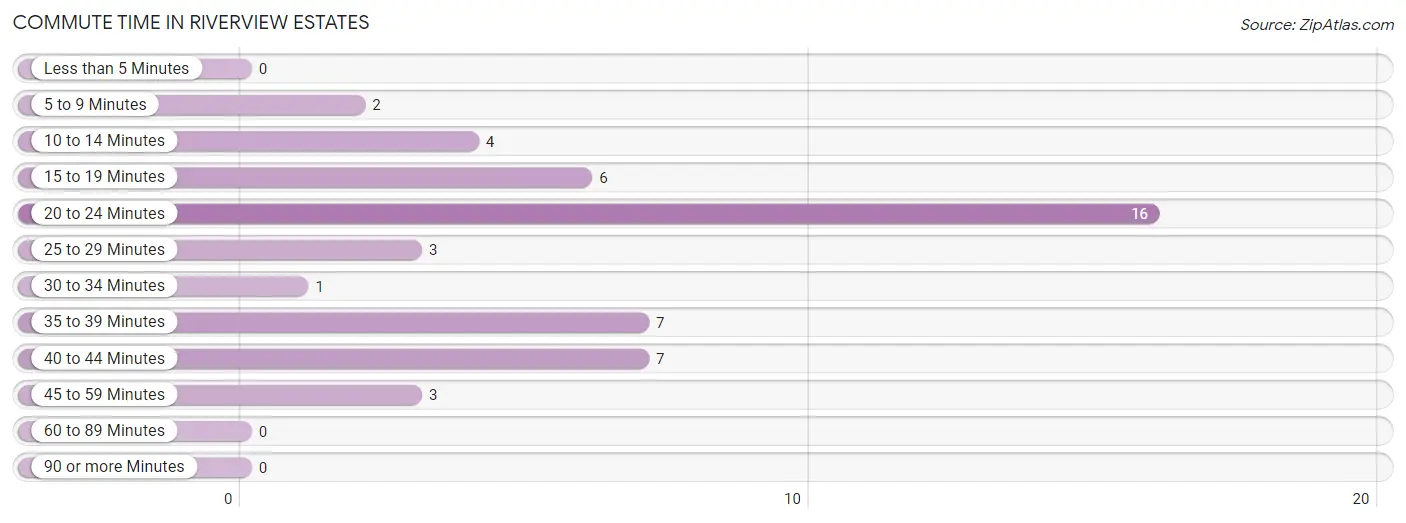
| Commute Time | # Commuters | % Commuters |
| Less than 5 Minutes | 0 | 0.0% |
| 5 to 9 Minutes | 2 | 4.1% |
| 10 to 14 Minutes | 4 | 8.2% |
| 15 to 19 Minutes | 6 | 12.2% |
| 20 to 24 Minutes | 16 | 32.7% |
| 25 to 29 Minutes | 3 | 6.1% |
| 30 to 34 Minutes | 1 | 2.0% |
| 35 to 39 Minutes | 7 | 14.3% |
| 40 to 44 Minutes | 7 | 14.3% |
| 45 to 59 Minutes | 3 | 6.1% |
| 60 to 89 Minutes | 0 | 0.0% |
| 90 or more Minutes | 0 | 0.0% |
Commute Time by Sex in Riverview Estates
The most common commute times in Riverview Estates are 20 to 24 minutes (13 commuters, 50.0%) for males and 35 to 39 minutes (5 commuters, 21.7%) for females.
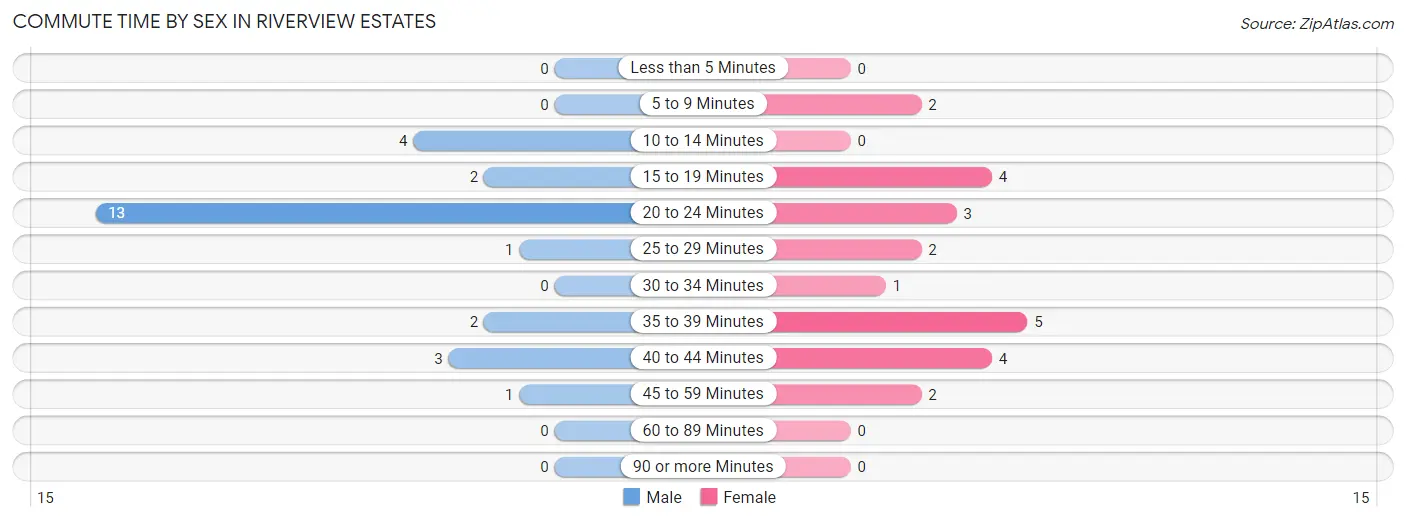
| Commute Time | Male | Female |
| Less than 5 Minutes | 0 (0.0%) | 0 (0.0%) |
| 5 to 9 Minutes | 0 (0.0%) | 2 (8.7%) |
| 10 to 14 Minutes | 4 (15.4%) | 0 (0.0%) |
| 15 to 19 Minutes | 2 (7.7%) | 4 (17.4%) |
| 20 to 24 Minutes | 13 (50.0%) | 3 (13.0%) |
| 25 to 29 Minutes | 1 (3.8%) | 2 (8.7%) |
| 30 to 34 Minutes | 0 (0.0%) | 1 (4.3%) |
| 35 to 39 Minutes | 2 (7.7%) | 5 (21.7%) |
| 40 to 44 Minutes | 3 (11.5%) | 4 (17.4%) |
| 45 to 59 Minutes | 1 (3.8%) | 2 (8.7%) |
| 60 to 89 Minutes | 0 (0.0%) | 0 (0.0%) |
| 90 or more Minutes | 0 (0.0%) | 0 (0.0%) |
Time of Departure to Work by Sex in Riverview Estates
The most frequent times of departure to work in Riverview Estates are 6:30 AM to 6:59 AM (9, 34.6%) for males and 5:30 AM to 5:59 AM (6, 26.1%) for females.
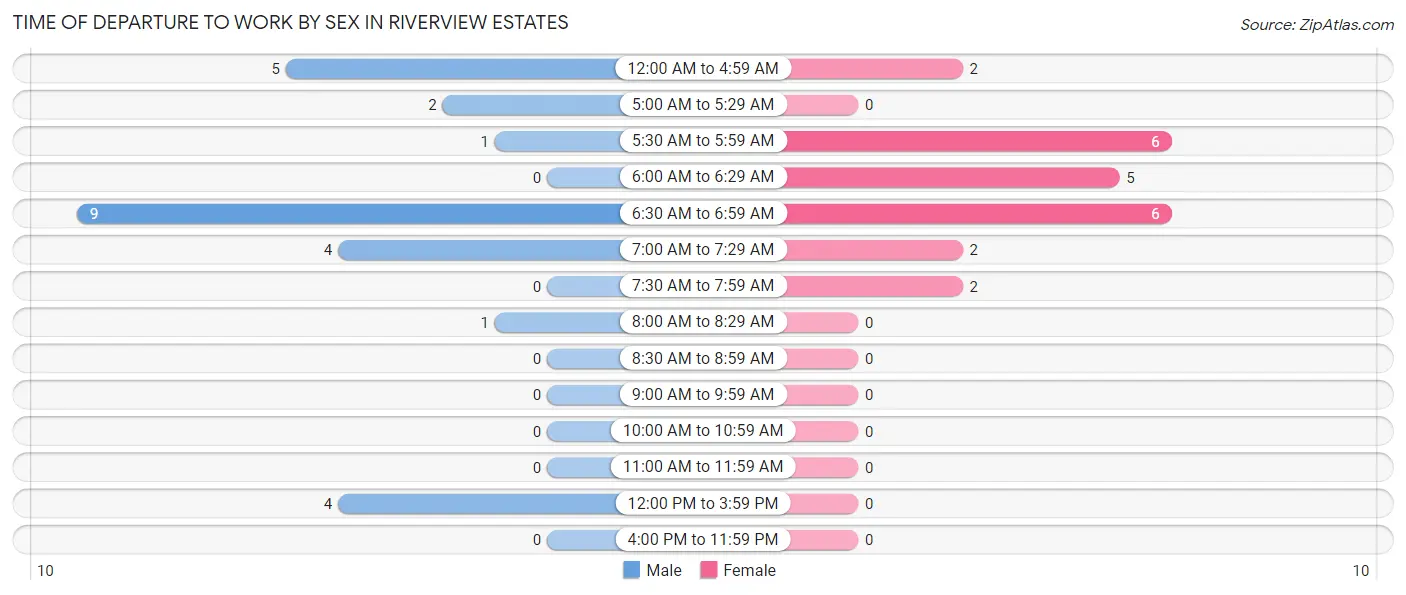
| Time of Departure | Male | Female |
| 12:00 AM to 4:59 AM | 5 (19.2%) | 2 (8.7%) |
| 5:00 AM to 5:29 AM | 2 (7.7%) | 0 (0.0%) |
| 5:30 AM to 5:59 AM | 1 (3.8%) | 6 (26.1%) |
| 6:00 AM to 6:29 AM | 0 (0.0%) | 5 (21.7%) |
| 6:30 AM to 6:59 AM | 9 (34.6%) | 6 (26.1%) |
| 7:00 AM to 7:29 AM | 4 (15.4%) | 2 (8.7%) |
| 7:30 AM to 7:59 AM | 0 (0.0%) | 2 (8.7%) |
| 8:00 AM to 8:29 AM | 1 (3.8%) | 0 (0.0%) |
| 8:30 AM to 8:59 AM | 0 (0.0%) | 0 (0.0%) |
| 9:00 AM to 9:59 AM | 0 (0.0%) | 0 (0.0%) |
| 10:00 AM to 10:59 AM | 0 (0.0%) | 0 (0.0%) |
| 11:00 AM to 11:59 AM | 0 (0.0%) | 0 (0.0%) |
| 12:00 PM to 3:59 PM | 4 (15.4%) | 0 (0.0%) |
| 4:00 PM to 11:59 PM | 0 (0.0%) | 0 (0.0%) |
| Total | 26 (100.0%) | 23 (100.0%) |
Housing Occupancy in Riverview Estates
Occupancy by Ownership in Riverview Estates
Of the total 31 dwellings in Riverview Estates, owner-occupied units account for 31 (100.0%), while renter-occupied units make up 0 (0.0%).
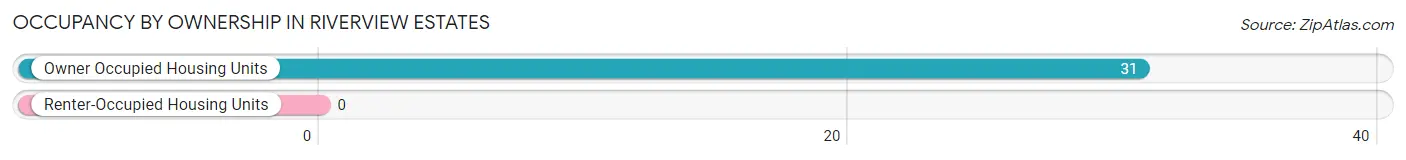
| Occupancy | # Housing Units | % Housing Units |
| Owner Occupied Housing Units | 31 | 100.0% |
| Renter-Occupied Housing Units | 0 | 0.0% |
| Total Occupied Housing Units | 31 | 100.0% |
Occupancy by Household Size in Riverview Estates
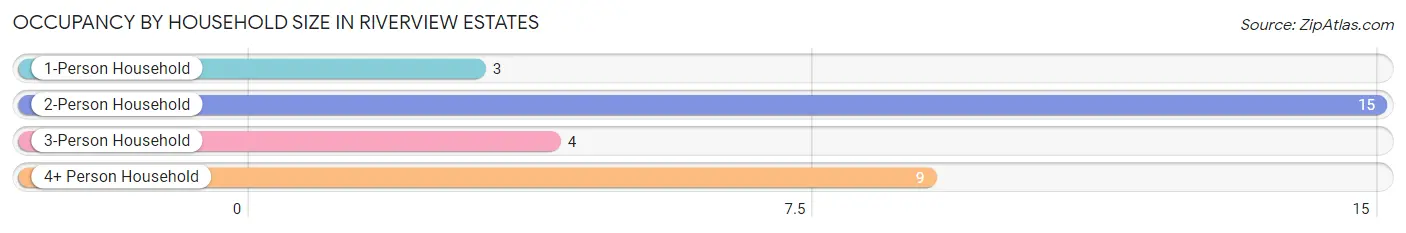
| Household Size | # Housing Units | % Housing Units |
| 1-Person Household | 3 | 9.7% |
| 2-Person Household | 15 | 48.4% |
| 3-Person Household | 4 | 12.9% |
| 4+ Person Household | 9 | 29.0% |
| Total Housing Units | 31 | 100.0% |
Occupancy by Ownership by Household Size in Riverview Estates
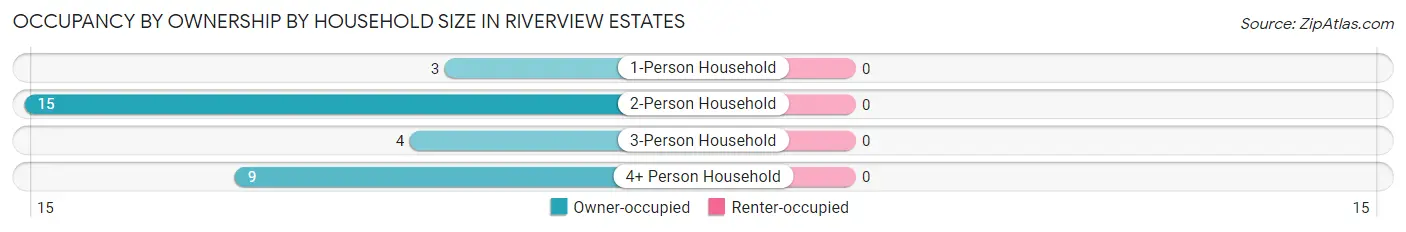
| Household Size | Owner-occupied | Renter-occupied |
| 1-Person Household | 3 (100.0%) | 0 (0.0%) |
| 2-Person Household | 15 (100.0%) | 0 (0.0%) |
| 3-Person Household | 4 (100.0%) | 0 (0.0%) |
| 4+ Person Household | 9 (100.0%) | 0 (0.0%) |
| Total Housing Units | 31 (100.0%) | 0 (0.0%) |
Occupancy by Educational Attainment in Riverview Estates
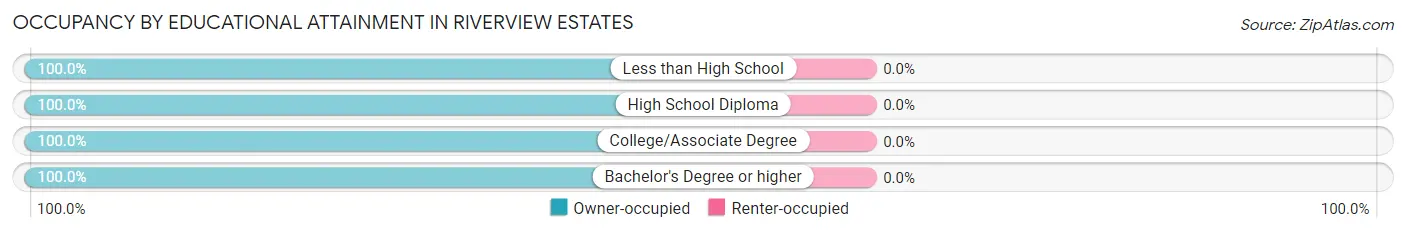
| Household Size | Owner-occupied | Renter-occupied |
| Less than High School | 3 (100.0%) | 0 (0.0%) |
| High School Diploma | 11 (100.0%) | 0 (0.0%) |
| College/Associate Degree | 5 (100.0%) | 0 (0.0%) |
| Bachelor's Degree or higher | 12 (100.0%) | 0 (0.0%) |
Occupancy by Age of Householder in Riverview Estates
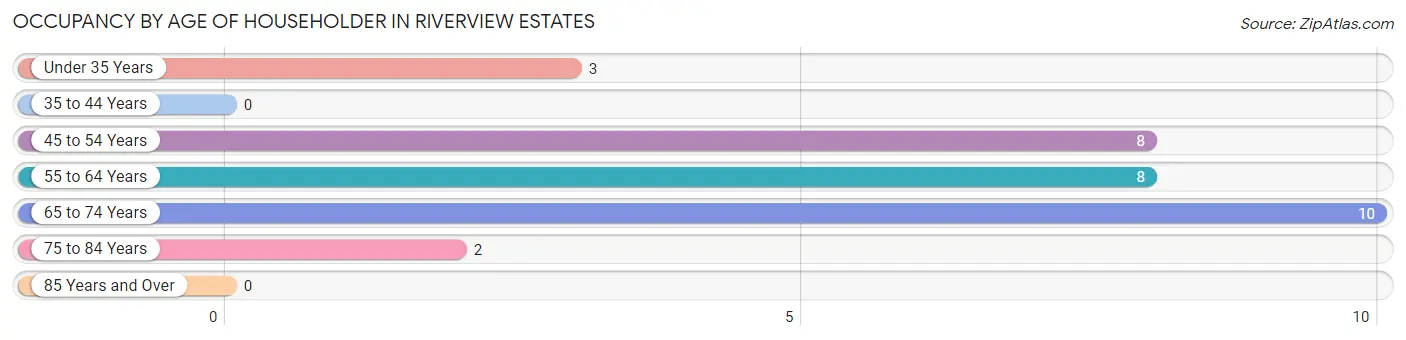
| Age Bracket | # Households | % Households |
| Under 35 Years | 3 | 9.7% |
| 35 to 44 Years | 0 | 0.0% |
| 45 to 54 Years | 8 | 25.8% |
| 55 to 64 Years | 8 | 25.8% |
| 65 to 74 Years | 10 | 32.3% |
| 75 to 84 Years | 2 | 6.5% |
| 85 Years and Over | 0 | 0.0% |
| Total | 31 | 100.0% |
Housing Finances in Riverview Estates
Median Income by Occupancy in Riverview Estates
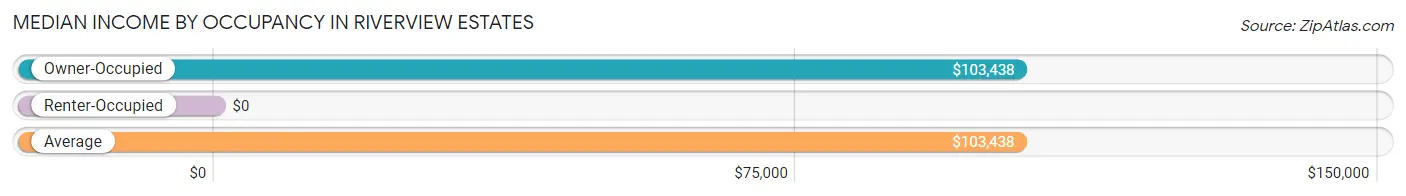
| Occupancy Type | # Households | Median Income |
| Owner-Occupied | 31 (100.0%) | $103,438 |
| Renter-Occupied | 0 (0.0%) | $0 |
| Average | 31 (100.0%) | $103,438 |
Occupancy by Householder Income Bracket in Riverview Estates
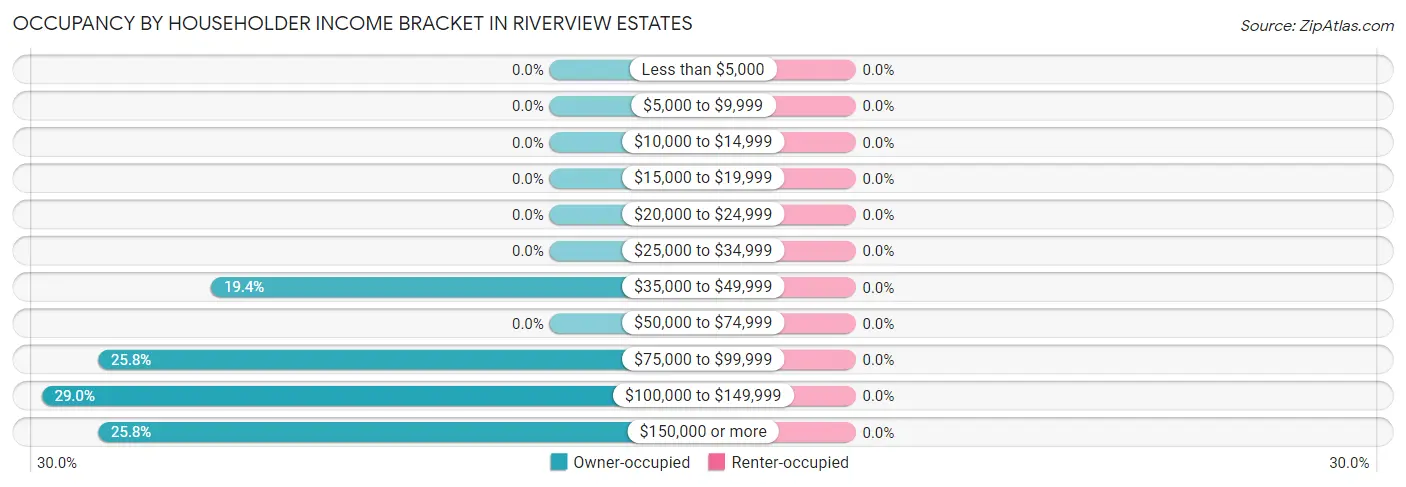
| Income Bracket | Owner-occupied | Renter-occupied |
| Less than $5,000 | 0 (0.0%) | 0 (0.0%) |
| $5,000 to $9,999 | 0 (0.0%) | 0 (0.0%) |
| $10,000 to $14,999 | 0 (0.0%) | 0 (0.0%) |
| $15,000 to $19,999 | 0 (0.0%) | 0 (0.0%) |
| $20,000 to $24,999 | 0 (0.0%) | 0 (0.0%) |
| $25,000 to $34,999 | 0 (0.0%) | 0 (0.0%) |
| $35,000 to $49,999 | 6 (19.4%) | 0 (0.0%) |
| $50,000 to $74,999 | 0 (0.0%) | 0 (0.0%) |
| $75,000 to $99,999 | 8 (25.8%) | 0 (0.0%) |
| $100,000 to $149,999 | 9 (29.0%) | 0 (0.0%) |
| $150,000 or more | 8 (25.8%) | 0 (0.0%) |
| Total | 31 (100.0%) | 0 (0.0%) |
Monthly Housing Cost Tiers in Riverview Estates
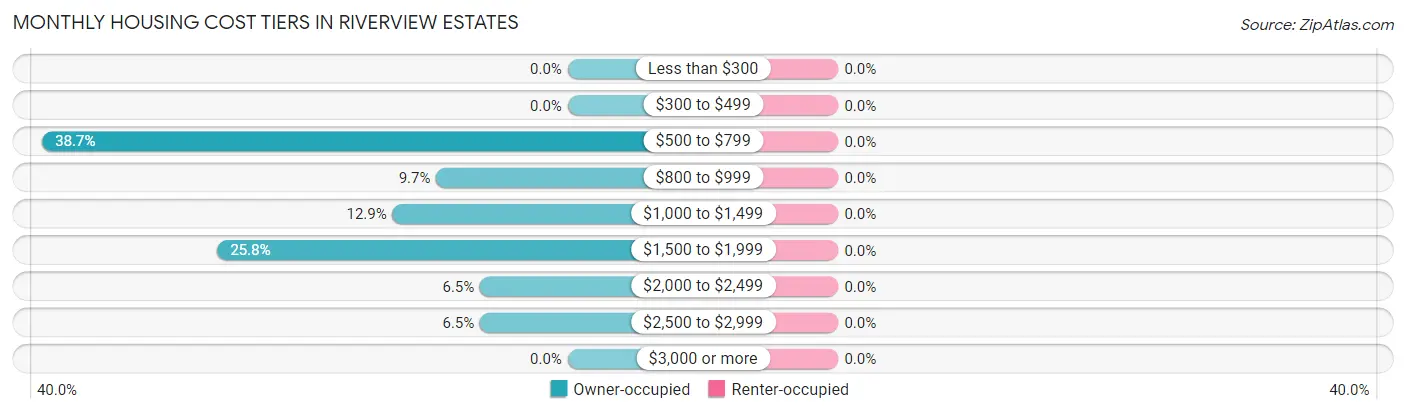
| Monthly Cost | Owner-occupied | Renter-occupied |
| Less than $300 | 0 (0.0%) | 0 (0.0%) |
| $300 to $499 | 0 (0.0%) | 0 (0.0%) |
| $500 to $799 | 12 (38.7%) | 0 (0.0%) |
| $800 to $999 | 3 (9.7%) | 0 (0.0%) |
| $1,000 to $1,499 | 4 (12.9%) | 0 (0.0%) |
| $1,500 to $1,999 | 8 (25.8%) | 0 (0.0%) |
| $2,000 to $2,499 | 2 (6.5%) | 0 (0.0%) |
| $2,500 to $2,999 | 2 (6.5%) | 0 (0.0%) |
| $3,000 or more | 0 (0.0%) | 0 (0.0%) |
| Total | 31 (100.0%) | 0 (0.0%) |
Physical Housing Characteristics in Riverview Estates
Housing Structures in Riverview Estates
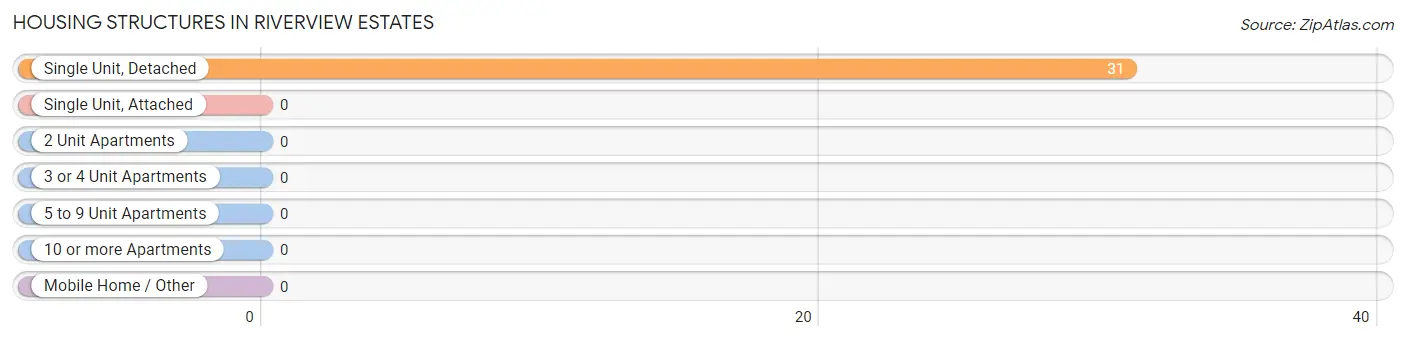
| Structure Type | # Housing Units | % Housing Units |
| Single Unit, Detached | 31 | 100.0% |
| Single Unit, Attached | 0 | 0.0% |
| 2 Unit Apartments | 0 | 0.0% |
| 3 or 4 Unit Apartments | 0 | 0.0% |
| 5 to 9 Unit Apartments | 0 | 0.0% |
| 10 or more Apartments | 0 | 0.0% |
| Mobile Home / Other | 0 | 0.0% |
| Total | 31 | 100.0% |
Housing Structures by Occupancy in Riverview Estates
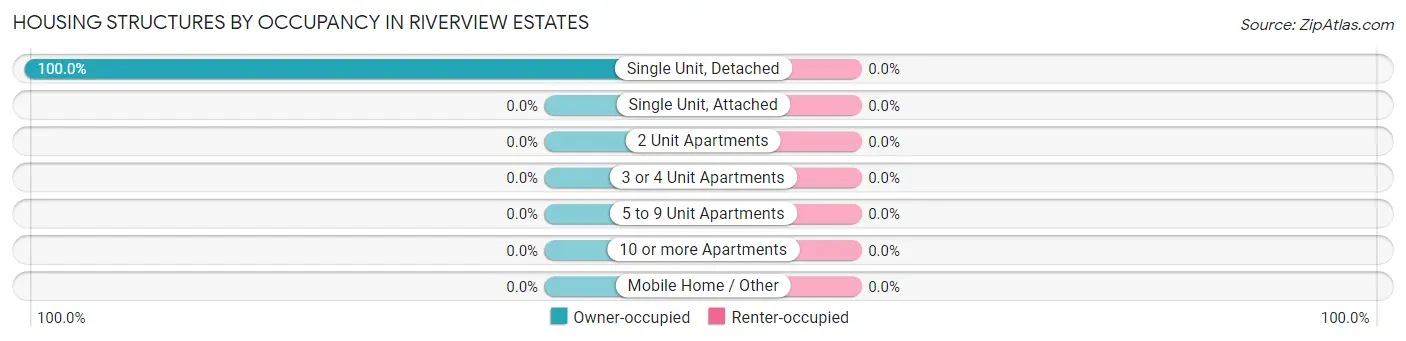
| Structure Type | Owner-occupied | Renter-occupied |
| Single Unit, Detached | 31 (100.0%) | 0 (0.0%) |
| Single Unit, Attached | 0 (0.0%) | 0 (0.0%) |
| 2 Unit Apartments | 0 (0.0%) | 0 (0.0%) |
| 3 or 4 Unit Apartments | 0 (0.0%) | 0 (0.0%) |
| 5 to 9 Unit Apartments | 0 (0.0%) | 0 (0.0%) |
| 10 or more Apartments | 0 (0.0%) | 0 (0.0%) |
| Mobile Home / Other | 0 (0.0%) | 0 (0.0%) |
| Total | 31 (100.0%) | 0 (0.0%) |
Housing Structures by Number of Rooms in Riverview Estates
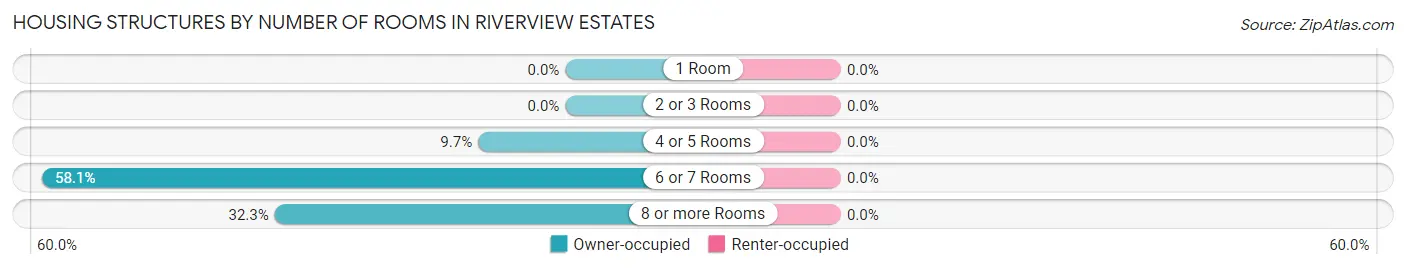
| Number of Rooms | Owner-occupied | Renter-occupied |
| 1 Room | 0 (0.0%) | 0 (0.0%) |
| 2 or 3 Rooms | 0 (0.0%) | 0 (0.0%) |
| 4 or 5 Rooms | 3 (9.7%) | 0 (0.0%) |
| 6 or 7 Rooms | 18 (58.1%) | 0 (0.0%) |
| 8 or more Rooms | 10 (32.3%) | 0 (0.0%) |
| Total | 31 (100.0%) | 0 (0.0%) |
Housing Structure by Heating Type in Riverview Estates
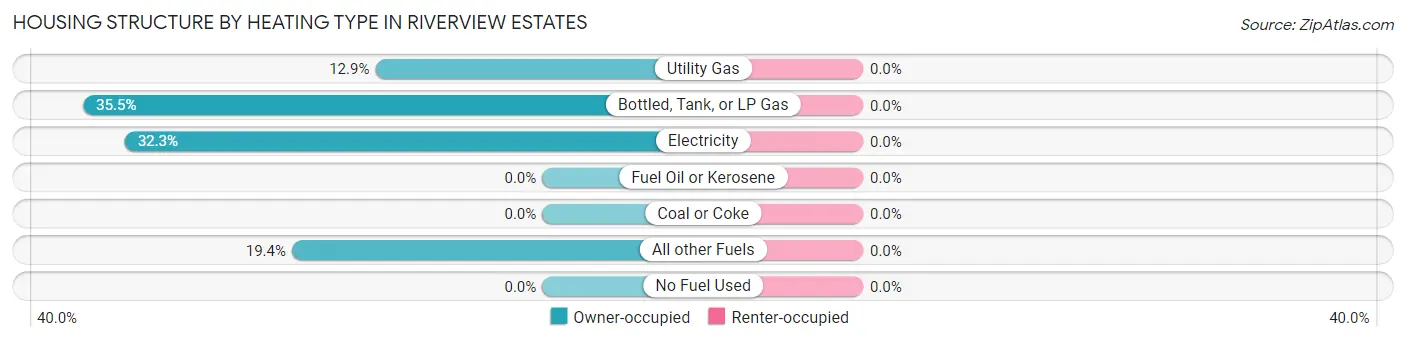
| Heating Type | Owner-occupied | Renter-occupied |
| Utility Gas | 4 (12.9%) | 0 (0.0%) |
| Bottled, Tank, or LP Gas | 11 (35.5%) | 0 (0.0%) |
| Electricity | 10 (32.3%) | 0 (0.0%) |
| Fuel Oil or Kerosene | 0 (0.0%) | 0 (0.0%) |
| Coal or Coke | 0 (0.0%) | 0 (0.0%) |
| All other Fuels | 6 (19.4%) | 0 (0.0%) |
| No Fuel Used | 0 (0.0%) | 0 (0.0%) |
| Total | 31 (100.0%) | 0 (0.0%) |
Household Vehicle Usage in Riverview Estates
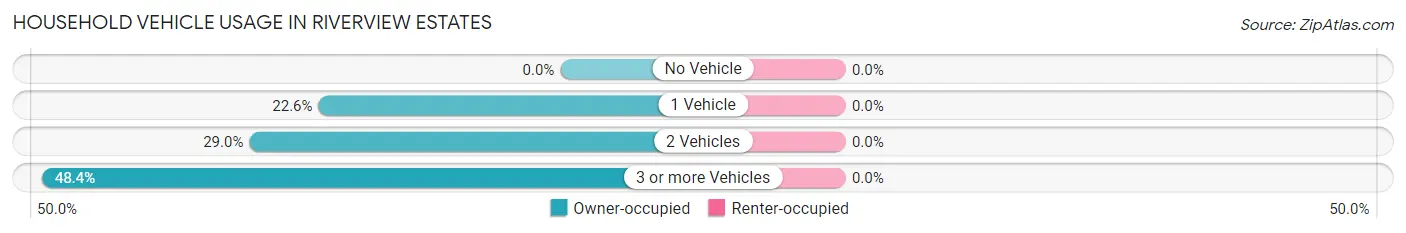
| Vehicles per Household | Owner-occupied | Renter-occupied |
| No Vehicle | 0 (0.0%) | 0 (0.0%) |
| 1 Vehicle | 7 (22.6%) | 0 (0.0%) |
| 2 Vehicles | 9 (29.0%) | 0 (0.0%) |
| 3 or more Vehicles | 15 (48.4%) | 0 (0.0%) |
| Total | 31 (100.0%) | 0 (0.0%) |
Real Estate & Mortgages in Riverview Estates
Real Estate and Mortgage Overview in Riverview Estates
| Characteristic | Without Mortgage | With Mortgage |
| Housing Units | 12 | 19 |
| Median Property Value | $325,000 | $290,600 |
| Median Household Income | $93,750 | $7 |
| Monthly Housing Costs | $740 | $0 |
| Real Estate Taxes | $2,857 | $0 |
Property Value by Mortgage Status in Riverview Estates
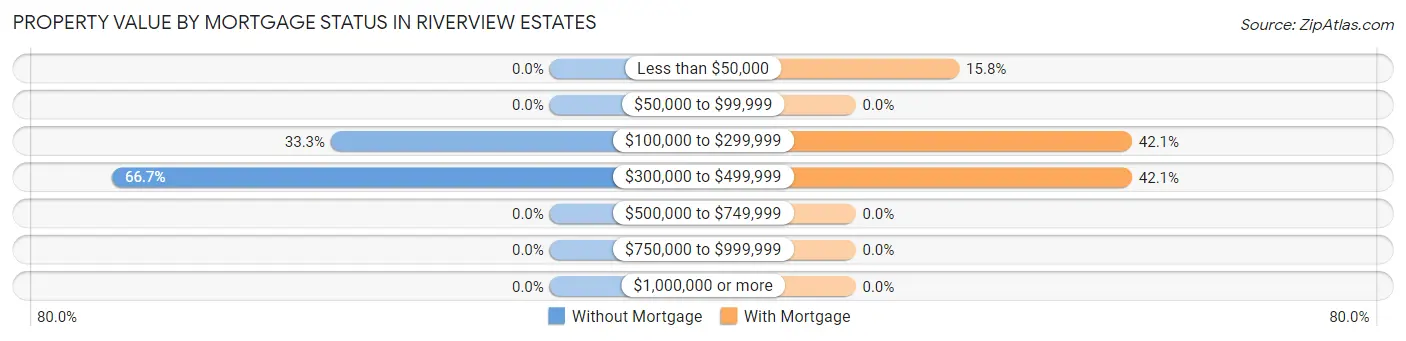
| Property Value | Without Mortgage | With Mortgage |
| Less than $50,000 | 0 (0.0%) | 3 (15.8%) |
| $50,000 to $99,999 | 0 (0.0%) | 0 (0.0%) |
| $100,000 to $299,999 | 4 (33.3%) | 8 (42.1%) |
| $300,000 to $499,999 | 8 (66.7%) | 8 (42.1%) |
| $500,000 to $749,999 | 0 (0.0%) | 0 (0.0%) |
| $750,000 to $999,999 | 0 (0.0%) | 0 (0.0%) |
| $1,000,000 or more | 0 (0.0%) | 0 (0.0%) |
| Total | 12 (100.0%) | 19 (100.0%) |
Household Income by Mortgage Status in Riverview Estates
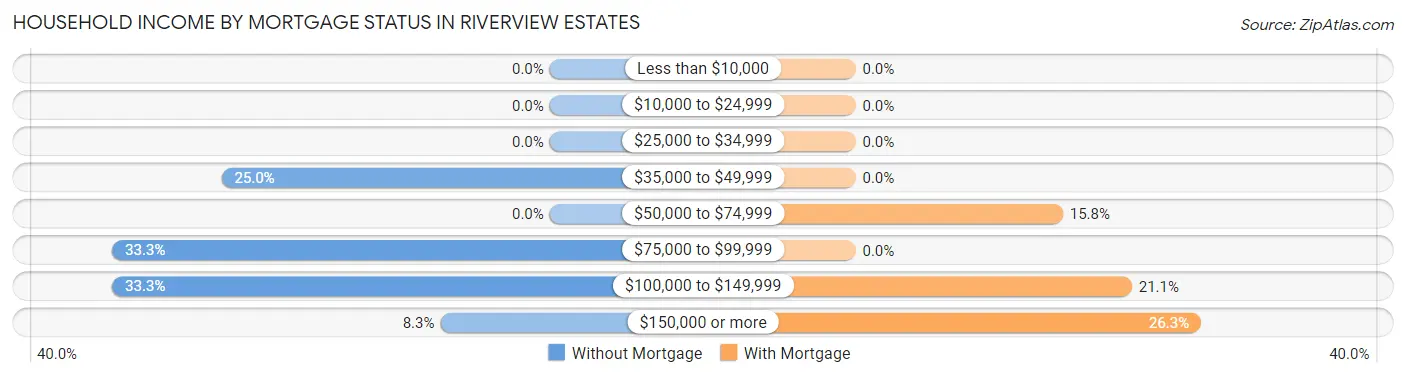
| Household Income | Without Mortgage | With Mortgage |
| Less than $10,000 | 0 (0.0%) | 0 (0.0%) |
| $10,000 to $24,999 | 0 (0.0%) | 0 (0.0%) |
| $25,000 to $34,999 | 0 (0.0%) | 0 (0.0%) |
| $35,000 to $49,999 | 3 (25.0%) | 0 (0.0%) |
| $50,000 to $74,999 | 0 (0.0%) | 3 (15.8%) |
| $75,000 to $99,999 | 4 (33.3%) | 0 (0.0%) |
| $100,000 to $149,999 | 4 (33.3%) | 4 (21.0%) |
| $150,000 or more | 1 (8.3%) | 5 (26.3%) |
| Total | 12 (100.0%) | 19 (100.0%) |
Property Value to Household Income Ratio in Riverview Estates
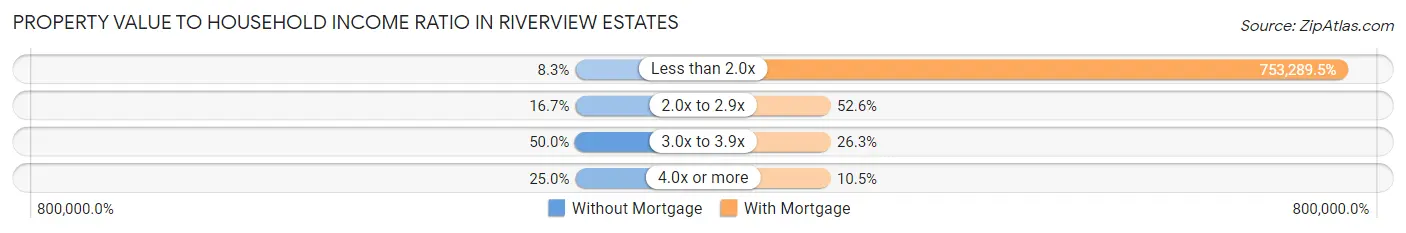
| Value-to-Income Ratio | Without Mortgage | With Mortgage |
| Less than 2.0x | 1 (8.3%) | 143,125 (753,289.5%) |
| 2.0x to 2.9x | 2 (16.7%) | 10 (52.6%) |
| 3.0x to 3.9x | 6 (50.0%) | 5 (26.3%) |
| 4.0x or more | 3 (25.0%) | 2 (10.5%) |
| Total | 12 (100.0%) | 19 (100.0%) |
Real Estate Taxes by Mortgage Status in Riverview Estates

| Property Taxes | Without Mortgage | With Mortgage |
| Less than $800 | 0 (0.0%) | 0 (0.0%) |
| $800 to $1,499 | 0 (0.0%) | 4 (21.0%) |
| $800 to $1,499 | 12 (100.0%) | 3 (15.8%) |
| Total | 12 (100.0%) | 19 (100.0%) |
Health & Disability in Riverview Estates
Health Insurance Coverage by Age in Riverview Estates
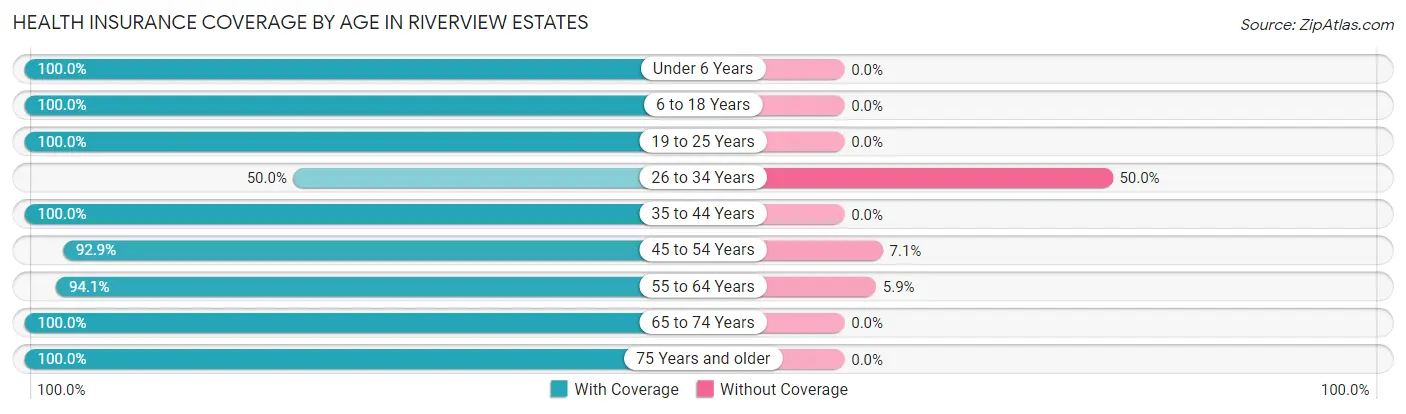
| Age Bracket | With Coverage | Without Coverage |
| Under 6 Years | 2 (100.0%) | 0 (0.0%) |
| 6 to 18 Years | 12 (100.0%) | 0 (0.0%) |
| 19 to 25 Years | 15 (100.0%) | 0 (0.0%) |
| 26 to 34 Years | 6 (50.0%) | 6 (50.0%) |
| 35 to 44 Years | 2 (100.0%) | 0 (0.0%) |
| 45 to 54 Years | 13 (92.9%) | 1 (7.1%) |
| 55 to 64 Years | 16 (94.1%) | 1 (5.9%) |
| 65 to 74 Years | 13 (100.0%) | 0 (0.0%) |
| 75 Years and older | 2 (100.0%) | 0 (0.0%) |
| Total | 81 (91.0%) | 8 (9.0%) |
Health Insurance Coverage by Citizenship Status in Riverview Estates

| Citizenship Status | With Coverage | Without Coverage |
| Native Born | 2 (100.0%) | 0 (0.0%) |
| Foreign Born, Citizen | 12 (100.0%) | 0 (0.0%) |
| Foreign Born, not a Citizen | 15 (100.0%) | 0 (0.0%) |
Health Insurance Coverage by Household Income in Riverview Estates
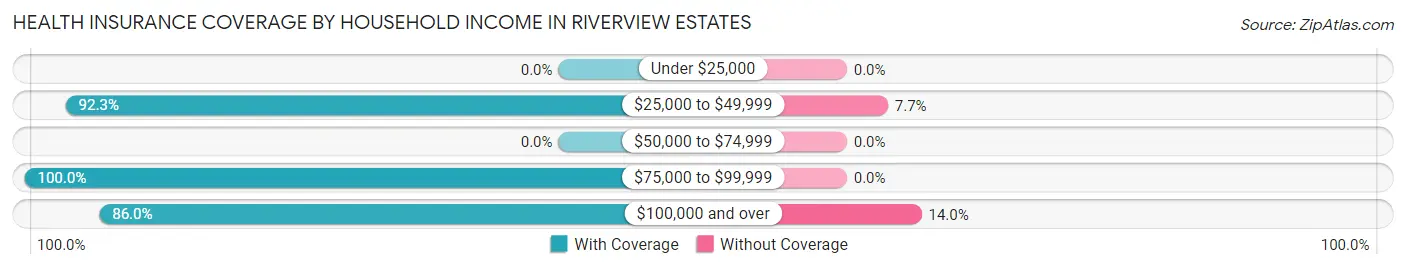
| Household Income | With Coverage | Without Coverage |
| Under $25,000 | 0 (0.0%) | 0 (0.0%) |
| $25,000 to $49,999 | 12 (92.3%) | 1 (7.7%) |
| $50,000 to $74,999 | 0 (0.0%) | 0 (0.0%) |
| $75,000 to $99,999 | 26 (100.0%) | 0 (0.0%) |
| $100,000 and over | 43 (86.0%) | 7 (14.0%) |
Public vs Private Health Insurance Coverage by Age in Riverview Estates
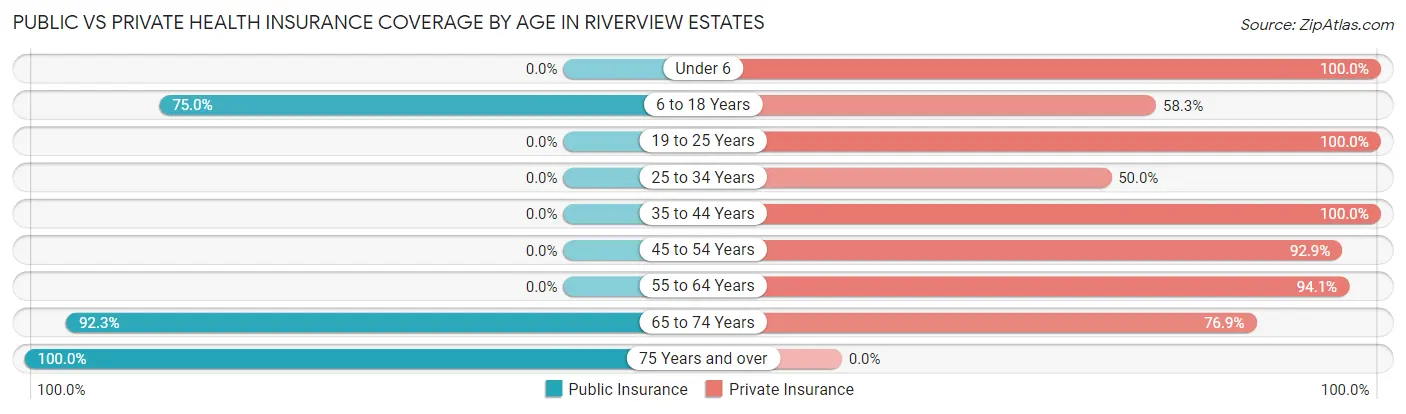
| Age Bracket | Public Insurance | Private Insurance |
| Under 6 | 0 (0.0%) | 2 (100.0%) |
| 6 to 18 Years | 9 (75.0%) | 7 (58.3%) |
| 19 to 25 Years | 0 (0.0%) | 15 (100.0%) |
| 25 to 34 Years | 0 (0.0%) | 6 (50.0%) |
| 35 to 44 Years | 0 (0.0%) | 2 (100.0%) |
| 45 to 54 Years | 0 (0.0%) | 13 (92.9%) |
| 55 to 64 Years | 0 (0.0%) | 16 (94.1%) |
| 65 to 74 Years | 12 (92.3%) | 10 (76.9%) |
| 75 Years and over | 2 (100.0%) | 0 (0.0%) |
| Total | 23 (25.8%) | 71 (79.8%) |
Disability Status by Sex by Age in Riverview Estates
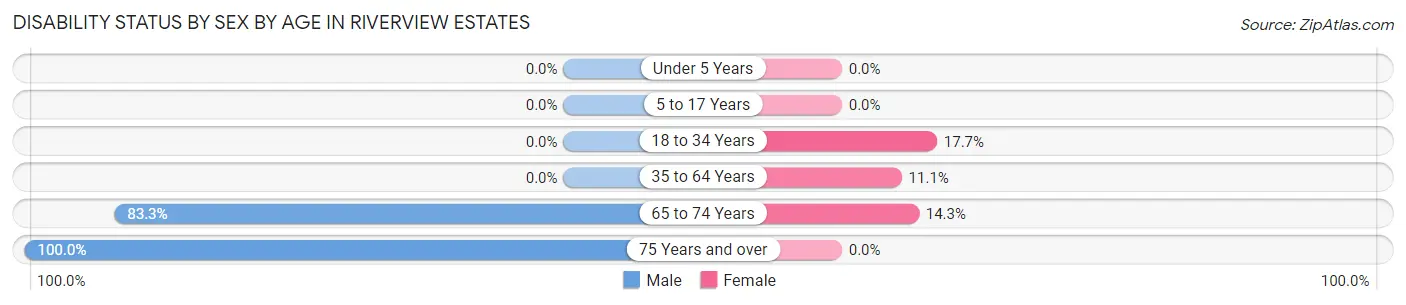
| Age Bracket | Male | Female |
| Under 5 Years | 0 (0.0%) | 0 (0.0%) |
| 5 to 17 Years | 0 (0.0%) | 0 (0.0%) |
| 18 to 34 Years | 0 (0.0%) | 3 (17.6%) |
| 35 to 64 Years | 0 (0.0%) | 2 (11.1%) |
| 65 to 74 Years | 5 (83.3%) | 1 (14.3%) |
| 75 Years and over | 2 (100.0%) | 0 (0.0%) |
Disability Class by Sex by Age in Riverview Estates
Disability Class: Hearing Difficulty
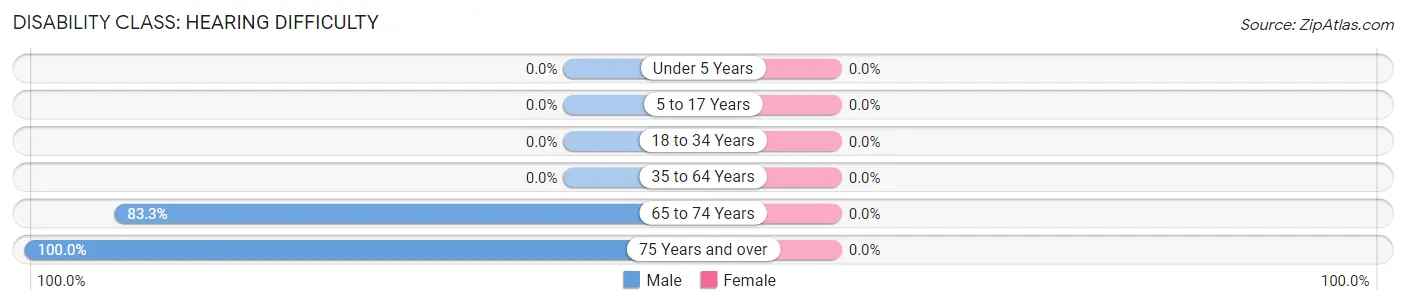
| Age Bracket | Male | Female |
| Under 5 Years | 0 (0.0%) | 0 (0.0%) |
| 5 to 17 Years | 0 (0.0%) | 0 (0.0%) |
| 18 to 34 Years | 0 (0.0%) | 0 (0.0%) |
| 35 to 64 Years | 0 (0.0%) | 0 (0.0%) |
| 65 to 74 Years | 5 (83.3%) | 0 (0.0%) |
| 75 Years and over | 2 (100.0%) | 0 (0.0%) |
Disability Class: Vision Difficulty
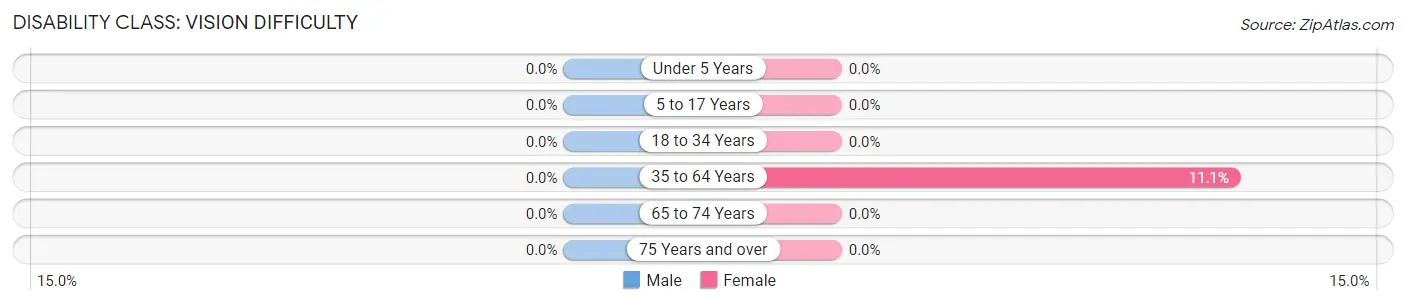
| Age Bracket | Male | Female |
| Under 5 Years | 0 (0.0%) | 0 (0.0%) |
| 5 to 17 Years | 0 (0.0%) | 0 (0.0%) |
| 18 to 34 Years | 0 (0.0%) | 0 (0.0%) |
| 35 to 64 Years | 0 (0.0%) | 2 (11.1%) |
| 65 to 74 Years | 0 (0.0%) | 0 (0.0%) |
| 75 Years and over | 0 (0.0%) | 0 (0.0%) |
Disability Class: Cognitive Difficulty
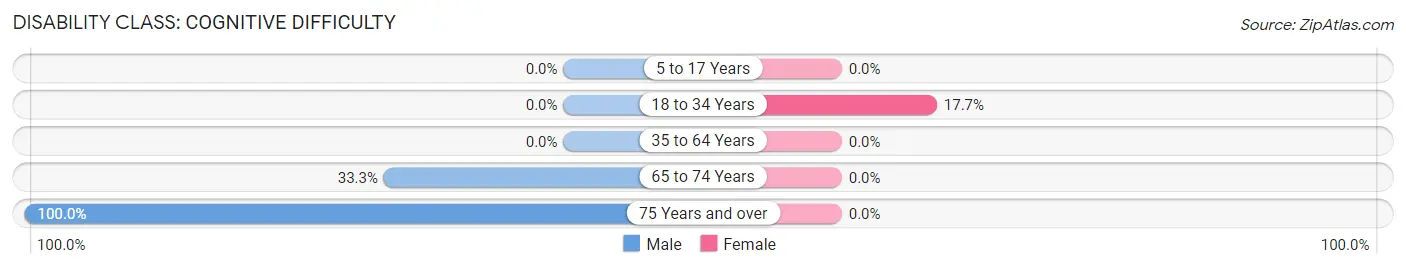
| Age Bracket | Male | Female |
| 5 to 17 Years | 0 (0.0%) | 0 (0.0%) |
| 18 to 34 Years | 0 (0.0%) | 3 (17.6%) |
| 35 to 64 Years | 0 (0.0%) | 0 (0.0%) |
| 65 to 74 Years | 2 (33.3%) | 0 (0.0%) |
| 75 Years and over | 2 (100.0%) | 0 (0.0%) |
Disability Class: Ambulatory Difficulty
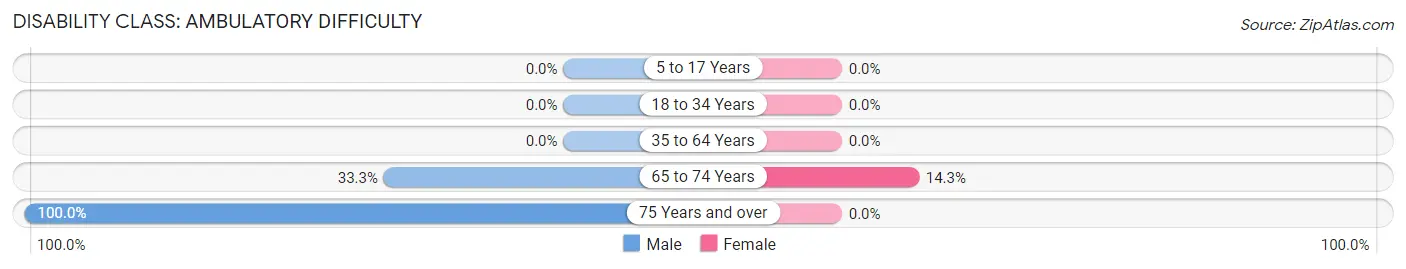
| Age Bracket | Male | Female |
| 5 to 17 Years | 0 (0.0%) | 0 (0.0%) |
| 18 to 34 Years | 0 (0.0%) | 0 (0.0%) |
| 35 to 64 Years | 0 (0.0%) | 0 (0.0%) |
| 65 to 74 Years | 2 (33.3%) | 1 (14.3%) |
| 75 Years and over | 2 (100.0%) | 0 (0.0%) |
Disability Class: Self-Care Difficulty

| Age Bracket | Male | Female |
| 5 to 17 Years | 0 (0.0%) | 0 (0.0%) |
| 18 to 34 Years | 0 (0.0%) | 0 (0.0%) |
| 35 to 64 Years | 0 (0.0%) | 0 (0.0%) |
| 65 to 74 Years | 2 (33.3%) | 0 (0.0%) |
| 75 Years and over | 2 (100.0%) | 0 (0.0%) |
Technology Access in Riverview Estates
Computing Device Access in Riverview Estates
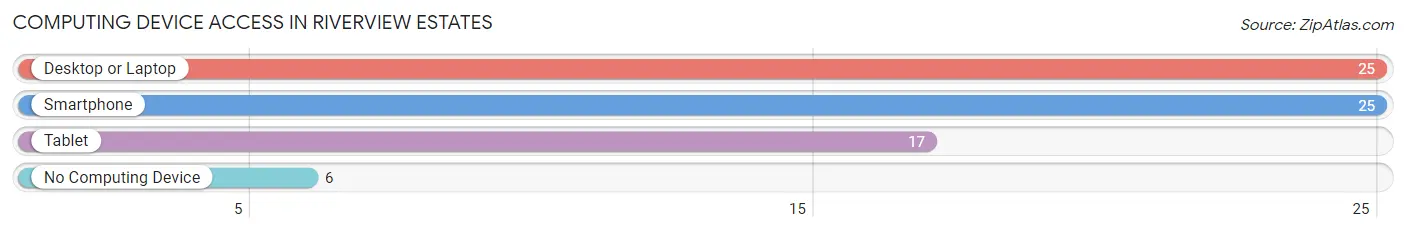
| Device Type | # Households | % Households |
| Desktop or Laptop | 25 | 80.6% |
| Smartphone | 25 | 80.6% |
| Tablet | 17 | 54.8% |
| No Computing Device | 6 | 19.4% |
| Total | 31 | 100.0% |
Internet Access in Riverview Estates
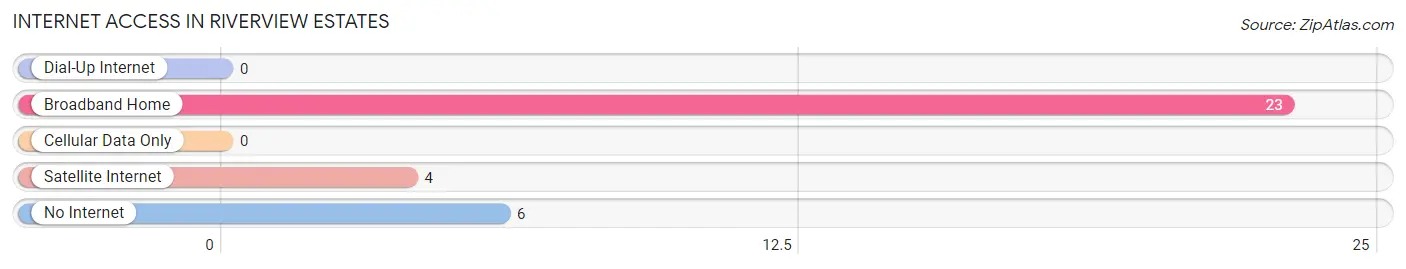
| Internet Type | # Households | % Households |
| Dial-Up Internet | 0 | 0.0% |
| Broadband Home | 23 | 74.2% |
| Cellular Data Only | 0 | 0.0% |
| Satellite Internet | 4 | 12.9% |
| No Internet | 6 | 19.4% |
| Total | 31 | 100.0% |
Riverview Estates Summary
Riverview Estates is a small, unincorporated community located in St. Louis County, Missouri. It is situated on the banks of the Missouri River, just north of the city of St. Louis. The community is home to approximately 1,000 people, and is known for its rural charm and close-knit community.
Geography
Riverview Estates is located in St. Louis County, Missouri, just north of the city of St. Louis. It is situated on the banks of the Missouri River, and is bordered by the towns of Florissant, Hazelwood, and Bridgeton. The community is located in the northern part of the county, and is approximately 15 miles from downtown St. Louis. The area is mostly flat, with some rolling hills and wooded areas.
Economy
The economy of Riverview Estates is largely based on agriculture and small businesses. The community is home to several small farms, which produce a variety of crops, including corn, soybeans, and wheat. There are also several small businesses in the area, including a grocery store, a hardware store, and a few restaurants. The community also has a few small manufacturing companies, which produce a variety of products, including furniture and clothing.
Demographics
As of the 2010 census, the population of Riverview Estates was 1,000 people. The racial makeup of the community was 97.2% White, 0.7% African American, 0.3% Native American, 0.3% Asian, and 1.5% from other races. The median household income was $45,000, and the median age was 40 years.
History
Riverview Estates was founded in the early 1800s by a group of settlers from Kentucky. The community was originally known as “Riverview”, and was a small farming community. In the late 1800s, the community began to grow, and several businesses were established. In the early 1900s, the community was renamed “Riverview Estates”, and the population began to grow rapidly. The community continued to grow throughout the 20th century, and today it is a thriving community with a close-knit population.
Common Questions
What is Per Capita Income in Riverview Estates?
Per Capita income in Riverview Estates is $45,247.
What is the Median Family Income in Riverview Estates?
Median Family Income in Riverview Estates is $103,750.
What is the Median Household income in Riverview Estates?
Median Household Income in Riverview Estates is $103,438.
What is Income or Wage Gap in Riverview Estates?
Income or Wage Gap in Riverview Estates is 67.5%.
Women in Riverview Estates earn 32.5 cents for every dollar earned by a man.
What is Inequality or Gini Index in Riverview Estates?
Inequality or Gini Index in Riverview Estates is 0.32.
What is the Total Population of Riverview Estates?
Total Population of Riverview Estates is 89.
What is the Total Male Population of Riverview Estates?
Total Male Population of Riverview Estates is 42.
What is the Total Female Population of Riverview Estates?
Total Female Population of Riverview Estates is 47.
What is the Ratio of Males per 100 Females in Riverview Estates?
There are 89.36 Males per 100 Females in Riverview Estates.
What is the Ratio of Females per 100 Males in Riverview Estates?
There are 111.90 Females per 100 Males in Riverview Estates.
What is the Median Population Age in Riverview Estates?
Median Population Age in Riverview Estates is 46.8 Years.
What is the Average Family Size in Riverview Estates
Average Family Size in Riverview Estates is 2.9 People.
What is the Average Household Size in Riverview Estates
Average Household Size in Riverview Estates is 2.9 People.
How Large is the Labor Force in Riverview Estates?
There are 57 People in the Labor Forcein in Riverview Estates.
What is the Percentage of People in the Labor Force in Riverview Estates?
69.5% of People are in the Labor Force in Riverview Estates.
What is the Unemployment Rate in Riverview Estates?
Unemployment Rate in Riverview Estates is 1.8%.