Flint Hill, MO Map & Demographics
Flint Hill Map
Flint Hill Overview
$49,609
PER CAPITA INCOME
$78,214
AVG FAMILY INCOME
$82,837
AVG HOUSEHOLD INCOME
30.1%
WAGE / INCOME GAP [ % ]
69.9¢/ $1
WAGE / INCOME GAP [ $ ]
0.44
INEQUALITY / GINI INDEX
1,041
TOTAL POPULATION
535
MALE POPULATION
506
FEMALE POPULATION
105.73
MALES / 100 FEMALES
94.58
FEMALES / 100 MALES
47.4
MEDIAN AGE
2.4
AVG FAMILY SIZE
2.3
AVG HOUSEHOLD SIZE
517
LABOR FORCE [ PEOPLE ]
59.8%
PERCENT IN LABOR FORCE
1.0%
UNEMPLOYMENT RATE
Income in Flint Hill
Income Overview in Flint Hill
Per Capita Income in Flint Hill is $49,609, while median incomes of families and households are $78,214 and $82,837 respectively.
| Characteristic | Number | Measure |
| Per Capita Income | 1,041 | $49,609 |
| Median Family Income | 404 | $78,214 |
| Mean Family Income | 404 | $110,323 |
| Median Household Income | 453 | $82,837 |
| Mean Household Income | 453 | $116,177 |
| Income Deficit | 404 | $0 |
| Wage / Income Gap (%) | 1,041 | 30.11% |
| Wage / Income Gap ($) | 1,041 | 69.89¢ per $1 |
| Gini / Inequality Index | 1,041 | 0.44 |
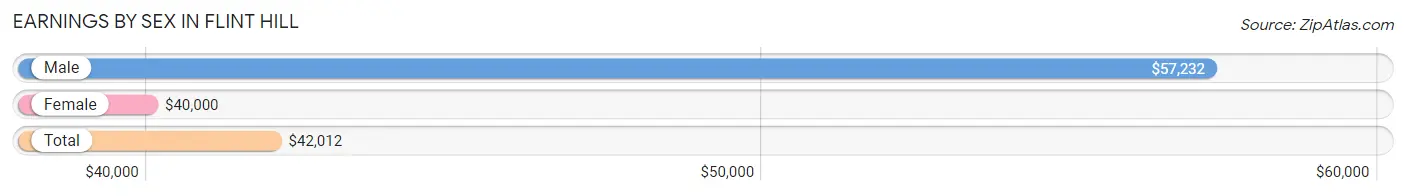
Earnings by Sex in Flint Hill
Average Earnings in Flint Hill are $42,012, $57,232 for men and $40,000 for women, a difference of 30.1%.
| Sex | Number | Average Earnings |
| Male | 239 (44.3%) | $57,232 |
| Female | 300 (55.7%) | $40,000 |
| Total | 539 (100.0%) | $42,012 |
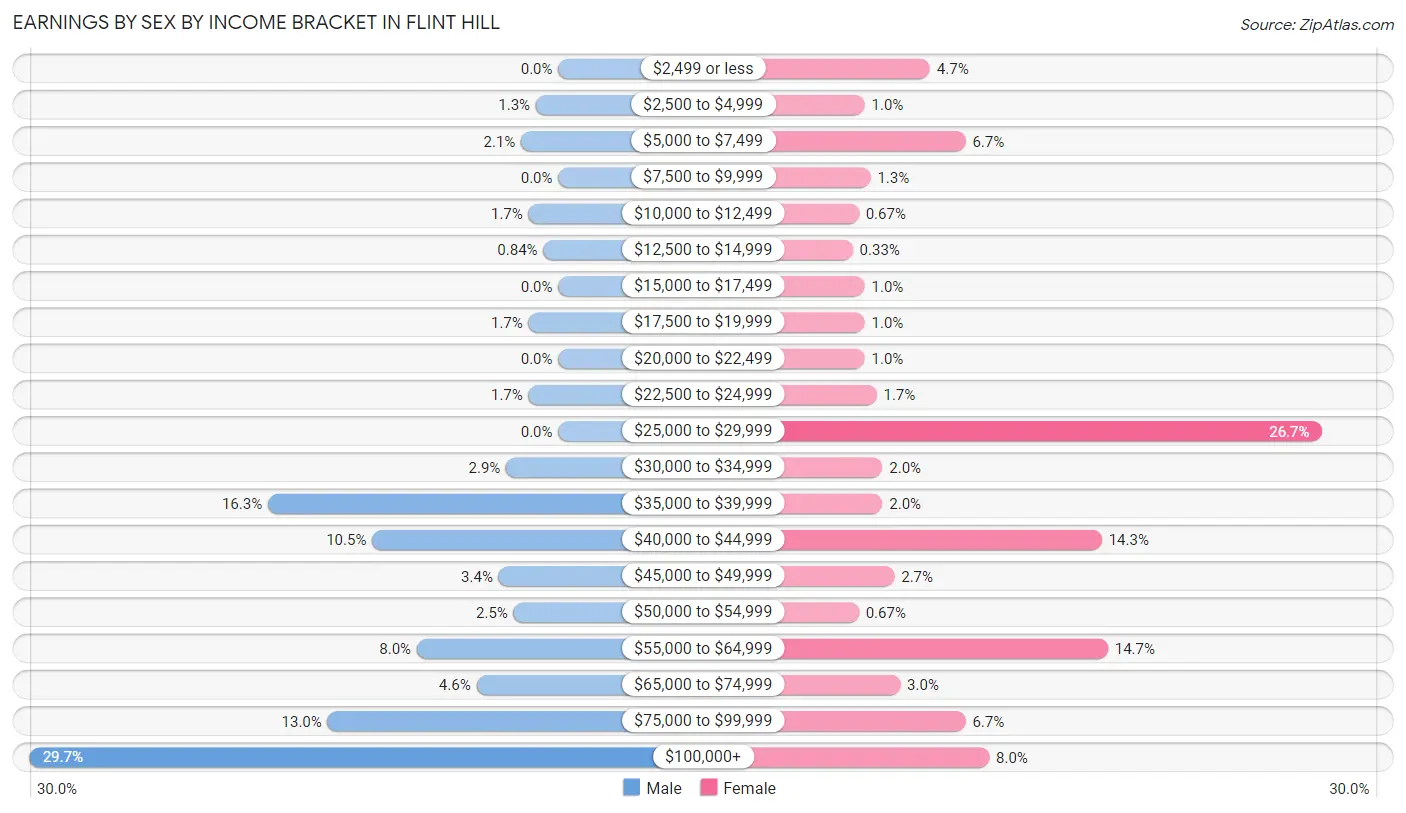
Earnings by Sex by Income Bracket in Flint Hill
The most common earnings brackets in Flint Hill are $100,000+ for men (71 | 29.7%) and $25,000 to $29,999 for women (80 | 26.7%).
| Income | Male | Female |
| $2,499 or less | 0 (0.0%) | 14 (4.7%) |
| $2,500 to $4,999 | 3 (1.3%) | 3 (1.0%) |
| $5,000 to $7,499 | 5 (2.1%) | 20 (6.7%) |
| $7,500 to $9,999 | 0 (0.0%) | 4 (1.3%) |
| $10,000 to $12,499 | 4 (1.7%) | 2 (0.7%) |
| $12,500 to $14,999 | 2 (0.8%) | 1 (0.3%) |
| $15,000 to $17,499 | 0 (0.0%) | 3 (1.0%) |
| $17,500 to $19,999 | 4 (1.7%) | 3 (1.0%) |
| $20,000 to $22,499 | 0 (0.0%) | 3 (1.0%) |
| $22,500 to $24,999 | 4 (1.7%) | 5 (1.7%) |
| $25,000 to $29,999 | 0 (0.0%) | 80 (26.7%) |
| $30,000 to $34,999 | 7 (2.9%) | 6 (2.0%) |
| $35,000 to $39,999 | 39 (16.3%) | 6 (2.0%) |
| $40,000 to $44,999 | 25 (10.5%) | 43 (14.3%) |
| $45,000 to $49,999 | 8 (3.4%) | 8 (2.7%) |
| $50,000 to $54,999 | 6 (2.5%) | 2 (0.7%) |
| $55,000 to $64,999 | 19 (8.0%) | 44 (14.7%) |
| $65,000 to $74,999 | 11 (4.6%) | 9 (3.0%) |
| $75,000 to $99,999 | 31 (13.0%) | 20 (6.7%) |
| $100,000+ | 71 (29.7%) | 24 (8.0%) |
| Total | 239 (100.0%) | 300 (100.0%) |
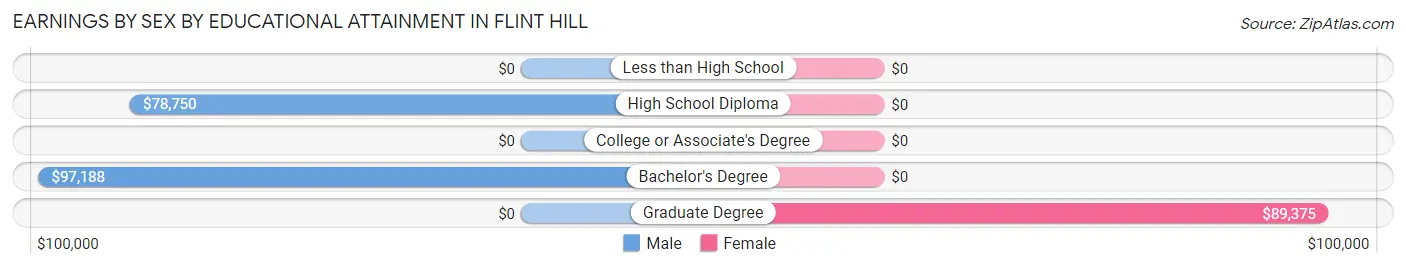
Earnings by Sex by Educational Attainment in Flint Hill
Average earnings in Flint Hill are $74,583 for men and $35,000 for women, a difference of 53.1%. Men with an educational attainment of bachelor's degree enjoy the highest average annual earnings of $97,188, while those with high school diploma education earn the least with $78,750. Women with an educational attainment of graduate degree earn the most with the average annual earnings of $89,375, while those with graduate degree education have the smallest earnings of $89,375.
| Educational Attainment | Male Income | Female Income |
| Less than High School | - | - |
| High School Diploma | $78,750 | $0 |
| College or Associate's Degree | - | - |
| Bachelor's Degree | $97,188 | $0 |
| Graduate Degree | - | - |
| Total | $74,583 | $35,000 |
Family Income in Flint Hill
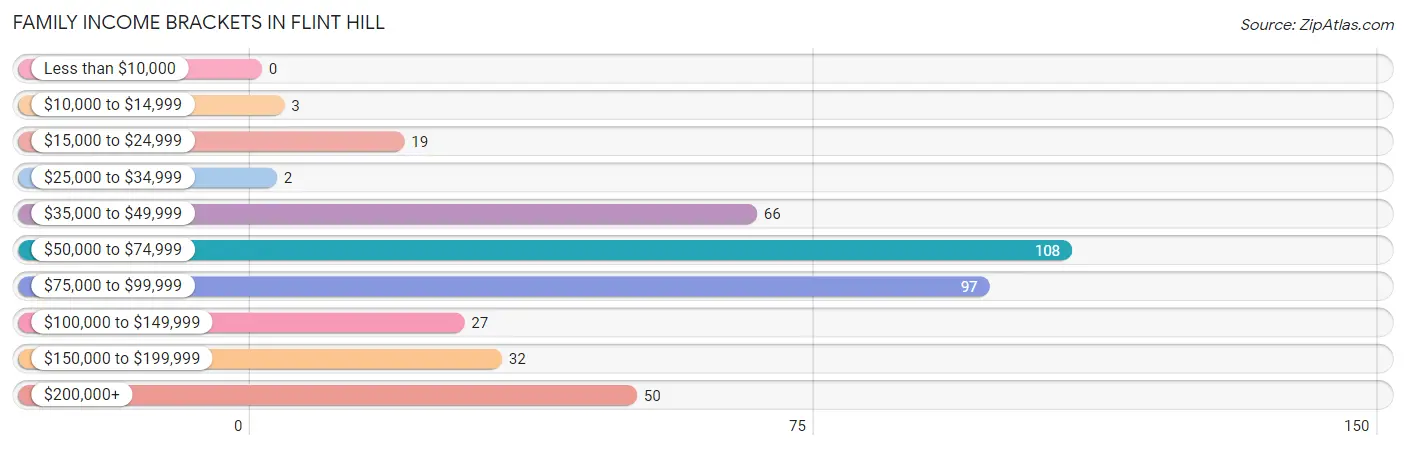
Family Income Brackets in Flint Hill
According to the Flint Hill family income data, there are 108 families falling into the $50,000 to $74,999 income range, which is the most common income bracket and makes up 26.7% of all families.
| Income Bracket | # Families | % Families |
| Less than $10,000 | 0 | 0.0% |
| $10,000 to $14,999 | 3 | 0.7% |
| $15,000 to $24,999 | 19 | 4.7% |
| $25,000 to $34,999 | 2 | 0.5% |
| $35,000 to $49,999 | 66 | 16.3% |
| $50,000 to $74,999 | 108 | 26.7% |
| $75,000 to $99,999 | 97 | 24.0% |
| $100,000 to $149,999 | 27 | 6.7% |
| $150,000 to $199,999 | 32 | 7.9% |
| $200,000+ | 50 | 12.4% |
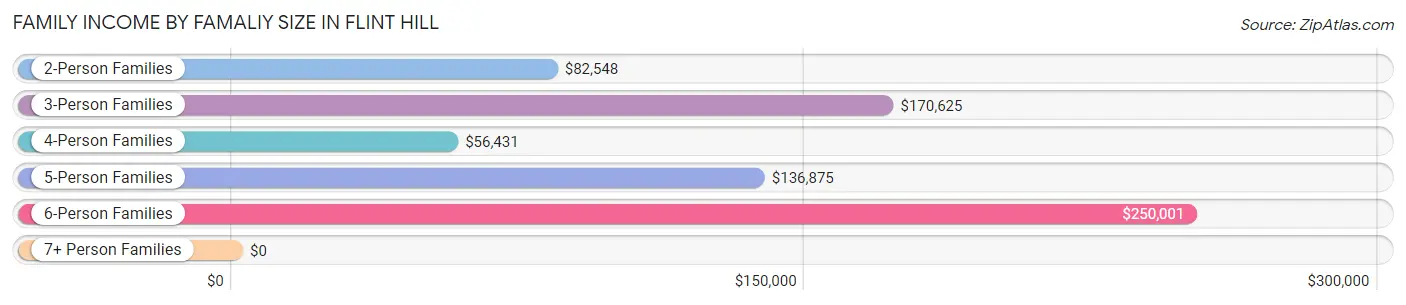
Family Income by Famaliy Size in Flint Hill
6-person families (10 | 2.5%) account for the highest median family income in Flint Hill with $250,001 per family, while 3-person families (37 | 9.2%) have the highest median income of $56,875 per family member.
| Income Bracket | # Families | Median Income |
| 2-Person Families | 253 (62.6%) | $82,548 |
| 3-Person Families | 37 (9.2%) | $170,625 |
| 4-Person Families | 91 (22.5%) | $56,431 |
| 5-Person Families | 13 (3.2%) | $136,875 |
| 6-Person Families | 10 (2.5%) | $250,001 |
| 7+ Person Families | 0 (0.0%) | $0 |
| Total | 404 (100.0%) | $78,214 |
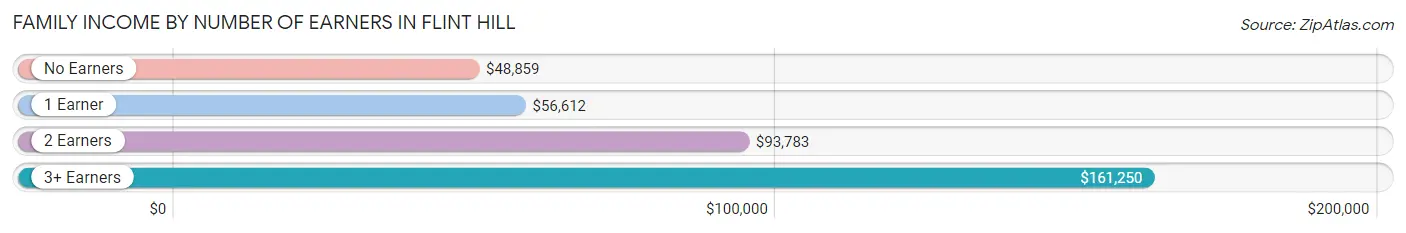
Family Income by Number of Earners in Flint Hill
The median family income in Flint Hill is $78,214, with families comprising 3+ earners (27) having the highest median family income of $161,250, while families with no earners (104) have the lowest median family income of $48,859, accounting for 6.7% and 25.7% of families, respectively.
| Number of Earners | # Families | Median Income |
| No Earners | 104 (25.7%) | $48,859 |
| 1 Earner | 130 (32.2%) | $56,612 |
| 2 Earners | 143 (35.4%) | $93,783 |
| 3+ Earners | 27 (6.7%) | $161,250 |
| Total | 404 (100.0%) | $78,214 |
Household Income in Flint Hill
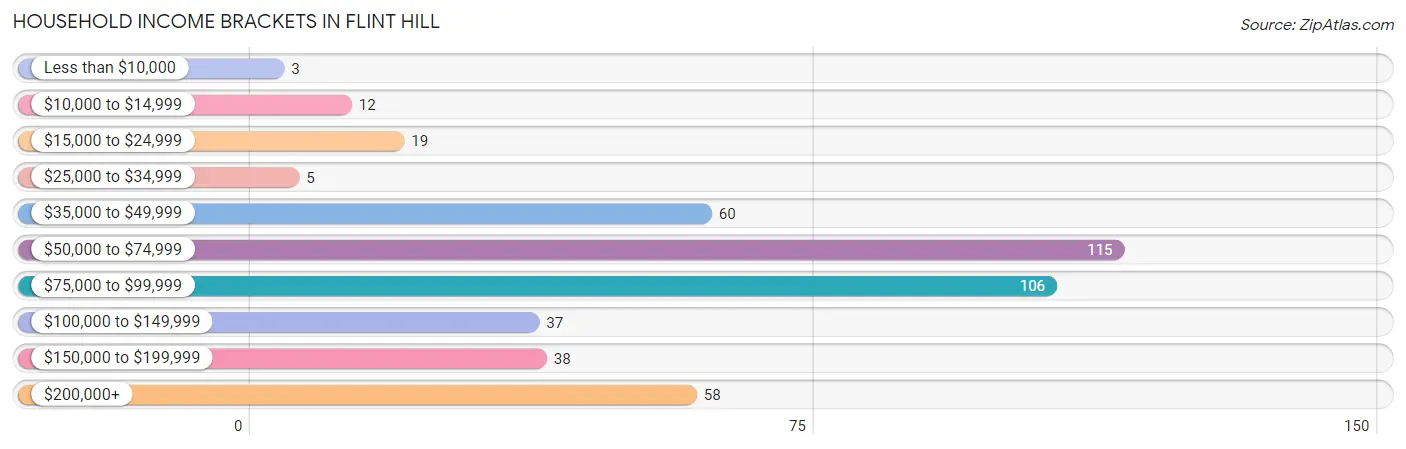
Household Income Brackets in Flint Hill
With 115 households falling in the category, the $50,000 to $74,999 income range is the most frequent in Flint Hill, accounting for 25.4% of all households. In contrast, only 3 households (0.7%) fall into the less than $10,000 income bracket, making it the least populous group.
| Income Bracket | # Households | % Households |
| Less than $10,000 | 3 | 0.7% |
| $10,000 to $14,999 | 12 | 2.6% |
| $15,000 to $24,999 | 19 | 4.2% |
| $25,000 to $34,999 | 5 | 1.1% |
| $35,000 to $49,999 | 60 | 13.2% |
| $50,000 to $74,999 | 115 | 25.4% |
| $75,000 to $99,999 | 106 | 23.4% |
| $100,000 to $149,999 | 37 | 8.2% |
| $150,000 to $199,999 | 38 | 8.4% |
| $200,000+ | 58 | 12.8% |
Household Income by Householder Age in Flint Hill
The median household income in Flint Hill is $82,837, with the highest median household income of $94,469 found in the 45 to 64 years age bracket for the primary householder. A total of 141 households (31.1%) fall into this category. Meanwhile, the 25 to 44 years age bracket for the primary householder has the lowest median household income of $0, with 133 households (29.4%) in this group.
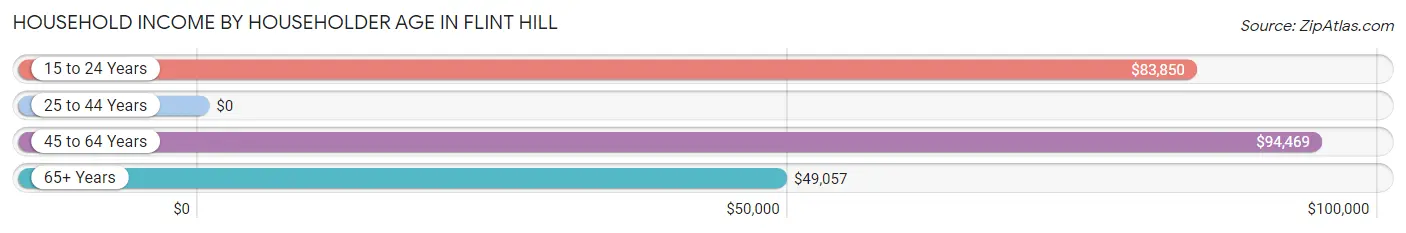
| Income Bracket | # Households | Median Income |
| 15 to 24 Years | 35 (7.7%) | $83,850 |
| 25 to 44 Years | 133 (29.4%) | $0 |
| 45 to 64 Years | 141 (31.1%) | $94,469 |
| 65+ Years | 144 (31.8%) | $49,057 |
| Total | 453 (100.0%) | $82,837 |
Poverty in Flint Hill
Income Below Poverty by Sex and Age in Flint Hill
With 5.8% poverty level for males and 5.9% for females among the residents of Flint Hill, 16 and 17 year old males and 75 year old and over females are the most vulnerable to poverty, with 3 males (50.0%) and 18 females (50.0%) in their respective age groups living below the poverty level.
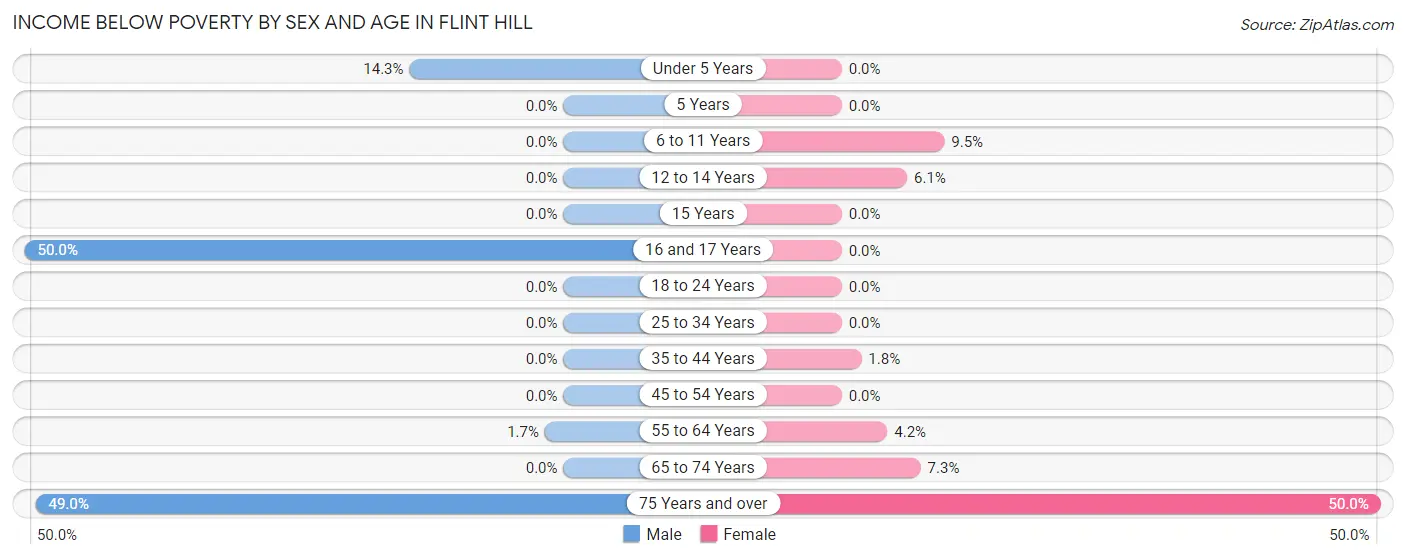
| Age Bracket | Male | Female |
| Under 5 Years | 3 (14.3%) | 0 (0.0%) |
| 5 Years | 0 (0.0%) | 0 (0.0%) |
| 6 to 11 Years | 0 (0.0%) | 2 (9.5%) |
| 12 to 14 Years | 0 (0.0%) | 2 (6.1%) |
| 15 Years | 0 (0.0%) | 0 (0.0%) |
| 16 and 17 Years | 3 (50.0%) | 0 (0.0%) |
| 18 to 24 Years | 0 (0.0%) | 0 (0.0%) |
| 25 to 34 Years | 0 (0.0%) | 0 (0.0%) |
| 35 to 44 Years | 0 (0.0%) | 2 (1.8%) |
| 45 to 54 Years | 0 (0.0%) | 0 (0.0%) |
| 55 to 64 Years | 1 (1.7%) | 3 (4.2%) |
| 65 to 74 Years | 0 (0.0%) | 3 (7.3%) |
| 75 Years and over | 24 (49.0%) | 18 (50.0%) |
| Total | 31 (5.8%) | 30 (5.9%) |
Income Above Poverty by Sex and Age in Flint Hill
According to the poverty statistics in Flint Hill, males aged 5 years and females aged under 5 years are the age groups that are most secure financially, with 100.0% of males and 100.0% of females in these age groups living above the poverty line.
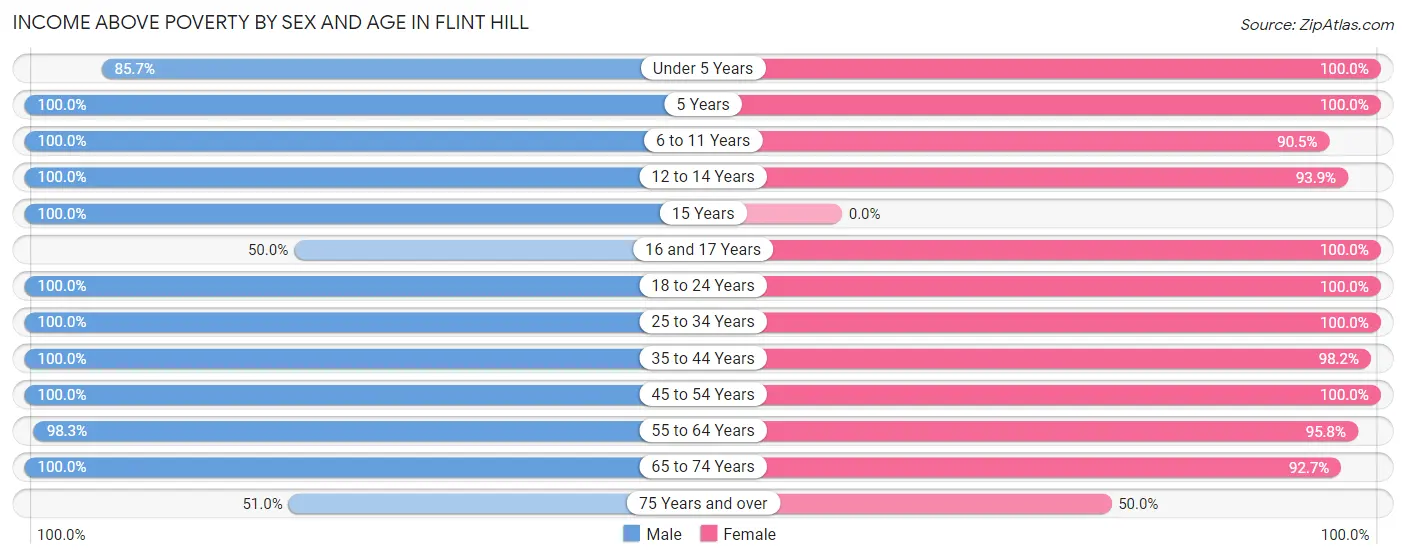
| Age Bracket | Male | Female |
| Under 5 Years | 18 (85.7%) | 17 (100.0%) |
| 5 Years | 4 (100.0%) | 5 (100.0%) |
| 6 to 11 Years | 13 (100.0%) | 19 (90.5%) |
| 12 to 14 Years | 58 (100.0%) | 31 (93.9%) |
| 15 Years | 5 (100.0%) | 0 (0.0%) |
| 16 and 17 Years | 3 (50.0%) | 5 (100.0%) |
| 18 to 24 Years | 46 (100.0%) | 47 (100.0%) |
| 25 to 34 Years | 37 (100.0%) | 26 (100.0%) |
| 35 to 44 Years | 27 (100.0%) | 108 (98.2%) |
| 45 to 54 Years | 124 (100.0%) | 94 (100.0%) |
| 55 to 64 Years | 57 (98.3%) | 68 (95.8%) |
| 65 to 74 Years | 87 (100.0%) | 38 (92.7%) |
| 75 Years and over | 25 (51.0%) | 18 (50.0%) |
| Total | 504 (94.2%) | 476 (94.1%) |
Income Below Poverty Among Married-Couple Families in Flint Hill
The poverty statistics for married-couple families in Flint Hill show that 7.6% or 18 of the total 236 families live below the poverty line. Families with no children have the highest poverty rate of 9.5%, comprising of 18 families. On the other hand, families with 1 or 2 children have the lowest poverty rate of 0.0%, which includes 0 families.
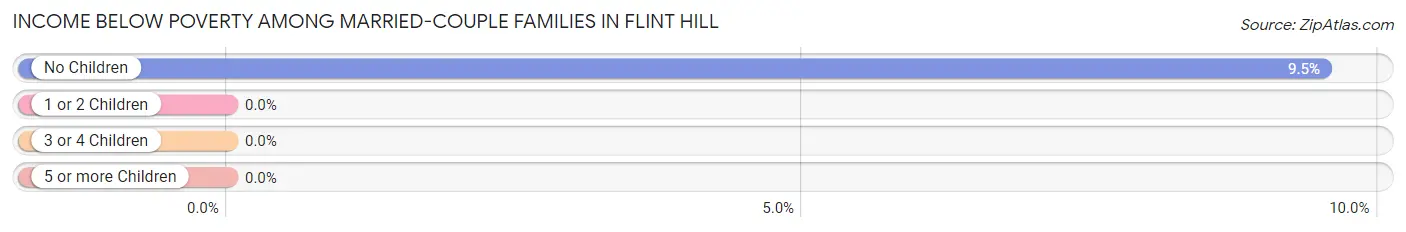
| Children | Above Poverty | Below Poverty |
| No Children | 171 (90.5%) | 18 (9.5%) |
| 1 or 2 Children | 28 (100.0%) | 0 (0.0%) |
| 3 or 4 Children | 19 (100.0%) | 0 (0.0%) |
| 5 or more Children | 0 (0.0%) | 0 (0.0%) |
| Total | 218 (92.4%) | 18 (7.6%) |
Income Below Poverty Among Single-Parent Households in Flint Hill
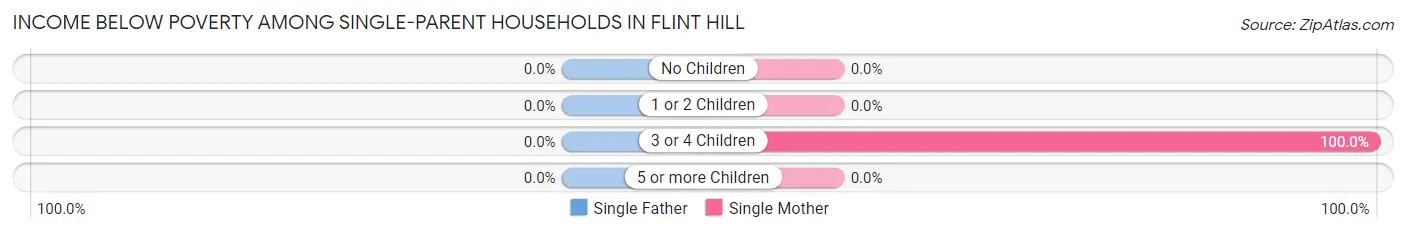
| Children | Single Father | Single Mother |
| No Children | 0 (0.0%) | 0 (0.0%) |
| 1 or 2 Children | 0 (0.0%) | 0 (0.0%) |
| 3 or 4 Children | 0 (0.0%) | 2 (100.0%) |
| 5 or more Children | 0 (0.0%) | 0 (0.0%) |
| Total | 0 (0.0%) | 2 (2.2%) |
Income Below Poverty Among Married-Couple vs Single-Parent Households in Flint Hill
The poverty data for Flint Hill shows that 18 of the married-couple family households (7.6%) and 2 of the single-parent households (1.2%) are living below the poverty level. Within the married-couple family households, those with no children have the highest poverty rate, with 18 households (9.5%) falling below the poverty line. Among the single-parent households, those with 3 or 4 children have the highest poverty rate, with 2 household (100.0%) living below poverty.
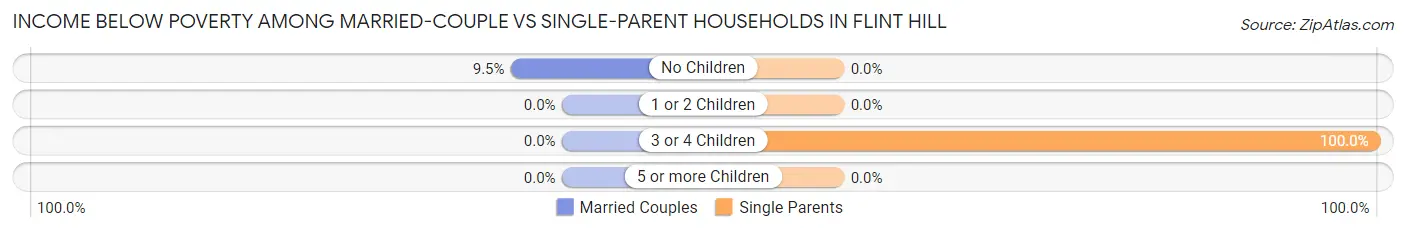
| Children | Married-Couple Families | Single-Parent Households |
| No Children | 18 (9.5%) | 0 (0.0%) |
| 1 or 2 Children | 0 (0.0%) | 0 (0.0%) |
| 3 or 4 Children | 0 (0.0%) | 2 (100.0%) |
| 5 or more Children | 0 (0.0%) | 0 (0.0%) |
| Total | 18 (7.6%) | 2 (1.2%) |
Race in Flint Hill
The most populous races in Flint Hill are White / Caucasian (841 | 80.8%), Black / African American (177 | 17.0%), and Hispanic or Latino (25 | 2.4%).
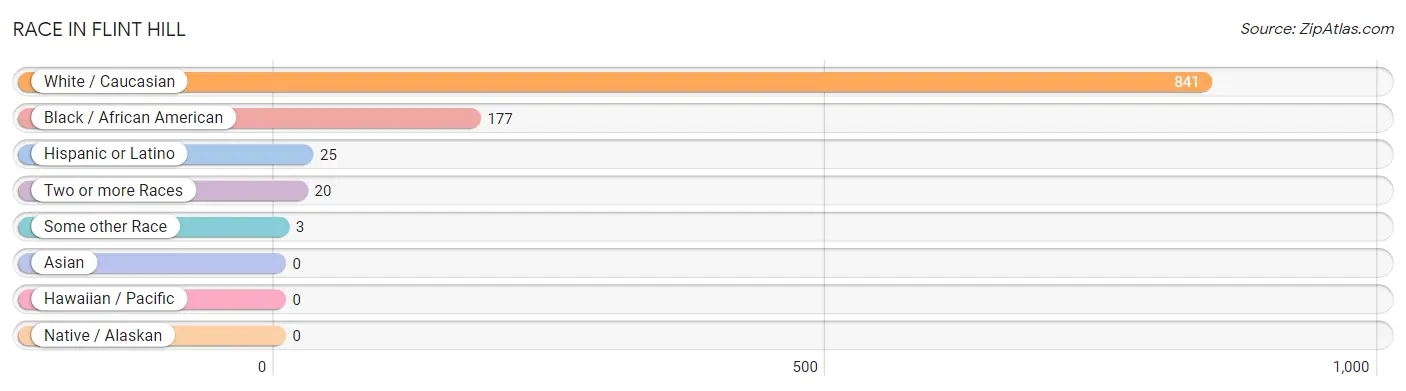
| Race | # Population | % Population |
| Asian | 0 | 0.0% |
| Black / African American | 177 | 17.0% |
| Hawaiian / Pacific | 0 | 0.0% |
| Hispanic or Latino | 25 | 2.4% |
| Native / Alaskan | 0 | 0.0% |
| White / Caucasian | 841 | 80.8% |
| Two or more Races | 20 | 1.9% |
| Some other Race | 3 | 0.3% |
| Total | 1,041 | 100.0% |
Ancestry in Flint Hill
The most populous ancestries reported in Flint Hill are German (361 | 34.7%), Irish (177 | 17.0%), English (94 | 9.0%), Polish (62 | 6.0%), and American (45 | 4.3%), together accounting for 71.0% of all Flint Hill residents.
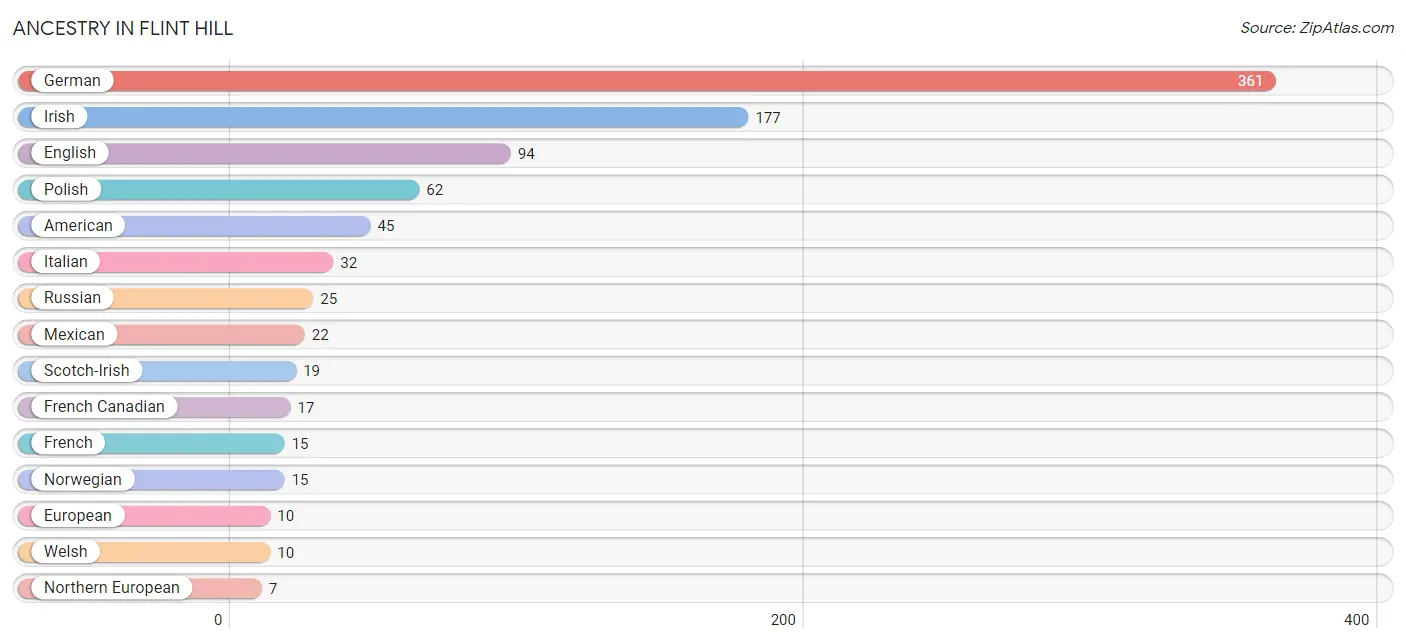
| Ancestry | # Population | % Population |
| African | 2 | 0.2% |
| American | 45 | 4.3% |
| Argentinean | 1 | 0.1% |
| British | 2 | 0.2% |
| Cherokee | 3 | 0.3% |
| Chilean | 2 | 0.2% |
| Czechoslovakian | 1 | 0.1% |
| Dutch | 2 | 0.2% |
| Eastern European | 2 | 0.2% |
| English | 94 | 9.0% |
| European | 10 | 1.0% |
| French | 15 | 1.4% |
| French Canadian | 17 | 1.6% |
| German | 361 | 34.7% |
| Greek | 3 | 0.3% |
| Irish | 177 | 17.0% |
| Italian | 32 | 3.1% |
| Lithuanian | 2 | 0.2% |
| Mexican | 22 | 2.1% |
| Northern European | 7 | 0.7% |
| Norwegian | 15 | 1.4% |
| Polish | 62 | 6.0% |
| Russian | 25 | 2.4% |
| Scandinavian | 4 | 0.4% |
| Scotch-Irish | 19 | 1.8% |
| South American | 3 | 0.3% |
| Subsaharan African | 2 | 0.2% |
| Swedish | 6 | 0.6% |
| Swiss | 5 | 0.5% |
| Welsh | 10 | 1.0% | View All 30 Rows |
Immigrants in Flint Hill
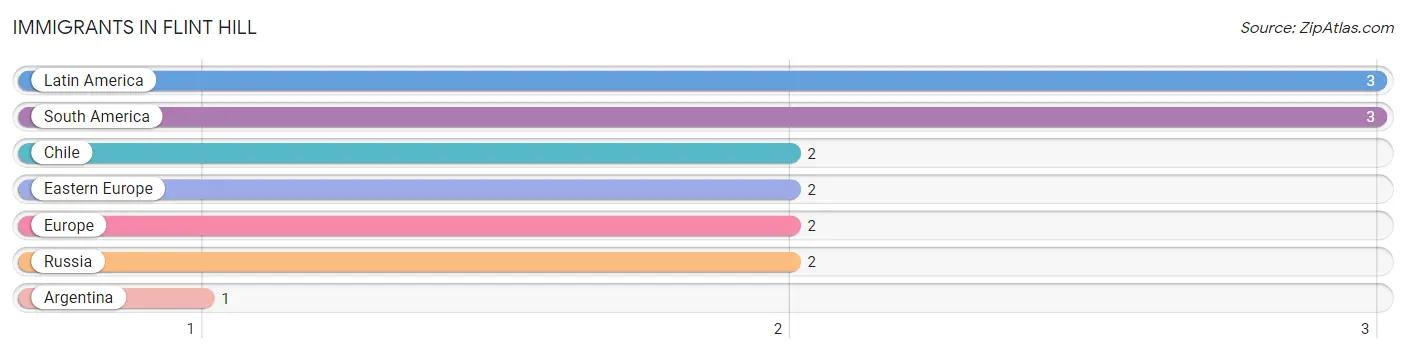
The most numerous immigrant groups reported in Flint Hill came from Latin America (3 | 0.3%), South America (3 | 0.3%), Chile (2 | 0.2%), Eastern Europe (2 | 0.2%), and Europe (2 | 0.2%), together accounting for 1.1% of all Flint Hill residents.
| Immigration Origin | # Population | % Population |
| Argentina | 1 | 0.1% |
| Chile | 2 | 0.2% |
| Eastern Europe | 2 | 0.2% |
| Europe | 2 | 0.2% |
| Latin America | 3 | 0.3% |
| Russia | 2 | 0.2% |
| South America | 3 | 0.3% | View All 7 Rows |
Sex and Age in Flint Hill
Sex and Age in Flint Hill
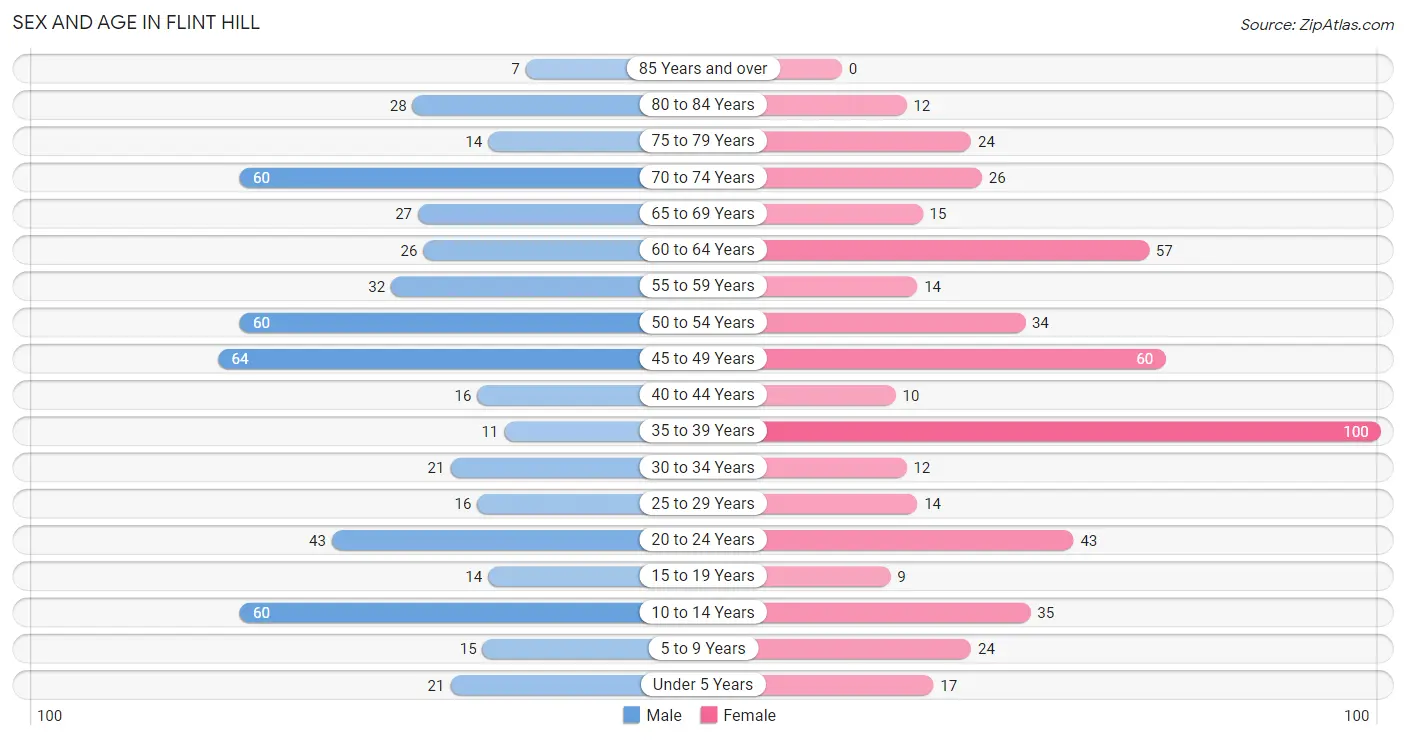
The most populous age groups in Flint Hill are 45 to 49 Years (64 | 12.0%) for men and 35 to 39 Years (100 | 19.8%) for women.
| Age Bracket | Male | Female |
| Under 5 Years | 21 (3.9%) | 17 (3.4%) |
| 5 to 9 Years | 15 (2.8%) | 24 (4.7%) |
| 10 to 14 Years | 60 (11.2%) | 35 (6.9%) |
| 15 to 19 Years | 14 (2.6%) | 9 (1.8%) |
| 20 to 24 Years | 43 (8.0%) | 43 (8.5%) |
| 25 to 29 Years | 16 (3.0%) | 14 (2.8%) |
| 30 to 34 Years | 21 (3.9%) | 12 (2.4%) |
| 35 to 39 Years | 11 (2.1%) | 100 (19.8%) |
| 40 to 44 Years | 16 (3.0%) | 10 (2.0%) |
| 45 to 49 Years | 64 (12.0%) | 60 (11.9%) |
| 50 to 54 Years | 60 (11.2%) | 34 (6.7%) |
| 55 to 59 Years | 32 (6.0%) | 14 (2.8%) |
| 60 to 64 Years | 26 (4.9%) | 57 (11.3%) |
| 65 to 69 Years | 27 (5.1%) | 15 (3.0%) |
| 70 to 74 Years | 60 (11.2%) | 26 (5.1%) |
| 75 to 79 Years | 14 (2.6%) | 24 (4.7%) |
| 80 to 84 Years | 28 (5.2%) | 12 (2.4%) |
| 85 Years and over | 7 (1.3%) | 0 (0.0%) |
| Total | 535 (100.0%) | 506 (100.0%) |
Families and Households in Flint Hill
Median Family Size in Flint Hill
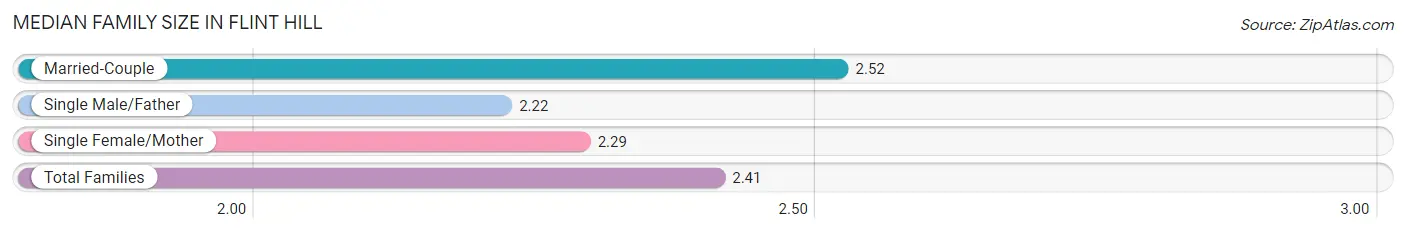
The median family size in Flint Hill is 2.41 persons per family, with married-couple families (236 | 58.4%) accounting for the largest median family size of 2.52 persons per family. On the other hand, single male/father families (78 | 19.3%) represent the smallest median family size with 2.22 persons per family.
| Family Type | # Families | Family Size |
| Married-Couple | 236 (58.4%) | 2.52 |
| Single Male/Father | 78 (19.3%) | 2.22 |
| Single Female/Mother | 90 (22.3%) | 2.29 |
| Total Families | 404 (100.0%) | 2.41 |
Median Household Size in Flint Hill
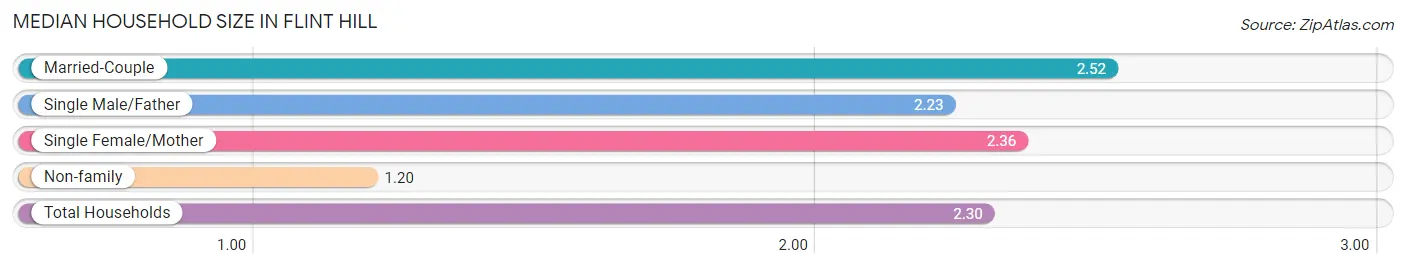
The median household size in Flint Hill is 2.30 persons per household, with married-couple households (236 | 52.1%) accounting for the largest median household size of 2.52 persons per household. non-family households (49 | 10.8%) represent the smallest median household size with 1.20 persons per household.
| Household Type | # Households | Household Size |
| Married-Couple | 236 (52.1%) | 2.52 |
| Single Male/Father | 78 (17.2%) | 2.23 |
| Single Female/Mother | 90 (19.9%) | 2.36 |
| Non-family | 49 (10.8%) | 1.20 |
| Total Households | 453 (100.0%) | 2.30 |
Household Size by Marriage Status in Flint Hill
Out of a total of 453 households in Flint Hill, 404 (89.2%) are family households, while 49 (10.8%) are nonfamily households. The most numerous type of family households are 2-person households, comprising 246, and the most common type of nonfamily households are 1-person households, comprising 40.
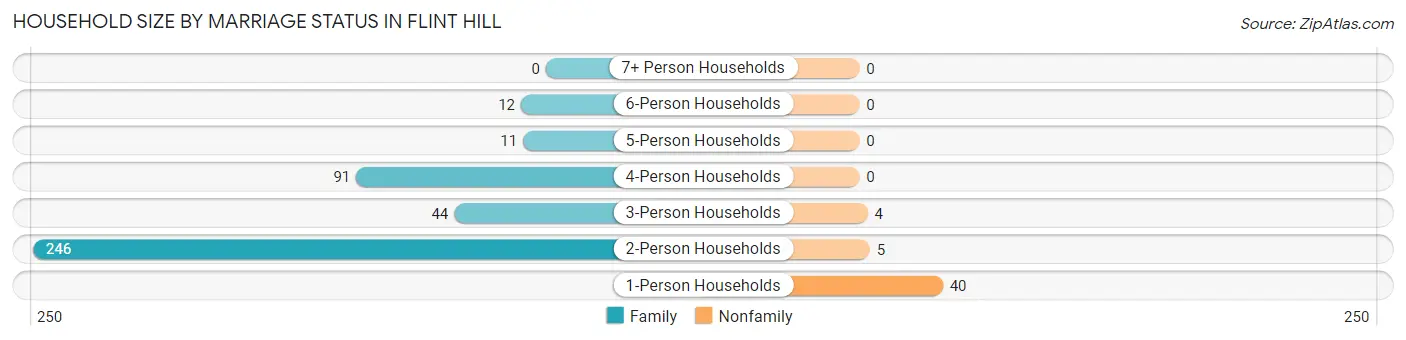
| Household Size | Family Households | Nonfamily Households |
| 1-Person Households | - | 40 (8.8%) |
| 2-Person Households | 246 (54.3%) | 5 (1.1%) |
| 3-Person Households | 44 (9.7%) | 4 (0.9%) |
| 4-Person Households | 91 (20.1%) | 0 (0.0%) |
| 5-Person Households | 11 (2.4%) | 0 (0.0%) |
| 6-Person Households | 12 (2.6%) | 0 (0.0%) |
| 7+ Person Households | 0 (0.0%) | 0 (0.0%) |
| Total | 404 (89.2%) | 49 (10.8%) |
Female Fertility in Flint Hill
Fertility by Age in Flint Hill
Average fertility rate in Flint Hill is 44.0 births per 1,000 women. Women in the age bracket of 20 to 34 years have the highest fertility rate with 58.0 births per 1,000 women. Women in the age bracket of 35 to 50 years acount for 63.6% of all women with births.
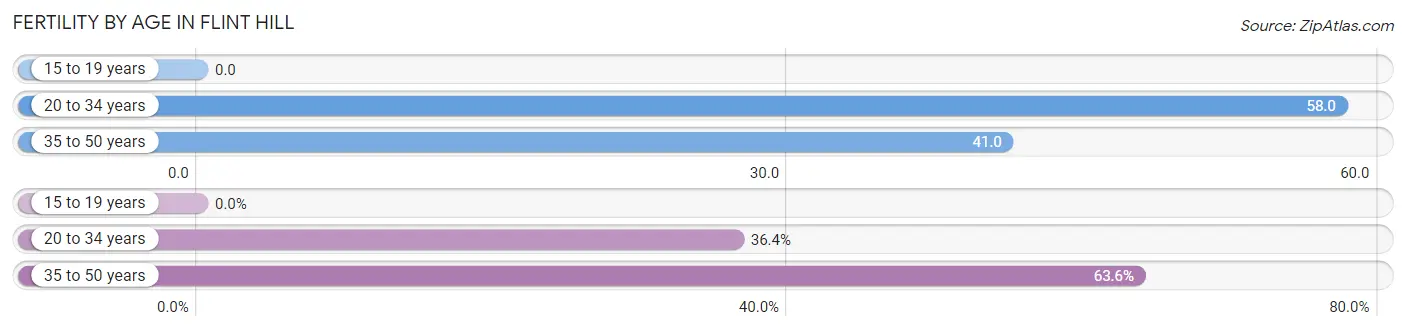
| Age Bracket | Women with Births | Births / 1,000 Women |
| 15 to 19 years | 0 (0.0%) | 0.0 |
| 20 to 34 years | 4 (36.4%) | 58.0 |
| 35 to 50 years | 7 (63.6%) | 41.0 |
| Total | 11 (100.0%) | 44.0 |
Fertility by Age by Marriage Status in Flint Hill
72.7% of women with births (11) in Flint Hill are married. The highest percentage of unmarried women with births falls into 20 to 34 years age bracket with 75.0% of them unmarried at the time of birth, while the lowest percentage of unmarried women with births belong to 35 to 50 years age bracket with 0.0% of them unmarried.
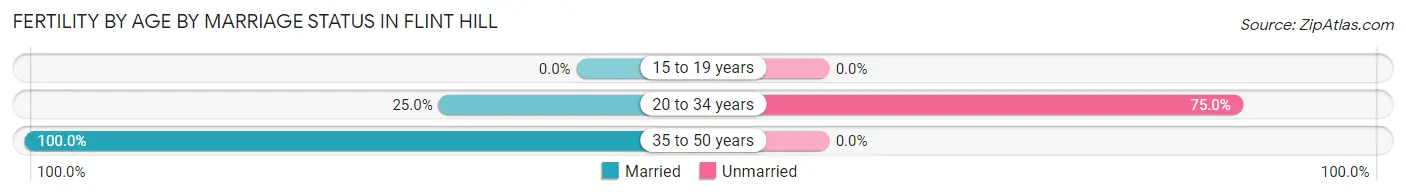
| Age Bracket | Married | Unmarried |
| 15 to 19 years | 0 (0.0%) | 0 (0.0%) |
| 20 to 34 years | 1 (25.0%) | 3 (75.0%) |
| 35 to 50 years | 7 (100.0%) | 0 (0.0%) |
| Total | 8 (72.7%) | 3 (27.3%) |
Fertility by Education in Flint Hill
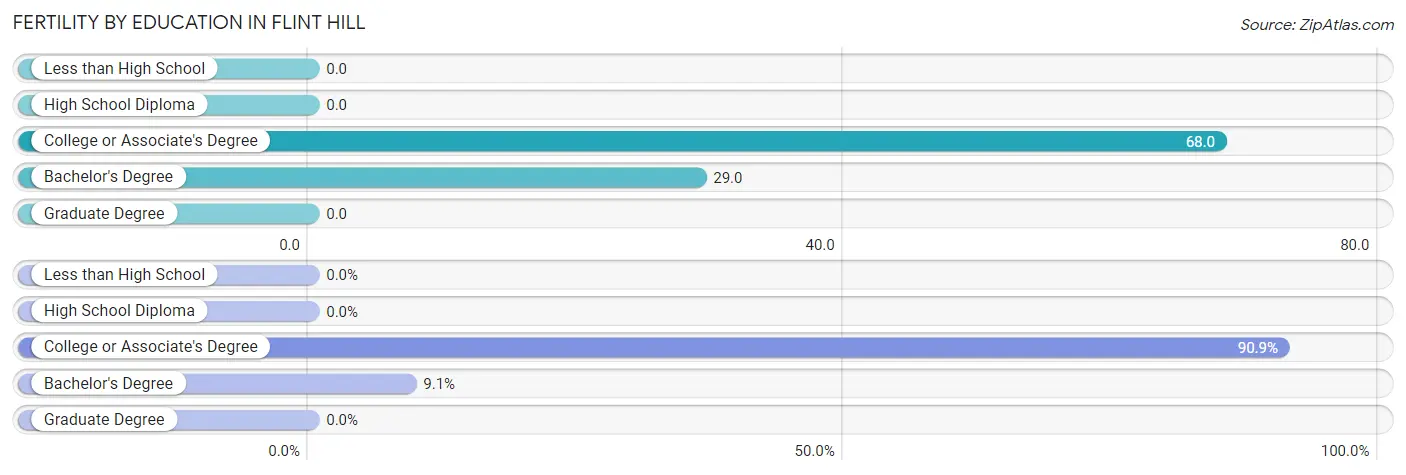
| Educational Attainment | Women with Births | Births / 1,000 Women |
| Less than High School | 0 (0.0%) | 0.0 |
| High School Diploma | 0 (0.0%) | 0.0 |
| College or Associate's Degree | 10 (90.9%) | 68.0 |
| Bachelor's Degree | 1 (9.1%) | 29.0 |
| Graduate Degree | 0 (0.0%) | 0.0 |
| Total | 11 (100.0%) | 44.0 |
Fertility by Education by Marriage Status in Flint Hill
27.3% of women with births in Flint Hill are unmarried. Women with the educational attainment of bachelor's degree are most likely to be married with 100.0% of them married at childbirth, while women with the educational attainment of college or associate's degree are least likely to be married with 30.0% of them unmarried at childbirth.
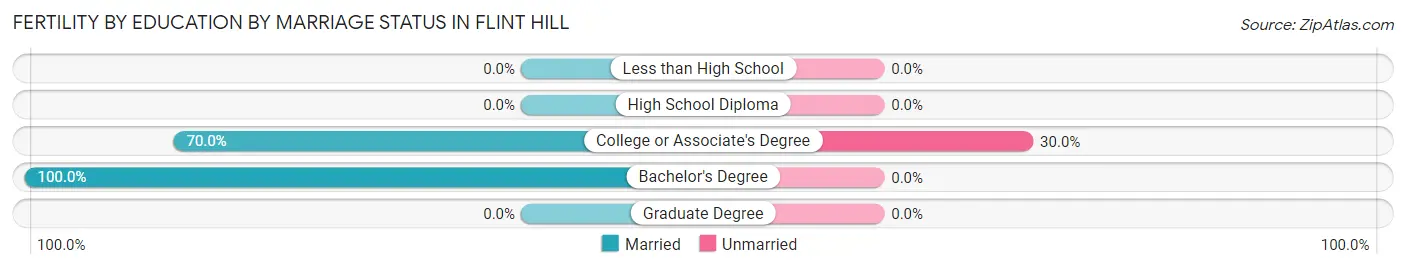
| Educational Attainment | Married | Unmarried |
| Less than High School | 0 (0.0%) | 0 (0.0%) |
| High School Diploma | 0 (0.0%) | 0 (0.0%) |
| College or Associate's Degree | 7 (70.0%) | 3 (30.0%) |
| Bachelor's Degree | 1 (100.0%) | 0 (0.0%) |
| Graduate Degree | 0 (0.0%) | 0 (0.0%) |
| Total | 8 (72.7%) | 3 (27.3%) |
Employment Characteristics in Flint Hill
Employment by Class of Employer in Flint Hill
Among the 512 employed individuals in Flint Hill, private company employees (357 | 69.7%), self-employed (not incorporated) (57 | 11.1%), and local government employees (50 | 9.8%) make up the most common classes of employment.
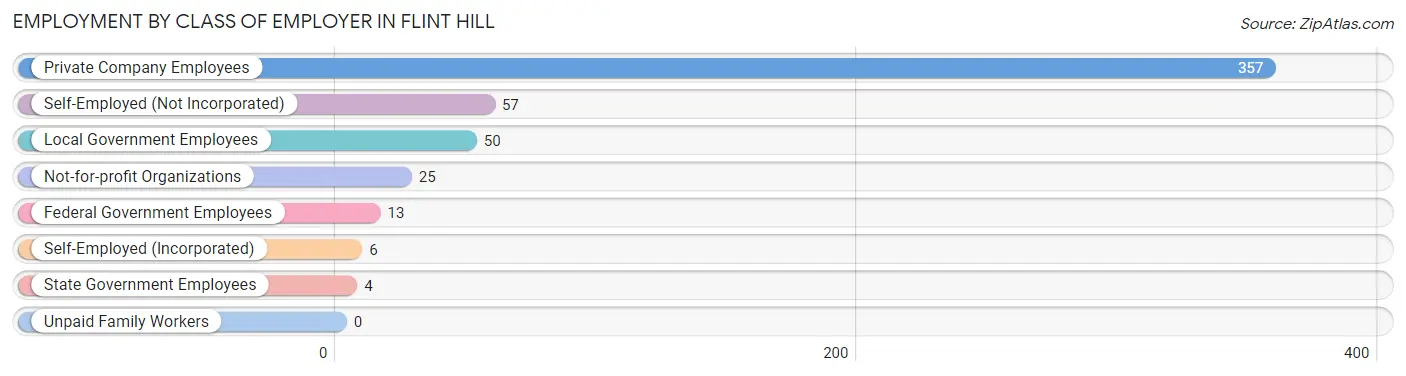
| Employer Class | # Employees | % Employees |
| Private Company Employees | 357 | 69.7% |
| Self-Employed (Incorporated) | 6 | 1.2% |
| Self-Employed (Not Incorporated) | 57 | 11.1% |
| Not-for-profit Organizations | 25 | 4.9% |
| Local Government Employees | 50 | 9.8% |
| State Government Employees | 4 | 0.8% |
| Federal Government Employees | 13 | 2.5% |
| Unpaid Family Workers | 0 | 0.0% |
| Total | 512 | 100.0% |
Employment Status by Age in Flint Hill
According to the labor force statistics for Flint Hill, out of the total population over 16 years of age (864), 59.8% or 517 individuals are in the labor force, with 1.0% or 5 of them unemployed. The age group with the highest labor force participation rate is 30 to 34 years, with 97.0% or 32 individuals in the labor force. Within the labor force, the 60 to 64 years age range has the highest percentage of unemployed individuals, with 10.5% or 4 of them being unemployed.
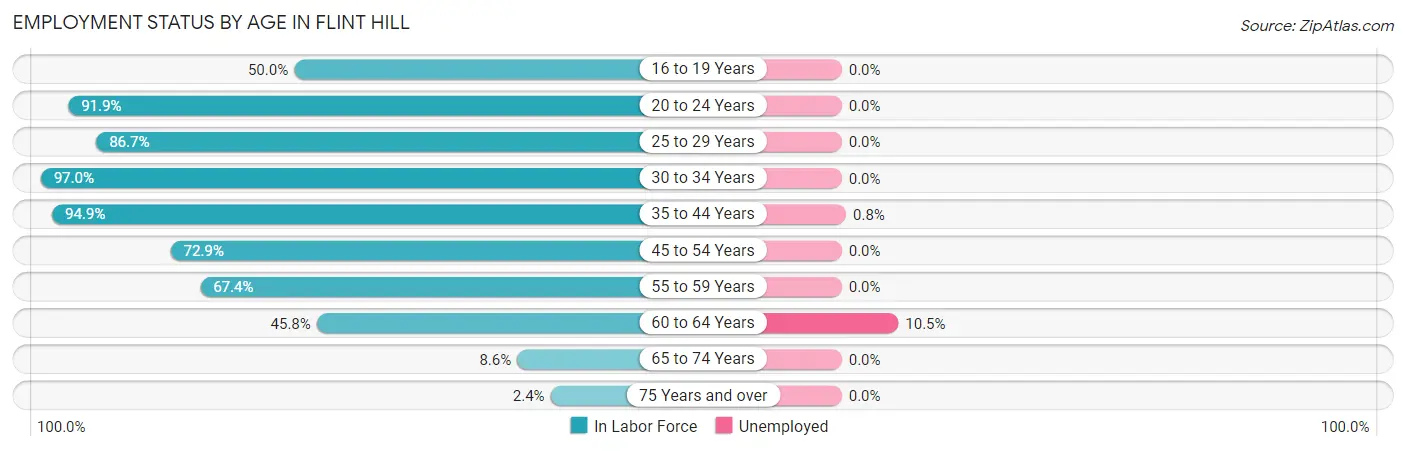
| Age Bracket | In Labor Force | Unemployed |
| 16 to 19 Years | 9 (50.0%) | 0 (0.0%) |
| 20 to 24 Years | 79 (91.9%) | 0 (0.0%) |
| 25 to 29 Years | 26 (86.7%) | 0 (0.0%) |
| 30 to 34 Years | 32 (97.0%) | 0 (0.0%) |
| 35 to 44 Years | 130 (94.9%) | 1 (0.8%) |
| 45 to 54 Years | 159 (72.9%) | 0 (0.0%) |
| 55 to 59 Years | 31 (67.4%) | 0 (0.0%) |
| 60 to 64 Years | 38 (45.8%) | 4 (10.5%) |
| 65 to 74 Years | 11 (8.6%) | 0 (0.0%) |
| 75 Years and over | 2 (2.4%) | 0 (0.0%) |
| Total | 517 (59.8%) | 5 (1.0%) |
Employment Status by Educational Attainment in Flint Hill
According to labor force statistics for Flint Hill, 76.1% of individuals (416) out of the total population between 25 and 64 years of age (547) are in the labor force, with 1.2% or 5 of them being unemployed. The group with the highest labor force participation rate are those with the educational attainment of bachelor's degree or higher, with 94.5% or 120 individuals in the labor force. Within the labor force, individuals with bachelor's degree or higher education have the highest percentage of unemployment, with 3.3% or 4 of them being unemployed.
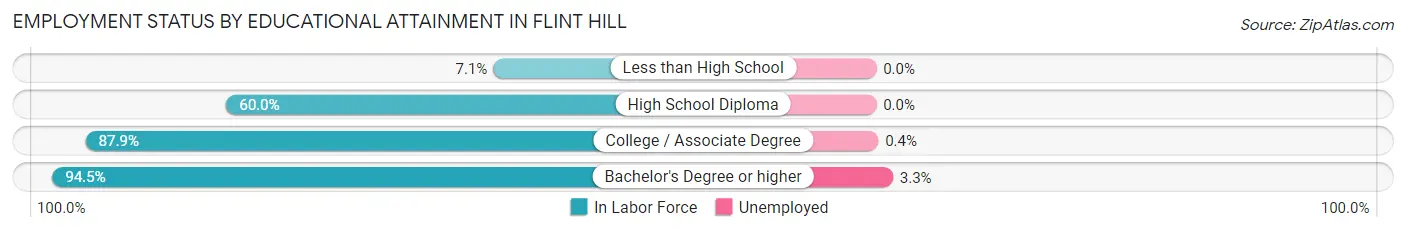
| Educational Attainment | In Labor Force | Unemployed |
| Less than High School | 4 (7.1%) | 0 (0.0%) |
| High School Diploma | 60 (60.0%) | 0 (0.0%) |
| College / Associate Degree | 232 (87.9%) | 1 (0.4%) |
| Bachelor's Degree or higher | 120 (94.5%) | 4 (3.3%) |
| Total | 416 (76.1%) | 7 (1.2%) |
Employment Occupations by Sex in Flint Hill
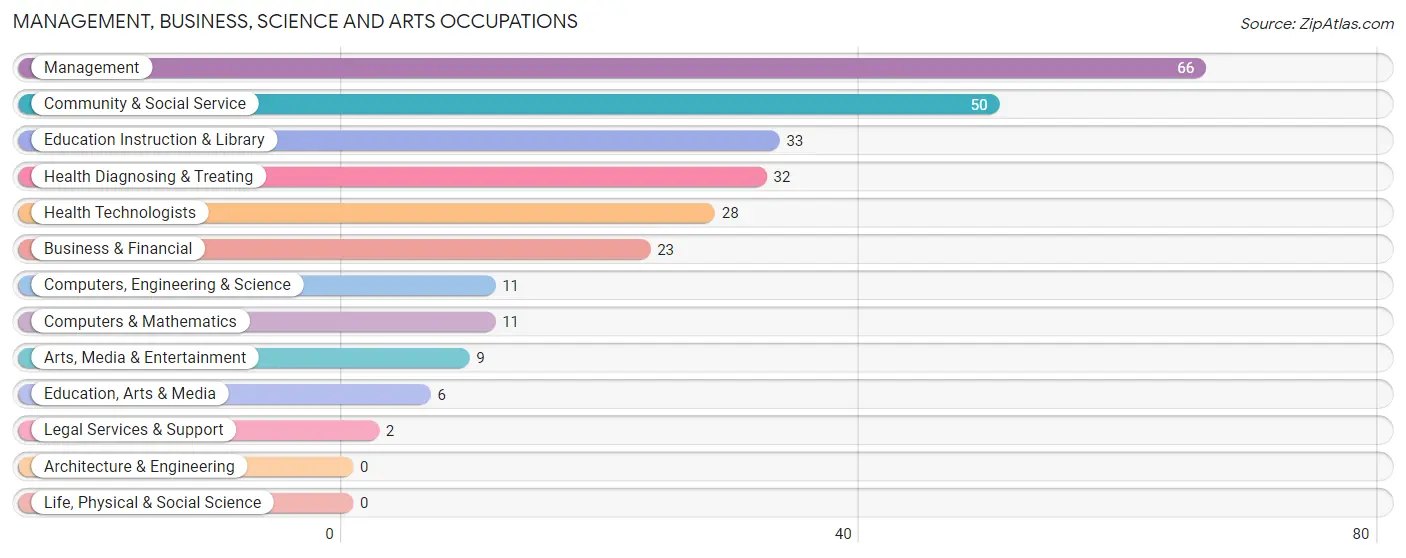
Management, Business, Science and Arts Occupations
The most common Management, Business, Science and Arts occupations in Flint Hill are Management (66 | 12.9%), Community & Social Service (50 | 9.8%), Education Instruction & Library (33 | 6.5%), Health Diagnosing & Treating (32 | 6.2%), and Health Technologists (28 | 5.5%).
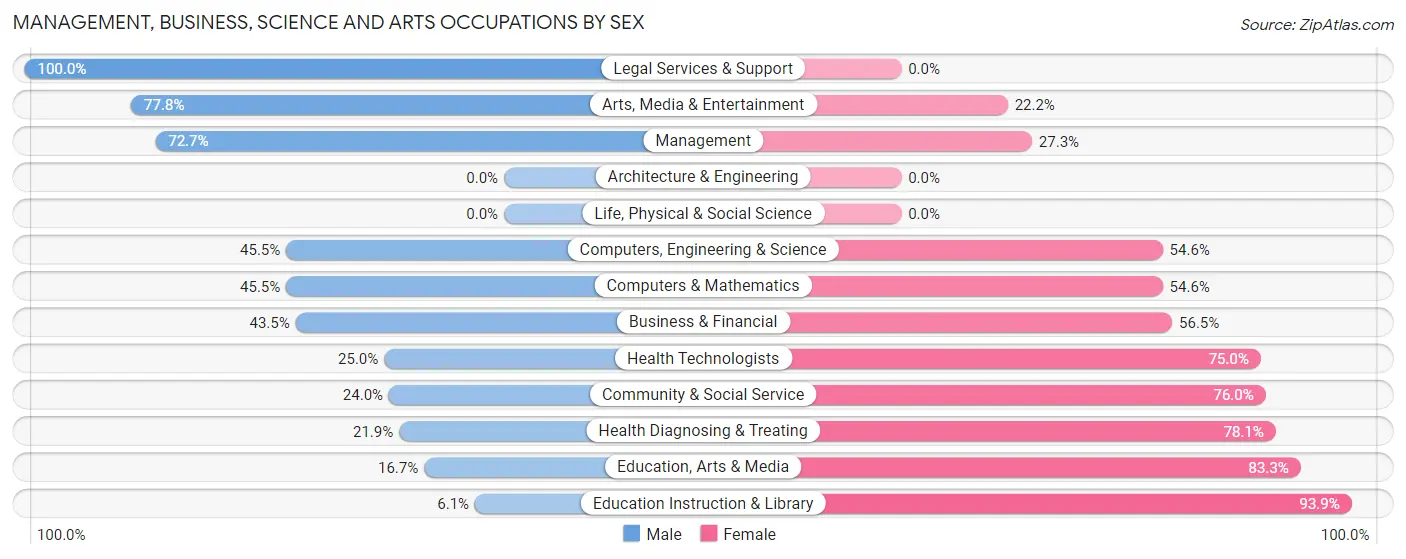
Management, Business, Science and Arts Occupations by Sex
Within the Management, Business, Science and Arts occupations in Flint Hill, the most male-oriented occupations are Legal Services & Support (100.0%), Arts, Media & Entertainment (77.8%), and Management (72.7%), while the most female-oriented occupations are Education Instruction & Library (93.9%), Education, Arts & Media (83.3%), and Health Diagnosing & Treating (78.1%).
| Occupation | Male | Female |
| Management | 48 (72.7%) | 18 (27.3%) |
| Business & Financial | 10 (43.5%) | 13 (56.5%) |
| Computers, Engineering & Science | 5 (45.5%) | 6 (54.5%) |
| Computers & Mathematics | 5 (45.5%) | 6 (54.5%) |
| Architecture & Engineering | 0 (0.0%) | 0 (0.0%) |
| Life, Physical & Social Science | 0 (0.0%) | 0 (0.0%) |
| Community & Social Service | 12 (24.0%) | 38 (76.0%) |
| Education, Arts & Media | 1 (16.7%) | 5 (83.3%) |
| Legal Services & Support | 2 (100.0%) | 0 (0.0%) |
| Education Instruction & Library | 2 (6.1%) | 31 (93.9%) |
| Arts, Media & Entertainment | 7 (77.8%) | 2 (22.2%) |
| Health Diagnosing & Treating | 7 (21.9%) | 25 (78.1%) |
| Health Technologists | 7 (25.0%) | 21 (75.0%) |
| Total (Category) | 82 (45.1%) | 100 (54.9%) |
| Total (Overall) | 226 (44.1%) | 286 (55.9%) |
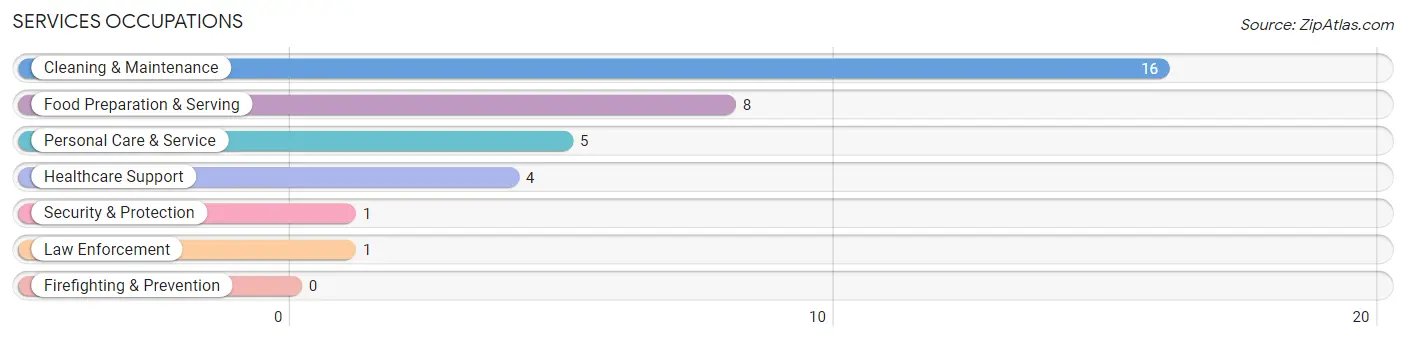
Services Occupations
The most common Services occupations in Flint Hill are Cleaning & Maintenance (16 | 3.1%), Food Preparation & Serving (8 | 1.6%), Personal Care & Service (5 | 1.0%), Healthcare Support (4 | 0.8%), and Security & Protection (1 | 0.2%).
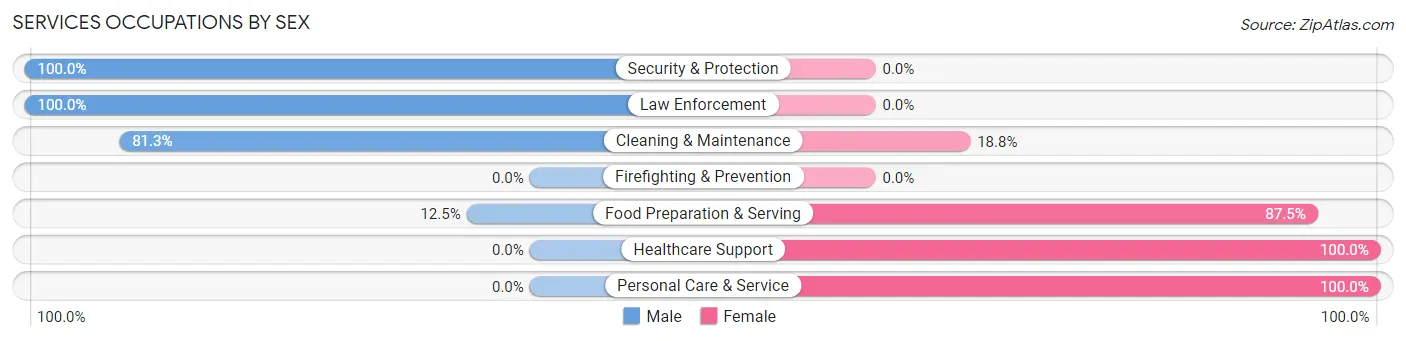
Services Occupations by Sex
Within the Services occupations in Flint Hill, the most male-oriented occupations are Security & Protection (100.0%), Law Enforcement (100.0%), and Cleaning & Maintenance (81.2%), while the most female-oriented occupations are Healthcare Support (100.0%), Personal Care & Service (100.0%), and Food Preparation & Serving (87.5%).
| Occupation | Male | Female |
| Healthcare Support | 0 (0.0%) | 4 (100.0%) |
| Security & Protection | 1 (100.0%) | 0 (0.0%) |
| Firefighting & Prevention | 0 (0.0%) | 0 (0.0%) |
| Law Enforcement | 1 (100.0%) | 0 (0.0%) |
| Food Preparation & Serving | 1 (12.5%) | 7 (87.5%) |
| Cleaning & Maintenance | 13 (81.2%) | 3 (18.8%) |
| Personal Care & Service | 0 (0.0%) | 5 (100.0%) |
| Total (Category) | 15 (44.1%) | 19 (55.9%) |
| Total (Overall) | 226 (44.1%) | 286 (55.9%) |
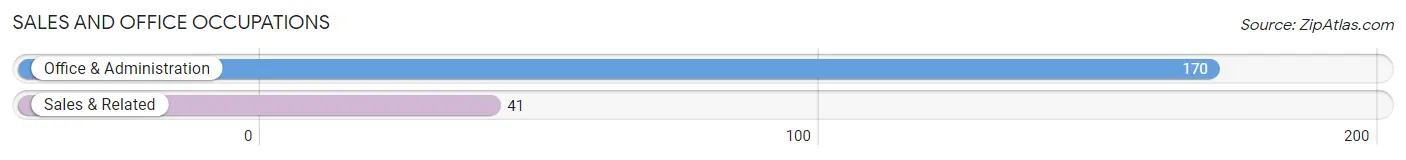
Sales and Office Occupations
The most common Sales and Office occupations in Flint Hill are Office & Administration (170 | 33.2%), and Sales & Related (41 | 8.0%).
Sales and Office Occupations by Sex
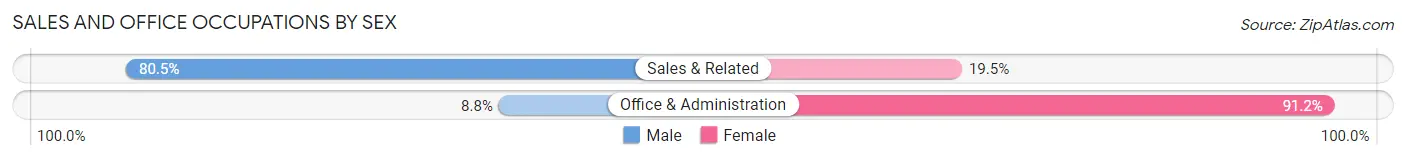
| Occupation | Male | Female |
| Sales & Related | 33 (80.5%) | 8 (19.5%) |
| Office & Administration | 15 (8.8%) | 155 (91.2%) |
| Total (Category) | 48 (22.8%) | 163 (77.2%) |
| Total (Overall) | 226 (44.1%) | 286 (55.9%) |
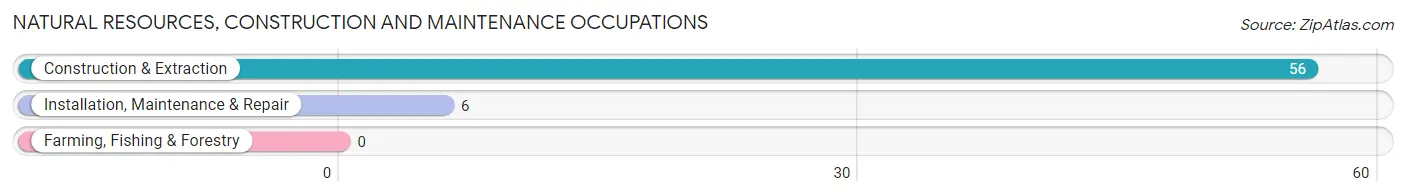
Natural Resources, Construction and Maintenance Occupations
The most common Natural Resources, Construction and Maintenance occupations in Flint Hill are Construction & Extraction (56 | 10.9%), and Installation, Maintenance & Repair (6 | 1.2%).
Natural Resources, Construction and Maintenance Occupations by Sex
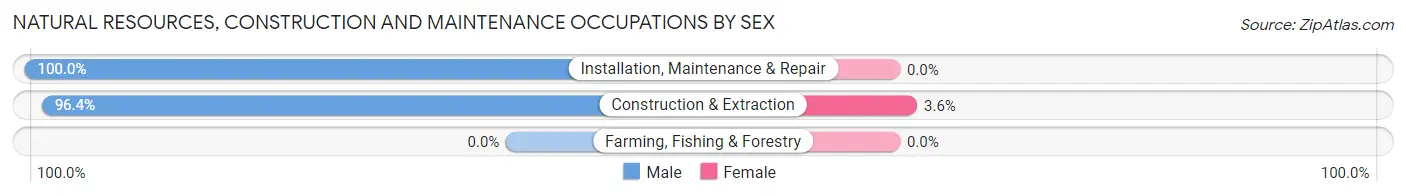
| Occupation | Male | Female |
| Farming, Fishing & Forestry | 0 (0.0%) | 0 (0.0%) |
| Construction & Extraction | 54 (96.4%) | 2 (3.6%) |
| Installation, Maintenance & Repair | 6 (100.0%) | 0 (0.0%) |
| Total (Category) | 60 (96.8%) | 2 (3.2%) |
| Total (Overall) | 226 (44.1%) | 286 (55.9%) |
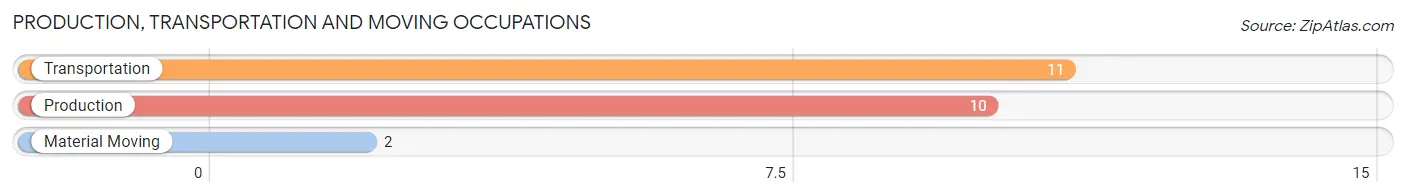
Production, Transportation and Moving Occupations
The most common Production, Transportation and Moving occupations in Flint Hill are Transportation (11 | 2.1%), Production (10 | 1.9%), and Material Moving (2 | 0.4%).
Production, Transportation and Moving Occupations by Sex
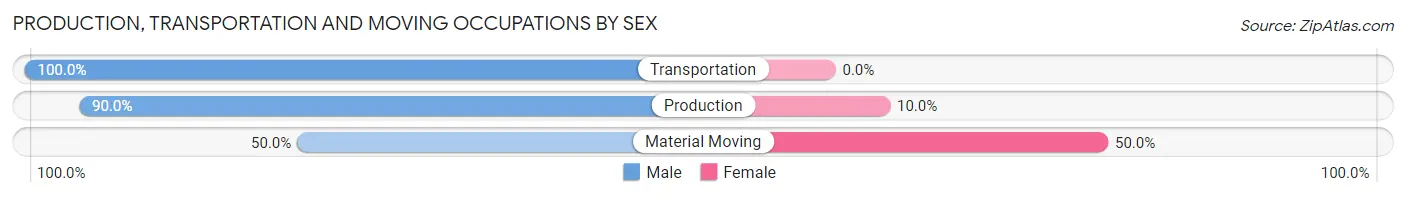
| Occupation | Male | Female |
| Production | 9 (90.0%) | 1 (10.0%) |
| Transportation | 11 (100.0%) | 0 (0.0%) |
| Material Moving | 1 (50.0%) | 1 (50.0%) |
| Total (Category) | 21 (91.3%) | 2 (8.7%) |
| Total (Overall) | 226 (44.1%) | 286 (55.9%) |
Employment Industries by Sex in Flint Hill
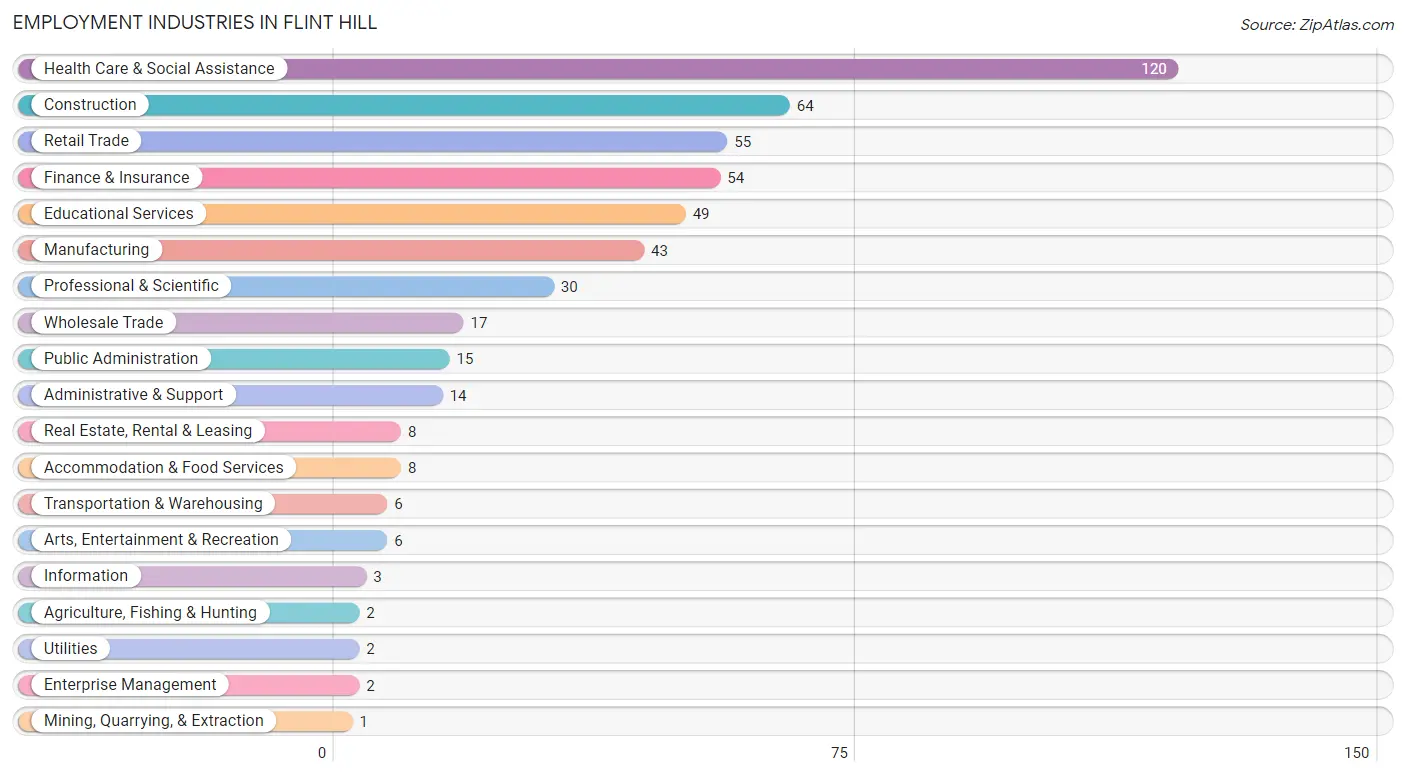
Employment Industries in Flint Hill
The major employment industries in Flint Hill include Health Care & Social Assistance (120 | 23.4%), Construction (64 | 12.5%), Retail Trade (55 | 10.7%), Finance & Insurance (54 | 10.5%), and Educational Services (49 | 9.6%).
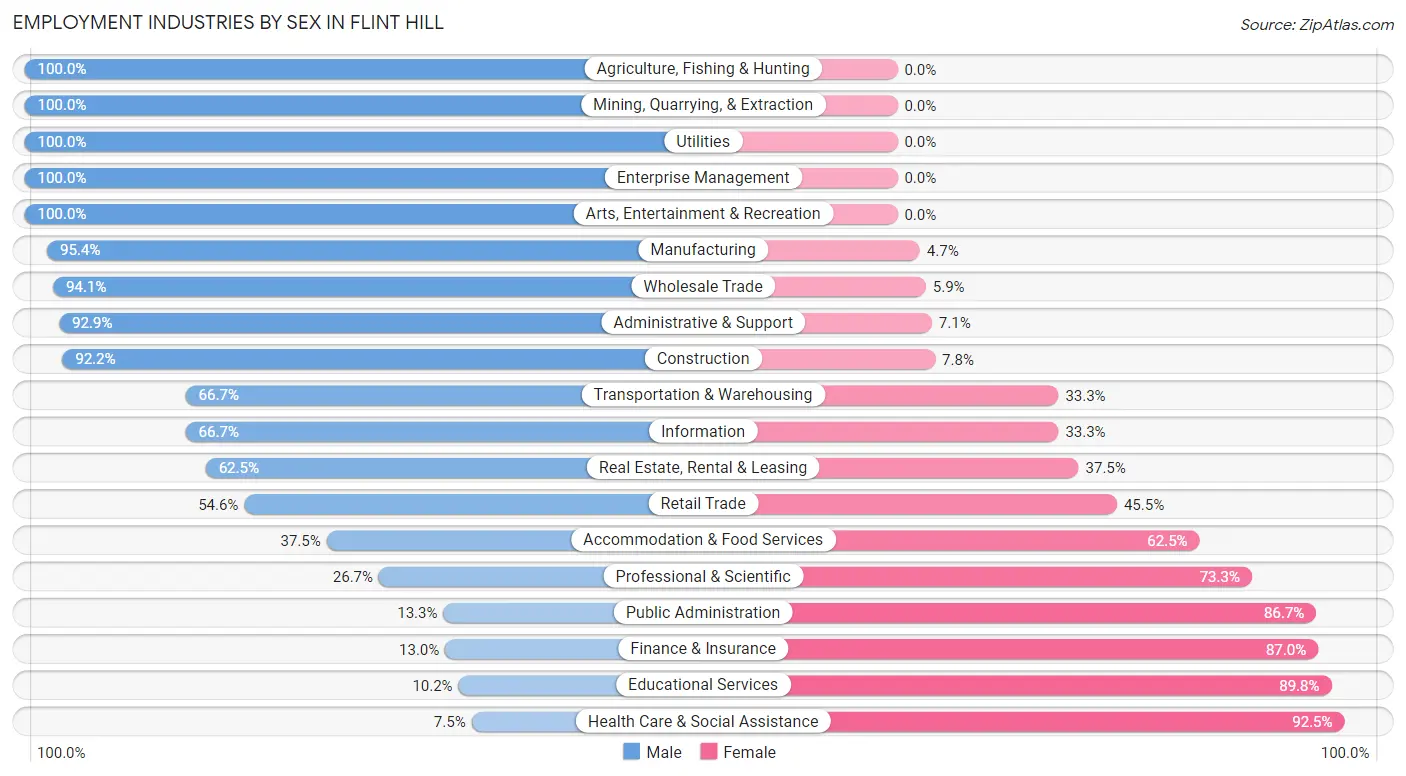
Employment Industries by Sex in Flint Hill
The Flint Hill industries that see more men than women are Agriculture, Fishing & Hunting (100.0%), Mining, Quarrying, & Extraction (100.0%), and Utilities (100.0%), whereas the industries that tend to have a higher number of women are Health Care & Social Assistance (92.5%), Educational Services (89.8%), and Finance & Insurance (87.0%).
| Industry | Male | Female |
| Agriculture, Fishing & Hunting | 2 (100.0%) | 0 (0.0%) |
| Mining, Quarrying, & Extraction | 1 (100.0%) | 0 (0.0%) |
| Construction | 59 (92.2%) | 5 (7.8%) |
| Manufacturing | 41 (95.4%) | 2 (4.6%) |
| Wholesale Trade | 16 (94.1%) | 1 (5.9%) |
| Retail Trade | 30 (54.5%) | 25 (45.5%) |
| Transportation & Warehousing | 4 (66.7%) | 2 (33.3%) |
| Utilities | 2 (100.0%) | 0 (0.0%) |
| Information | 2 (66.7%) | 1 (33.3%) |
| Finance & Insurance | 7 (13.0%) | 47 (87.0%) |
| Real Estate, Rental & Leasing | 5 (62.5%) | 3 (37.5%) |
| Professional & Scientific | 8 (26.7%) | 22 (73.3%) |
| Enterprise Management | 2 (100.0%) | 0 (0.0%) |
| Administrative & Support | 13 (92.9%) | 1 (7.1%) |
| Educational Services | 5 (10.2%) | 44 (89.8%) |
| Health Care & Social Assistance | 9 (7.5%) | 111 (92.5%) |
| Arts, Entertainment & Recreation | 6 (100.0%) | 0 (0.0%) |
| Accommodation & Food Services | 3 (37.5%) | 5 (62.5%) |
| Public Administration | 2 (13.3%) | 13 (86.7%) |
| Total | 226 (44.1%) | 286 (55.9%) |
Education in Flint Hill
School Enrollment in Flint Hill
The most common levels of schooling among the 249 students in Flint Hill are college / undergraduate (95 | 38.2%), middle school (84 | 33.7%), and elementary school (34 | 13.7%).
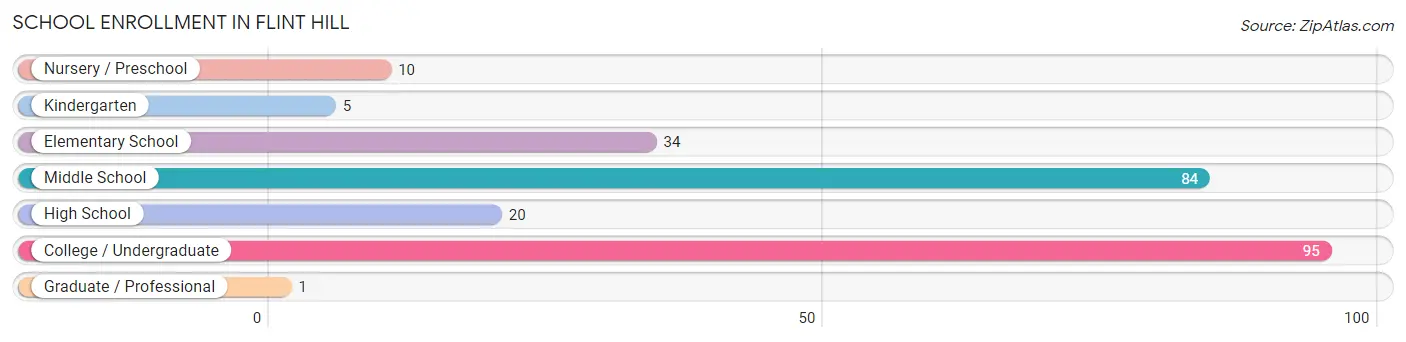
| School Level | # Students | % Students |
| Nursery / Preschool | 10 | 4.0% |
| Kindergarten | 5 | 2.0% |
| Elementary School | 34 | 13.7% |
| Middle School | 84 | 33.7% |
| High School | 20 | 8.0% |
| College / Undergraduate | 95 | 38.2% |
| Graduate / Professional | 1 | 0.4% |
| Total | 249 | 100.0% |
School Enrollment by Age by Funding Source in Flint Hill
Out of a total of 249 students who are enrolled in schools in Flint Hill, 33 (13.3%) attend a private institution, while the remaining 216 (86.7%) are enrolled in public schools. The age group of 20 to 24 year olds has the highest likelihood of being enrolled in private schools, with 6 (54.5% in the age bracket) enrolled. Conversely, the age group of 3 to 4 year olds has the lowest likelihood of being enrolled in a private school, with 6 (100.0% in the age bracket) attending a public institution.
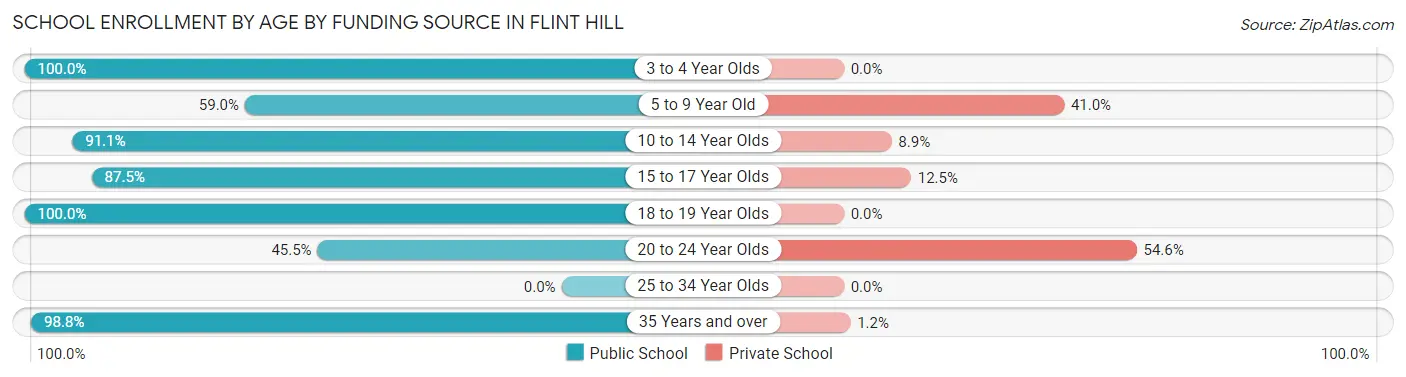
| Age Bracket | Public School | Private School |
| 3 to 4 Year Olds | 6 (100.0%) | 0 (0.0%) |
| 5 to 9 Year Old | 23 (59.0%) | 16 (41.0%) |
| 10 to 14 Year Olds | 82 (91.1%) | 8 (8.9%) |
| 15 to 17 Year Olds | 14 (87.5%) | 2 (12.5%) |
| 18 to 19 Year Olds | 5 (100.0%) | 0 (0.0%) |
| 20 to 24 Year Olds | 5 (45.5%) | 6 (54.5%) |
| 25 to 34 Year Olds | 0 (0.0%) | 0 (0.0%) |
| 35 Years and over | 81 (98.8%) | 1 (1.2%) |
| Total | 216 (86.7%) | 33 (13.3%) |
Educational Attainment by Field of Study in Flint Hill
Business (46 | 28.4%), science & technology (26 | 16.1%), bio, nature & agricultural (21 | 13.0%), education (15 | 9.3%), and arts & humanities (11 | 6.8%) are the most common fields of study among 162 individuals in Flint Hill who have obtained a bachelor's degree or higher.
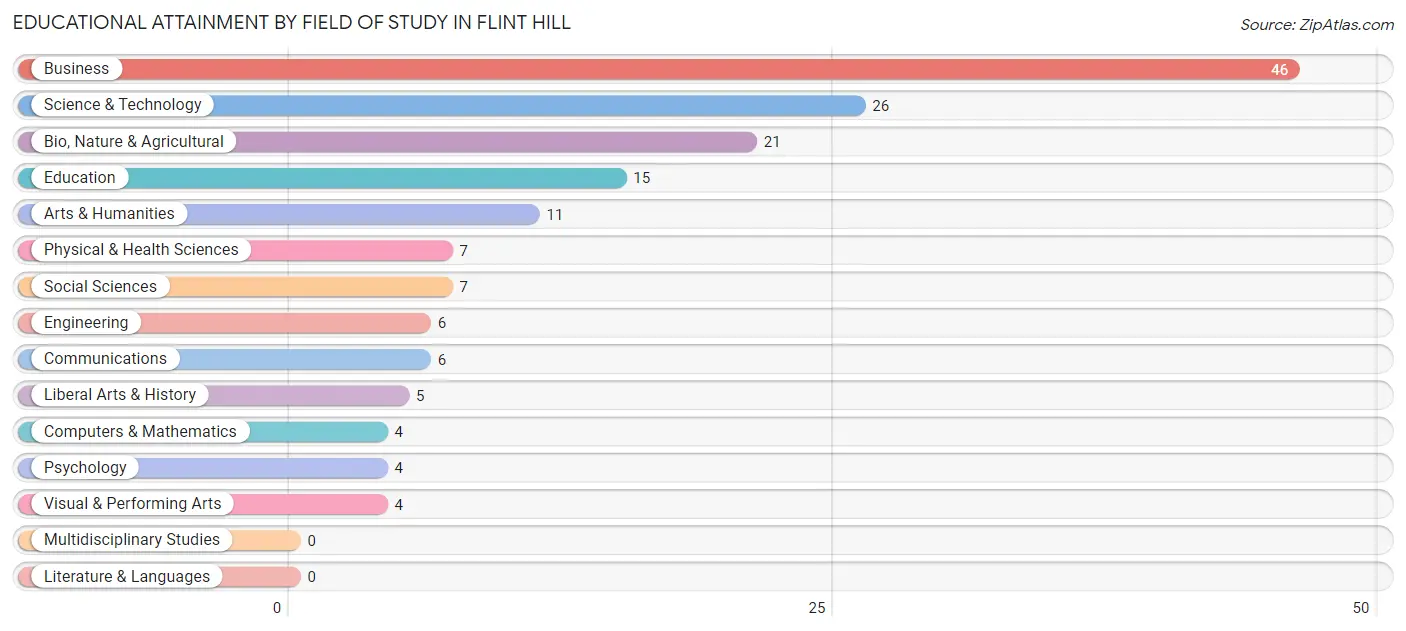
| Field of Study | # Graduates | % Graduates |
| Computers & Mathematics | 4 | 2.5% |
| Bio, Nature & Agricultural | 21 | 13.0% |
| Physical & Health Sciences | 7 | 4.3% |
| Psychology | 4 | 2.5% |
| Social Sciences | 7 | 4.3% |
| Engineering | 6 | 3.7% |
| Multidisciplinary Studies | 0 | 0.0% |
| Science & Technology | 26 | 16.1% |
| Business | 46 | 28.4% |
| Education | 15 | 9.3% |
| Literature & Languages | 0 | 0.0% |
| Liberal Arts & History | 5 | 3.1% |
| Visual & Performing Arts | 4 | 2.5% |
| Communications | 6 | 3.7% |
| Arts & Humanities | 11 | 6.8% |
| Total | 162 | 100.0% |
Transportation & Commute in Flint Hill
Vehicle Availability by Sex in Flint Hill
The most prevalent vehicle ownership categories in Flint Hill are males with 2 vehicles (85, accounting for 37.6%) and females with 2 vehicles (82, making up 29.7%).
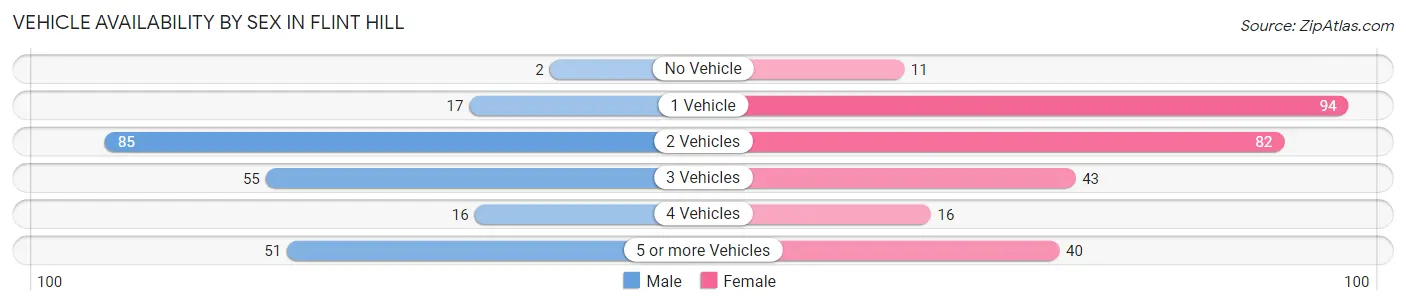
| Vehicles Available | Male | Female |
| No Vehicle | 2 (0.9%) | 11 (3.8%) |
| 1 Vehicle | 17 (7.5%) | 94 (32.9%) |
| 2 Vehicles | 85 (37.6%) | 82 (28.7%) |
| 3 Vehicles | 55 (24.3%) | 43 (15.0%) |
| 4 Vehicles | 16 (7.1%) | 16 (5.6%) |
| 5 or more Vehicles | 51 (22.6%) | 40 (14.0%) |
| Total | 226 (100.0%) | 286 (100.0%) |
Commute Time in Flint Hill
The most frequently occuring commute durations in Flint Hill are 10 to 14 minutes (96 commuters, 20.9%), 30 to 34 minutes (96 commuters, 20.9%), and 20 to 24 minutes (78 commuters, 17.0%).
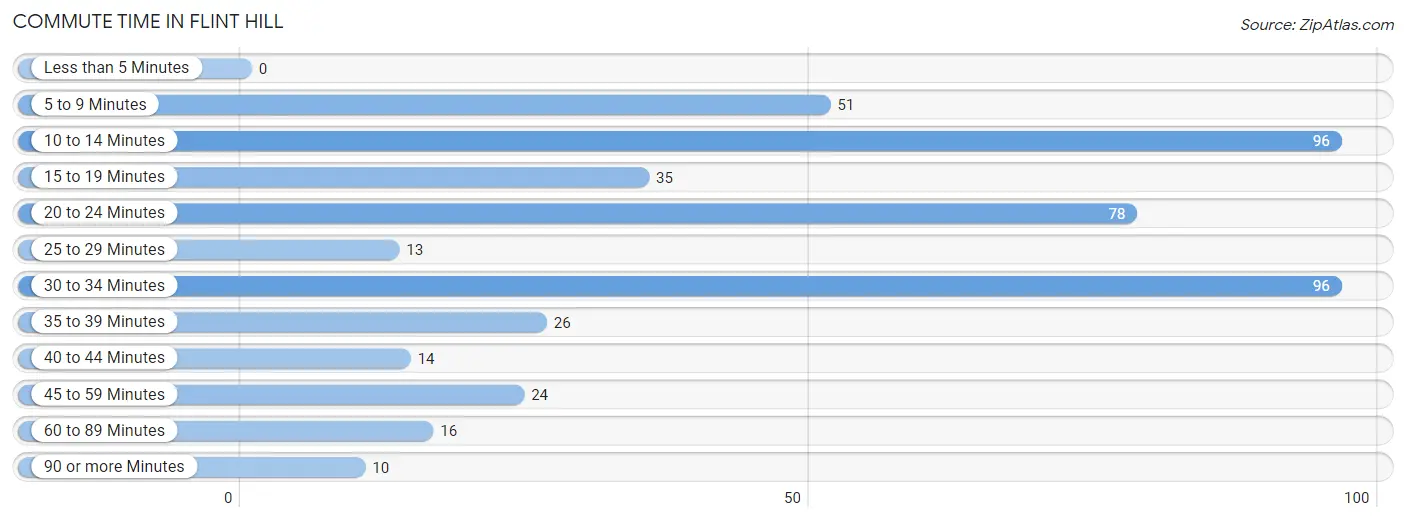
| Commute Time | # Commuters | % Commuters |
| Less than 5 Minutes | 0 | 0.0% |
| 5 to 9 Minutes | 51 | 11.1% |
| 10 to 14 Minutes | 96 | 20.9% |
| 15 to 19 Minutes | 35 | 7.6% |
| 20 to 24 Minutes | 78 | 17.0% |
| 25 to 29 Minutes | 13 | 2.8% |
| 30 to 34 Minutes | 96 | 20.9% |
| 35 to 39 Minutes | 26 | 5.7% |
| 40 to 44 Minutes | 14 | 3.0% |
| 45 to 59 Minutes | 24 | 5.2% |
| 60 to 89 Minutes | 16 | 3.5% |
| 90 or more Minutes | 10 | 2.2% |
Commute Time by Sex in Flint Hill
The most common commute times in Flint Hill are 20 to 24 minutes (55 commuters, 28.3%) for males and 10 to 14 minutes (85 commuters, 32.1%) for females.
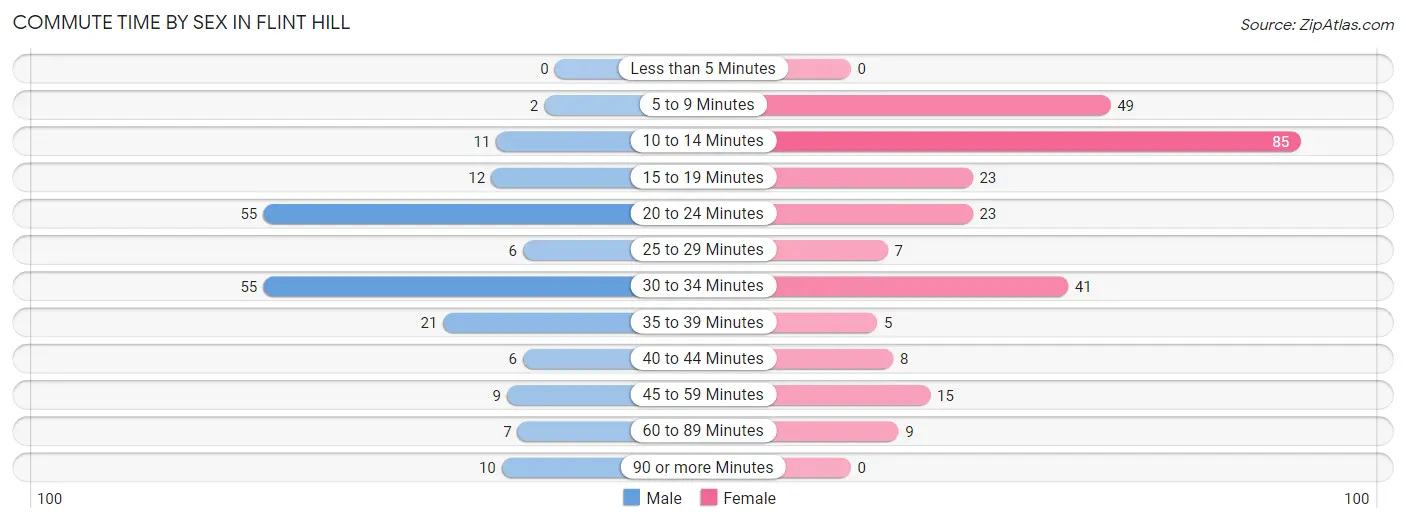
| Commute Time | Male | Female |
| Less than 5 Minutes | 0 (0.0%) | 0 (0.0%) |
| 5 to 9 Minutes | 2 (1.0%) | 49 (18.5%) |
| 10 to 14 Minutes | 11 (5.7%) | 85 (32.1%) |
| 15 to 19 Minutes | 12 (6.2%) | 23 (8.7%) |
| 20 to 24 Minutes | 55 (28.3%) | 23 (8.7%) |
| 25 to 29 Minutes | 6 (3.1%) | 7 (2.6%) |
| 30 to 34 Minutes | 55 (28.3%) | 41 (15.5%) |
| 35 to 39 Minutes | 21 (10.8%) | 5 (1.9%) |
| 40 to 44 Minutes | 6 (3.1%) | 8 (3.0%) |
| 45 to 59 Minutes | 9 (4.6%) | 15 (5.7%) |
| 60 to 89 Minutes | 7 (3.6%) | 9 (3.4%) |
| 90 or more Minutes | 10 (5.1%) | 0 (0.0%) |
Time of Departure to Work by Sex in Flint Hill
The most frequent times of departure to work in Flint Hill are 7:00 AM to 7:29 AM (82, 42.3%) for males and 7:30 AM to 7:59 AM (91, 34.3%) for females.
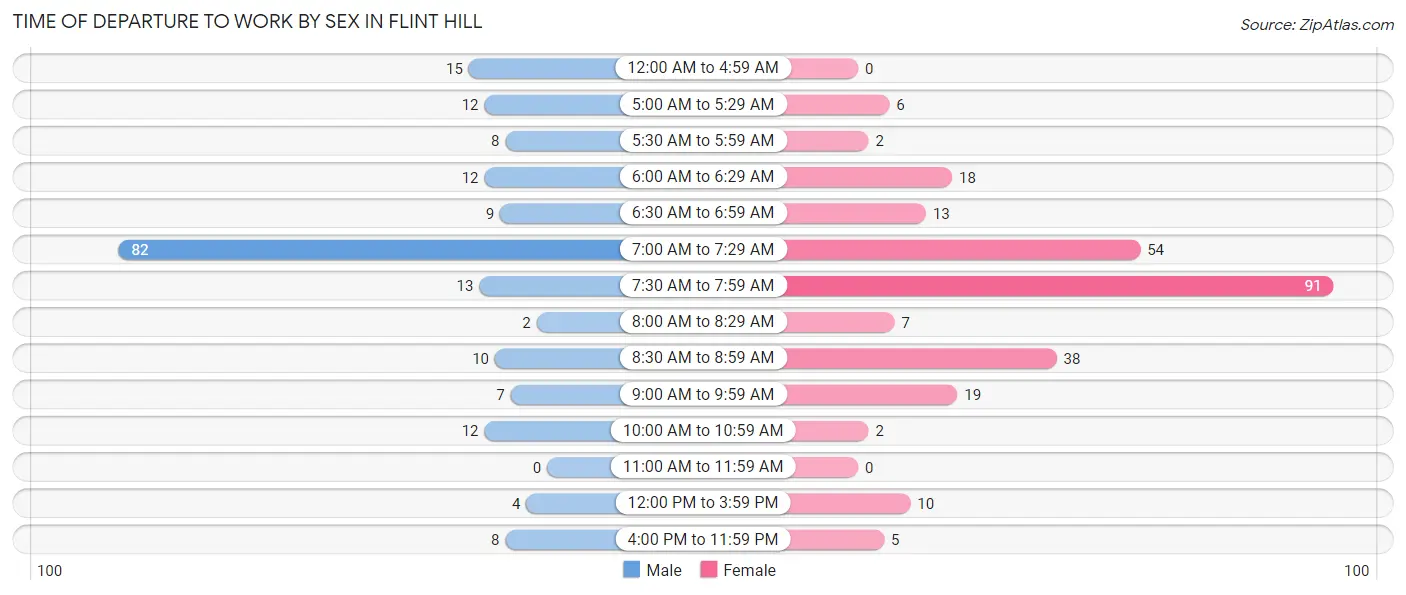
| Time of Departure | Male | Female |
| 12:00 AM to 4:59 AM | 15 (7.7%) | 0 (0.0%) |
| 5:00 AM to 5:29 AM | 12 (6.2%) | 6 (2.3%) |
| 5:30 AM to 5:59 AM | 8 (4.1%) | 2 (0.7%) |
| 6:00 AM to 6:29 AM | 12 (6.2%) | 18 (6.8%) |
| 6:30 AM to 6:59 AM | 9 (4.6%) | 13 (4.9%) |
| 7:00 AM to 7:29 AM | 82 (42.3%) | 54 (20.4%) |
| 7:30 AM to 7:59 AM | 13 (6.7%) | 91 (34.3%) |
| 8:00 AM to 8:29 AM | 2 (1.0%) | 7 (2.6%) |
| 8:30 AM to 8:59 AM | 10 (5.1%) | 38 (14.3%) |
| 9:00 AM to 9:59 AM | 7 (3.6%) | 19 (7.2%) |
| 10:00 AM to 10:59 AM | 12 (6.2%) | 2 (0.7%) |
| 11:00 AM to 11:59 AM | 0 (0.0%) | 0 (0.0%) |
| 12:00 PM to 3:59 PM | 4 (2.1%) | 10 (3.8%) |
| 4:00 PM to 11:59 PM | 8 (4.1%) | 5 (1.9%) |
| Total | 194 (100.0%) | 265 (100.0%) |
Housing Occupancy in Flint Hill
Occupancy by Ownership in Flint Hill
Of the total 453 dwellings in Flint Hill, owner-occupied units account for 334 (73.7%), while renter-occupied units make up 119 (26.3%).
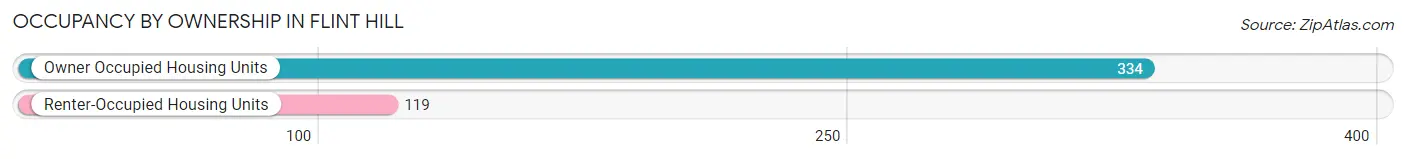
| Occupancy | # Housing Units | % Housing Units |
| Owner Occupied Housing Units | 334 | 73.7% |
| Renter-Occupied Housing Units | 119 | 26.3% |
| Total Occupied Housing Units | 453 | 100.0% |
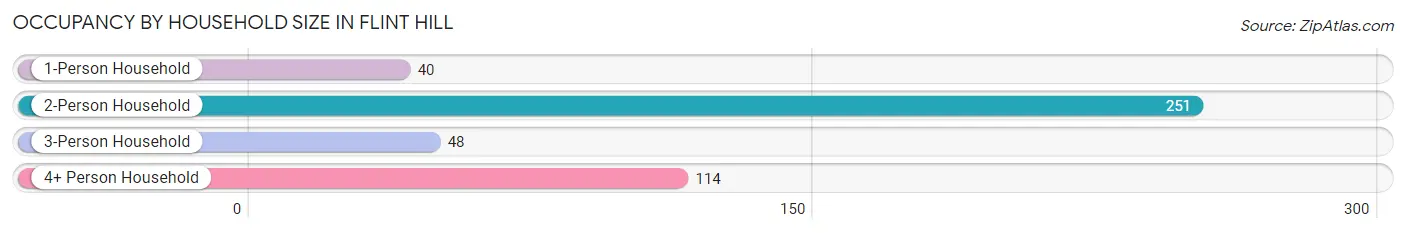
Occupancy by Household Size in Flint Hill
| Household Size | # Housing Units | % Housing Units |
| 1-Person Household | 40 | 8.8% |
| 2-Person Household | 251 | 55.4% |
| 3-Person Household | 48 | 10.6% |
| 4+ Person Household | 114 | 25.2% |
| Total Housing Units | 453 | 100.0% |
Occupancy by Ownership by Household Size in Flint Hill
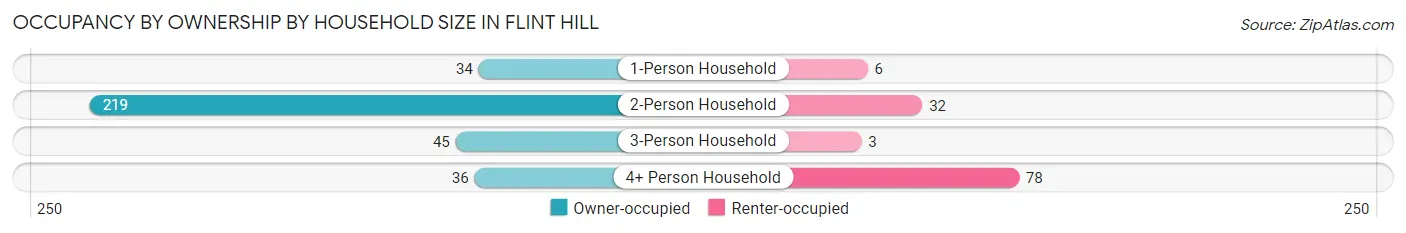
| Household Size | Owner-occupied | Renter-occupied |
| 1-Person Household | 34 (85.0%) | 6 (15.0%) |
| 2-Person Household | 219 (87.3%) | 32 (12.8%) |
| 3-Person Household | 45 (93.8%) | 3 (6.2%) |
| 4+ Person Household | 36 (31.6%) | 78 (68.4%) |
| Total Housing Units | 334 (73.7%) | 119 (26.3%) |
Occupancy by Educational Attainment in Flint Hill
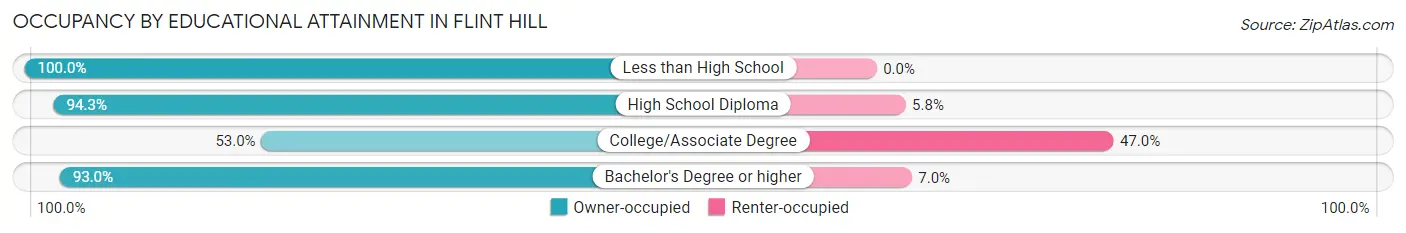
| Household Size | Owner-occupied | Renter-occupied |
| Less than High School | 50 (100.0%) | 0 (0.0%) |
| High School Diploma | 82 (94.3%) | 5 (5.8%) |
| College/Associate Degree | 122 (53.0%) | 108 (47.0%) |
| Bachelor's Degree or higher | 80 (93.0%) | 6 (7.0%) |
Occupancy by Age of Householder in Flint Hill
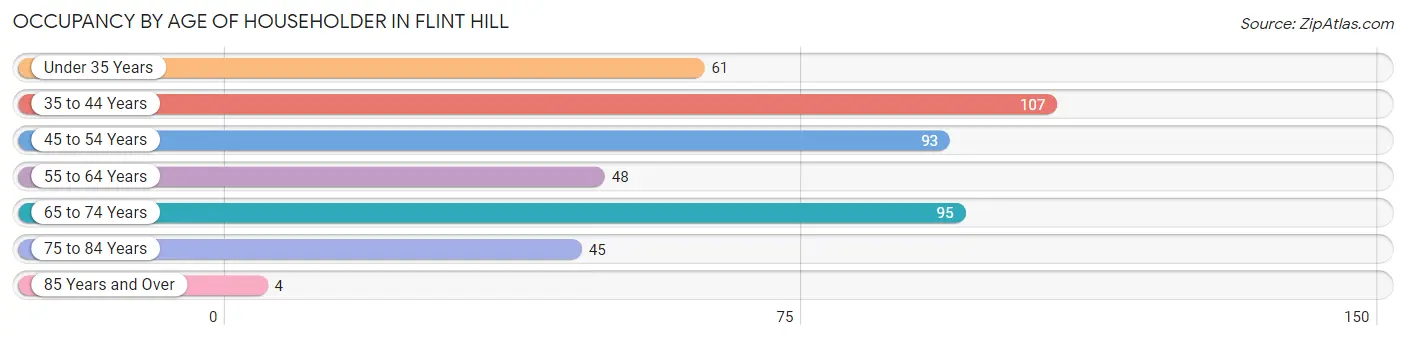
| Age Bracket | # Households | % Households |
| Under 35 Years | 61 | 13.5% |
| 35 to 44 Years | 107 | 23.6% |
| 45 to 54 Years | 93 | 20.5% |
| 55 to 64 Years | 48 | 10.6% |
| 65 to 74 Years | 95 | 21.0% |
| 75 to 84 Years | 45 | 9.9% |
| 85 Years and Over | 4 | 0.9% |
| Total | 453 | 100.0% |
Housing Finances in Flint Hill
Median Income by Occupancy in Flint Hill
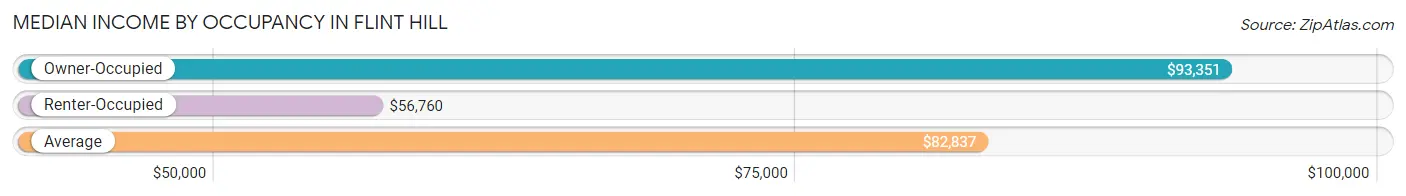
| Occupancy Type | # Households | Median Income |
| Owner-Occupied | 334 (73.7%) | $93,351 |
| Renter-Occupied | 119 (26.3%) | $56,760 |
| Average | 453 (100.0%) | $82,837 |
Occupancy by Householder Income Bracket in Flint Hill
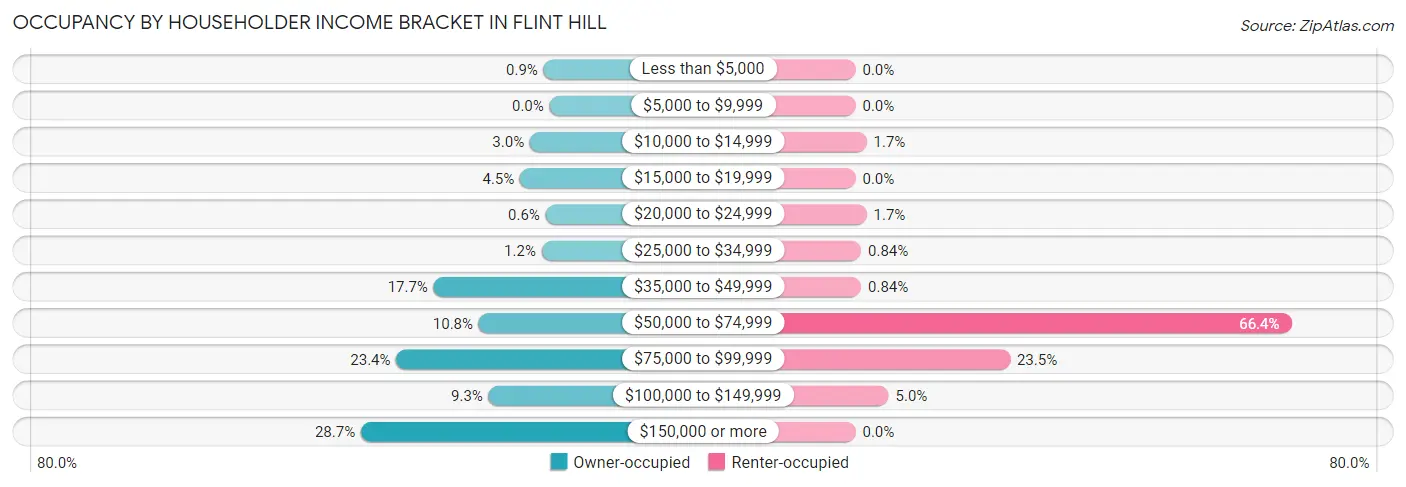
| Income Bracket | Owner-occupied | Renter-occupied |
| Less than $5,000 | 3 (0.9%) | 0 (0.0%) |
| $5,000 to $9,999 | 0 (0.0%) | 0 (0.0%) |
| $10,000 to $14,999 | 10 (3.0%) | 2 (1.7%) |
| $15,000 to $19,999 | 15 (4.5%) | 0 (0.0%) |
| $20,000 to $24,999 | 2 (0.6%) | 2 (1.7%) |
| $25,000 to $34,999 | 4 (1.2%) | 1 (0.8%) |
| $35,000 to $49,999 | 59 (17.7%) | 1 (0.8%) |
| $50,000 to $74,999 | 36 (10.8%) | 79 (66.4%) |
| $75,000 to $99,999 | 78 (23.4%) | 28 (23.5%) |
| $100,000 to $149,999 | 31 (9.3%) | 6 (5.0%) |
| $150,000 or more | 96 (28.7%) | 0 (0.0%) |
| Total | 334 (100.0%) | 119 (100.0%) |
Monthly Housing Cost Tiers in Flint Hill
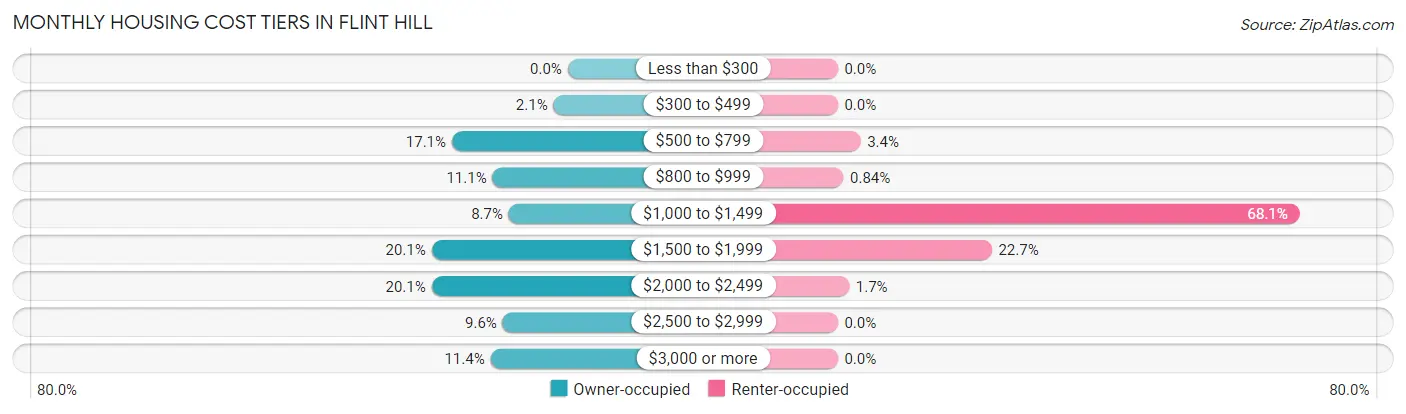
| Monthly Cost | Owner-occupied | Renter-occupied |
| Less than $300 | 0 (0.0%) | 0 (0.0%) |
| $300 to $499 | 7 (2.1%) | 0 (0.0%) |
| $500 to $799 | 57 (17.1%) | 4 (3.4%) |
| $800 to $999 | 37 (11.1%) | 1 (0.8%) |
| $1,000 to $1,499 | 29 (8.7%) | 81 (68.1%) |
| $1,500 to $1,999 | 67 (20.1%) | 27 (22.7%) |
| $2,000 to $2,499 | 67 (20.1%) | 2 (1.7%) |
| $2,500 to $2,999 | 32 (9.6%) | 0 (0.0%) |
| $3,000 or more | 38 (11.4%) | 0 (0.0%) |
| Total | 334 (100.0%) | 119 (100.0%) |
Physical Housing Characteristics in Flint Hill
Housing Structures in Flint Hill
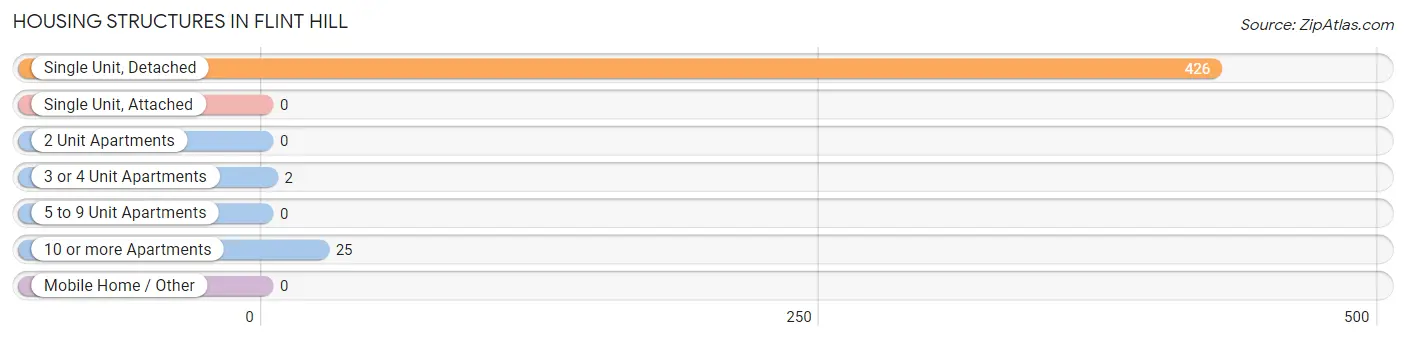
| Structure Type | # Housing Units | % Housing Units |
| Single Unit, Detached | 426 | 94.0% |
| Single Unit, Attached | 0 | 0.0% |
| 2 Unit Apartments | 0 | 0.0% |
| 3 or 4 Unit Apartments | 2 | 0.4% |
| 5 to 9 Unit Apartments | 0 | 0.0% |
| 10 or more Apartments | 25 | 5.5% |
| Mobile Home / Other | 0 | 0.0% |
| Total | 453 | 100.0% |
Housing Structures by Occupancy in Flint Hill
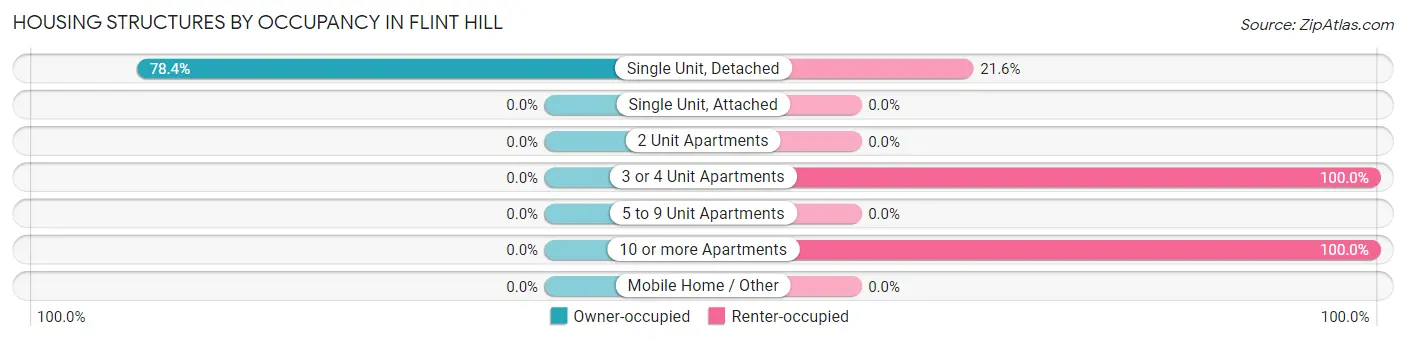
| Structure Type | Owner-occupied | Renter-occupied |
| Single Unit, Detached | 334 (78.4%) | 92 (21.6%) |
| Single Unit, Attached | 0 (0.0%) | 0 (0.0%) |
| 2 Unit Apartments | 0 (0.0%) | 0 (0.0%) |
| 3 or 4 Unit Apartments | 0 (0.0%) | 2 (100.0%) |
| 5 to 9 Unit Apartments | 0 (0.0%) | 0 (0.0%) |
| 10 or more Apartments | 0 (0.0%) | 25 (100.0%) |
| Mobile Home / Other | 0 (0.0%) | 0 (0.0%) |
| Total | 334 (73.7%) | 119 (26.3%) |
Housing Structures by Number of Rooms in Flint Hill
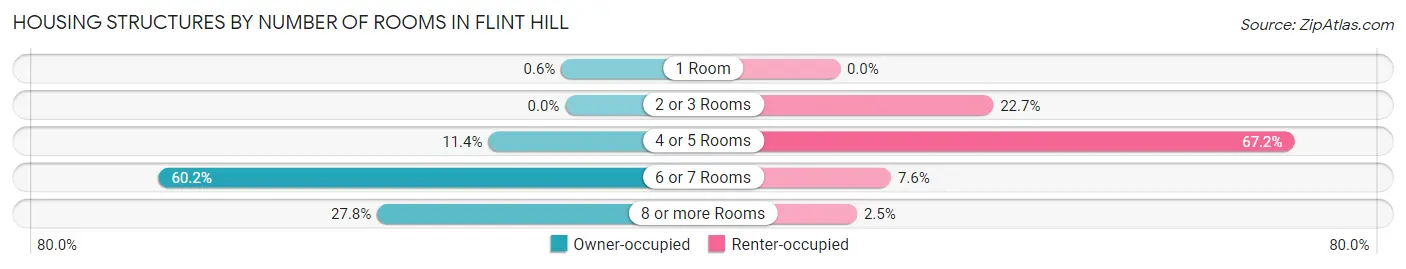
| Number of Rooms | Owner-occupied | Renter-occupied |
| 1 Room | 2 (0.6%) | 0 (0.0%) |
| 2 or 3 Rooms | 0 (0.0%) | 27 (22.7%) |
| 4 or 5 Rooms | 38 (11.4%) | 80 (67.2%) |
| 6 or 7 Rooms | 201 (60.2%) | 9 (7.6%) |
| 8 or more Rooms | 93 (27.8%) | 3 (2.5%) |
| Total | 334 (100.0%) | 119 (100.0%) |
Housing Structure by Heating Type in Flint Hill
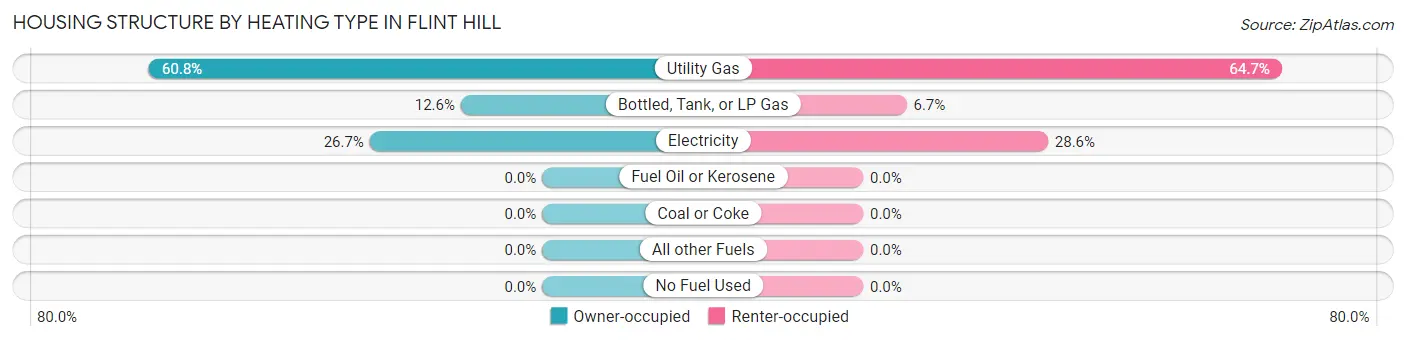
| Heating Type | Owner-occupied | Renter-occupied |
| Utility Gas | 203 (60.8%) | 77 (64.7%) |
| Bottled, Tank, or LP Gas | 42 (12.6%) | 8 (6.7%) |
| Electricity | 89 (26.7%) | 34 (28.6%) |
| Fuel Oil or Kerosene | 0 (0.0%) | 0 (0.0%) |
| Coal or Coke | 0 (0.0%) | 0 (0.0%) |
| All other Fuels | 0 (0.0%) | 0 (0.0%) |
| No Fuel Used | 0 (0.0%) | 0 (0.0%) |
| Total | 334 (100.0%) | 119 (100.0%) |
Household Vehicle Usage in Flint Hill
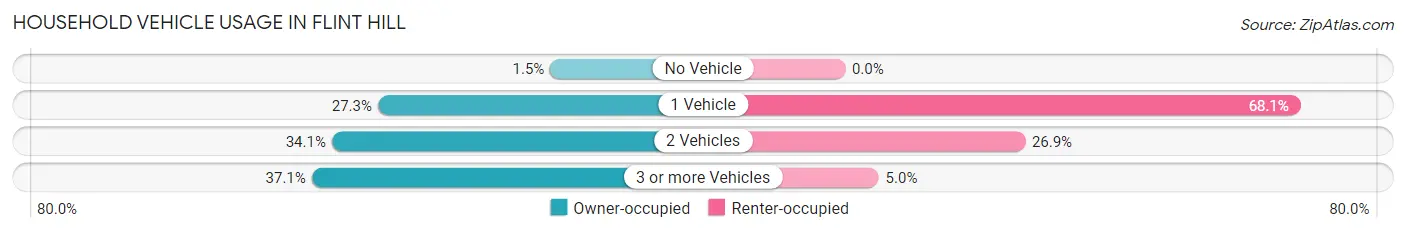
| Vehicles per Household | Owner-occupied | Renter-occupied |
| No Vehicle | 5 (1.5%) | 0 (0.0%) |
| 1 Vehicle | 91 (27.3%) | 81 (68.1%) |
| 2 Vehicles | 114 (34.1%) | 32 (26.9%) |
| 3 or more Vehicles | 124 (37.1%) | 6 (5.0%) |
| Total | 334 (100.0%) | 119 (100.0%) |
Real Estate & Mortgages in Flint Hill
Real Estate and Mortgage Overview in Flint Hill
| Characteristic | Without Mortgage | With Mortgage |
| Housing Units | 93 | 241 |
| Median Property Value | $350,000 | $297,100 |
| Median Household Income | $68,125 | $78 |
| Monthly Housing Costs | $745 | $38 |
| Real Estate Taxes | $3,766 | $3 |
Property Value by Mortgage Status in Flint Hill
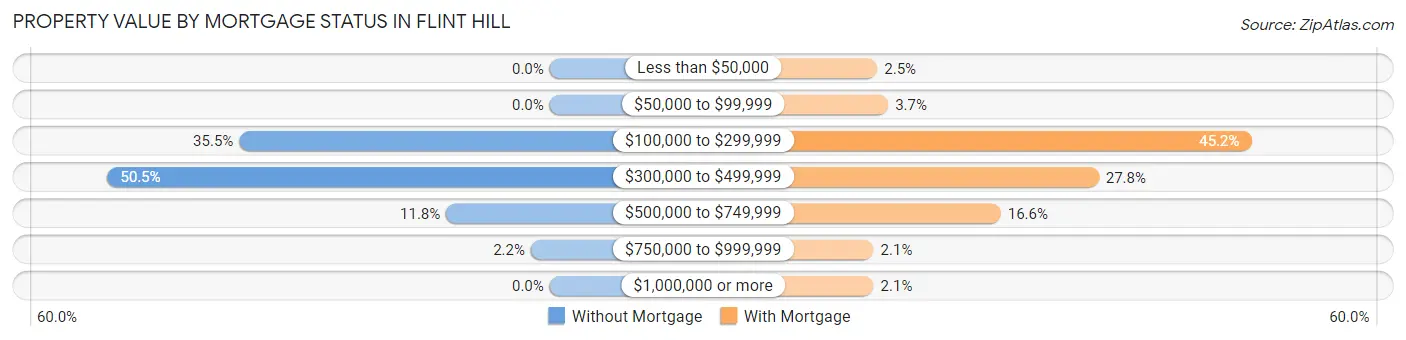
| Property Value | Without Mortgage | With Mortgage |
| Less than $50,000 | 0 (0.0%) | 6 (2.5%) |
| $50,000 to $99,999 | 0 (0.0%) | 9 (3.7%) |
| $100,000 to $299,999 | 33 (35.5%) | 109 (45.2%) |
| $300,000 to $499,999 | 47 (50.5%) | 67 (27.8%) |
| $500,000 to $749,999 | 11 (11.8%) | 40 (16.6%) |
| $750,000 to $999,999 | 2 (2.1%) | 5 (2.1%) |
| $1,000,000 or more | 0 (0.0%) | 5 (2.1%) |
| Total | 93 (100.0%) | 241 (100.0%) |
Household Income by Mortgage Status in Flint Hill
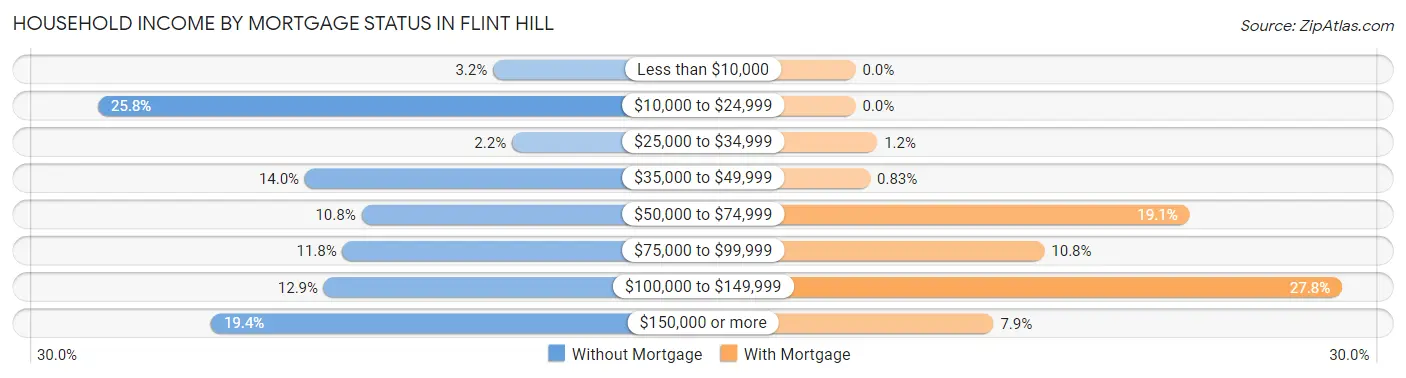
| Household Income | Without Mortgage | With Mortgage |
| Less than $10,000 | 3 (3.2%) | 0 (0.0%) |
| $10,000 to $24,999 | 24 (25.8%) | 0 (0.0%) |
| $25,000 to $34,999 | 2 (2.1%) | 3 (1.2%) |
| $35,000 to $49,999 | 13 (14.0%) | 2 (0.8%) |
| $50,000 to $74,999 | 10 (10.7%) | 46 (19.1%) |
| $75,000 to $99,999 | 11 (11.8%) | 26 (10.8%) |
| $100,000 to $149,999 | 12 (12.9%) | 67 (27.8%) |
| $150,000 or more | 18 (19.4%) | 19 (7.9%) |
| Total | 93 (100.0%) | 241 (100.0%) |
Property Value to Household Income Ratio in Flint Hill
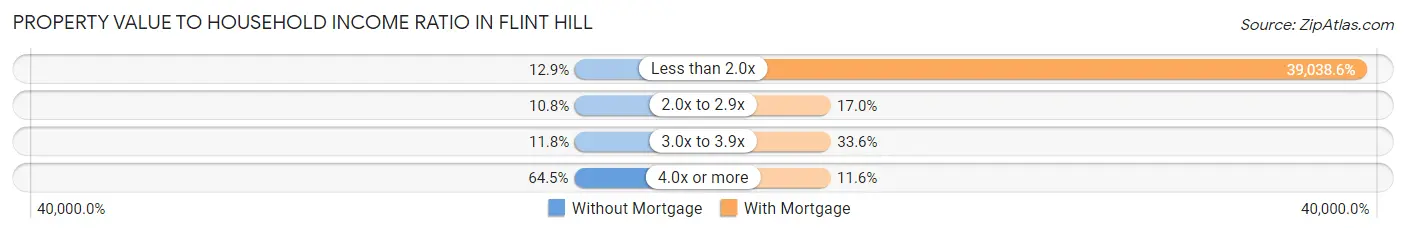
| Value-to-Income Ratio | Without Mortgage | With Mortgage |
| Less than 2.0x | 12 (12.9%) | 94,083 (39,038.6%) |
| 2.0x to 2.9x | 10 (10.7%) | 41 (17.0%) |
| 3.0x to 3.9x | 11 (11.8%) | 81 (33.6%) |
| 4.0x or more | 60 (64.5%) | 28 (11.6%) |
| Total | 93 (100.0%) | 241 (100.0%) |
Real Estate Taxes by Mortgage Status in Flint Hill
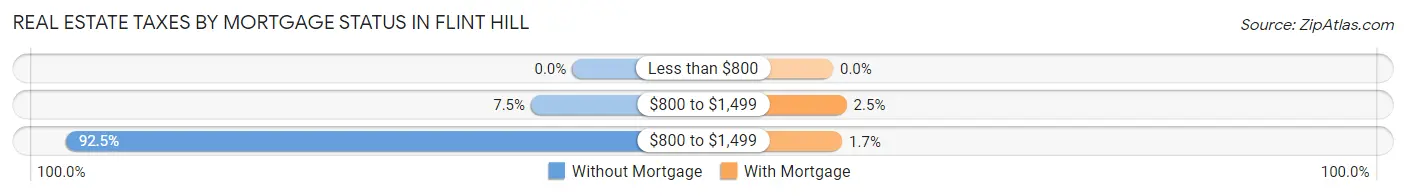
| Property Taxes | Without Mortgage | With Mortgage |
| Less than $800 | 0 (0.0%) | 0 (0.0%) |
| $800 to $1,499 | 7 (7.5%) | 6 (2.5%) |
| $800 to $1,499 | 86 (92.5%) | 4 (1.7%) |
| Total | 93 (100.0%) | 241 (100.0%) |
Health & Disability in Flint Hill
Health Insurance Coverage by Age in Flint Hill
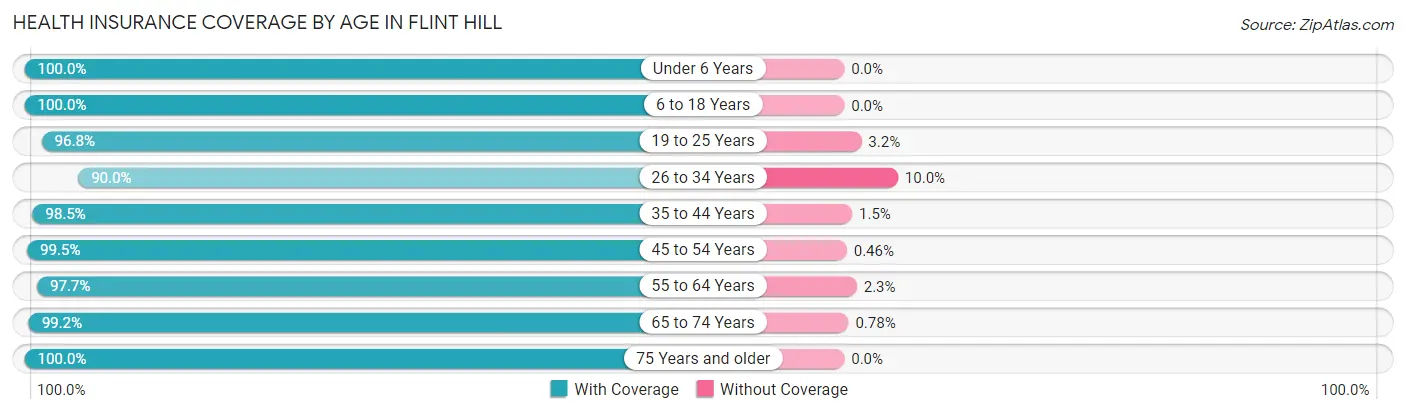
| Age Bracket | With Coverage | Without Coverage |
| Under 6 Years | 47 (100.0%) | 0 (0.0%) |
| 6 to 18 Years | 143 (100.0%) | 0 (0.0%) |
| 19 to 25 Years | 91 (96.8%) | 3 (3.2%) |
| 26 to 34 Years | 54 (90.0%) | 6 (10.0%) |
| 35 to 44 Years | 135 (98.5%) | 2 (1.5%) |
| 45 to 54 Years | 217 (99.5%) | 1 (0.5%) |
| 55 to 64 Years | 126 (97.7%) | 3 (2.3%) |
| 65 to 74 Years | 127 (99.2%) | 1 (0.8%) |
| 75 Years and older | 85 (100.0%) | 0 (0.0%) |
| Total | 1,025 (98.5%) | 16 (1.5%) |
Health Insurance Coverage by Citizenship Status in Flint Hill
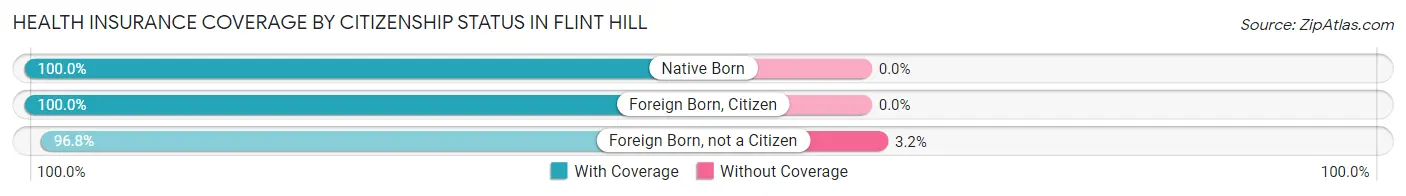
| Citizenship Status | With Coverage | Without Coverage |
| Native Born | 47 (100.0%) | 0 (0.0%) |
| Foreign Born, Citizen | 143 (100.0%) | 0 (0.0%) |
| Foreign Born, not a Citizen | 91 (96.8%) | 3 (3.2%) |
Health Insurance Coverage by Household Income in Flint Hill
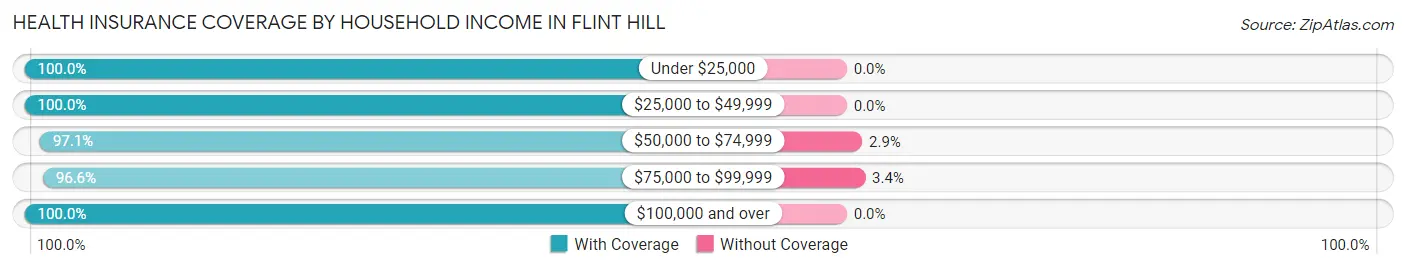
| Household Income | With Coverage | Without Coverage |
| Under $25,000 | 61 (100.0%) | 0 (0.0%) |
| $25,000 to $49,999 | 131 (100.0%) | 0 (0.0%) |
| $50,000 to $74,999 | 237 (97.1%) | 7 (2.9%) |
| $75,000 to $99,999 | 225 (96.6%) | 8 (3.4%) |
| $100,000 and over | 371 (100.0%) | 0 (0.0%) |
Public vs Private Health Insurance Coverage by Age in Flint Hill
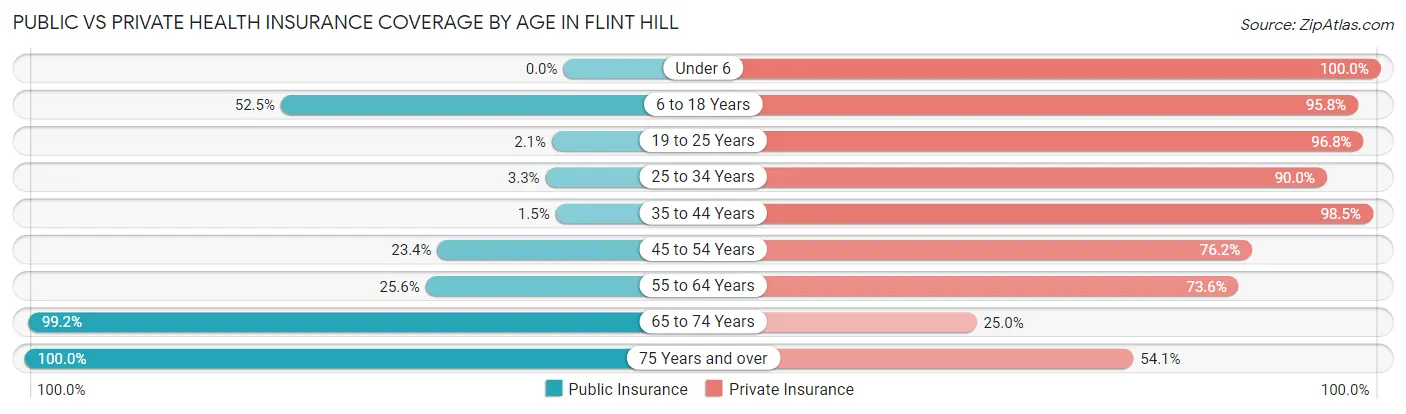
| Age Bracket | Public Insurance | Private Insurance |
| Under 6 | 0 (0.0%) | 47 (100.0%) |
| 6 to 18 Years | 75 (52.4%) | 137 (95.8%) |
| 19 to 25 Years | 2 (2.1%) | 91 (96.8%) |
| 25 to 34 Years | 2 (3.3%) | 54 (90.0%) |
| 35 to 44 Years | 2 (1.5%) | 135 (98.5%) |
| 45 to 54 Years | 51 (23.4%) | 166 (76.1%) |
| 55 to 64 Years | 33 (25.6%) | 95 (73.6%) |
| 65 to 74 Years | 127 (99.2%) | 32 (25.0%) |
| 75 Years and over | 85 (100.0%) | 46 (54.1%) |
| Total | 377 (36.2%) | 803 (77.1%) |
Disability Status by Sex by Age in Flint Hill
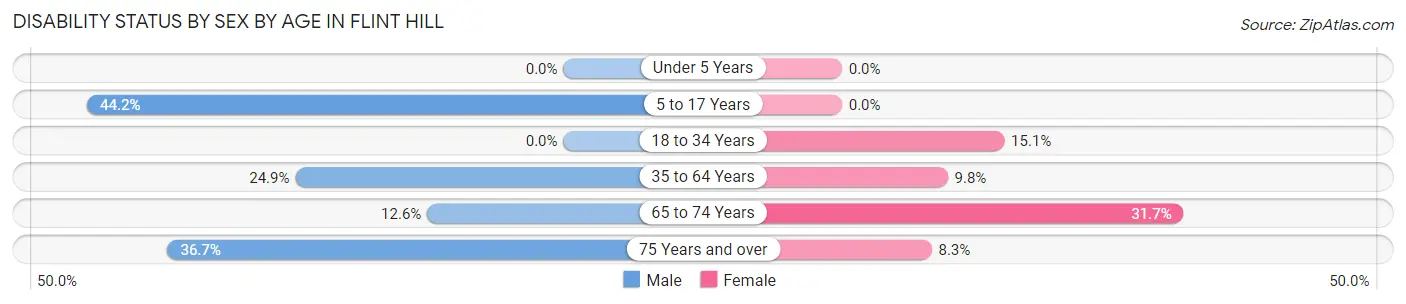
| Age Bracket | Male | Female |
| Under 5 Years | 0 (0.0%) | 0 (0.0%) |
| 5 to 17 Years | 38 (44.2%) | 0 (0.0%) |
| 18 to 34 Years | 0 (0.0%) | 11 (15.1%) |
| 35 to 64 Years | 52 (24.9%) | 27 (9.8%) |
| 65 to 74 Years | 11 (12.6%) | 13 (31.7%) |
| 75 Years and over | 18 (36.7%) | 3 (8.3%) |
Disability Class by Sex by Age in Flint Hill
Disability Class: Hearing Difficulty
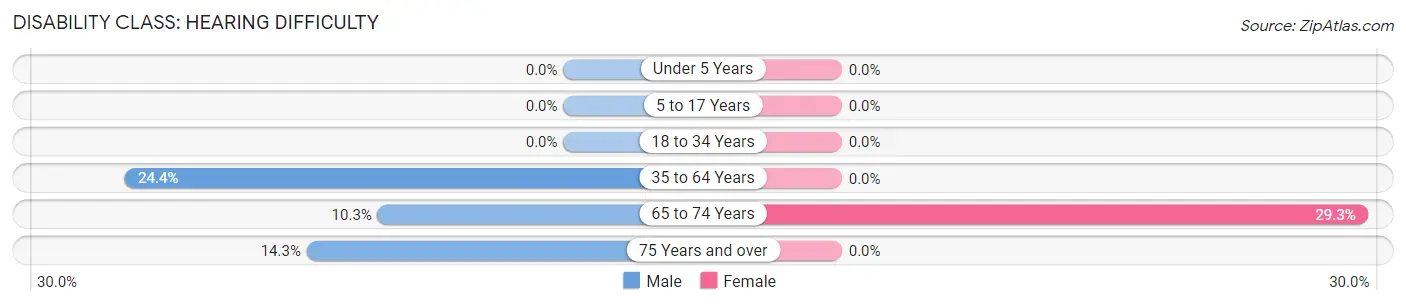
| Age Bracket | Male | Female |
| Under 5 Years | 0 (0.0%) | 0 (0.0%) |
| 5 to 17 Years | 0 (0.0%) | 0 (0.0%) |
| 18 to 34 Years | 0 (0.0%) | 0 (0.0%) |
| 35 to 64 Years | 51 (24.4%) | 0 (0.0%) |
| 65 to 74 Years | 9 (10.3%) | 12 (29.3%) |
| 75 Years and over | 7 (14.3%) | 0 (0.0%) |
Disability Class: Vision Difficulty
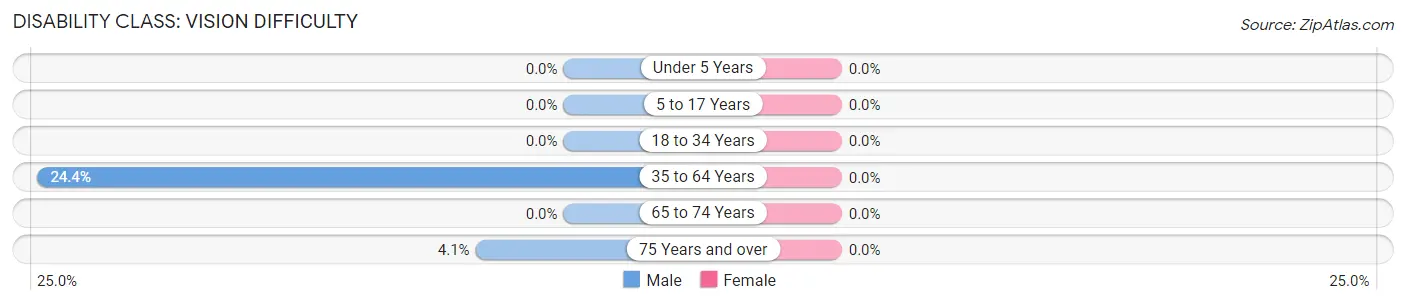
| Age Bracket | Male | Female |
| Under 5 Years | 0 (0.0%) | 0 (0.0%) |
| 5 to 17 Years | 0 (0.0%) | 0 (0.0%) |
| 18 to 34 Years | 0 (0.0%) | 0 (0.0%) |
| 35 to 64 Years | 51 (24.4%) | 0 (0.0%) |
| 65 to 74 Years | 0 (0.0%) | 0 (0.0%) |
| 75 Years and over | 2 (4.1%) | 0 (0.0%) |
Disability Class: Cognitive Difficulty
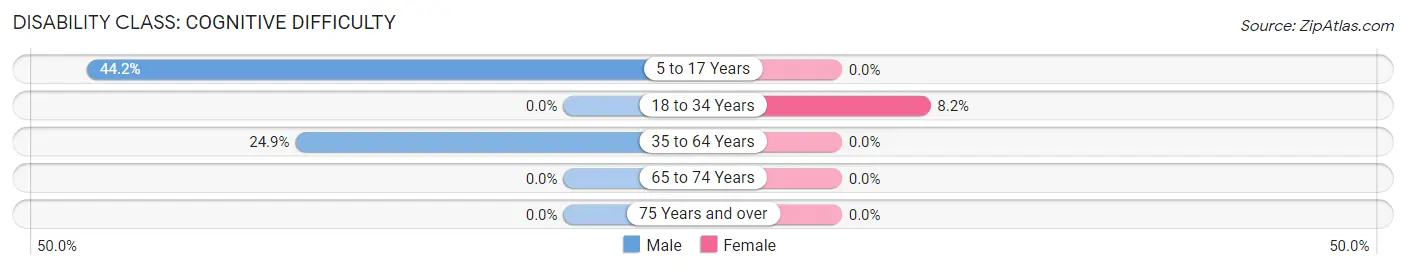
| Age Bracket | Male | Female |
| 5 to 17 Years | 38 (44.2%) | 0 (0.0%) |
| 18 to 34 Years | 0 (0.0%) | 6 (8.2%) |
| 35 to 64 Years | 52 (24.9%) | 0 (0.0%) |
| 65 to 74 Years | 0 (0.0%) | 0 (0.0%) |
| 75 Years and over | 0 (0.0%) | 0 (0.0%) |
Disability Class: Ambulatory Difficulty
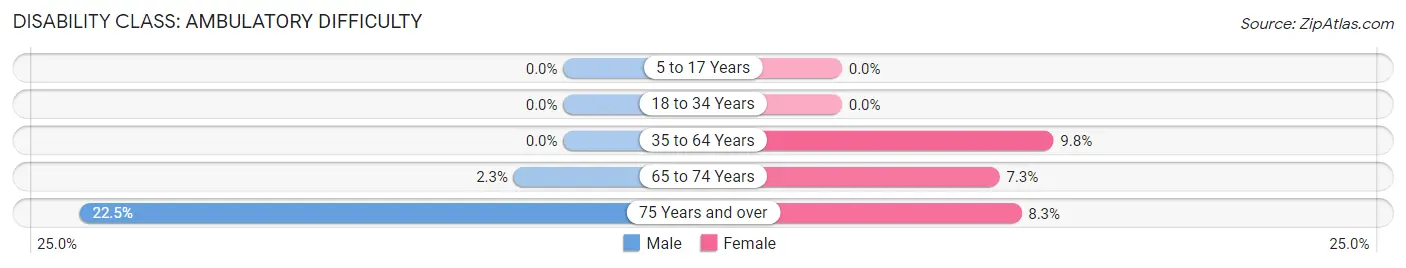
| Age Bracket | Male | Female |
| 5 to 17 Years | 0 (0.0%) | 0 (0.0%) |
| 18 to 34 Years | 0 (0.0%) | 0 (0.0%) |
| 35 to 64 Years | 0 (0.0%) | 27 (9.8%) |
| 65 to 74 Years | 2 (2.3%) | 3 (7.3%) |
| 75 Years and over | 11 (22.5%) | 3 (8.3%) |
Disability Class: Self-Care Difficulty
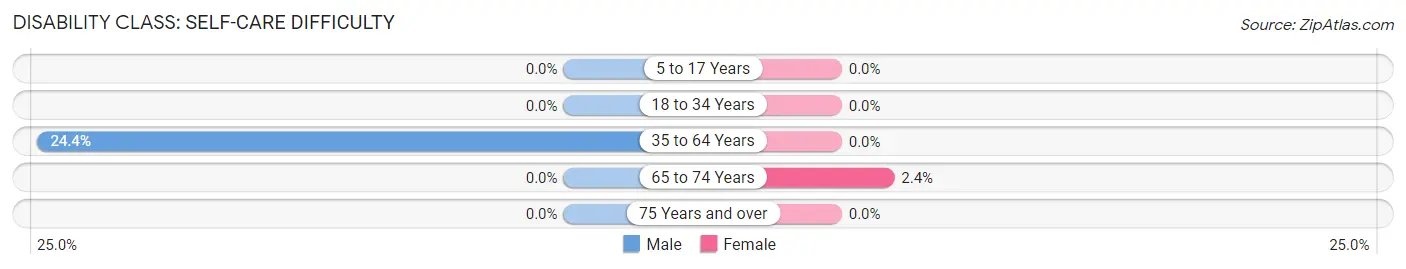
| Age Bracket | Male | Female |
| 5 to 17 Years | 0 (0.0%) | 0 (0.0%) |
| 18 to 34 Years | 0 (0.0%) | 0 (0.0%) |
| 35 to 64 Years | 51 (24.4%) | 0 (0.0%) |
| 65 to 74 Years | 0 (0.0%) | 1 (2.4%) |
| 75 Years and over | 0 (0.0%) | 0 (0.0%) |
Technology Access in Flint Hill
Computing Device Access in Flint Hill
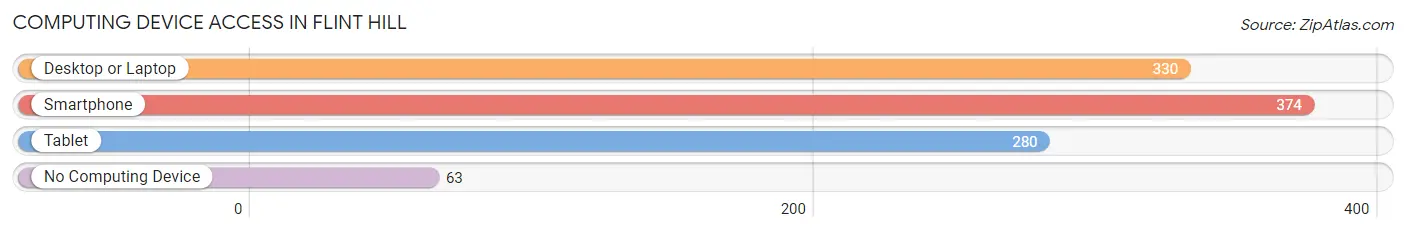
| Device Type | # Households | % Households |
| Desktop or Laptop | 330 | 72.9% |
| Smartphone | 374 | 82.6% |
| Tablet | 280 | 61.8% |
| No Computing Device | 63 | 13.9% |
| Total | 453 | 100.0% |
Internet Access in Flint Hill
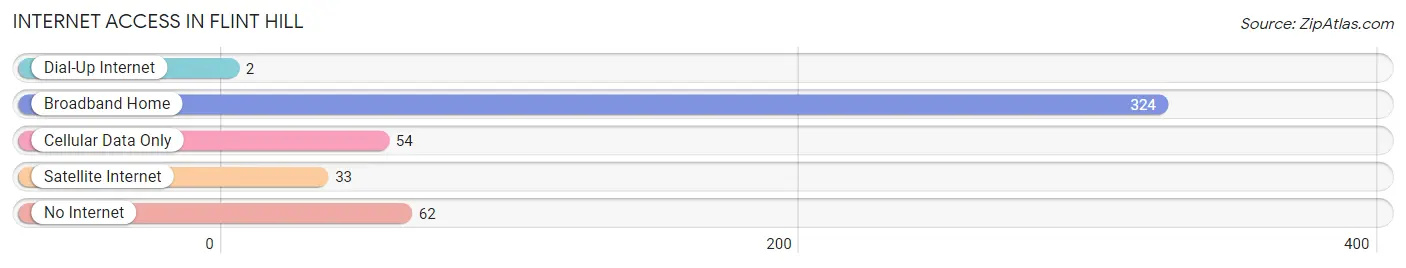
| Internet Type | # Households | % Households |
| Dial-Up Internet | 2 | 0.4% |
| Broadband Home | 324 | 71.5% |
| Cellular Data Only | 54 | 11.9% |
| Satellite Internet | 33 | 7.3% |
| No Internet | 62 | 13.7% |
| Total | 453 | 100.0% |
Flint Hill Summary
Flint Hill is a small unincorporated community located in Warren County, Missouri. It is situated in the foothills of the Ozark Mountains, approximately 25 miles west of St. Louis. The community is home to a population of approximately 500 people, and is known for its rural charm and small-town atmosphere.
History
Flint Hill was first settled in the early 1800s by a group of German immigrants. The town was originally known as “Flint Hill” due to the abundance of flint stones in the area. The town was officially incorporated in 1872, and the first post office was established in 1873.
In the late 1800s, Flint Hill was a thriving agricultural community, with many of the residents working in the local farms and orchards. The town also had a number of small businesses, including a general store, a blacksmith shop, and a sawmill.
In the early 1900s, the town began to decline as many of the residents moved away in search of better economic opportunities. The population of Flint Hill dropped to just over 200 people by the 1950s.
Geography
Flint Hill is located in the foothills of the Ozark Mountains, approximately 25 miles west of St. Louis. The town is situated on the banks of the Missouri River, and is surrounded by rolling hills and lush forests.
The climate in Flint Hill is humid and subtropical, with hot summers and mild winters. The average annual temperature is around 60 degrees Fahrenheit, and the average annual precipitation is around 40 inches.
Economy
The economy of Flint Hill is largely based on agriculture and tourism. The town is home to several small farms and orchards, which produce a variety of fruits and vegetables. The town also has a number of small businesses, including a general store, a gas station, and a few restaurants.
Tourism is also an important part of the local economy. The town is home to several historic sites, including the Flint Hill Cemetery and the Flint Hill Schoolhouse. The town also hosts a number of annual events, including the Flint Hill Fair and the Flint Hill Music Festival.
Demographics
As of the 2010 census, the population of Flint Hill was 498 people. The racial makeup of the town was 97.2% White, 0.6% African American, 0.2% Native American, 0.2% Asian, 0.2% from other races, and 1.8% from two or more races.
The median household income in Flint Hill was $45,000, and the median family income was $50,000. The per capita income was $20,000. Approximately 10.2% of the population was below the poverty line.
Flint Hill is a small, rural community with a rich history and a unique culture. The town is home to a diverse population of people, and offers a variety of activities and attractions for visitors and residents alike.
Common Questions
What is Per Capita Income in Flint Hill?
Per Capita income in Flint Hill is $49,609.
What is the Median Family Income in Flint Hill?
Median Family Income in Flint Hill is $78,214.
What is the Median Household income in Flint Hill?
Median Household Income in Flint Hill is $82,837.
What is Income or Wage Gap in Flint Hill?
Income or Wage Gap in Flint Hill is 30.1%.
Women in Flint Hill earn 69.9 cents for every dollar earned by a man.
What is Inequality or Gini Index in Flint Hill?
Inequality or Gini Index in Flint Hill is 0.44.
What is the Total Population of Flint Hill?
Total Population of Flint Hill is 1,041.
What is the Total Male Population of Flint Hill?
Total Male Population of Flint Hill is 535.
What is the Total Female Population of Flint Hill?
Total Female Population of Flint Hill is 506.
What is the Ratio of Males per 100 Females in Flint Hill?
There are 105.73 Males per 100 Females in Flint Hill.
What is the Ratio of Females per 100 Males in Flint Hill?
There are 94.58 Females per 100 Males in Flint Hill.
What is the Median Population Age in Flint Hill?
Median Population Age in Flint Hill is 47.4 Years.
What is the Average Family Size in Flint Hill
Average Family Size in Flint Hill is 2.4 People.
What is the Average Household Size in Flint Hill
Average Household Size in Flint Hill is 2.3 People.
How Large is the Labor Force in Flint Hill?
There are 517 People in the Labor Forcein in Flint Hill.
What is the Percentage of People in the Labor Force in Flint Hill?
59.8% of People are in the Labor Force in Flint Hill.
What is the Unemployment Rate in Flint Hill?
Unemployment Rate in Flint Hill is 1.0%.