Jenkins, MN Map & Demographics
Jenkins Map
Jenkins Overview
$33,712
PER CAPITA INCOME
$88,125
AVG FAMILY INCOME
$61,806
AVG HOUSEHOLD INCOME
27.7%
WAGE / INCOME GAP [ % ]
72.3¢/ $1
WAGE / INCOME GAP [ $ ]
0.44
INEQUALITY / GINI INDEX
457
TOTAL POPULATION
221
MALE POPULATION
236
FEMALE POPULATION
93.64
MALES / 100 FEMALES
106.79
FEMALES / 100 MALES
33.6
MEDIAN AGE
3.2
AVG FAMILY SIZE
2.7
AVG HOUSEHOLD SIZE
257
LABOR FORCE [ PEOPLE ]
78.4%
PERCENT IN LABOR FORCE
3.1%
UNEMPLOYMENT RATE
Jenkins Area Codes
Income in Jenkins
Income Overview in Jenkins
Per Capita Income in Jenkins is $33,712, while median incomes of families and households are $88,125 and $61,806 respectively.
| Characteristic | Number | Measure |
| Per Capita Income | 457 | $33,712 |
| Median Family Income | 129 | $88,125 |
| Mean Family Income | 129 | $106,166 |
| Median Household Income | 169 | $61,806 |
| Mean Household Income | 169 | $93,523 |
| Income Deficit | 129 | $0 |
| Wage / Income Gap (%) | 457 | 27.70% |
| Wage / Income Gap ($) | 457 | 72.30¢ per $1 |
| Gini / Inequality Index | 457 | 0.44 |
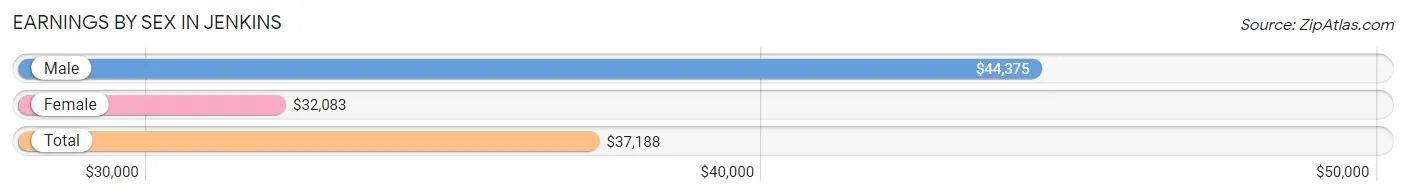
Earnings by Sex in Jenkins
Average Earnings in Jenkins are $37,188, $44,375 for men and $32,083 for women, a difference of 27.7%.
| Sex | Number | Average Earnings |
| Male | 136 (51.1%) | $44,375 |
| Female | 130 (48.9%) | $32,083 |
| Total | 266 (100.0%) | $37,188 |
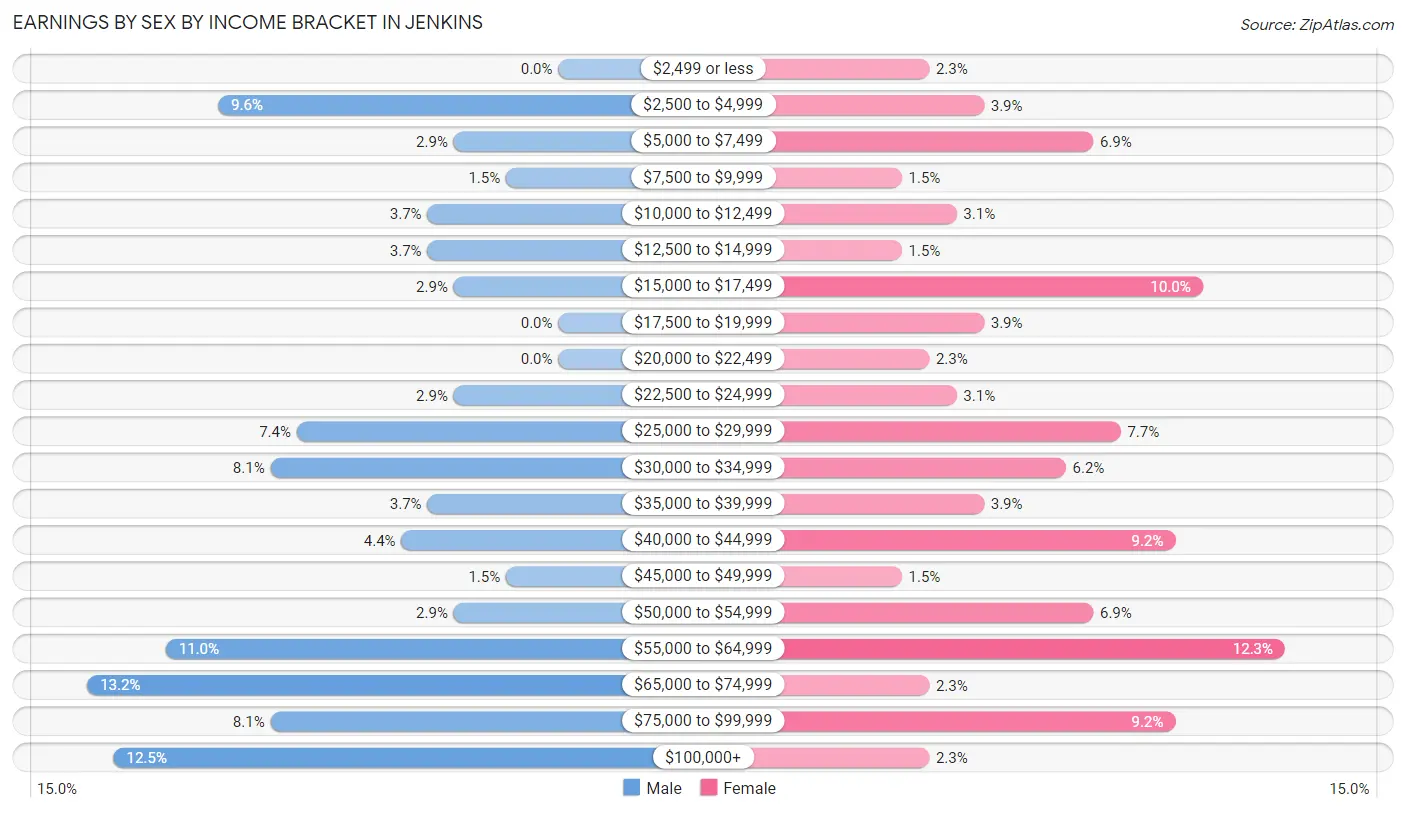
Earnings by Sex by Income Bracket in Jenkins
The most common earnings brackets in Jenkins are $65,000 to $74,999 for men (18 | 13.2%) and $55,000 to $64,999 for women (16 | 12.3%).
| Income | Male | Female |
| $2,499 or less | 0 (0.0%) | 3 (2.3%) |
| $2,500 to $4,999 | 13 (9.6%) | 5 (3.8%) |
| $5,000 to $7,499 | 4 (2.9%) | 9 (6.9%) |
| $7,500 to $9,999 | 2 (1.5%) | 2 (1.5%) |
| $10,000 to $12,499 | 5 (3.7%) | 4 (3.1%) |
| $12,500 to $14,999 | 5 (3.7%) | 2 (1.5%) |
| $15,000 to $17,499 | 4 (2.9%) | 13 (10.0%) |
| $17,500 to $19,999 | 0 (0.0%) | 5 (3.8%) |
| $20,000 to $22,499 | 0 (0.0%) | 3 (2.3%) |
| $22,500 to $24,999 | 4 (2.9%) | 4 (3.1%) |
| $25,000 to $29,999 | 10 (7.3%) | 10 (7.7%) |
| $30,000 to $34,999 | 11 (8.1%) | 8 (6.1%) |
| $35,000 to $39,999 | 5 (3.7%) | 5 (3.8%) |
| $40,000 to $44,999 | 6 (4.4%) | 12 (9.2%) |
| $45,000 to $49,999 | 2 (1.5%) | 2 (1.5%) |
| $50,000 to $54,999 | 4 (2.9%) | 9 (6.9%) |
| $55,000 to $64,999 | 15 (11.0%) | 16 (12.3%) |
| $65,000 to $74,999 | 18 (13.2%) | 3 (2.3%) |
| $75,000 to $99,999 | 11 (8.1%) | 12 (9.2%) |
| $100,000+ | 17 (12.5%) | 3 (2.3%) |
| Total | 136 (100.0%) | 130 (100.0%) |
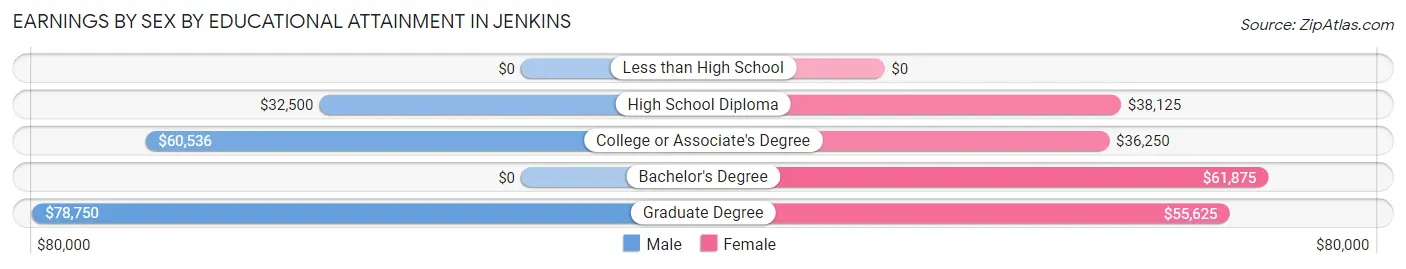
Earnings by Sex by Educational Attainment in Jenkins
Average earnings in Jenkins are $53,438 for men and $39,375 for women, a difference of 26.3%. Men with an educational attainment of graduate degree enjoy the highest average annual earnings of $78,750, while those with high school diploma education earn the least with $32,500. Women with an educational attainment of bachelor's degree earn the most with the average annual earnings of $61,875, while those with college or associate's degree education have the smallest earnings of $36,250.
| Educational Attainment | Male Income | Female Income |
| Less than High School | - | - |
| High School Diploma | $32,500 | $38,125 |
| College or Associate's Degree | $60,536 | $36,250 |
| Bachelor's Degree | - | - |
| Graduate Degree | $78,750 | $55,625 |
| Total | $53,438 | $39,375 |
Family Income in Jenkins
Family Income Brackets in Jenkins
According to the Jenkins family income data, there are 36 families falling into the $100,000 to $149,999 income range, which is the most common income bracket and makes up 27.9% of all families.
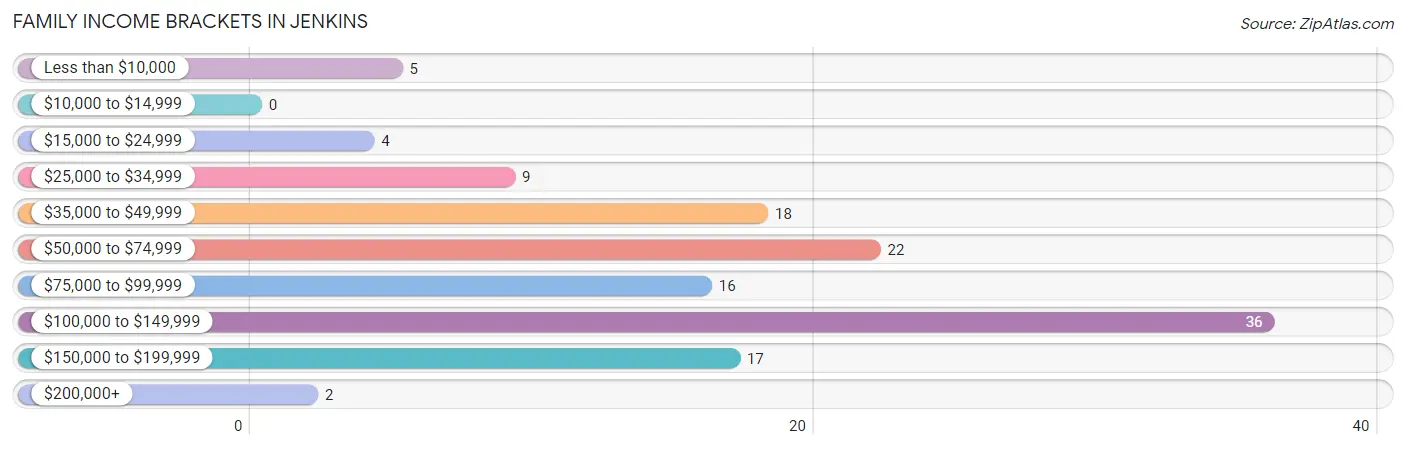
| Income Bracket | # Families | % Families |
| Less than $10,000 | 5 | 3.9% |
| $10,000 to $14,999 | 0 | 0.0% |
| $15,000 to $24,999 | 4 | 3.1% |
| $25,000 to $34,999 | 9 | 7.0% |
| $35,000 to $49,999 | 18 | 14.0% |
| $50,000 to $74,999 | 22 | 17.1% |
| $75,000 to $99,999 | 16 | 12.4% |
| $100,000 to $149,999 | 36 | 27.9% |
| $150,000 to $199,999 | 17 | 13.2% |
| $200,000+ | 2 | 1.6% |
Family Income by Famaliy Size in Jenkins
4-person families (32 | 24.8%) account for the highest median family income in Jenkins with $127,500 per family, while 4-person families (32 | 24.8%) have the highest median income of $31,875 per family member.
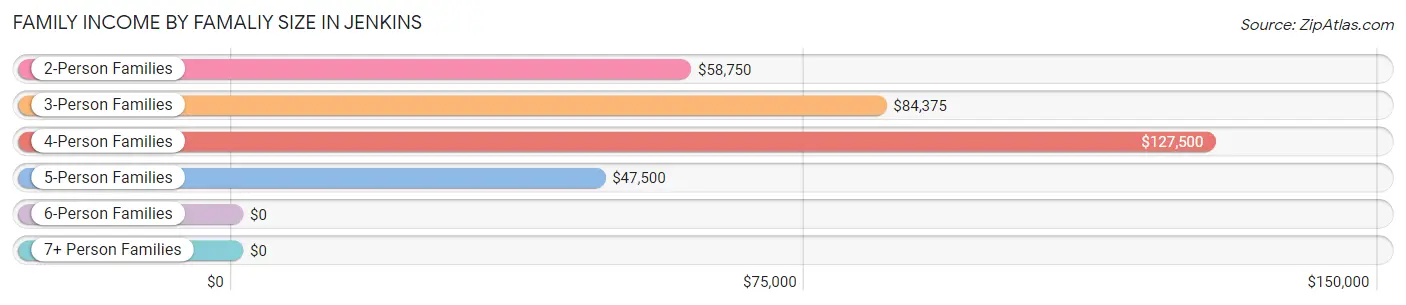
| Income Bracket | # Families | Median Income |
| 2-Person Families | 58 (45.0%) | $58,750 |
| 3-Person Families | 23 (17.8%) | $84,375 |
| 4-Person Families | 32 (24.8%) | $127,500 |
| 5-Person Families | 14 (10.8%) | $47,500 |
| 6-Person Families | 2 (1.5%) | $0 |
| 7+ Person Families | 0 (0.0%) | $0 |
| Total | 129 (100.0%) | $88,125 |
Family Income by Number of Earners in Jenkins
The median family income in Jenkins is $88,125, with families comprising 3+ earners (14) having the highest median family income of $140,000, while families with no earners (9) have the lowest median family income of $46,250, accounting for 10.8% and 7.0% of families, respectively.
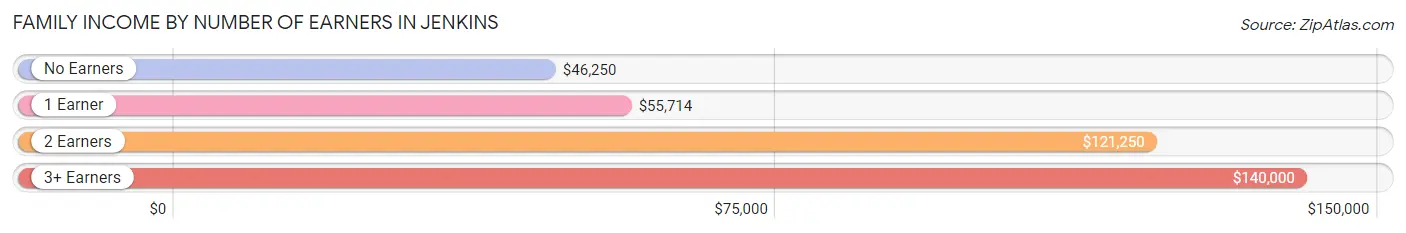
| Number of Earners | # Families | Median Income |
| No Earners | 9 (7.0%) | $46,250 |
| 1 Earner | 34 (26.4%) | $55,714 |
| 2 Earners | 72 (55.8%) | $121,250 |
| 3+ Earners | 14 (10.8%) | $140,000 |
| Total | 129 (100.0%) | $88,125 |
Household Income in Jenkins
Household Income Brackets in Jenkins
With 41 households falling in the category, the $100,000 to $149,999 income range is the most frequent in Jenkins, accounting for 24.3% of all households. In contrast, only 3 households (1.8%) fall into the $10,000 to $14,999 income bracket, making it the least populous group.
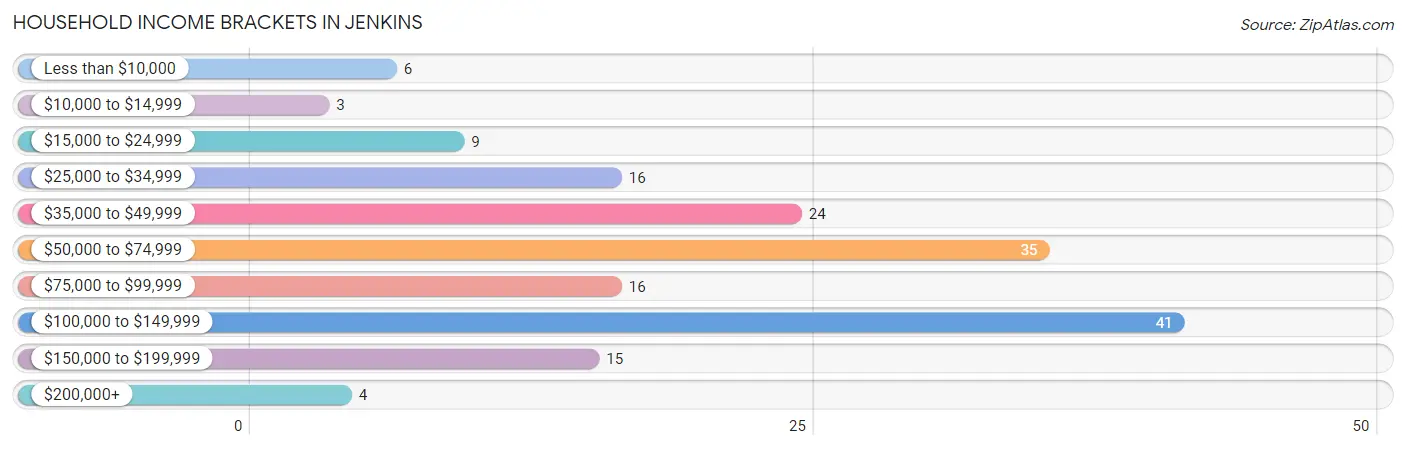
| Income Bracket | # Households | % Households |
| Less than $10,000 | 6 | 3.6% |
| $10,000 to $14,999 | 3 | 1.8% |
| $15,000 to $24,999 | 9 | 5.3% |
| $25,000 to $34,999 | 16 | 9.5% |
| $35,000 to $49,999 | 24 | 14.2% |
| $50,000 to $74,999 | 35 | 20.7% |
| $75,000 to $99,999 | 16 | 9.5% |
| $100,000 to $149,999 | 41 | 24.3% |
| $150,000 to $199,999 | 15 | 8.9% |
| $200,000+ | 4 | 2.4% |
Household Income by Householder Age in Jenkins
The median household income in Jenkins is $61,806, with the highest median household income of $80,625 found in the 25 to 44 years age bracket for the primary householder. A total of 75 households (44.4%) fall into this category. Meanwhile, the 15 to 24 years age bracket for the primary householder has the lowest median household income of $0, with 6 households (3.5%) in this group.
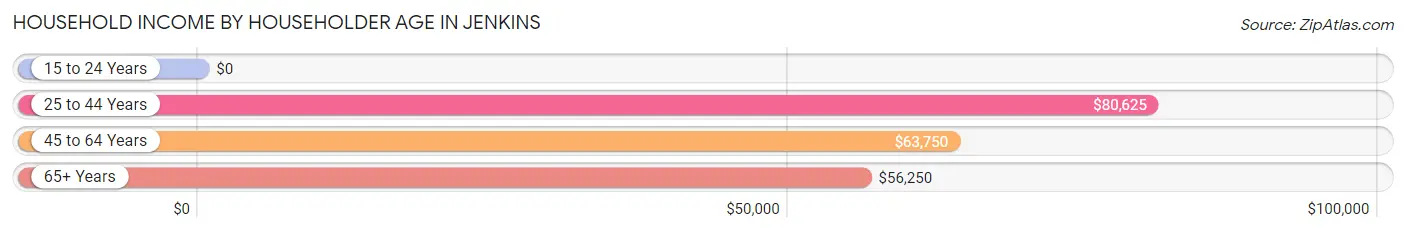
| Income Bracket | # Households | Median Income |
| 15 to 24 Years | 6 (3.5%) | $0 |
| 25 to 44 Years | 75 (44.4%) | $80,625 |
| 45 to 64 Years | 61 (36.1%) | $63,750 |
| 65+ Years | 27 (16.0%) | $56,250 |
| Total | 169 (100.0%) | $61,806 |
Poverty in Jenkins
Income Below Poverty by Sex and Age in Jenkins
With 8.1% poverty level for males and 8.5% for females among the residents of Jenkins, under 5 year old males and 15 year old females are the most vulnerable to poverty, with 4 males (36.4%) and 4 females (80.0%) in their respective age groups living below the poverty level.
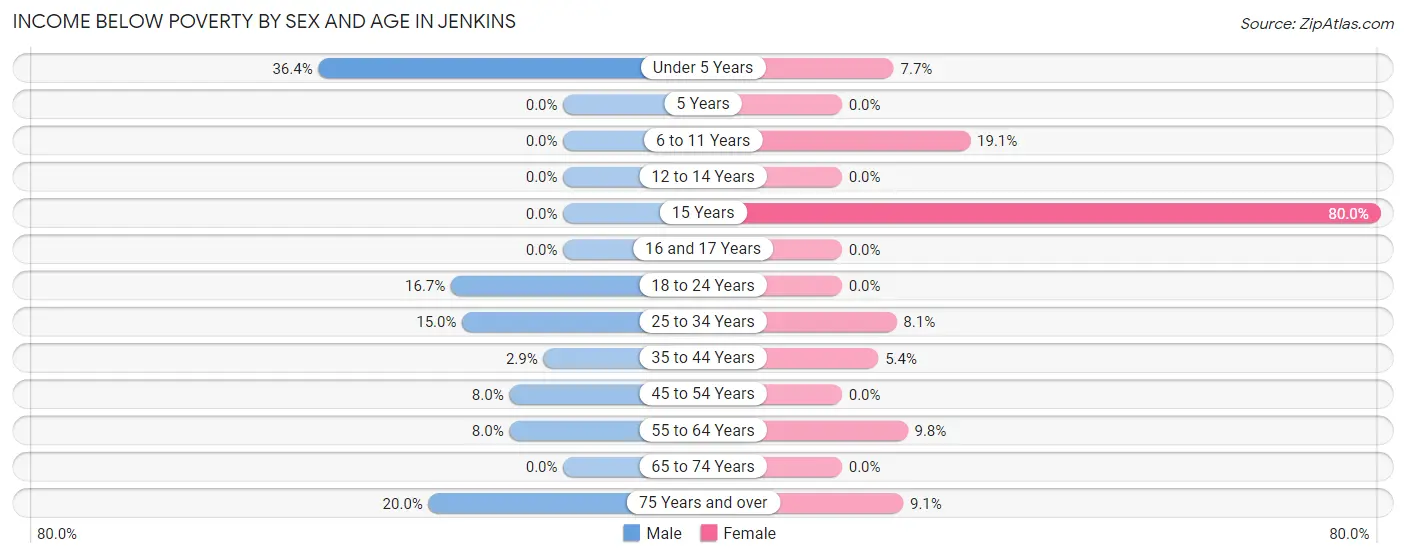
| Age Bracket | Male | Female |
| Under 5 Years | 4 (36.4%) | 2 (7.7%) |
| 5 Years | 0 (0.0%) | 0 (0.0%) |
| 6 to 11 Years | 0 (0.0%) | 4 (19.1%) |
| 12 to 14 Years | 0 (0.0%) | 0 (0.0%) |
| 15 Years | 0 (0.0%) | 4 (80.0%) |
| 16 and 17 Years | 0 (0.0%) | 0 (0.0%) |
| 18 to 24 Years | 2 (16.7%) | 0 (0.0%) |
| 25 to 34 Years | 6 (15.0%) | 3 (8.1%) |
| 35 to 44 Years | 1 (2.9%) | 2 (5.4%) |
| 45 to 54 Years | 2 (8.0%) | 0 (0.0%) |
| 55 to 64 Years | 2 (8.0%) | 4 (9.8%) |
| 65 to 74 Years | 0 (0.0%) | 0 (0.0%) |
| 75 Years and over | 1 (20.0%) | 1 (9.1%) |
| Total | 18 (8.1%) | 20 (8.5%) |
Income Above Poverty by Sex and Age in Jenkins
According to the poverty statistics in Jenkins, males aged 5 years and females aged 5 years are the age groups that are most secure financially, with 100.0% of males and 100.0% of females in these age groups living above the poverty line.
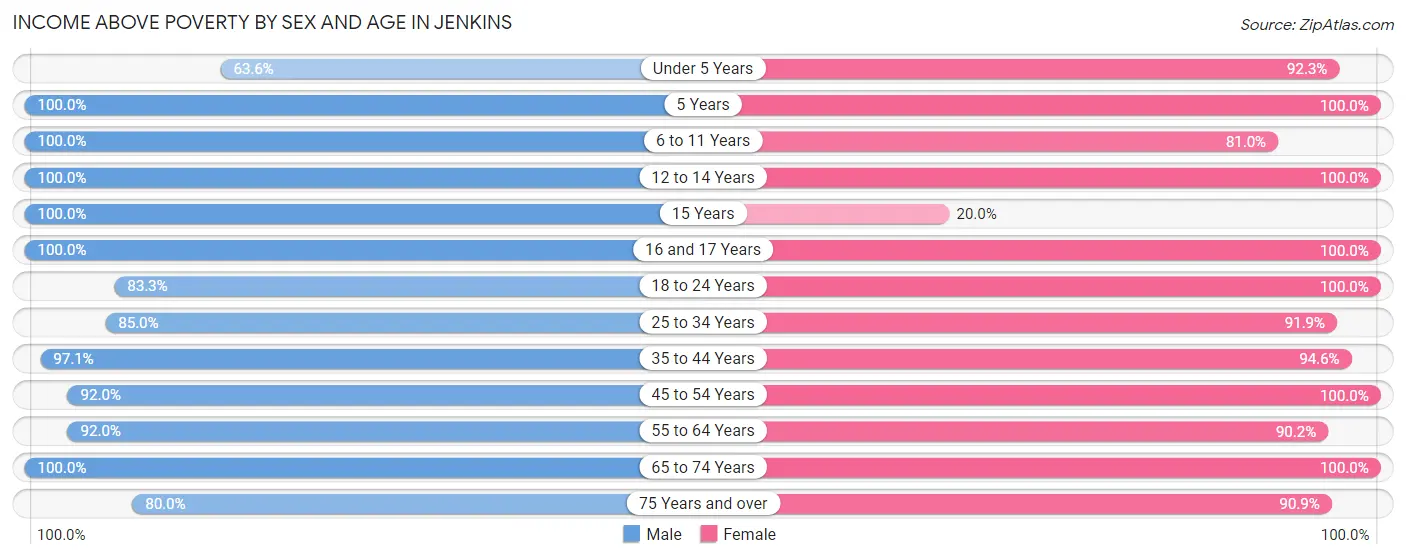
| Age Bracket | Male | Female |
| Under 5 Years | 7 (63.6%) | 24 (92.3%) |
| 5 Years | 2 (100.0%) | 2 (100.0%) |
| 6 to 11 Years | 28 (100.0%) | 17 (80.9%) |
| 12 to 14 Years | 4 (100.0%) | 16 (100.0%) |
| 15 Years | 14 (100.0%) | 1 (20.0%) |
| 16 and 17 Years | 6 (100.0%) | 7 (100.0%) |
| 18 to 24 Years | 10 (83.3%) | 9 (100.0%) |
| 25 to 34 Years | 34 (85.0%) | 34 (91.9%) |
| 35 to 44 Years | 33 (97.1%) | 35 (94.6%) |
| 45 to 54 Years | 23 (92.0%) | 18 (100.0%) |
| 55 to 64 Years | 23 (92.0%) | 37 (90.2%) |
| 65 to 74 Years | 15 (100.0%) | 6 (100.0%) |
| 75 Years and over | 4 (80.0%) | 10 (90.9%) |
| Total | 203 (91.9%) | 216 (91.5%) |
Income Below Poverty Among Married-Couple Families in Jenkins
The poverty statistics for married-couple families in Jenkins show that 4.9% or 5 of the total 103 families live below the poverty line. Families with 3 or 4 children have the highest poverty rate of 25.0%, comprising of 3 families. On the other hand, families with 1 or 2 children have the lowest poverty rate of 0.0%, which includes 0 families.
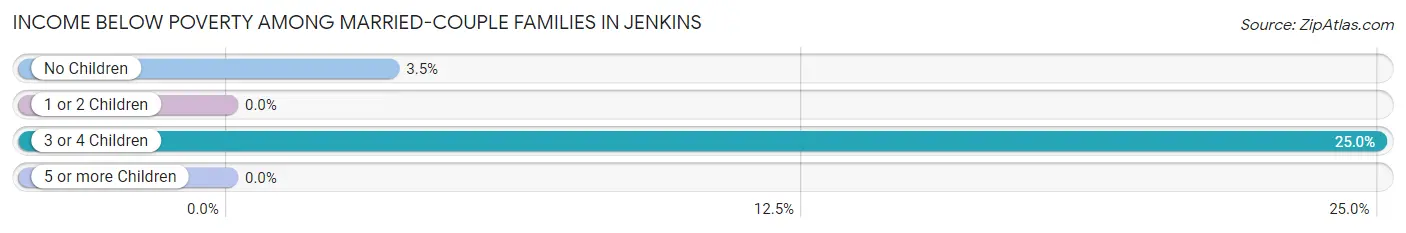
| Children | Above Poverty | Below Poverty |
| No Children | 55 (96.5%) | 2 (3.5%) |
| 1 or 2 Children | 34 (100.0%) | 0 (0.0%) |
| 3 or 4 Children | 9 (75.0%) | 3 (25.0%) |
| 5 or more Children | 0 (0.0%) | 0 (0.0%) |
| Total | 98 (95.2%) | 5 (4.9%) |
Income Below Poverty Among Single-Parent Households in Jenkins
According to the poverty data in Jenkins, 33.3% or 3 single-father households and 11.8% or 2 single-mother households are living below the poverty line. Among single-father households, those with 1 or 2 children have the highest poverty rate, with 3 households (75.0%) experiencing poverty. Likewise, among single-mother households, those with 1 or 2 children have the highest poverty rate, with 2 households (15.4%) falling below the poverty line.
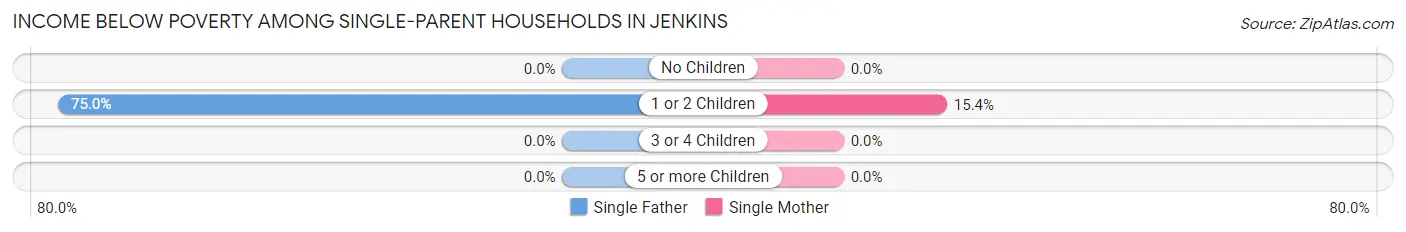
| Children | Single Father | Single Mother |
| No Children | 0 (0.0%) | 0 (0.0%) |
| 1 or 2 Children | 3 (75.0%) | 2 (15.4%) |
| 3 or 4 Children | 0 (0.0%) | 0 (0.0%) |
| 5 or more Children | 0 (0.0%) | 0 (0.0%) |
| Total | 3 (33.3%) | 2 (11.8%) |
Income Below Poverty Among Married-Couple vs Single-Parent Households in Jenkins
The poverty data for Jenkins shows that 5 of the married-couple family households (4.9%) and 5 of the single-parent households (19.2%) are living below the poverty level. Within the married-couple family households, those with 3 or 4 children have the highest poverty rate, with 3 households (25.0%) falling below the poverty line. Among the single-parent households, those with 1 or 2 children have the highest poverty rate, with 5 household (29.4%) living below poverty.
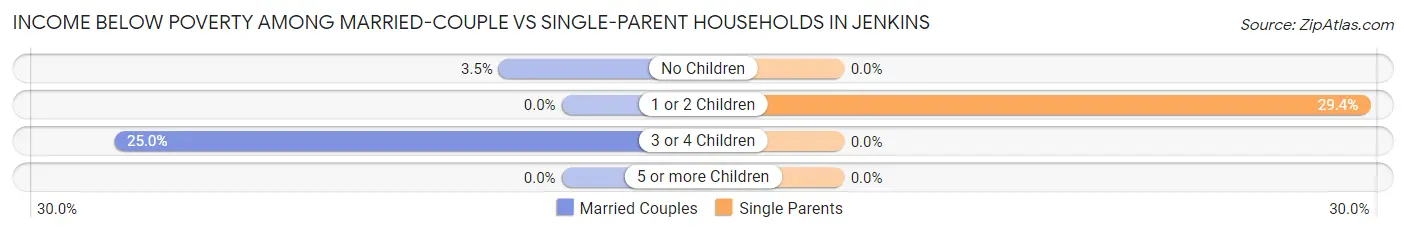
| Children | Married-Couple Families | Single-Parent Households |
| No Children | 2 (3.5%) | 0 (0.0%) |
| 1 or 2 Children | 0 (0.0%) | 5 (29.4%) |
| 3 or 4 Children | 3 (25.0%) | 0 (0.0%) |
| 5 or more Children | 0 (0.0%) | 0 (0.0%) |
| Total | 5 (4.9%) | 5 (19.2%) |
Race in Jenkins
The most populous races in Jenkins are White / Caucasian (431 | 94.3%), Two or more Races (17 | 3.7%), and Asian (8 | 1.8%).
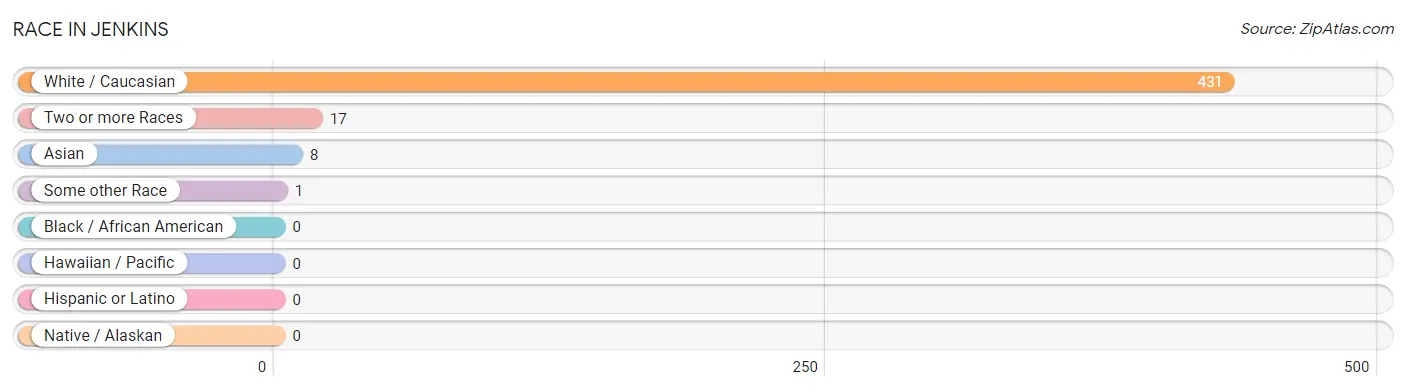
| Race | # Population | % Population |
| Asian | 8 | 1.8% |
| Black / African American | 0 | 0.0% |
| Hawaiian / Pacific | 0 | 0.0% |
| Hispanic or Latino | 0 | 0.0% |
| Native / Alaskan | 0 | 0.0% |
| White / Caucasian | 431 | 94.3% |
| Two or more Races | 17 | 3.7% |
| Some other Race | 1 | 0.2% |
| Total | 457 | 100.0% |
Ancestry in Jenkins
The most populous ancestries reported in Jenkins are German (158 | 34.6%), Irish (71 | 15.5%), Norwegian (53 | 11.6%), Polish (47 | 10.3%), and Swedish (42 | 9.2%), together accounting for 81.2% of all Jenkins residents.
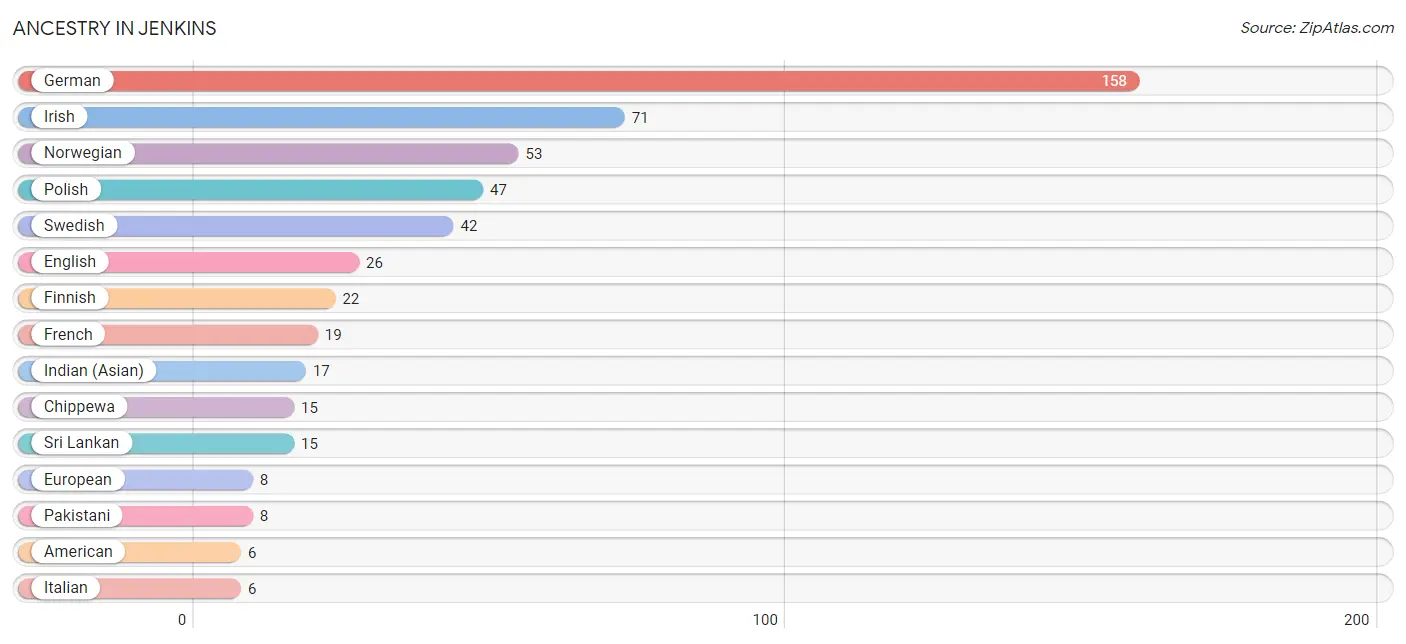
| Ancestry | # Population | % Population |
| American | 6 | 1.3% |
| British | 4 | 0.9% |
| Canadian | 1 | 0.2% |
| Chippewa | 15 | 3.3% |
| Czech | 1 | 0.2% |
| English | 26 | 5.7% |
| European | 8 | 1.8% |
| Finnish | 22 | 4.8% |
| French | 19 | 4.2% |
| French Canadian | 1 | 0.2% |
| German | 158 | 34.6% |
| Hungarian | 2 | 0.4% |
| Indian (Asian) | 17 | 3.7% |
| Irish | 71 | 15.5% |
| Italian | 6 | 1.3% |
| Lithuanian | 4 | 0.9% |
| Norwegian | 53 | 11.6% |
| Pakistani | 8 | 1.8% |
| Polish | 47 | 10.3% |
| Scandinavian | 1 | 0.2% |
| Scotch-Irish | 3 | 0.7% |
| Scottish | 4 | 0.9% |
| Sri Lankan | 15 | 3.3% |
| Swedish | 42 | 9.2% |
| Yugoslavian | 3 | 0.7% | View All 25 Rows |
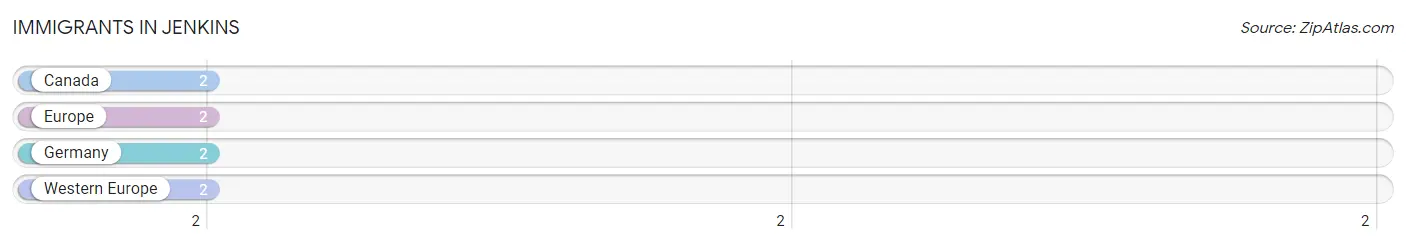
Immigrants in Jenkins
The most numerous immigrant groups reported in Jenkins came from Canada (2 | 0.4%), Europe (2 | 0.4%), Germany (2 | 0.4%), and Western Europe (2 | 0.4%), together accounting for 1.8% of all Jenkins residents.
| Immigration Origin | # Population | % Population |
| Canada | 2 | 0.4% |
| Europe | 2 | 0.4% |
| Germany | 2 | 0.4% |
| Western Europe | 2 | 0.4% | View All 4 Rows |
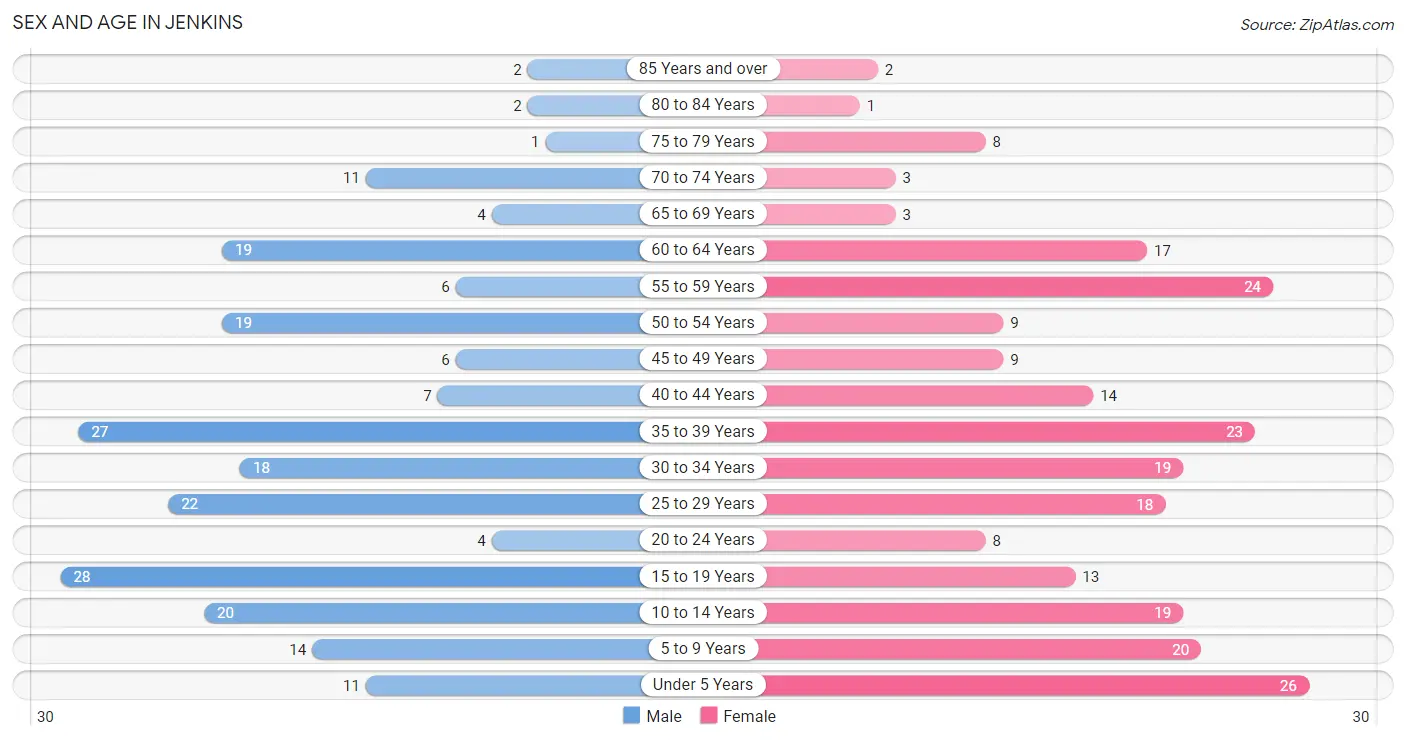
Sex and Age in Jenkins
Sex and Age in Jenkins
The most populous age groups in Jenkins are 15 to 19 Years (28 | 12.7%) for men and Under 5 Years (26 | 11.0%) for women.
| Age Bracket | Male | Female |
| Under 5 Years | 11 (5.0%) | 26 (11.0%) |
| 5 to 9 Years | 14 (6.3%) | 20 (8.5%) |
| 10 to 14 Years | 20 (9.0%) | 19 (8.1%) |
| 15 to 19 Years | 28 (12.7%) | 13 (5.5%) |
| 20 to 24 Years | 4 (1.8%) | 8 (3.4%) |
| 25 to 29 Years | 22 (10.0%) | 18 (7.6%) |
| 30 to 34 Years | 18 (8.1%) | 19 (8.1%) |
| 35 to 39 Years | 27 (12.2%) | 23 (9.8%) |
| 40 to 44 Years | 7 (3.2%) | 14 (5.9%) |
| 45 to 49 Years | 6 (2.7%) | 9 (3.8%) |
| 50 to 54 Years | 19 (8.6%) | 9 (3.8%) |
| 55 to 59 Years | 6 (2.7%) | 24 (10.2%) |
| 60 to 64 Years | 19 (8.6%) | 17 (7.2%) |
| 65 to 69 Years | 4 (1.8%) | 3 (1.3%) |
| 70 to 74 Years | 11 (5.0%) | 3 (1.3%) |
| 75 to 79 Years | 1 (0.4%) | 8 (3.4%) |
| 80 to 84 Years | 2 (0.9%) | 1 (0.4%) |
| 85 Years and over | 2 (0.9%) | 2 (0.9%) |
| Total | 221 (100.0%) | 236 (100.0%) |
Families and Households in Jenkins
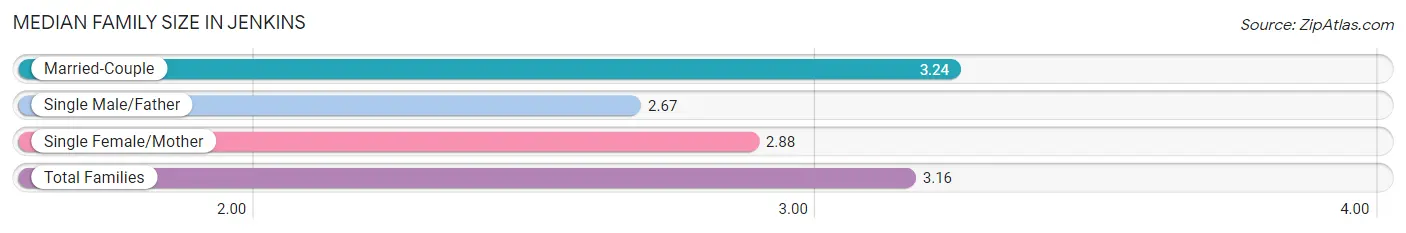
Median Family Size in Jenkins
The median family size in Jenkins is 3.16 persons per family, with married-couple families (103 | 79.8%) accounting for the largest median family size of 3.24 persons per family. On the other hand, single male/father families (9 | 7.0%) represent the smallest median family size with 2.67 persons per family.
| Family Type | # Families | Family Size |
| Married-Couple | 103 (79.8%) | 3.24 |
| Single Male/Father | 9 (7.0%) | 2.67 |
| Single Female/Mother | 17 (13.2%) | 2.88 |
| Total Families | 129 (100.0%) | 3.16 |
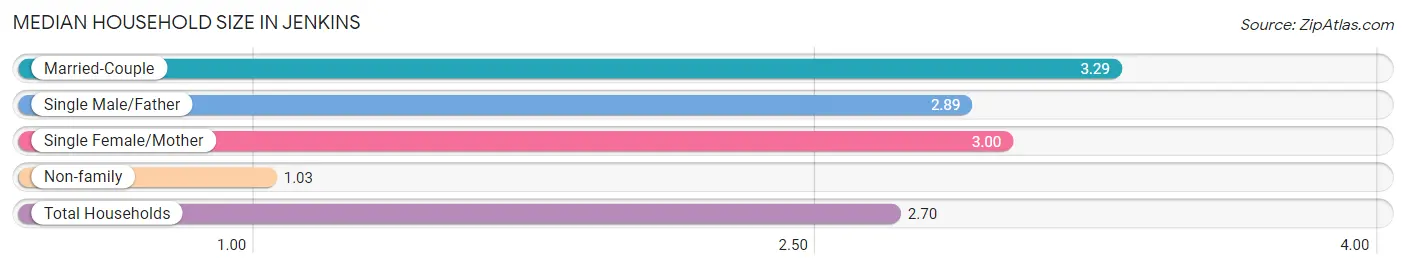
Median Household Size in Jenkins
The median household size in Jenkins is 2.70 persons per household, with married-couple households (103 | 61.0%) accounting for the largest median household size of 3.29 persons per household. non-family households (40 | 23.7%) represent the smallest median household size with 1.03 persons per household.
| Household Type | # Households | Household Size |
| Married-Couple | 103 (61.0%) | 3.29 |
| Single Male/Father | 9 (5.3%) | 2.89 |
| Single Female/Mother | 17 (10.1%) | 3.00 |
| Non-family | 40 (23.7%) | 1.03 |
| Total Households | 169 (100.0%) | 2.70 |
Household Size by Marriage Status in Jenkins
Out of a total of 169 households in Jenkins, 129 (76.3%) are family households, while 40 (23.7%) are nonfamily households. The most numerous type of family households are 2-person households, comprising 56, and the most common type of nonfamily households are 1-person households, comprising 39.
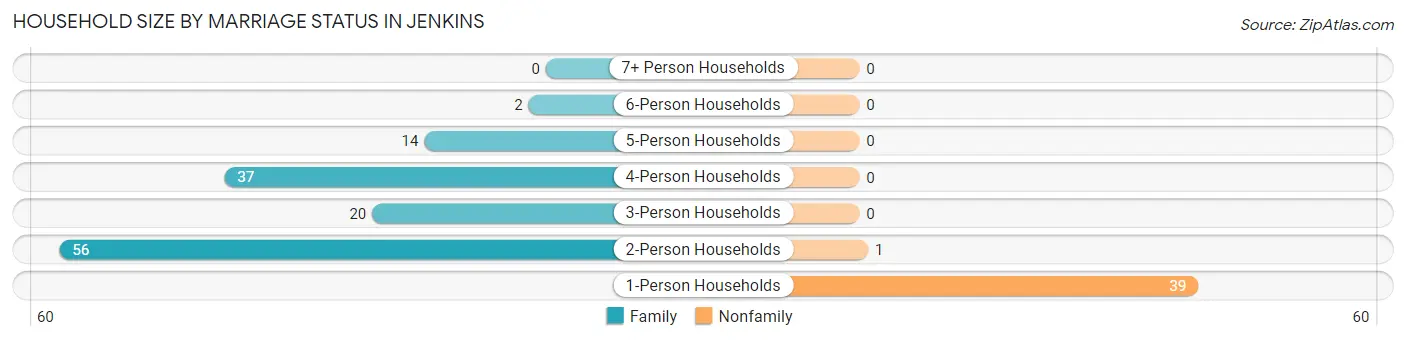
| Household Size | Family Households | Nonfamily Households |
| 1-Person Households | - | 39 (23.1%) |
| 2-Person Households | 56 (33.1%) | 1 (0.6%) |
| 3-Person Households | 20 (11.8%) | 0 (0.0%) |
| 4-Person Households | 37 (21.9%) | 0 (0.0%) |
| 5-Person Households | 14 (8.3%) | 0 (0.0%) |
| 6-Person Households | 2 (1.2%) | 0 (0.0%) |
| 7+ Person Households | 0 (0.0%) | 0 (0.0%) |
| Total | 129 (76.3%) | 40 (23.7%) |
Female Fertility in Jenkins
Fertility by Age in Jenkins
Average fertility rate in Jenkins is 38.0 births per 1,000 women. Women in the age bracket of 20 to 34 years have the highest fertility rate with 89.0 births per 1,000 women. Women in the age bracket of 20 to 34 years acount for 100.0% of all women with births.
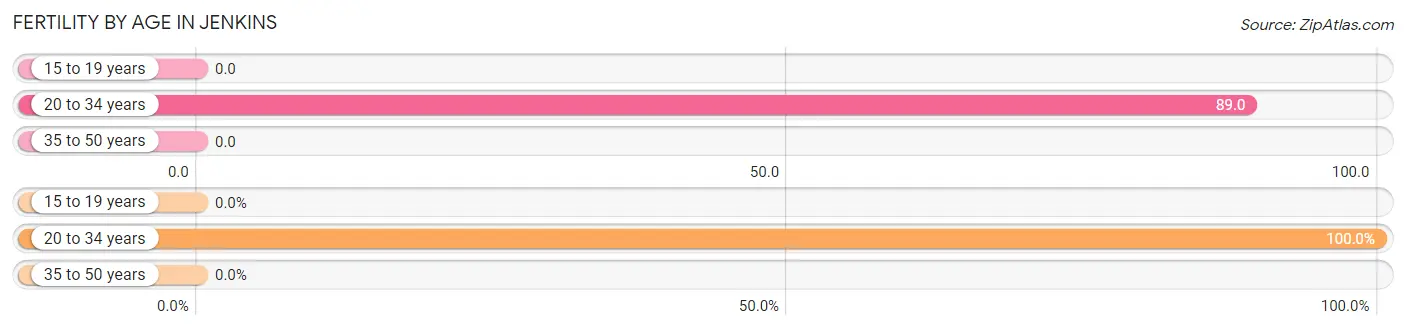
| Age Bracket | Women with Births | Births / 1,000 Women |
| 15 to 19 years | 0 (0.0%) | 0.0 |
| 20 to 34 years | 4 (100.0%) | 89.0 |
| 35 to 50 years | 0 (0.0%) | 0.0 |
| Total | 4 (100.0%) | 38.0 |
Fertility by Age by Marriage Status in Jenkins
50.0% of women with births (4) in Jenkins are married. The highest percentage of unmarried women with births falls into 20 to 34 years age bracket with 50.0% of them unmarried at the time of birth, while the lowest percentage of unmarried women with births belong to 20 to 34 years age bracket with 50.0% of them unmarried.
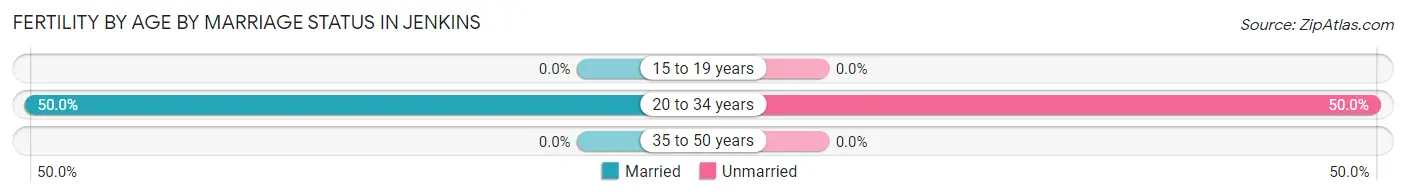
| Age Bracket | Married | Unmarried |
| 15 to 19 years | 0 (0.0%) | 0 (0.0%) |
| 20 to 34 years | 2 (50.0%) | 2 (50.0%) |
| 35 to 50 years | 0 (0.0%) | 0 (0.0%) |
| Total | 2 (50.0%) | 2 (50.0%) |
Fertility by Education in Jenkins
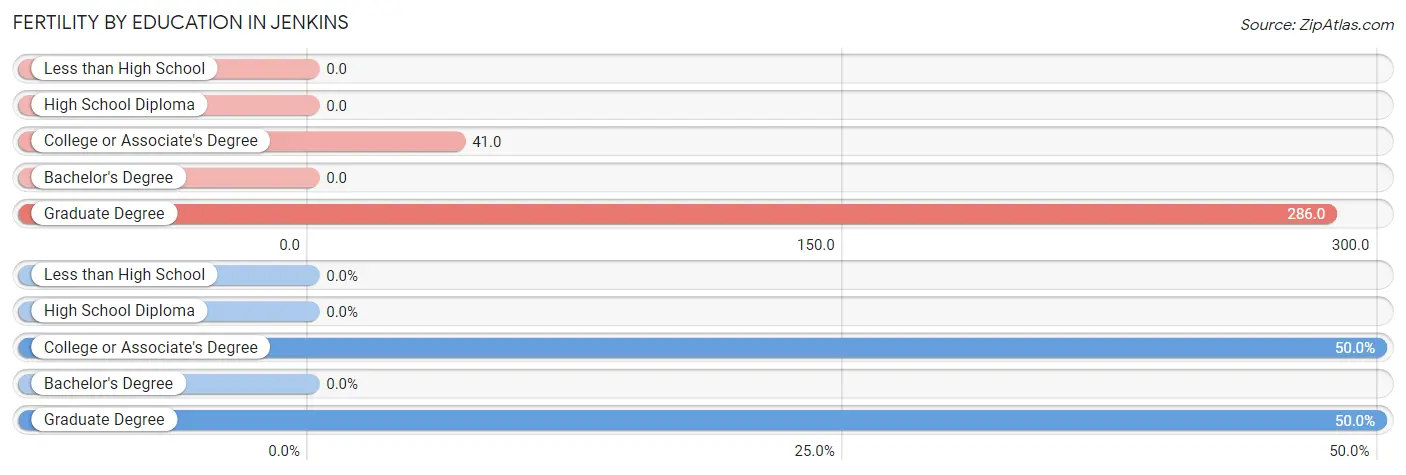
| Educational Attainment | Women with Births | Births / 1,000 Women |
| Less than High School | 0 (0.0%) | 0.0 |
| High School Diploma | 0 (0.0%) | 0.0 |
| College or Associate's Degree | 2 (50.0%) | 41.0 |
| Bachelor's Degree | 0 (0.0%) | 0.0 |
| Graduate Degree | 2 (50.0%) | 286.0 |
| Total | 4 (100.0%) | 38.0 |
Fertility by Education by Marriage Status in Jenkins
50.0% of women with births in Jenkins are unmarried. Women with the educational attainment of graduate degree are most likely to be married with 100.0% of them married at childbirth, while women with the educational attainment of college or associate's degree are least likely to be married with 100.0% of them unmarried at childbirth.
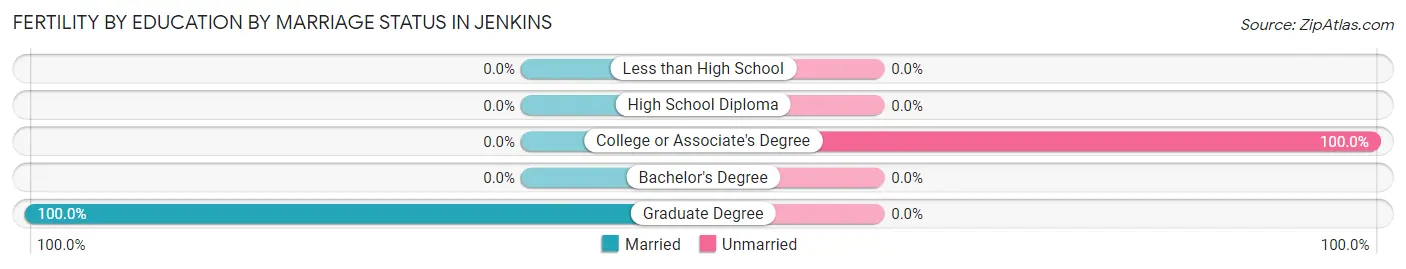
| Educational Attainment | Married | Unmarried |
| Less than High School | 0 (0.0%) | 0 (0.0%) |
| High School Diploma | 0 (0.0%) | 0 (0.0%) |
| College or Associate's Degree | 0 (0.0%) | 2 (100.0%) |
| Bachelor's Degree | 0 (0.0%) | 0 (0.0%) |
| Graduate Degree | 2 (100.0%) | 0 (0.0%) |
| Total | 2 (50.0%) | 2 (50.0%) |
Employment Characteristics in Jenkins
Employment by Class of Employer in Jenkins
Among the 246 employed individuals in Jenkins, private company employees (141 | 57.3%), local government employees (31 | 12.6%), and not-for-profit organizations (30 | 12.2%) make up the most common classes of employment.
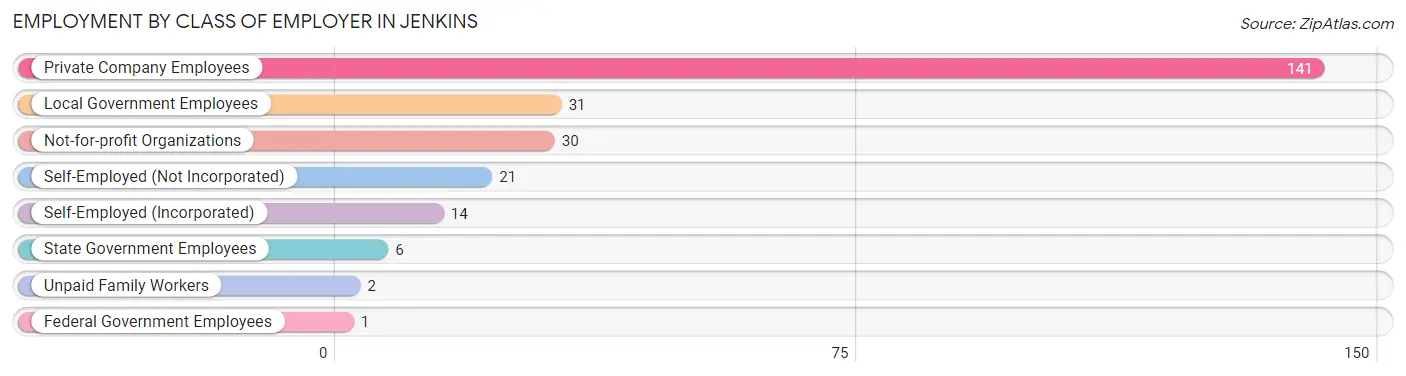
| Employer Class | # Employees | % Employees |
| Private Company Employees | 141 | 57.3% |
| Self-Employed (Incorporated) | 14 | 5.7% |
| Self-Employed (Not Incorporated) | 21 | 8.5% |
| Not-for-profit Organizations | 30 | 12.2% |
| Local Government Employees | 31 | 12.6% |
| State Government Employees | 6 | 2.4% |
| Federal Government Employees | 1 | 0.4% |
| Unpaid Family Workers | 2 | 0.8% |
| Total | 246 | 100.0% |
Employment Status by Age in Jenkins
According to the labor force statistics for Jenkins, out of the total population over 16 years of age (328), 78.4% or 257 individuals are in the labor force, with 3.1% or 8 of them unemployed. The age group with the highest labor force participation rate is 25 to 29 years, with 97.5% or 39 individuals in the labor force. Within the labor force, the 16 to 19 years age range has the highest percentage of unemployed individuals, with 20.0% or 3 of them being unemployed.
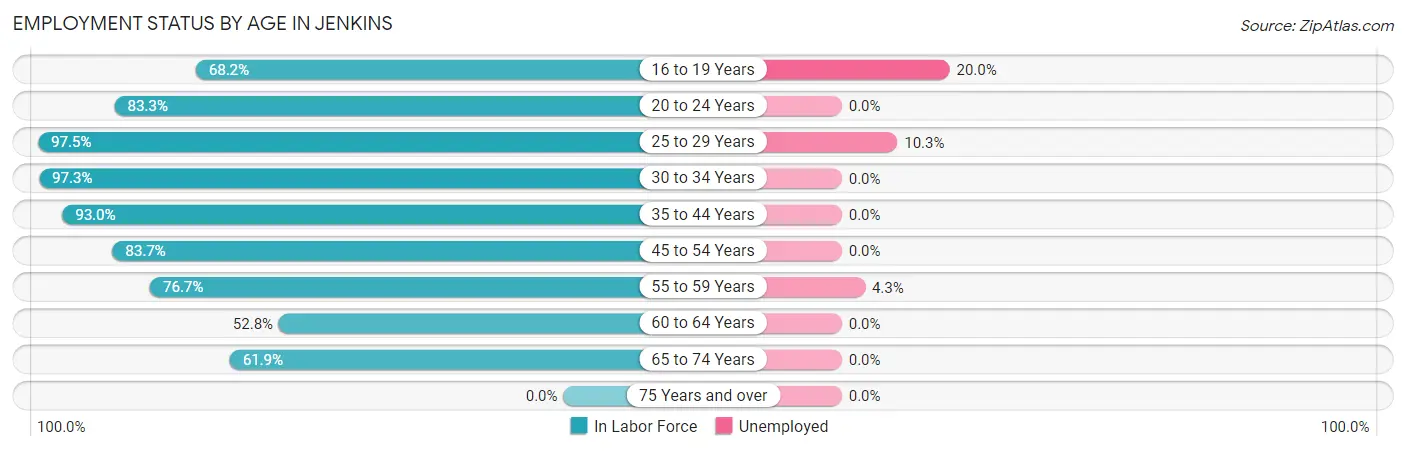
| Age Bracket | In Labor Force | Unemployed |
| 16 to 19 Years | 15 (68.2%) | 3 (20.0%) |
| 20 to 24 Years | 10 (83.3%) | 0 (0.0%) |
| 25 to 29 Years | 39 (97.5%) | 4 (10.3%) |
| 30 to 34 Years | 36 (97.3%) | 0 (0.0%) |
| 35 to 44 Years | 66 (93.0%) | 0 (0.0%) |
| 45 to 54 Years | 36 (83.7%) | 0 (0.0%) |
| 55 to 59 Years | 23 (76.7%) | 1 (4.3%) |
| 60 to 64 Years | 19 (52.8%) | 0 (0.0%) |
| 65 to 74 Years | 13 (61.9%) | 0 (0.0%) |
| 75 Years and over | 0 (0.0%) | 0 (0.0%) |
| Total | 257 (78.4%) | 8 (3.1%) |
Employment Status by Educational Attainment in Jenkins
According to labor force statistics for Jenkins, 85.2% of individuals (219) out of the total population between 25 and 64 years of age (257) are in the labor force, with 2.3% or 5 of them being unemployed. The group with the highest labor force participation rate are those with the educational attainment of less than high school, with 100.0% or 4 individuals in the labor force. Within the labor force, individuals with college / associate degree education have the highest percentage of unemployment, with 4.6% or 5 of them being unemployed.
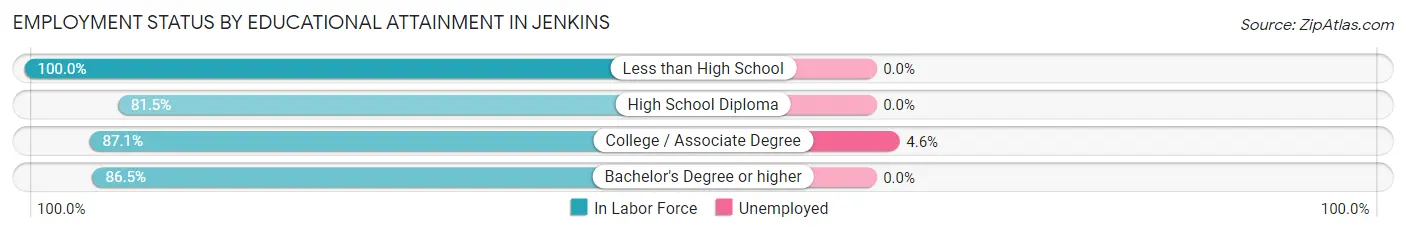
| Educational Attainment | In Labor Force | Unemployed |
| Less than High School | 4 (100.0%) | 0 (0.0%) |
| High School Diploma | 75 (81.5%) | 0 (0.0%) |
| College / Associate Degree | 108 (87.1%) | 6 (4.6%) |
| Bachelor's Degree or higher | 32 (86.5%) | 0 (0.0%) |
| Total | 219 (85.2%) | 6 (2.3%) |
Employment Occupations by Sex in Jenkins
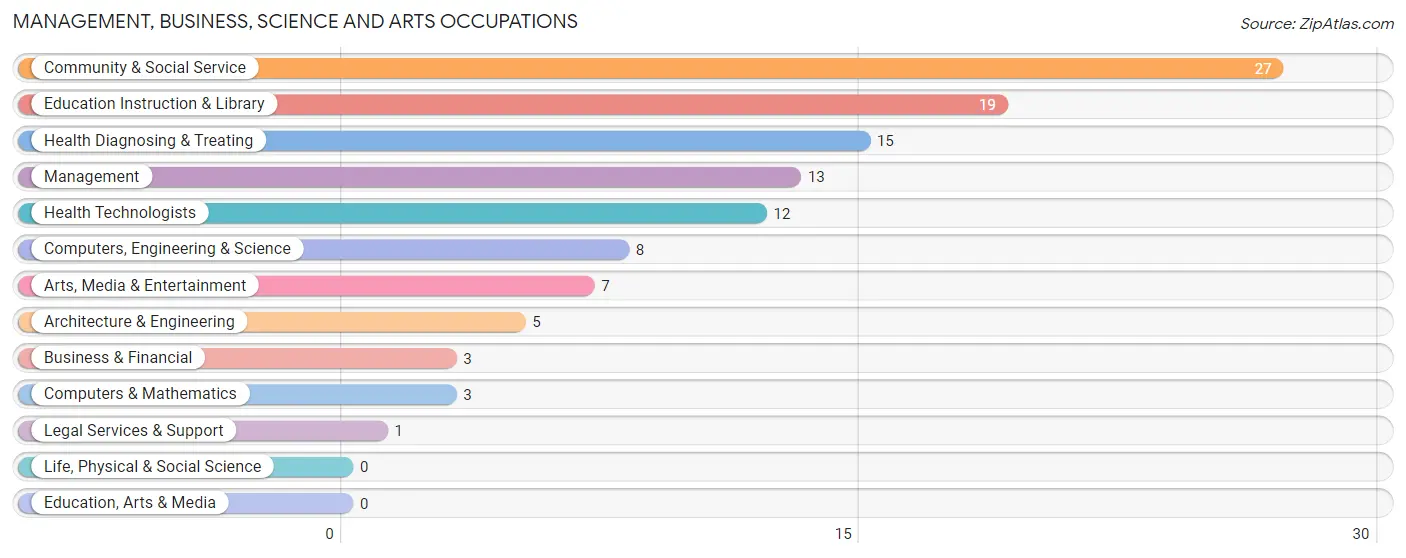
Management, Business, Science and Arts Occupations
The most common Management, Business, Science and Arts occupations in Jenkins are Community & Social Service (27 | 10.8%), Education Instruction & Library (19 | 7.6%), Health Diagnosing & Treating (15 | 6.0%), Management (13 | 5.2%), and Health Technologists (12 | 4.8%).
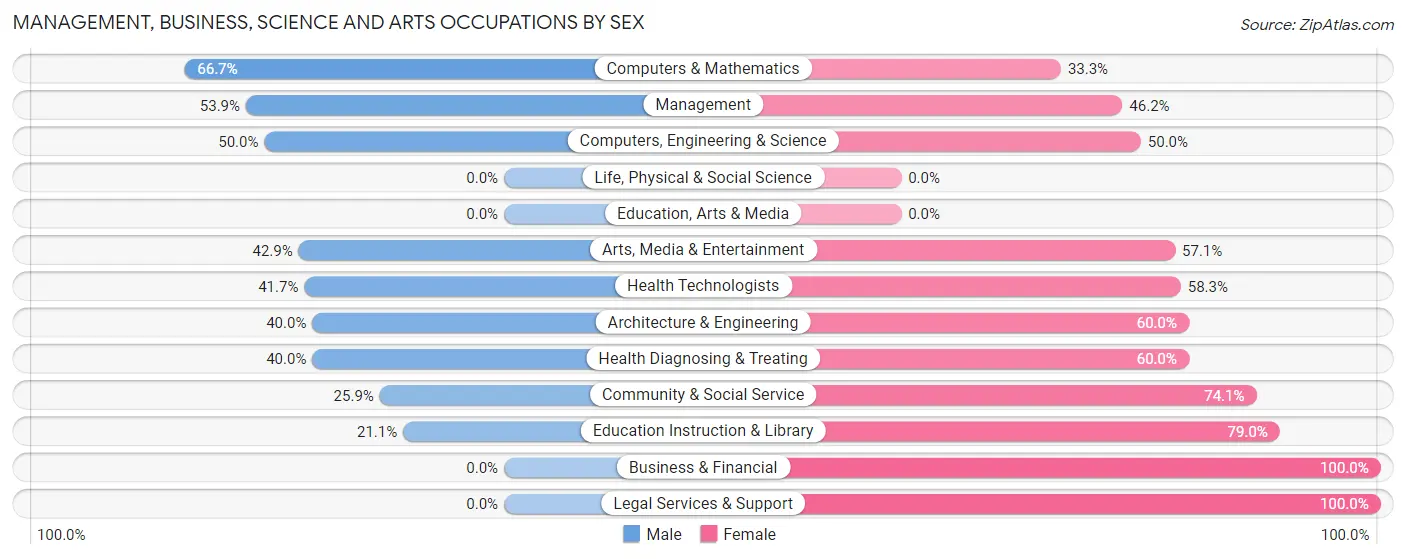
Management, Business, Science and Arts Occupations by Sex
Within the Management, Business, Science and Arts occupations in Jenkins, the most male-oriented occupations are Computers & Mathematics (66.7%), Management (53.8%), and Computers, Engineering & Science (50.0%), while the most female-oriented occupations are Business & Financial (100.0%), Legal Services & Support (100.0%), and Education Instruction & Library (78.9%).
| Occupation | Male | Female |
| Management | 7 (53.8%) | 6 (46.2%) |
| Business & Financial | 0 (0.0%) | 3 (100.0%) |
| Computers, Engineering & Science | 4 (50.0%) | 4 (50.0%) |
| Computers & Mathematics | 2 (66.7%) | 1 (33.3%) |
| Architecture & Engineering | 2 (40.0%) | 3 (60.0%) |
| Life, Physical & Social Science | 0 (0.0%) | 0 (0.0%) |
| Community & Social Service | 7 (25.9%) | 20 (74.1%) |
| Education, Arts & Media | 0 (0.0%) | 0 (0.0%) |
| Legal Services & Support | 0 (0.0%) | 1 (100.0%) |
| Education Instruction & Library | 4 (21.0%) | 15 (78.9%) |
| Arts, Media & Entertainment | 3 (42.9%) | 4 (57.1%) |
| Health Diagnosing & Treating | 6 (40.0%) | 9 (60.0%) |
| Health Technologists | 5 (41.7%) | 7 (58.3%) |
| Total (Category) | 24 (36.4%) | 42 (63.6%) |
| Total (Overall) | 125 (50.2%) | 124 (49.8%) |
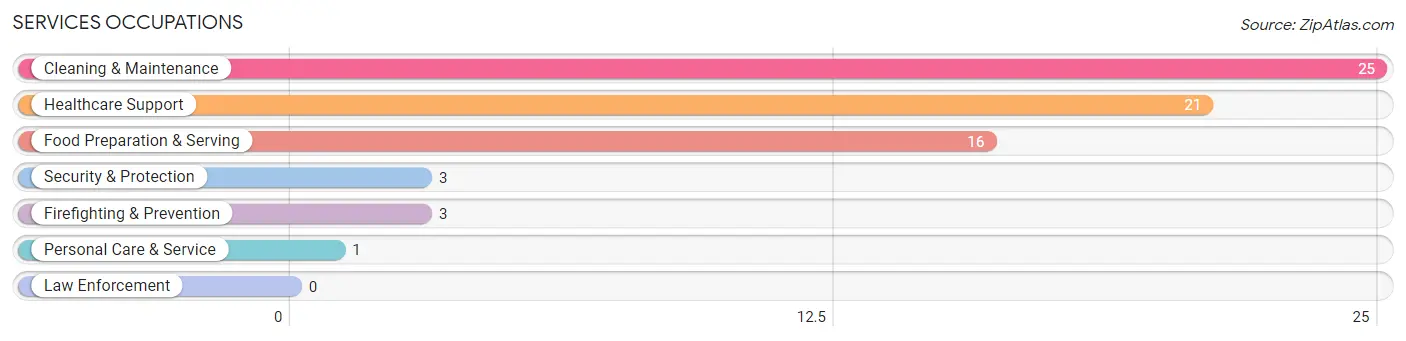
Services Occupations
The most common Services occupations in Jenkins are Cleaning & Maintenance (25 | 10.0%), Healthcare Support (21 | 8.4%), Food Preparation & Serving (16 | 6.4%), Security & Protection (3 | 1.2%), and Firefighting & Prevention (3 | 1.2%).
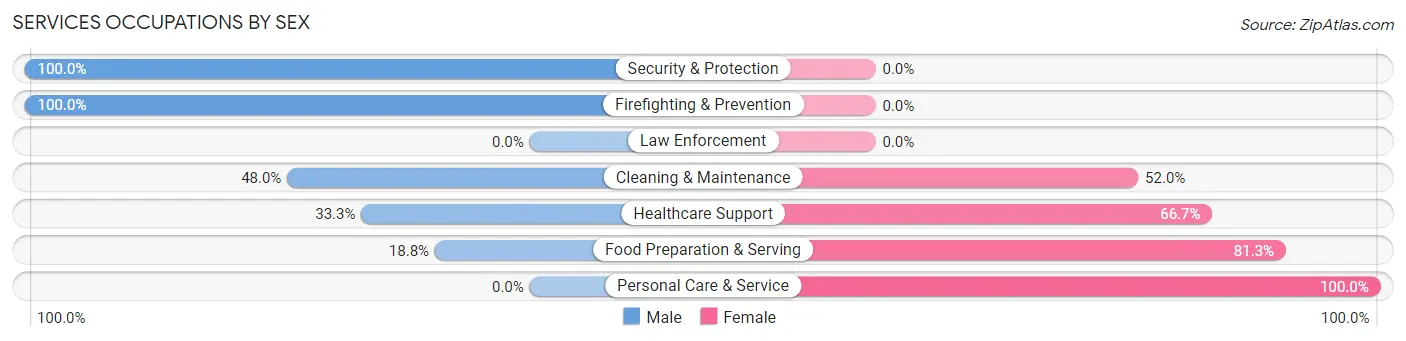
Services Occupations by Sex
Within the Services occupations in Jenkins, the most male-oriented occupations are Security & Protection (100.0%), Firefighting & Prevention (100.0%), and Cleaning & Maintenance (48.0%), while the most female-oriented occupations are Personal Care & Service (100.0%), Food Preparation & Serving (81.2%), and Healthcare Support (66.7%).
| Occupation | Male | Female |
| Healthcare Support | 7 (33.3%) | 14 (66.7%) |
| Security & Protection | 3 (100.0%) | 0 (0.0%) |
| Firefighting & Prevention | 3 (100.0%) | 0 (0.0%) |
| Law Enforcement | 0 (0.0%) | 0 (0.0%) |
| Food Preparation & Serving | 3 (18.8%) | 13 (81.2%) |
| Cleaning & Maintenance | 12 (48.0%) | 13 (52.0%) |
| Personal Care & Service | 0 (0.0%) | 1 (100.0%) |
| Total (Category) | 25 (37.9%) | 41 (62.1%) |
| Total (Overall) | 125 (50.2%) | 124 (49.8%) |
Sales and Office Occupations
The most common Sales and Office occupations in Jenkins are Office & Administration (31 | 12.4%), and Sales & Related (25 | 10.0%).
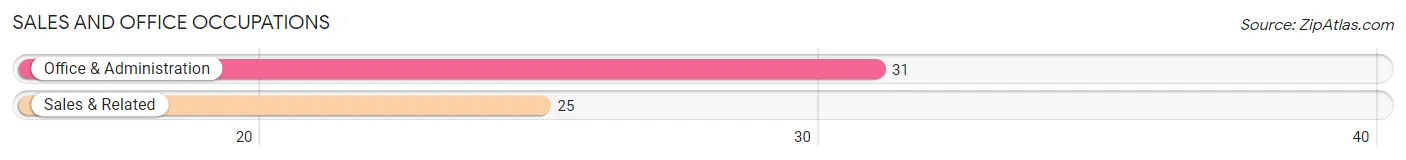
Sales and Office Occupations by Sex
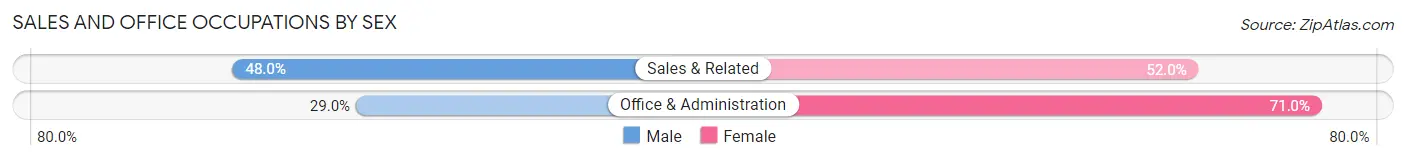
| Occupation | Male | Female |
| Sales & Related | 12 (48.0%) | 13 (52.0%) |
| Office & Administration | 9 (29.0%) | 22 (71.0%) |
| Total (Category) | 21 (37.5%) | 35 (62.5%) |
| Total (Overall) | 125 (50.2%) | 124 (49.8%) |
Natural Resources, Construction and Maintenance Occupations
The most common Natural Resources, Construction and Maintenance occupations in Jenkins are Construction & Extraction (31 | 12.4%), and Installation, Maintenance & Repair (10 | 4.0%).
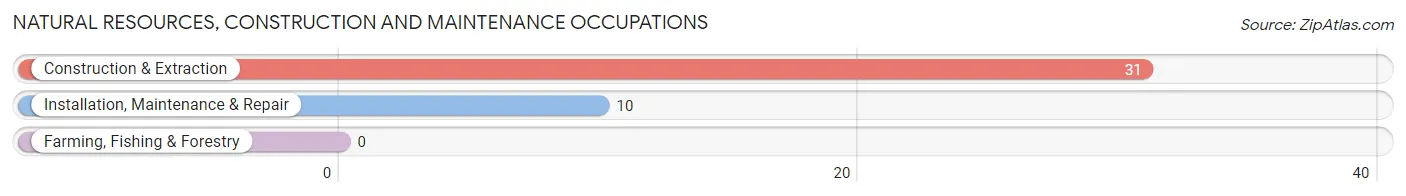
Natural Resources, Construction and Maintenance Occupations by Sex
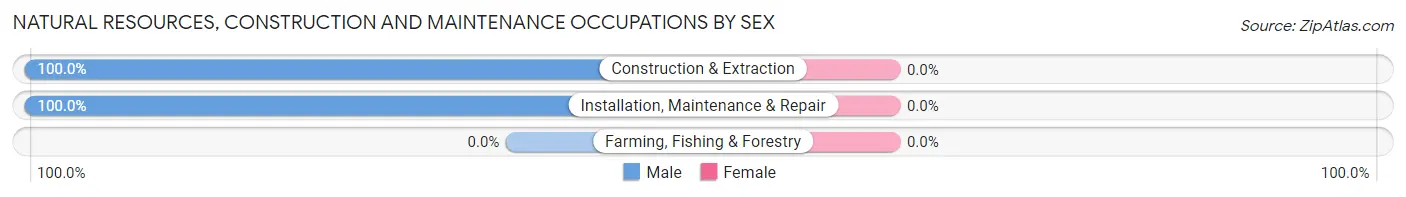
| Occupation | Male | Female |
| Farming, Fishing & Forestry | 0 (0.0%) | 0 (0.0%) |
| Construction & Extraction | 31 (100.0%) | 0 (0.0%) |
| Installation, Maintenance & Repair | 10 (100.0%) | 0 (0.0%) |
| Total (Category) | 41 (100.0%) | 0 (0.0%) |
| Total (Overall) | 125 (50.2%) | 124 (49.8%) |
Production, Transportation and Moving Occupations
The most common Production, Transportation and Moving occupations in Jenkins are Production (11 | 4.4%), Material Moving (5 | 2.0%), and Transportation (4 | 1.6%).
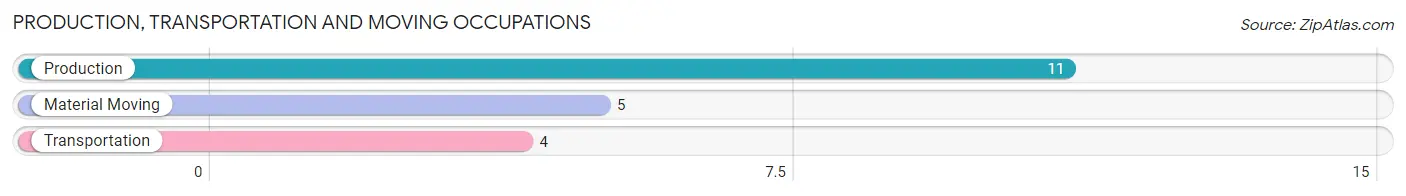
Production, Transportation and Moving Occupations by Sex
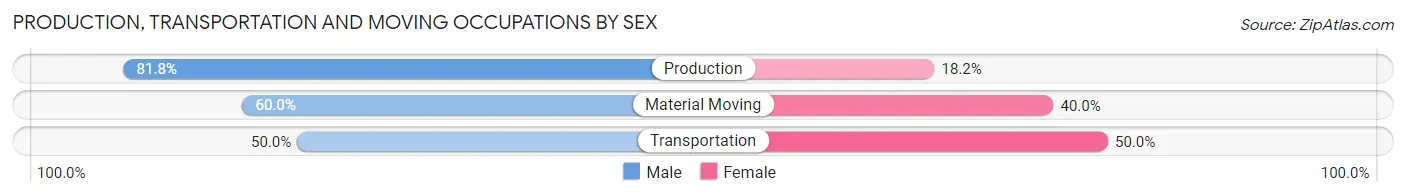
| Occupation | Male | Female |
| Production | 9 (81.8%) | 2 (18.2%) |
| Transportation | 2 (50.0%) | 2 (50.0%) |
| Material Moving | 3 (60.0%) | 2 (40.0%) |
| Total (Category) | 14 (70.0%) | 6 (30.0%) |
| Total (Overall) | 125 (50.2%) | 124 (49.8%) |
Employment Industries by Sex in Jenkins
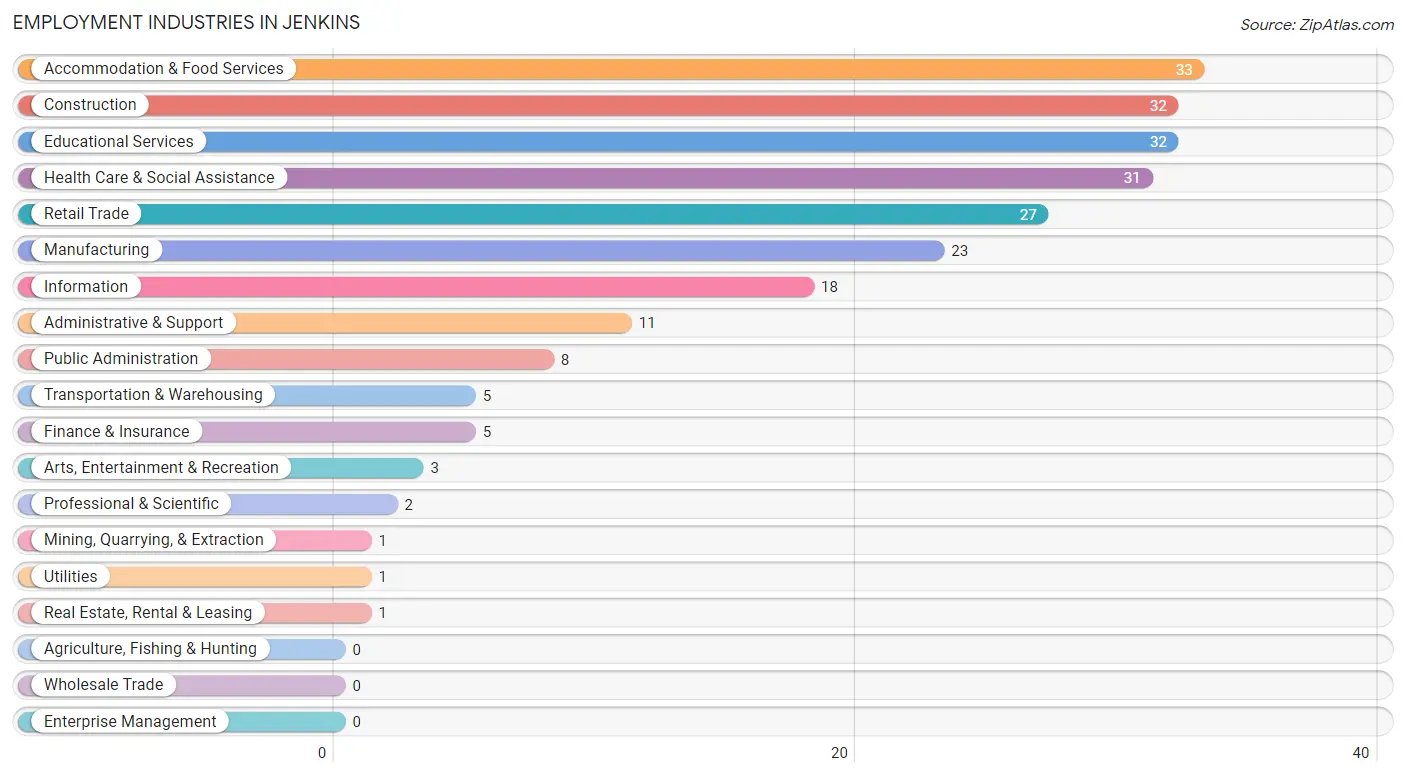
Employment Industries in Jenkins
The major employment industries in Jenkins include Accommodation & Food Services (33 | 13.3%), Construction (32 | 12.9%), Educational Services (32 | 12.9%), Health Care & Social Assistance (31 | 12.4%), and Retail Trade (27 | 10.8%).
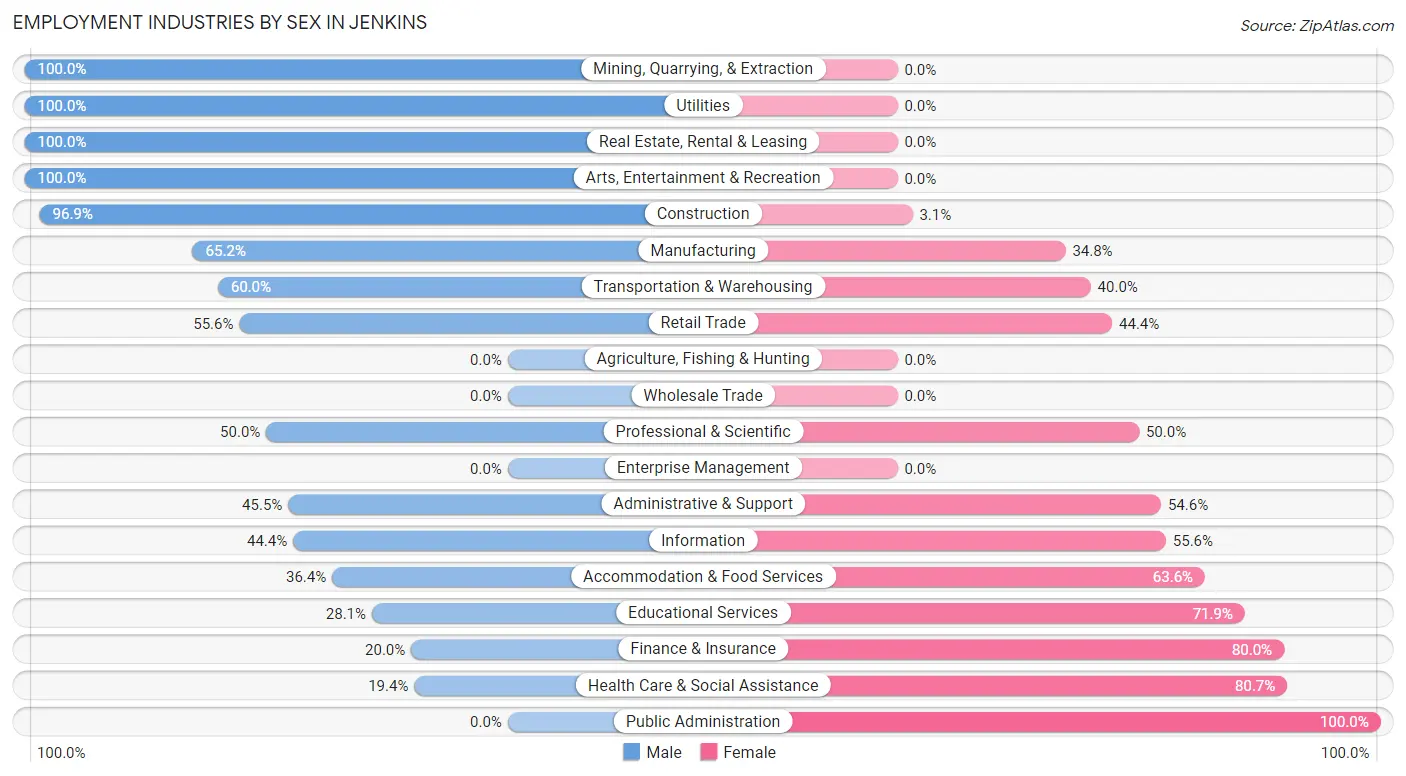
Employment Industries by Sex in Jenkins
The Jenkins industries that see more men than women are Mining, Quarrying, & Extraction (100.0%), Utilities (100.0%), and Real Estate, Rental & Leasing (100.0%), whereas the industries that tend to have a higher number of women are Public Administration (100.0%), Health Care & Social Assistance (80.6%), and Finance & Insurance (80.0%).
| Industry | Male | Female |
| Agriculture, Fishing & Hunting | 0 (0.0%) | 0 (0.0%) |
| Mining, Quarrying, & Extraction | 1 (100.0%) | 0 (0.0%) |
| Construction | 31 (96.9%) | 1 (3.1%) |
| Manufacturing | 15 (65.2%) | 8 (34.8%) |
| Wholesale Trade | 0 (0.0%) | 0 (0.0%) |
| Retail Trade | 15 (55.6%) | 12 (44.4%) |
| Transportation & Warehousing | 3 (60.0%) | 2 (40.0%) |
| Utilities | 1 (100.0%) | 0 (0.0%) |
| Information | 8 (44.4%) | 10 (55.6%) |
| Finance & Insurance | 1 (20.0%) | 4 (80.0%) |
| Real Estate, Rental & Leasing | 1 (100.0%) | 0 (0.0%) |
| Professional & Scientific | 1 (50.0%) | 1 (50.0%) |
| Enterprise Management | 0 (0.0%) | 0 (0.0%) |
| Administrative & Support | 5 (45.5%) | 6 (54.5%) |
| Educational Services | 9 (28.1%) | 23 (71.9%) |
| Health Care & Social Assistance | 6 (19.4%) | 25 (80.6%) |
| Arts, Entertainment & Recreation | 3 (100.0%) | 0 (0.0%) |
| Accommodation & Food Services | 12 (36.4%) | 21 (63.6%) |
| Public Administration | 0 (0.0%) | 8 (100.0%) |
| Total | 125 (50.2%) | 124 (49.8%) |
Education in Jenkins
School Enrollment in Jenkins
The most common levels of schooling among the 137 students in Jenkins are middle school (34 | 24.8%), elementary school (32 | 23.4%), and high school (32 | 23.4%).
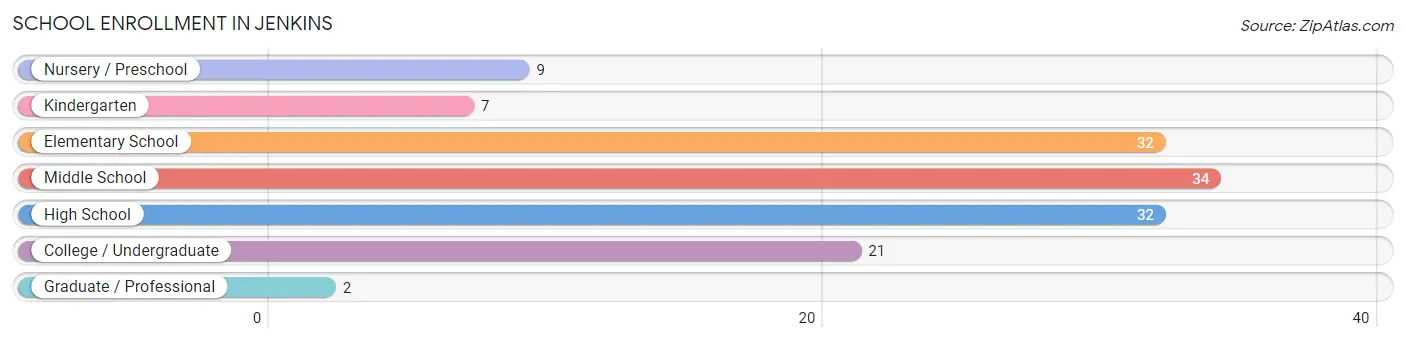
| School Level | # Students | % Students |
| Nursery / Preschool | 9 | 6.6% |
| Kindergarten | 7 | 5.1% |
| Elementary School | 32 | 23.4% |
| Middle School | 34 | 24.8% |
| High School | 32 | 23.4% |
| College / Undergraduate | 21 | 15.3% |
| Graduate / Professional | 2 | 1.5% |
| Total | 137 | 100.0% |
School Enrollment by Age by Funding Source in Jenkins
Out of a total of 137 students who are enrolled in schools in Jenkins, 14 (10.2%) attend a private institution, while the remaining 123 (89.8%) are enrolled in public schools. The age group of 20 to 24 year olds has the highest likelihood of being enrolled in private schools, with 2 (100.0% in the age bracket) enrolled. Conversely, the age group of 15 to 17 year olds has the lowest likelihood of being enrolled in a private school, with 32 (100.0% in the age bracket) attending a public institution.
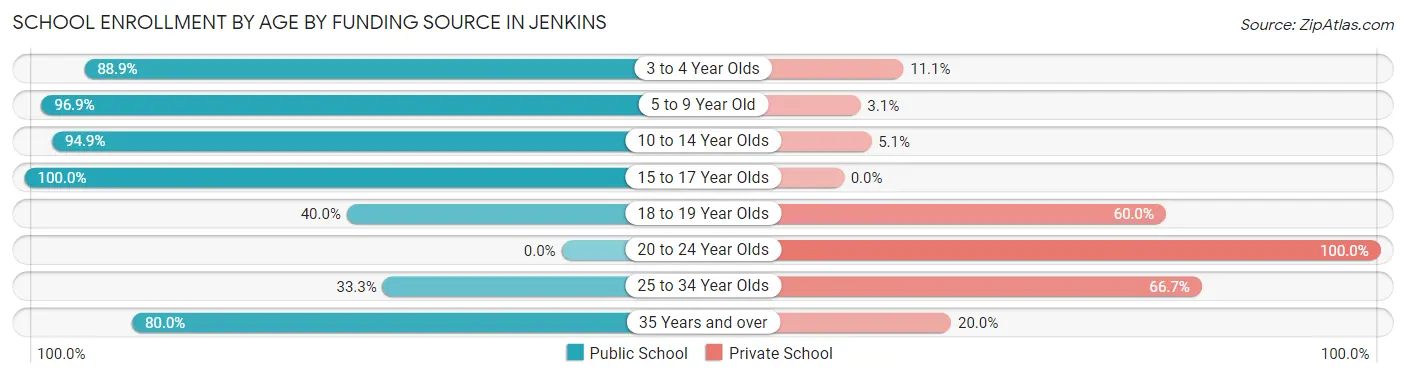
| Age Bracket | Public School | Private School |
| 3 to 4 Year Olds | 8 (88.9%) | 1 (11.1%) |
| 5 to 9 Year Old | 31 (96.9%) | 1 (3.1%) |
| 10 to 14 Year Olds | 37 (94.9%) | 2 (5.1%) |
| 15 to 17 Year Olds | 32 (100.0%) | 0 (0.0%) |
| 18 to 19 Year Olds | 2 (40.0%) | 3 (60.0%) |
| 20 to 24 Year Olds | 0 (0.0%) | 2 (100.0%) |
| 25 to 34 Year Olds | 1 (33.3%) | 2 (66.7%) |
| 35 Years and over | 12 (80.0%) | 3 (20.0%) |
| Total | 123 (89.8%) | 14 (10.2%) |
Educational Attainment by Field of Study in Jenkins
Education (16 | 37.2%), business (9 | 20.9%), physical & health sciences (5 | 11.6%), science & technology (5 | 11.6%), and bio, nature & agricultural (2 | 4.6%) are the most common fields of study among 43 individuals in Jenkins who have obtained a bachelor's degree or higher.
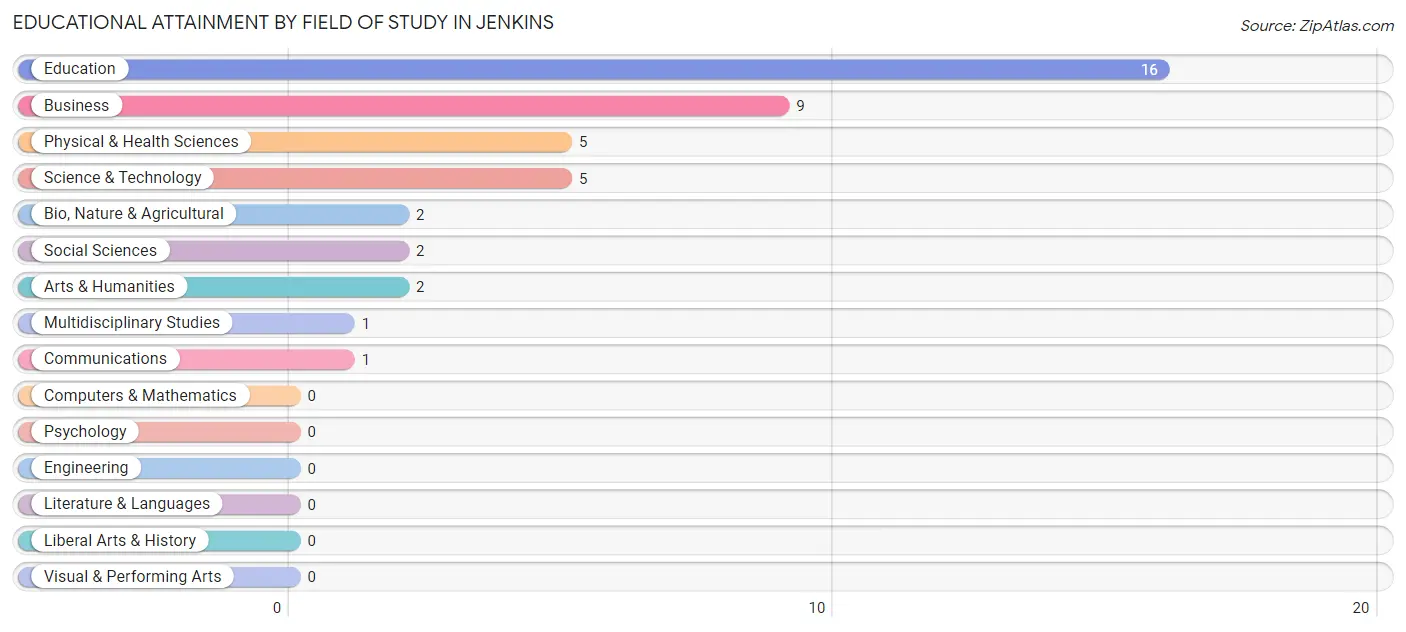
| Field of Study | # Graduates | % Graduates |
| Computers & Mathematics | 0 | 0.0% |
| Bio, Nature & Agricultural | 2 | 4.6% |
| Physical & Health Sciences | 5 | 11.6% |
| Psychology | 0 | 0.0% |
| Social Sciences | 2 | 4.6% |
| Engineering | 0 | 0.0% |
| Multidisciplinary Studies | 1 | 2.3% |
| Science & Technology | 5 | 11.6% |
| Business | 9 | 20.9% |
| Education | 16 | 37.2% |
| Literature & Languages | 0 | 0.0% |
| Liberal Arts & History | 0 | 0.0% |
| Visual & Performing Arts | 0 | 0.0% |
| Communications | 1 | 2.3% |
| Arts & Humanities | 2 | 4.6% |
| Total | 43 | 100.0% |
Transportation & Commute in Jenkins
Vehicle Availability by Sex in Jenkins
The most prevalent vehicle ownership categories in Jenkins are males with 2 vehicles (45, accounting for 36.0%) and females with 2 vehicles (49, making up 37.2%).
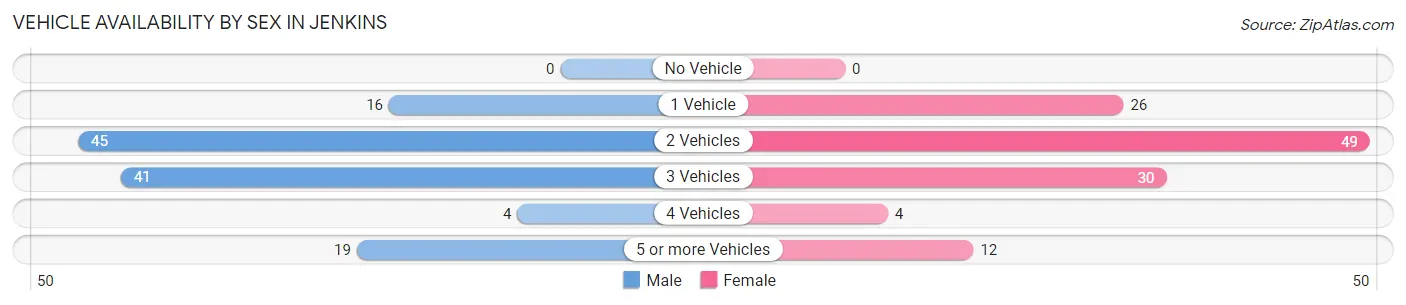
| Vehicles Available | Male | Female |
| No Vehicle | 0 (0.0%) | 0 (0.0%) |
| 1 Vehicle | 16 (12.8%) | 26 (21.5%) |
| 2 Vehicles | 45 (36.0%) | 49 (40.5%) |
| 3 Vehicles | 41 (32.8%) | 30 (24.8%) |
| 4 Vehicles | 4 (3.2%) | 4 (3.3%) |
| 5 or more Vehicles | 19 (15.2%) | 12 (9.9%) |
| Total | 125 (100.0%) | 121 (100.0%) |
Commute Time in Jenkins
The most frequently occuring commute durations in Jenkins are 10 to 14 minutes (51 commuters, 22.0%), 5 to 9 minutes (35 commuters, 15.1%), and 20 to 24 minutes (30 commuters, 12.9%).
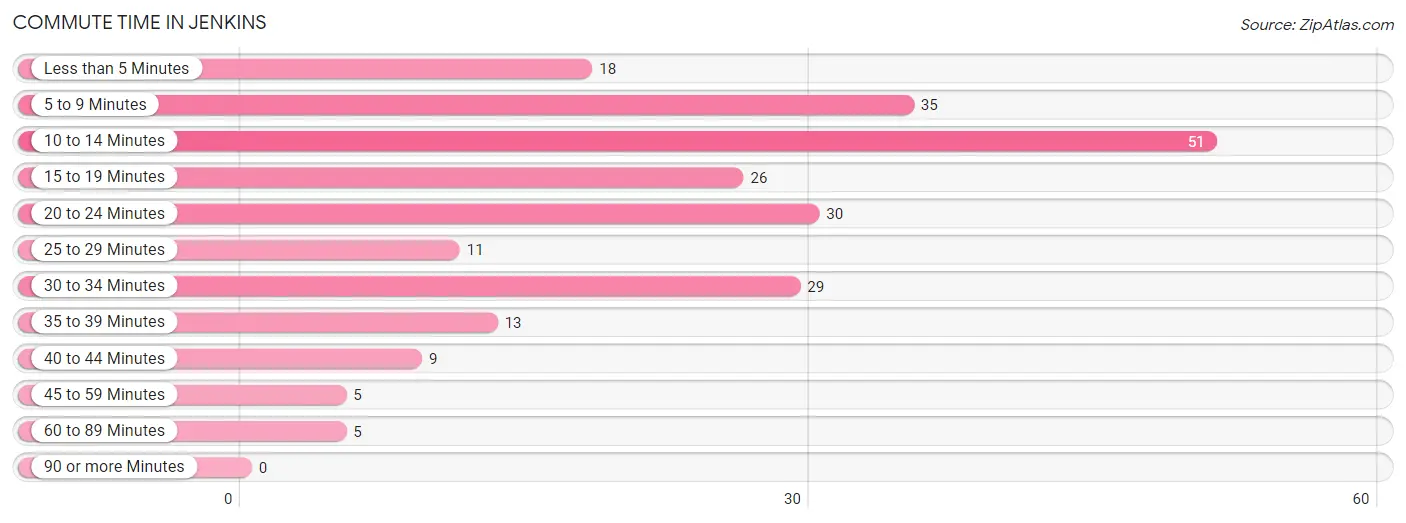
| Commute Time | # Commuters | % Commuters |
| Less than 5 Minutes | 18 | 7.8% |
| 5 to 9 Minutes | 35 | 15.1% |
| 10 to 14 Minutes | 51 | 22.0% |
| 15 to 19 Minutes | 26 | 11.2% |
| 20 to 24 Minutes | 30 | 12.9% |
| 25 to 29 Minutes | 11 | 4.7% |
| 30 to 34 Minutes | 29 | 12.5% |
| 35 to 39 Minutes | 13 | 5.6% |
| 40 to 44 Minutes | 9 | 3.9% |
| 45 to 59 Minutes | 5 | 2.2% |
| 60 to 89 Minutes | 5 | 2.2% |
| 90 or more Minutes | 0 | 0.0% |
Commute Time by Sex in Jenkins
The most common commute times in Jenkins are 5 to 9 minutes (26 commuters, 21.0%) for males and 10 to 14 minutes (31 commuters, 28.7%) for females.
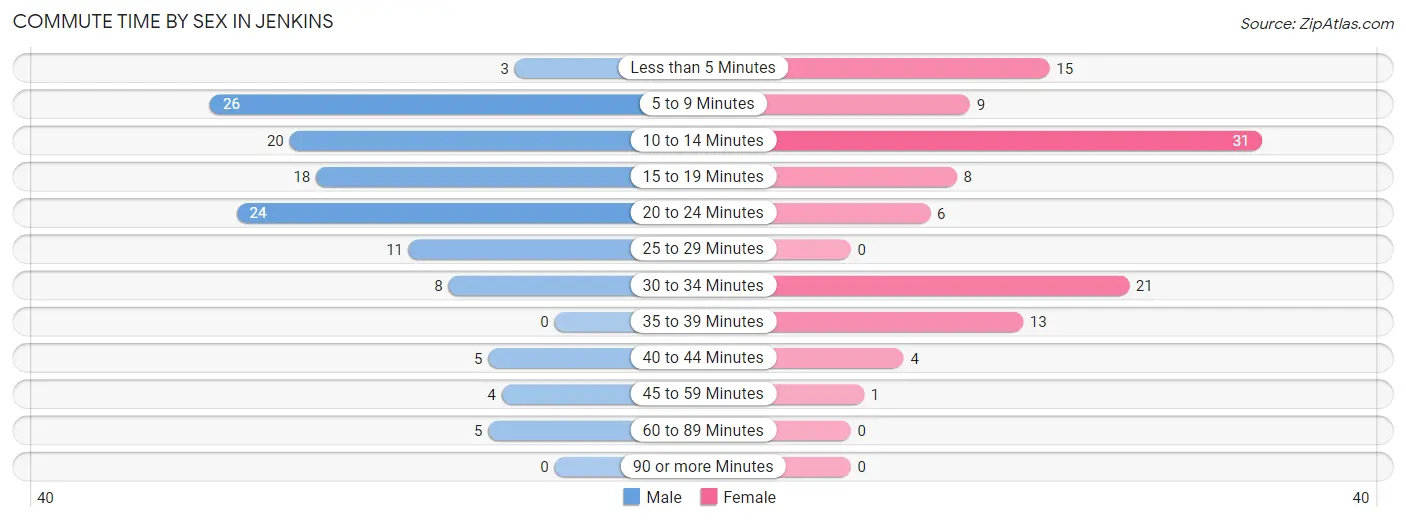
| Commute Time | Male | Female |
| Less than 5 Minutes | 3 (2.4%) | 15 (13.9%) |
| 5 to 9 Minutes | 26 (21.0%) | 9 (8.3%) |
| 10 to 14 Minutes | 20 (16.1%) | 31 (28.7%) |
| 15 to 19 Minutes | 18 (14.5%) | 8 (7.4%) |
| 20 to 24 Minutes | 24 (19.4%) | 6 (5.6%) |
| 25 to 29 Minutes | 11 (8.9%) | 0 (0.0%) |
| 30 to 34 Minutes | 8 (6.5%) | 21 (19.4%) |
| 35 to 39 Minutes | 0 (0.0%) | 13 (12.0%) |
| 40 to 44 Minutes | 5 (4.0%) | 4 (3.7%) |
| 45 to 59 Minutes | 4 (3.2%) | 1 (0.9%) |
| 60 to 89 Minutes | 5 (4.0%) | 0 (0.0%) |
| 90 or more Minutes | 0 (0.0%) | 0 (0.0%) |
Time of Departure to Work by Sex in Jenkins
The most frequent times of departure to work in Jenkins are 7:30 AM to 7:59 AM (31, 25.0%) for males and 8:00 AM to 8:29 AM (23, 21.3%) for females.
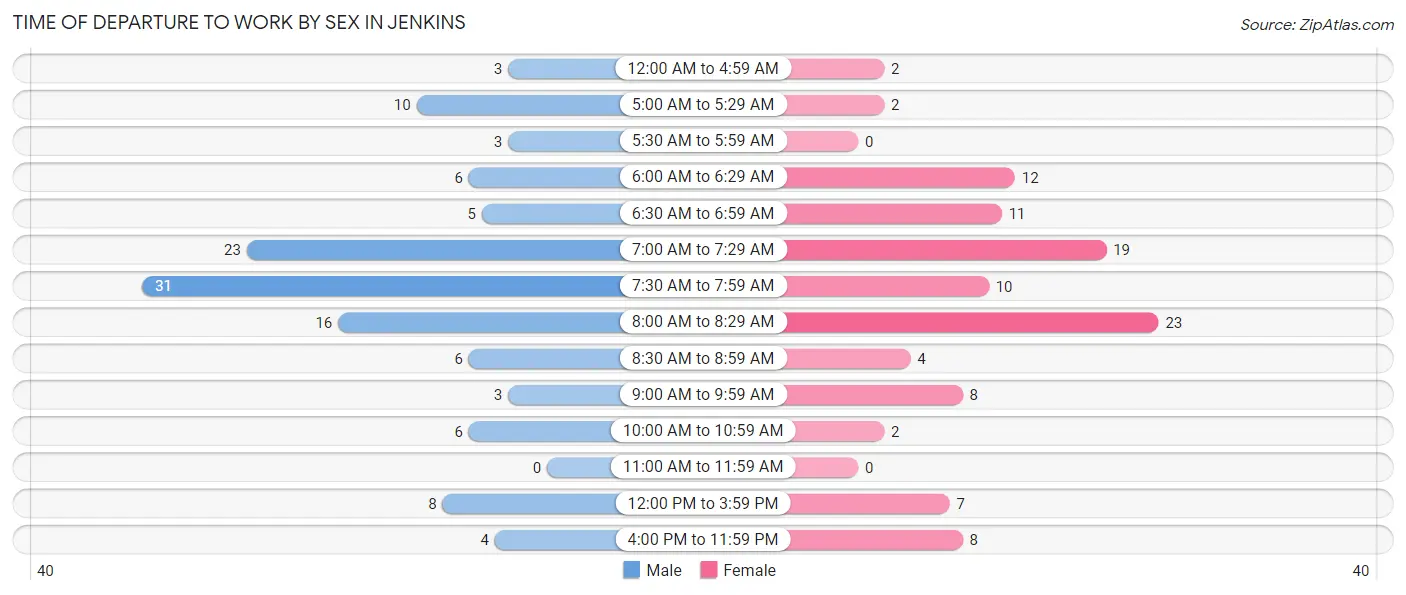
| Time of Departure | Male | Female |
| 12:00 AM to 4:59 AM | 3 (2.4%) | 2 (1.8%) |
| 5:00 AM to 5:29 AM | 10 (8.1%) | 2 (1.8%) |
| 5:30 AM to 5:59 AM | 3 (2.4%) | 0 (0.0%) |
| 6:00 AM to 6:29 AM | 6 (4.8%) | 12 (11.1%) |
| 6:30 AM to 6:59 AM | 5 (4.0%) | 11 (10.2%) |
| 7:00 AM to 7:29 AM | 23 (18.5%) | 19 (17.6%) |
| 7:30 AM to 7:59 AM | 31 (25.0%) | 10 (9.3%) |
| 8:00 AM to 8:29 AM | 16 (12.9%) | 23 (21.3%) |
| 8:30 AM to 8:59 AM | 6 (4.8%) | 4 (3.7%) |
| 9:00 AM to 9:59 AM | 3 (2.4%) | 8 (7.4%) |
| 10:00 AM to 10:59 AM | 6 (4.8%) | 2 (1.8%) |
| 11:00 AM to 11:59 AM | 0 (0.0%) | 0 (0.0%) |
| 12:00 PM to 3:59 PM | 8 (6.5%) | 7 (6.5%) |
| 4:00 PM to 11:59 PM | 4 (3.2%) | 8 (7.4%) |
| Total | 124 (100.0%) | 108 (100.0%) |
Housing Occupancy in Jenkins
Occupancy by Ownership in Jenkins
Of the total 169 dwellings in Jenkins, owner-occupied units account for 135 (79.9%), while renter-occupied units make up 34 (20.1%).
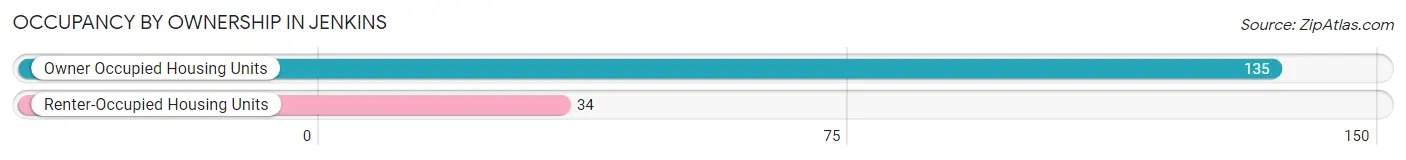
| Occupancy | # Housing Units | % Housing Units |
| Owner Occupied Housing Units | 135 | 79.9% |
| Renter-Occupied Housing Units | 34 | 20.1% |
| Total Occupied Housing Units | 169 | 100.0% |
Occupancy by Household Size in Jenkins
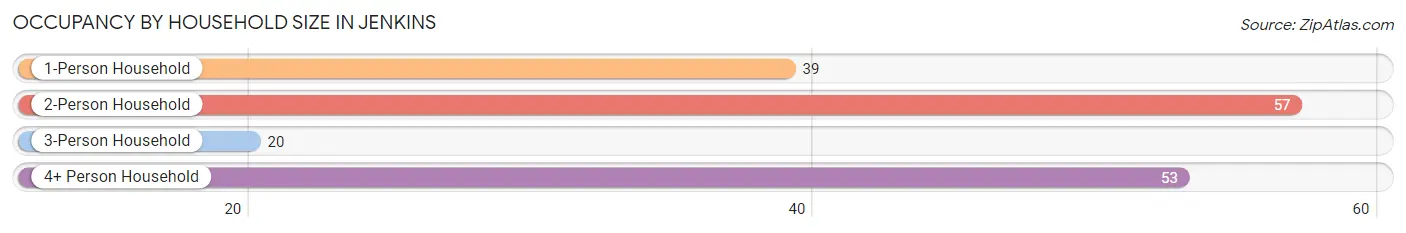
| Household Size | # Housing Units | % Housing Units |
| 1-Person Household | 39 | 23.1% |
| 2-Person Household | 57 | 33.7% |
| 3-Person Household | 20 | 11.8% |
| 4+ Person Household | 53 | 31.4% |
| Total Housing Units | 169 | 100.0% |
Occupancy by Ownership by Household Size in Jenkins
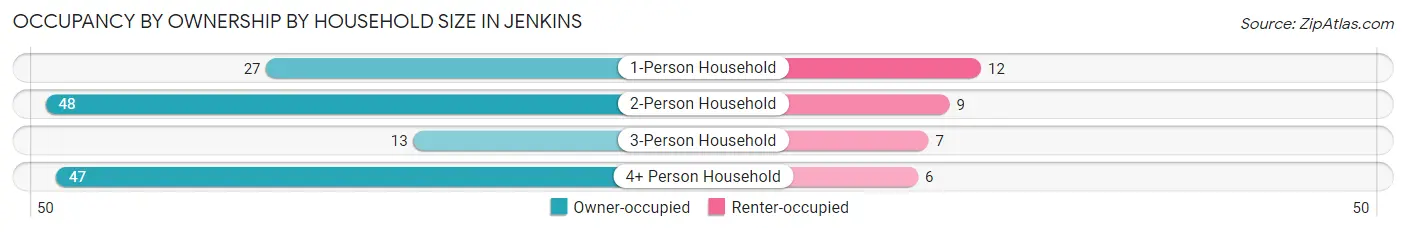
| Household Size | Owner-occupied | Renter-occupied |
| 1-Person Household | 27 (69.2%) | 12 (30.8%) |
| 2-Person Household | 48 (84.2%) | 9 (15.8%) |
| 3-Person Household | 13 (65.0%) | 7 (35.0%) |
| 4+ Person Household | 47 (88.7%) | 6 (11.3%) |
| Total Housing Units | 135 (79.9%) | 34 (20.1%) |
Occupancy by Educational Attainment in Jenkins
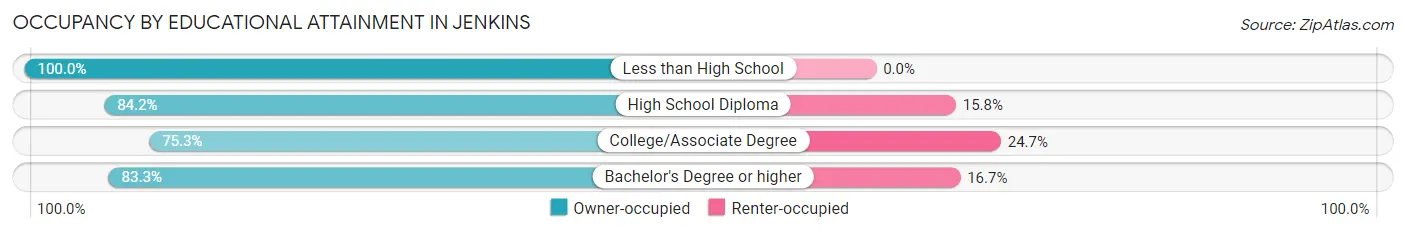
| Household Size | Owner-occupied | Renter-occupied |
| Less than High School | 3 (100.0%) | 0 (0.0%) |
| High School Diploma | 48 (84.2%) | 9 (15.8%) |
| College/Associate Degree | 64 (75.3%) | 21 (24.7%) |
| Bachelor's Degree or higher | 20 (83.3%) | 4 (16.7%) |
Occupancy by Age of Householder in Jenkins
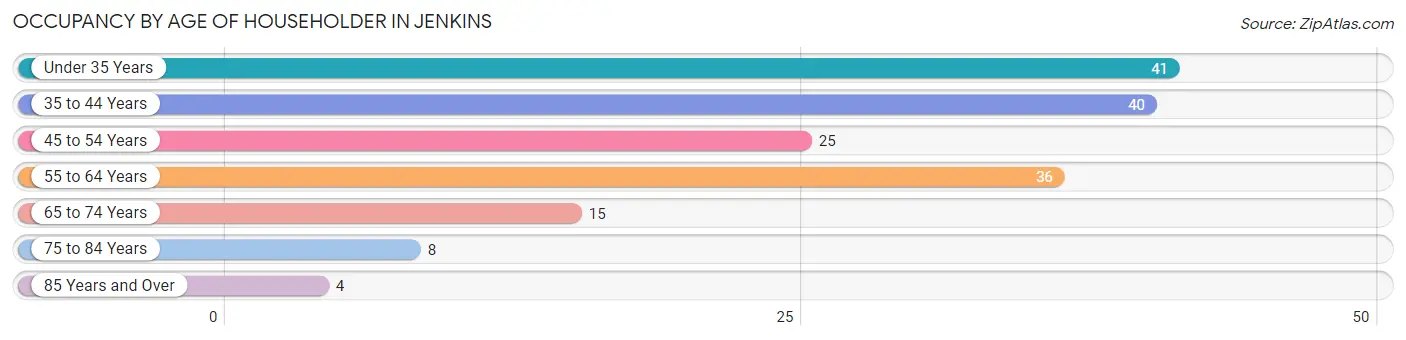
| Age Bracket | # Households | % Households |
| Under 35 Years | 41 | 24.3% |
| 35 to 44 Years | 40 | 23.7% |
| 45 to 54 Years | 25 | 14.8% |
| 55 to 64 Years | 36 | 21.3% |
| 65 to 74 Years | 15 | 8.9% |
| 75 to 84 Years | 8 | 4.7% |
| 85 Years and Over | 4 | 2.4% |
| Total | 169 | 100.0% |
Housing Finances in Jenkins
Median Income by Occupancy in Jenkins
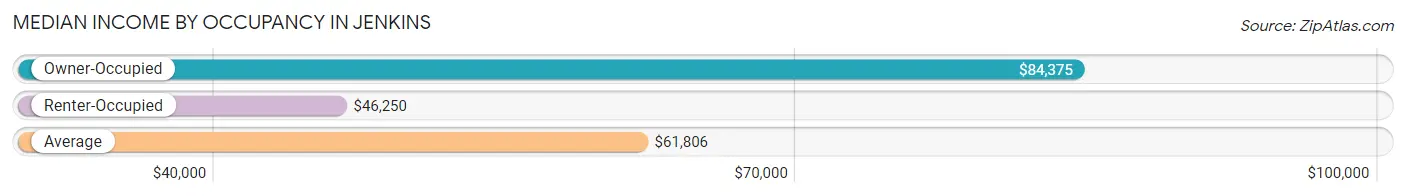
| Occupancy Type | # Households | Median Income |
| Owner-Occupied | 135 (79.9%) | $84,375 |
| Renter-Occupied | 34 (20.1%) | $46,250 |
| Average | 169 (100.0%) | $61,806 |
Occupancy by Householder Income Bracket in Jenkins
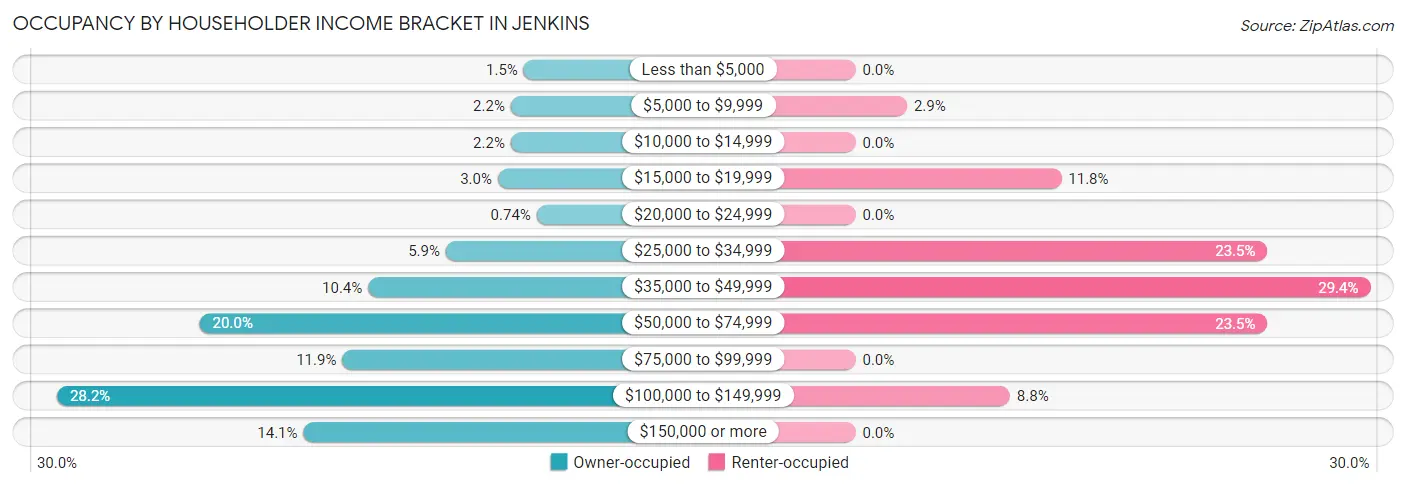
| Income Bracket | Owner-occupied | Renter-occupied |
| Less than $5,000 | 2 (1.5%) | 0 (0.0%) |
| $5,000 to $9,999 | 3 (2.2%) | 1 (2.9%) |
| $10,000 to $14,999 | 3 (2.2%) | 0 (0.0%) |
| $15,000 to $19,999 | 4 (3.0%) | 4 (11.8%) |
| $20,000 to $24,999 | 1 (0.7%) | 0 (0.0%) |
| $25,000 to $34,999 | 8 (5.9%) | 8 (23.5%) |
| $35,000 to $49,999 | 14 (10.4%) | 10 (29.4%) |
| $50,000 to $74,999 | 27 (20.0%) | 8 (23.5%) |
| $75,000 to $99,999 | 16 (11.8%) | 0 (0.0%) |
| $100,000 to $149,999 | 38 (28.1%) | 3 (8.8%) |
| $150,000 or more | 19 (14.1%) | 0 (0.0%) |
| Total | 135 (100.0%) | 34 (100.0%) |
Monthly Housing Cost Tiers in Jenkins
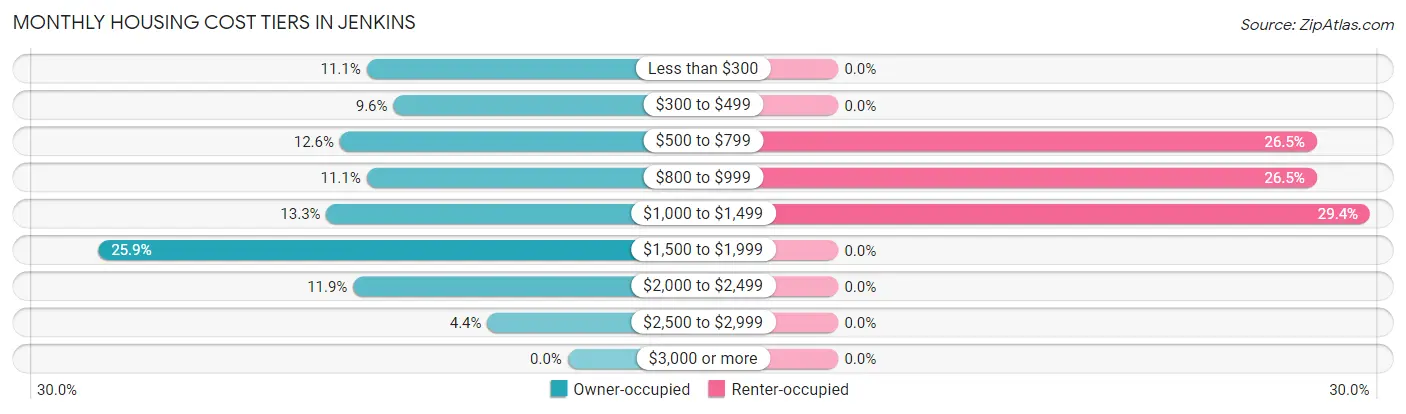
| Monthly Cost | Owner-occupied | Renter-occupied |
| Less than $300 | 15 (11.1%) | 0 (0.0%) |
| $300 to $499 | 13 (9.6%) | 0 (0.0%) |
| $500 to $799 | 17 (12.6%) | 9 (26.5%) |
| $800 to $999 | 15 (11.1%) | 9 (26.5%) |
| $1,000 to $1,499 | 18 (13.3%) | 10 (29.4%) |
| $1,500 to $1,999 | 35 (25.9%) | 0 (0.0%) |
| $2,000 to $2,499 | 16 (11.8%) | 0 (0.0%) |
| $2,500 to $2,999 | 6 (4.4%) | 0 (0.0%) |
| $3,000 or more | 0 (0.0%) | 0 (0.0%) |
| Total | 135 (100.0%) | 34 (100.0%) |
Physical Housing Characteristics in Jenkins
Housing Structures in Jenkins
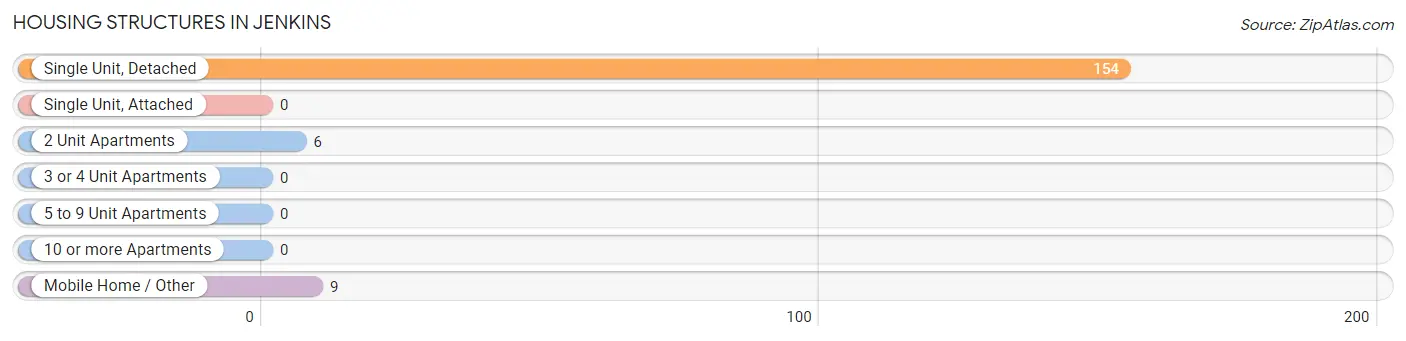
| Structure Type | # Housing Units | % Housing Units |
| Single Unit, Detached | 154 | 91.1% |
| Single Unit, Attached | 0 | 0.0% |
| 2 Unit Apartments | 6 | 3.5% |
| 3 or 4 Unit Apartments | 0 | 0.0% |
| 5 to 9 Unit Apartments | 0 | 0.0% |
| 10 or more Apartments | 0 | 0.0% |
| Mobile Home / Other | 9 | 5.3% |
| Total | 169 | 100.0% |
Housing Structures by Occupancy in Jenkins
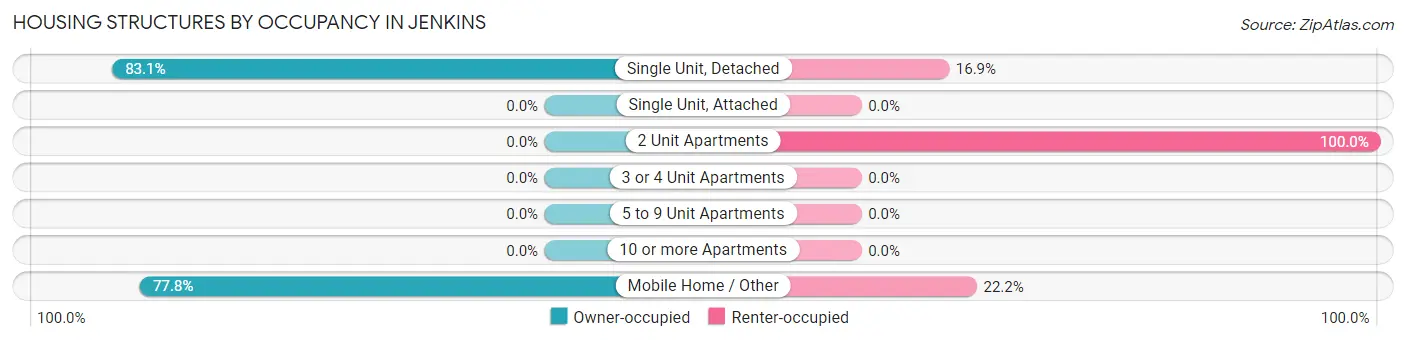
| Structure Type | Owner-occupied | Renter-occupied |
| Single Unit, Detached | 128 (83.1%) | 26 (16.9%) |
| Single Unit, Attached | 0 (0.0%) | 0 (0.0%) |
| 2 Unit Apartments | 0 (0.0%) | 6 (100.0%) |
| 3 or 4 Unit Apartments | 0 (0.0%) | 0 (0.0%) |
| 5 to 9 Unit Apartments | 0 (0.0%) | 0 (0.0%) |
| 10 or more Apartments | 0 (0.0%) | 0 (0.0%) |
| Mobile Home / Other | 7 (77.8%) | 2 (22.2%) |
| Total | 135 (79.9%) | 34 (20.1%) |
Housing Structures by Number of Rooms in Jenkins
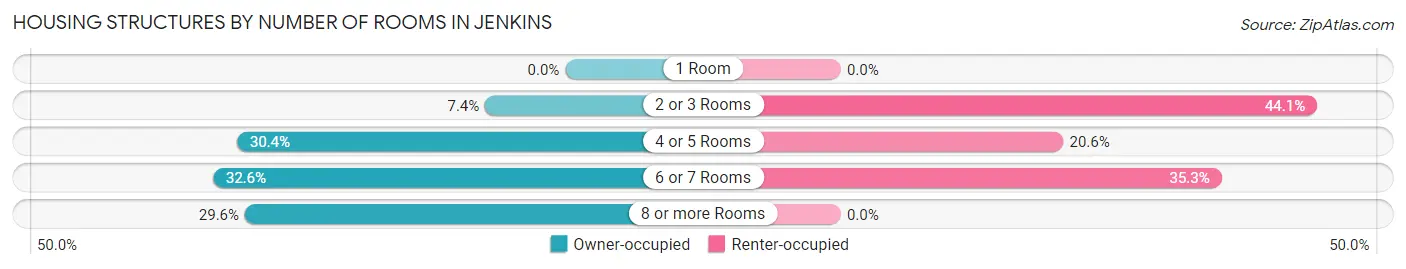
| Number of Rooms | Owner-occupied | Renter-occupied |
| 1 Room | 0 (0.0%) | 0 (0.0%) |
| 2 or 3 Rooms | 10 (7.4%) | 15 (44.1%) |
| 4 or 5 Rooms | 41 (30.4%) | 7 (20.6%) |
| 6 or 7 Rooms | 44 (32.6%) | 12 (35.3%) |
| 8 or more Rooms | 40 (29.6%) | 0 (0.0%) |
| Total | 135 (100.0%) | 34 (100.0%) |
Housing Structure by Heating Type in Jenkins
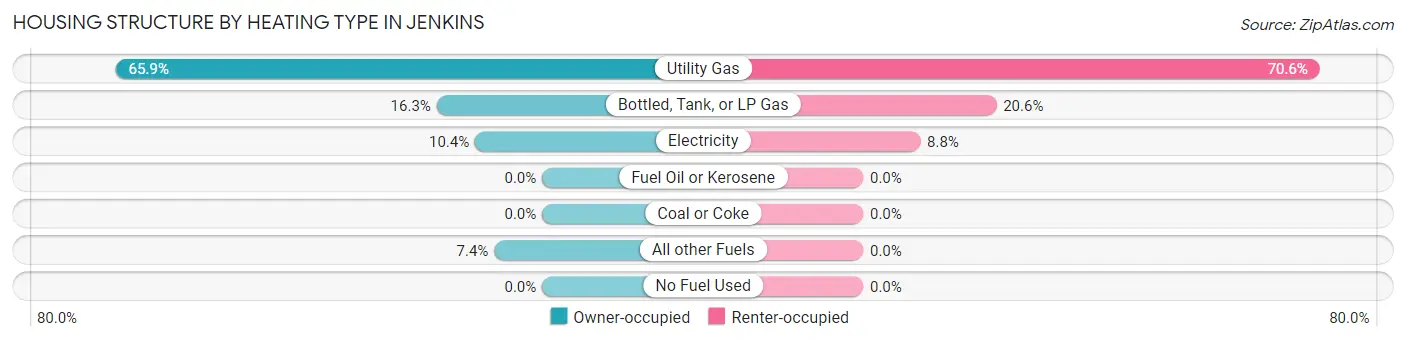
| Heating Type | Owner-occupied | Renter-occupied |
| Utility Gas | 89 (65.9%) | 24 (70.6%) |
| Bottled, Tank, or LP Gas | 22 (16.3%) | 7 (20.6%) |
| Electricity | 14 (10.4%) | 3 (8.8%) |
| Fuel Oil or Kerosene | 0 (0.0%) | 0 (0.0%) |
| Coal or Coke | 0 (0.0%) | 0 (0.0%) |
| All other Fuels | 10 (7.4%) | 0 (0.0%) |
| No Fuel Used | 0 (0.0%) | 0 (0.0%) |
| Total | 135 (100.0%) | 34 (100.0%) |
Household Vehicle Usage in Jenkins
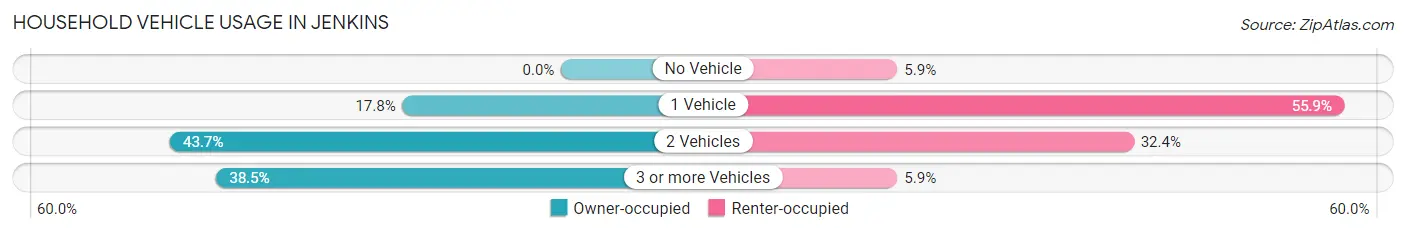
| Vehicles per Household | Owner-occupied | Renter-occupied |
| No Vehicle | 0 (0.0%) | 2 (5.9%) |
| 1 Vehicle | 24 (17.8%) | 19 (55.9%) |
| 2 Vehicles | 59 (43.7%) | 11 (32.4%) |
| 3 or more Vehicles | 52 (38.5%) | 2 (5.9%) |
| Total | 135 (100.0%) | 34 (100.0%) |
Real Estate & Mortgages in Jenkins
Real Estate and Mortgage Overview in Jenkins
| Characteristic | Without Mortgage | With Mortgage |
| Housing Units | 49 | 86 |
| Median Property Value | $238,300 | $259,100 |
| Median Household Income | $58,125 | $17 |
| Monthly Housing Costs | $413 | $0 |
| Real Estate Taxes | $1,886 | $0 |
Property Value by Mortgage Status in Jenkins
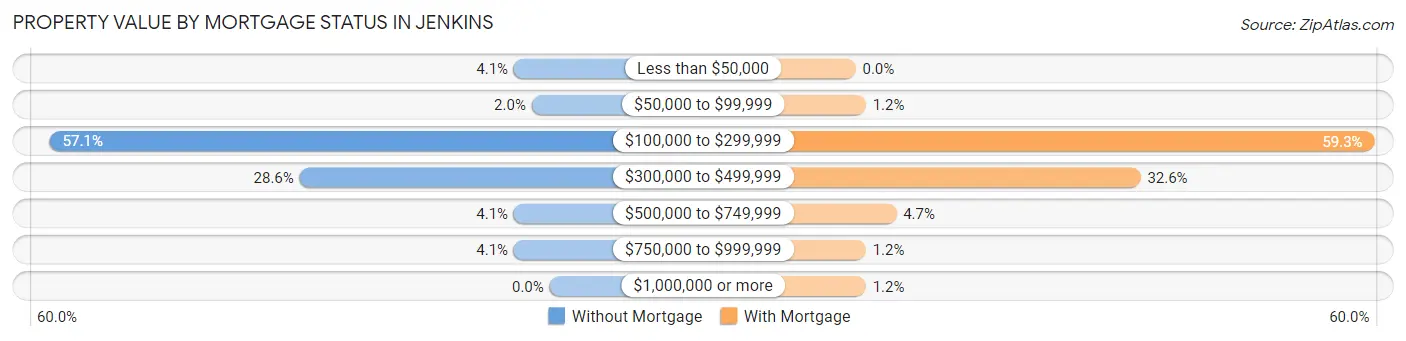
| Property Value | Without Mortgage | With Mortgage |
| Less than $50,000 | 2 (4.1%) | 0 (0.0%) |
| $50,000 to $99,999 | 1 (2.0%) | 1 (1.2%) |
| $100,000 to $299,999 | 28 (57.1%) | 51 (59.3%) |
| $300,000 to $499,999 | 14 (28.6%) | 28 (32.6%) |
| $500,000 to $749,999 | 2 (4.1%) | 4 (4.6%) |
| $750,000 to $999,999 | 2 (4.1%) | 1 (1.2%) |
| $1,000,000 or more | 0 (0.0%) | 1 (1.2%) |
| Total | 49 (100.0%) | 86 (100.0%) |
Household Income by Mortgage Status in Jenkins
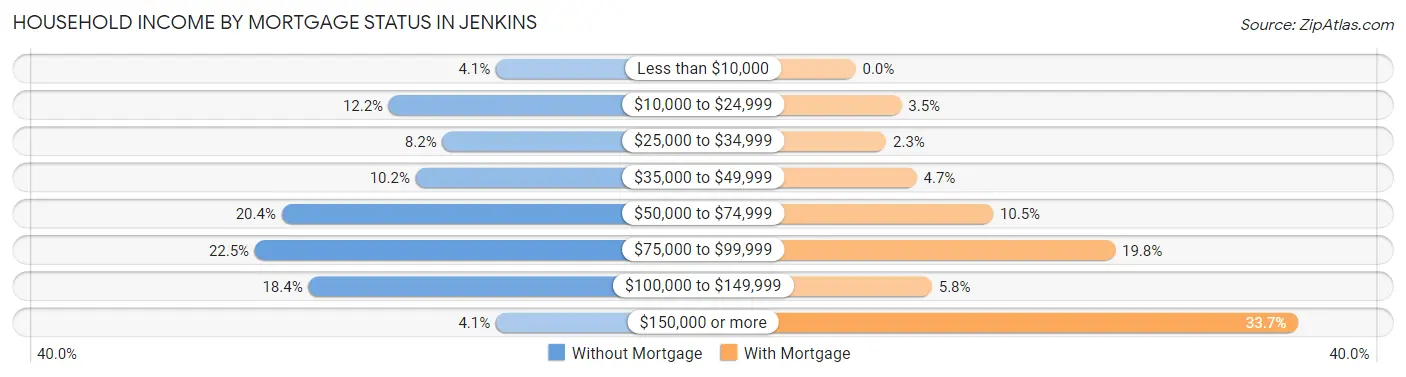
| Household Income | Without Mortgage | With Mortgage |
| Less than $10,000 | 2 (4.1%) | 0 (0.0%) |
| $10,000 to $24,999 | 6 (12.2%) | 3 (3.5%) |
| $25,000 to $34,999 | 4 (8.2%) | 2 (2.3%) |
| $35,000 to $49,999 | 5 (10.2%) | 4 (4.6%) |
| $50,000 to $74,999 | 10 (20.4%) | 9 (10.5%) |
| $75,000 to $99,999 | 11 (22.5%) | 17 (19.8%) |
| $100,000 to $149,999 | 9 (18.4%) | 5 (5.8%) |
| $150,000 or more | 2 (4.1%) | 29 (33.7%) |
| Total | 49 (100.0%) | 86 (100.0%) |
Property Value to Household Income Ratio in Jenkins
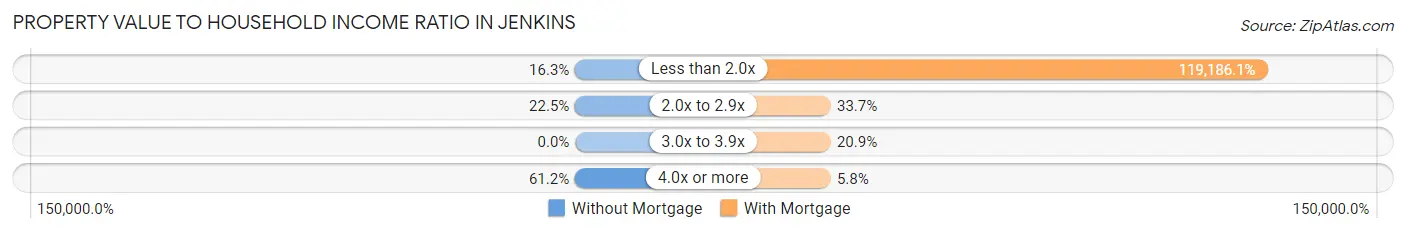
| Value-to-Income Ratio | Without Mortgage | With Mortgage |
| Less than 2.0x | 8 (16.3%) | 102,500 (119,186.1%) |
| 2.0x to 2.9x | 11 (22.5%) | 29 (33.7%) |
| 3.0x to 3.9x | 0 (0.0%) | 18 (20.9%) |
| 4.0x or more | 30 (61.2%) | 5 (5.8%) |
| Total | 49 (100.0%) | 86 (100.0%) |
Real Estate Taxes by Mortgage Status in Jenkins
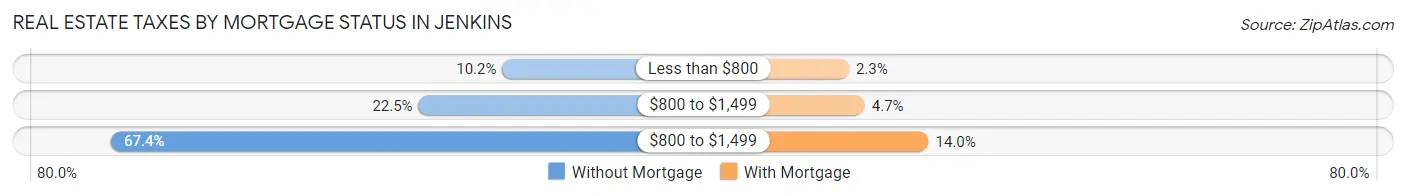
| Property Taxes | Without Mortgage | With Mortgage |
| Less than $800 | 5 (10.2%) | 2 (2.3%) |
| $800 to $1,499 | 11 (22.5%) | 4 (4.6%) |
| $800 to $1,499 | 33 (67.3%) | 12 (14.0%) |
| Total | 49 (100.0%) | 86 (100.0%) |
Health & Disability in Jenkins
Health Insurance Coverage by Age in Jenkins
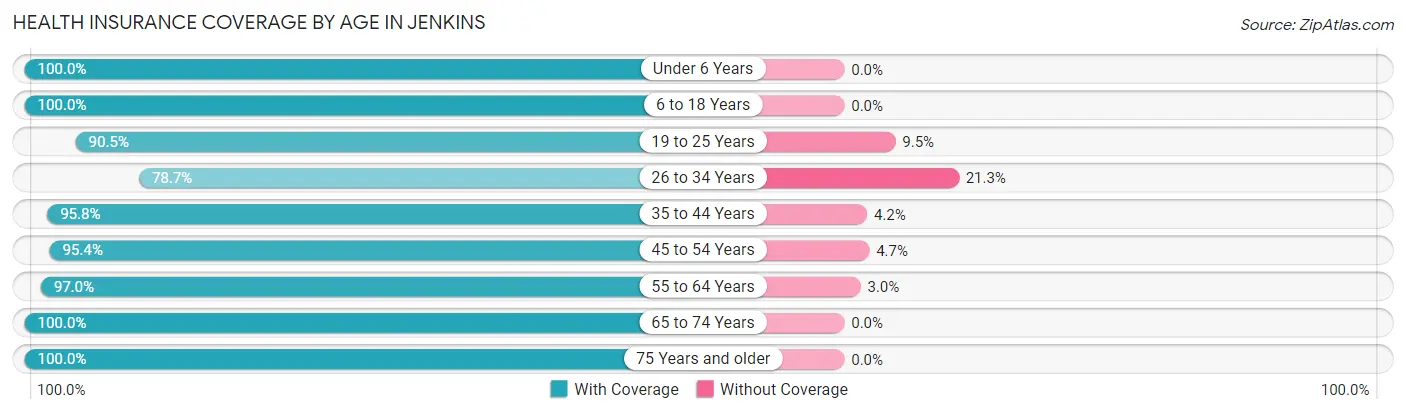
| Age Bracket | With Coverage | Without Coverage |
| Under 6 Years | 41 (100.0%) | 0 (0.0%) |
| 6 to 18 Years | 103 (100.0%) | 0 (0.0%) |
| 19 to 25 Years | 19 (90.5%) | 2 (9.5%) |
| 26 to 34 Years | 59 (78.7%) | 16 (21.3%) |
| 35 to 44 Years | 68 (95.8%) | 3 (4.2%) |
| 45 to 54 Years | 41 (95.4%) | 2 (4.6%) |
| 55 to 64 Years | 64 (97.0%) | 2 (3.0%) |
| 65 to 74 Years | 21 (100.0%) | 0 (0.0%) |
| 75 Years and older | 16 (100.0%) | 0 (0.0%) |
| Total | 432 (94.5%) | 25 (5.5%) |
Health Insurance Coverage by Citizenship Status in Jenkins
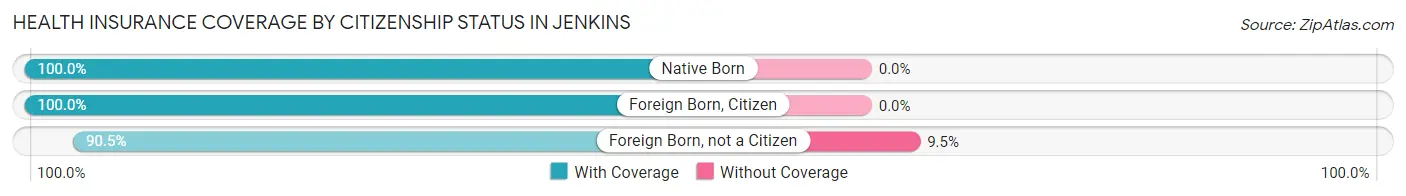
| Citizenship Status | With Coverage | Without Coverage |
| Native Born | 41 (100.0%) | 0 (0.0%) |
| Foreign Born, Citizen | 103 (100.0%) | 0 (0.0%) |
| Foreign Born, not a Citizen | 19 (90.5%) | 2 (9.5%) |
Health Insurance Coverage by Household Income in Jenkins
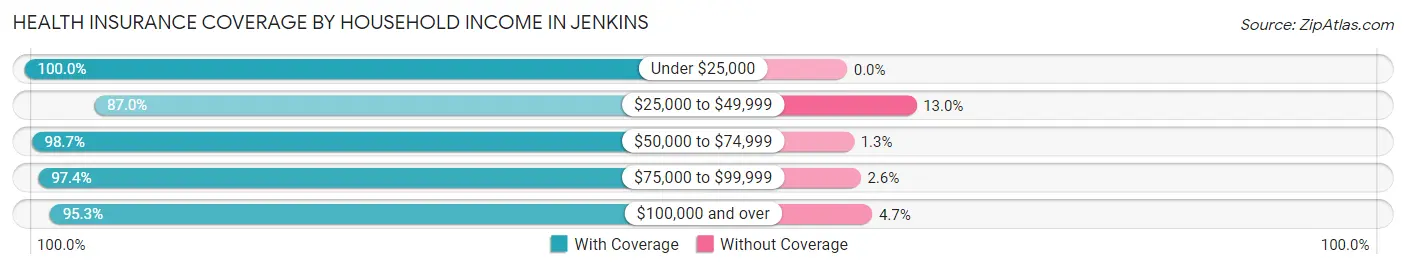
| Household Income | With Coverage | Without Coverage |
| Under $25,000 | 29 (100.0%) | 0 (0.0%) |
| $25,000 to $49,999 | 87 (87.0%) | 13 (13.0%) |
| $50,000 to $74,999 | 76 (98.7%) | 1 (1.3%) |
| $75,000 to $99,999 | 38 (97.4%) | 1 (2.6%) |
| $100,000 and over | 202 (95.3%) | 10 (4.7%) |
Public vs Private Health Insurance Coverage by Age in Jenkins
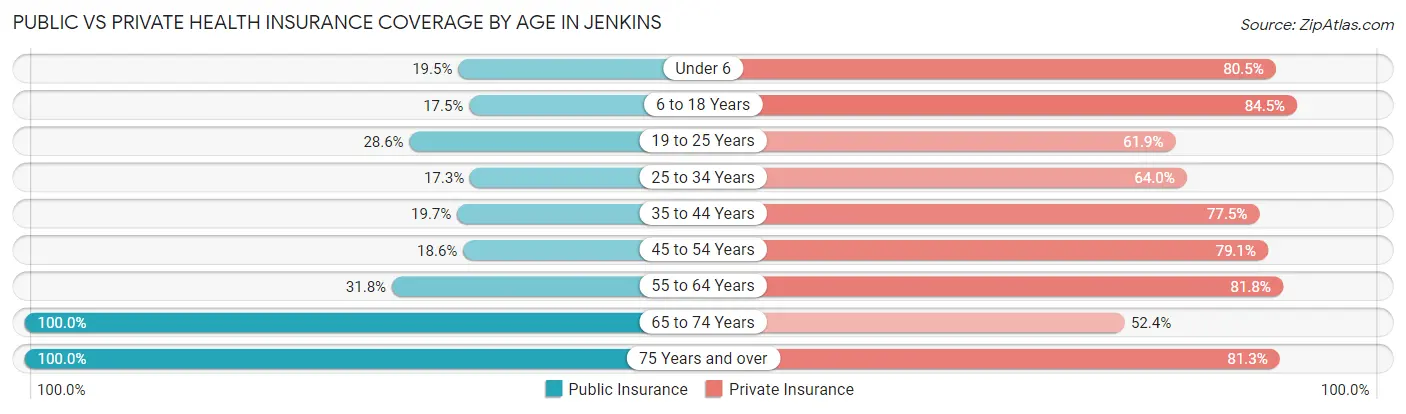
| Age Bracket | Public Insurance | Private Insurance |
| Under 6 | 8 (19.5%) | 33 (80.5%) |
| 6 to 18 Years | 18 (17.5%) | 87 (84.5%) |
| 19 to 25 Years | 6 (28.6%) | 13 (61.9%) |
| 25 to 34 Years | 13 (17.3%) | 48 (64.0%) |
| 35 to 44 Years | 14 (19.7%) | 55 (77.5%) |
| 45 to 54 Years | 8 (18.6%) | 34 (79.1%) |
| 55 to 64 Years | 21 (31.8%) | 54 (81.8%) |
| 65 to 74 Years | 21 (100.0%) | 11 (52.4%) |
| 75 Years and over | 16 (100.0%) | 13 (81.2%) |
| Total | 125 (27.4%) | 348 (76.1%) |
Disability Status by Sex by Age in Jenkins
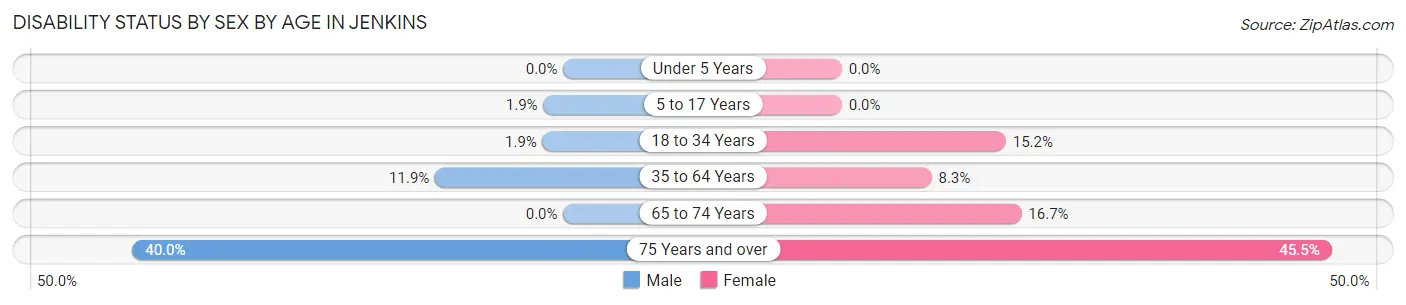
| Age Bracket | Male | Female |
| Under 5 Years | 0 (0.0%) | 0 (0.0%) |
| 5 to 17 Years | 1 (1.8%) | 0 (0.0%) |
| 18 to 34 Years | 1 (1.9%) | 7 (15.2%) |
| 35 to 64 Years | 10 (11.9%) | 8 (8.3%) |
| 65 to 74 Years | 0 (0.0%) | 1 (16.7%) |
| 75 Years and over | 2 (40.0%) | 5 (45.5%) |
Disability Class by Sex by Age in Jenkins
Disability Class: Hearing Difficulty
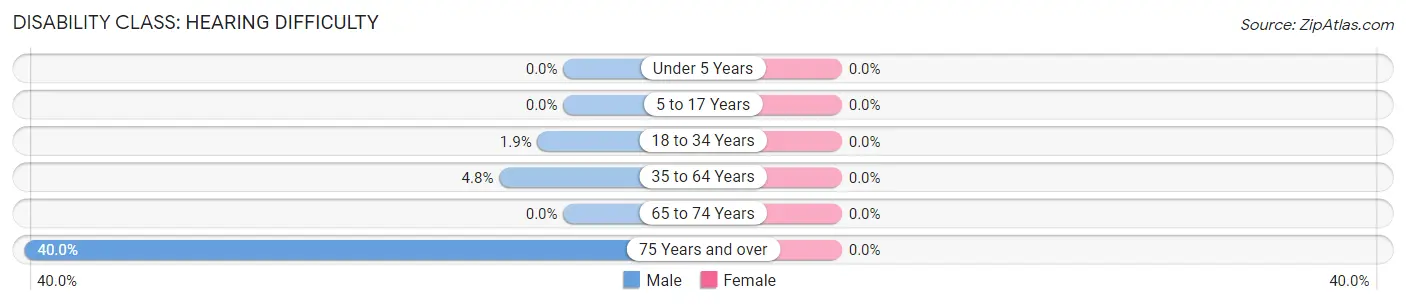
| Age Bracket | Male | Female |
| Under 5 Years | 0 (0.0%) | 0 (0.0%) |
| 5 to 17 Years | 0 (0.0%) | 0 (0.0%) |
| 18 to 34 Years | 1 (1.9%) | 0 (0.0%) |
| 35 to 64 Years | 4 (4.8%) | 0 (0.0%) |
| 65 to 74 Years | 0 (0.0%) | 0 (0.0%) |
| 75 Years and over | 2 (40.0%) | 0 (0.0%) |
Disability Class: Vision Difficulty
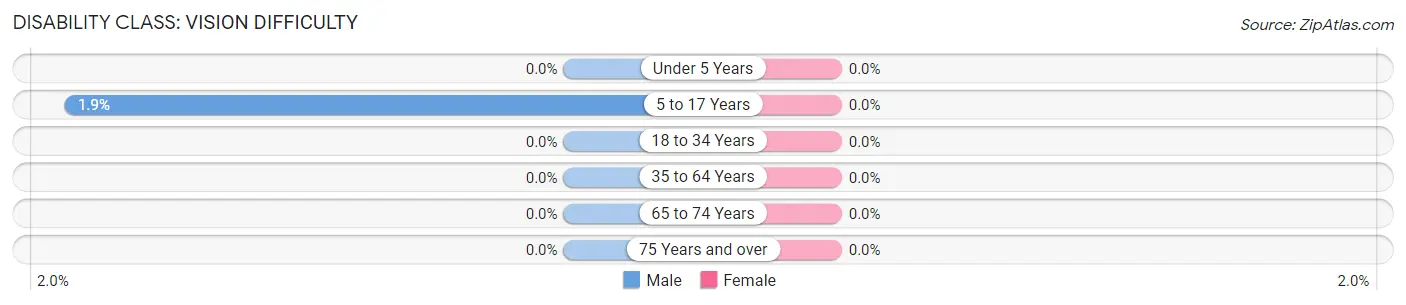
| Age Bracket | Male | Female |
| Under 5 Years | 0 (0.0%) | 0 (0.0%) |
| 5 to 17 Years | 1 (1.8%) | 0 (0.0%) |
| 18 to 34 Years | 0 (0.0%) | 0 (0.0%) |
| 35 to 64 Years | 0 (0.0%) | 0 (0.0%) |
| 65 to 74 Years | 0 (0.0%) | 0 (0.0%) |
| 75 Years and over | 0 (0.0%) | 0 (0.0%) |
Disability Class: Cognitive Difficulty
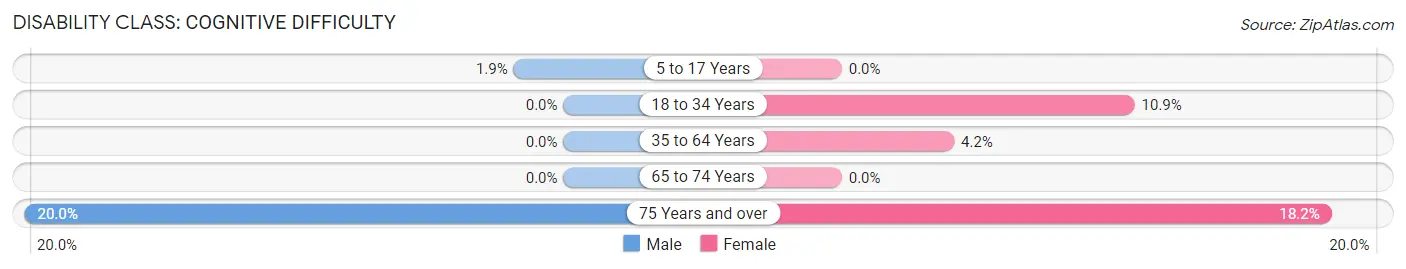
| Age Bracket | Male | Female |
| 5 to 17 Years | 1 (1.8%) | 0 (0.0%) |
| 18 to 34 Years | 0 (0.0%) | 5 (10.9%) |
| 35 to 64 Years | 0 (0.0%) | 4 (4.2%) |
| 65 to 74 Years | 0 (0.0%) | 0 (0.0%) |
| 75 Years and over | 1 (20.0%) | 2 (18.2%) |
Disability Class: Ambulatory Difficulty
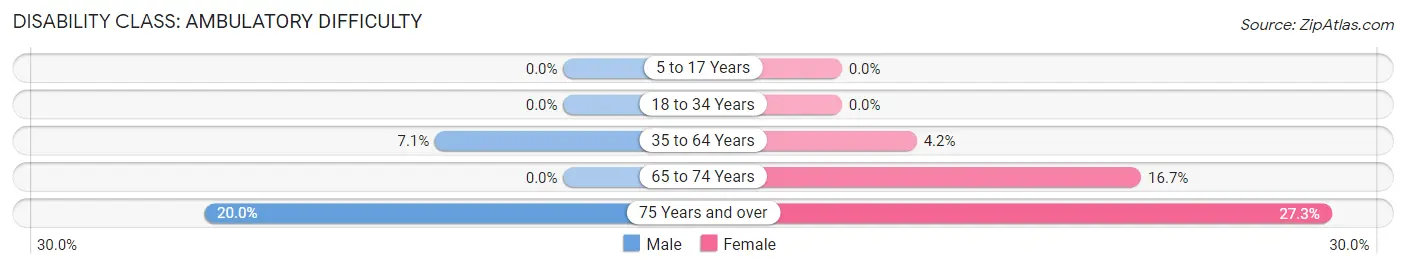
| Age Bracket | Male | Female |
| 5 to 17 Years | 0 (0.0%) | 0 (0.0%) |
| 18 to 34 Years | 0 (0.0%) | 0 (0.0%) |
| 35 to 64 Years | 6 (7.1%) | 4 (4.2%) |
| 65 to 74 Years | 0 (0.0%) | 1 (16.7%) |
| 75 Years and over | 1 (20.0%) | 3 (27.3%) |
Disability Class: Self-Care Difficulty
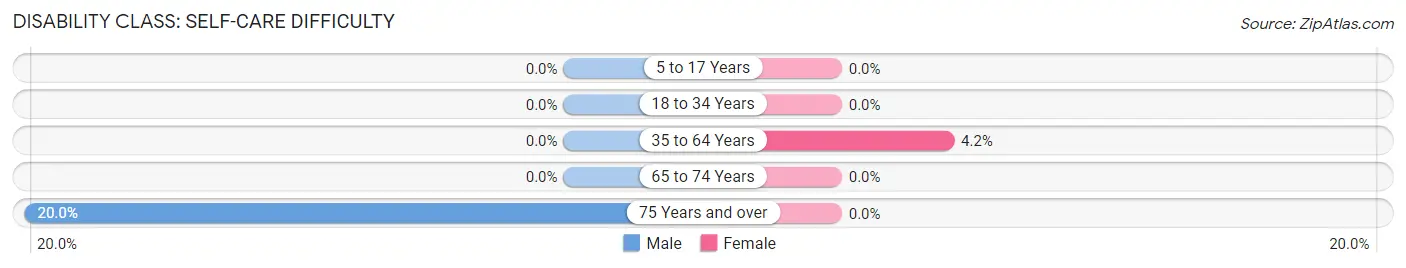
| Age Bracket | Male | Female |
| 5 to 17 Years | 0 (0.0%) | 0 (0.0%) |
| 18 to 34 Years | 0 (0.0%) | 0 (0.0%) |
| 35 to 64 Years | 0 (0.0%) | 4 (4.2%) |
| 65 to 74 Years | 0 (0.0%) | 0 (0.0%) |
| 75 Years and over | 1 (20.0%) | 0 (0.0%) |
Technology Access in Jenkins
Computing Device Access in Jenkins
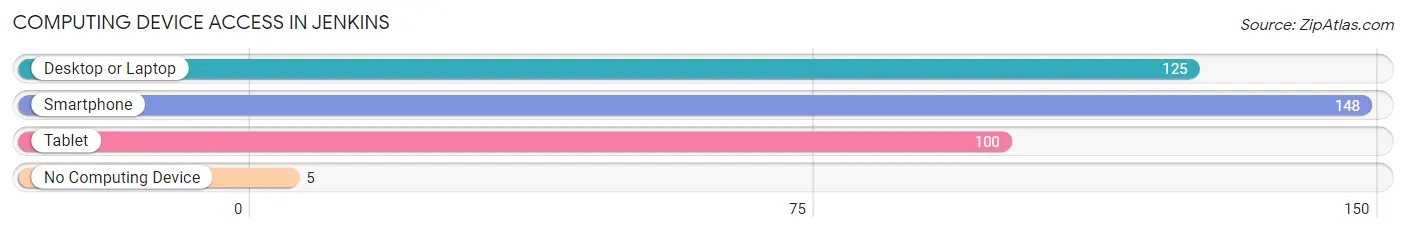
| Device Type | # Households | % Households |
| Desktop or Laptop | 125 | 74.0% |
| Smartphone | 148 | 87.6% |
| Tablet | 100 | 59.2% |
| No Computing Device | 5 | 3.0% |
| Total | 169 | 100.0% |
Internet Access in Jenkins
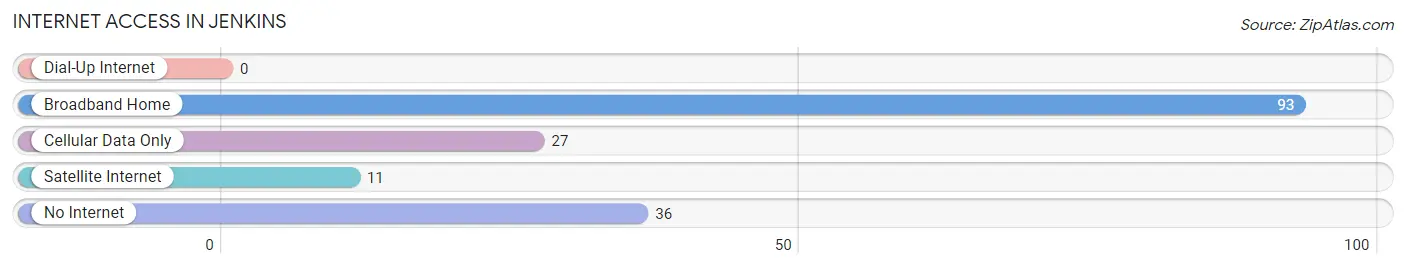
| Internet Type | # Households | % Households |
| Dial-Up Internet | 0 | 0.0% |
| Broadband Home | 93 | 55.0% |
| Cellular Data Only | 27 | 16.0% |
| Satellite Internet | 11 | 6.5% |
| No Internet | 36 | 21.3% |
| Total | 169 | 100.0% |
Jenkins Summary
Jenkins, Minnesota is a small city located in the northern part of the state, in St. Louis County. It is situated on the banks of the St. Louis River, and is surrounded by the cities of Duluth, Cloquet, and Superior, Wisconsin. The population of Jenkins was 1,845 at the 2010 census, making it the smallest city in St. Louis County.
History
Jenkins was founded in 1887 by William Jenkins, a lumberman from Wisconsin. He purchased land along the St. Louis River and built a sawmill, which became the center of the town. The town was named after him, and the first post office was established in 1888.
The town grew rapidly in the early 1900s, and by 1910, it had a population of 1,000. The town was incorporated in 1912, and the first mayor was elected in 1913.
The town continued to grow throughout the 20th century, and by the 1950s, it had a population of over 2,000. The town was home to several industries, including a paper mill, a sawmill, and a flour mill.
Geography
Jenkins is located in the northern part of St. Louis County, on the banks of the St. Louis River. The city is surrounded by the cities of Duluth, Cloquet, and Superior, Wisconsin. The city has a total area of 1.2 square miles, all of which is land.
The city is located in a hilly area, with the highest point being the summit of Jenkins Hill, which is 890 feet above sea level. The city is located in a temperate climate, with average temperatures ranging from -10°F in the winter to 80°F in the summer.
Economy
Jenkins is a small city, and its economy is largely based on tourism and small businesses. The city is home to several small businesses, including restaurants, retail stores, and service providers. The city is also home to a paper mill, a sawmill, and a flour mill.
The city is also home to several tourist attractions, including the St. Louis River, the Jenkins Historical Museum, and the Jenkins City Park. The city also hosts several annual events, including the Jenkins Summer Festival and the Jenkins Winter Festival.
Demographics
As of the 2010 census, the population of Jenkins was 1,845. The racial makeup of the city was 94.3% White, 0.7% African American, 0.3% Native American, 0.2% Asian, 0.1% Pacific Islander, 0.2% from other races, and 4.2% from two or more races. Hispanic or Latino of any race were 1.2% of the population.
The median income for a household in the city was $37,917, and the median income for a family was $45,000. The per capita income for the city was $19,945. About 11.2% of families and 14.2% of the population were below the poverty line, including 18.2% of those under age 18 and 8.3% of those age 65 or over.
Common Questions
What is Per Capita Income in Jenkins?
Per Capita income in Jenkins is $33,712.
What is the Median Family Income in Jenkins?
Median Family Income in Jenkins is $88,125.
What is the Median Household income in Jenkins?
Median Household Income in Jenkins is $61,806.
What is Income or Wage Gap in Jenkins?
Income or Wage Gap in Jenkins is 27.7%.
Women in Jenkins earn 72.3 cents for every dollar earned by a man.
What is Inequality or Gini Index in Jenkins?
Inequality or Gini Index in Jenkins is 0.44.
What is the Total Population of Jenkins?
Total Population of Jenkins is 457.
What is the Total Male Population of Jenkins?
Total Male Population of Jenkins is 221.
What is the Total Female Population of Jenkins?
Total Female Population of Jenkins is 236.
What is the Ratio of Males per 100 Females in Jenkins?
There are 93.64 Males per 100 Females in Jenkins.
What is the Ratio of Females per 100 Males in Jenkins?
There are 106.79 Females per 100 Males in Jenkins.
What is the Median Population Age in Jenkins?
Median Population Age in Jenkins is 33.6 Years.
What is the Average Family Size in Jenkins
Average Family Size in Jenkins is 3.2 People.
What is the Average Household Size in Jenkins
Average Household Size in Jenkins is 2.7 People.
How Large is the Labor Force in Jenkins?
There are 257 People in the Labor Forcein in Jenkins.
What is the Percentage of People in the Labor Force in Jenkins?
78.4% of People are in the Labor Force in Jenkins.
What is the Unemployment Rate in Jenkins?
Unemployment Rate in Jenkins is 3.1%.