Monticello, MN Map & Demographics
Monticello Map
Monticello Overview
$33,503
PER CAPITA INCOME
$100,481
AVG FAMILY INCOME
$80,290
AVG HOUSEHOLD INCOME
24.9%
WAGE / INCOME GAP [ % ]
75.1¢/ $1
WAGE / INCOME GAP [ $ ]
$14,567
FAMILY INCOME DEFICIT
0.35
INEQUALITY / GINI INDEX
14,447
TOTAL POPULATION
7,141
MALE POPULATION
7,306
FEMALE POPULATION
97.74
MALES / 100 FEMALES
102.31
FEMALES / 100 MALES
34.1
MEDIAN AGE
3.3
AVG FAMILY SIZE
2.6
AVG HOUSEHOLD SIZE
8,079
LABOR FORCE [ PEOPLE ]
73.2%
PERCENT IN LABOR FORCE
1.8%
UNEMPLOYMENT RATE
Monticello Zip Codes
Monticello Area Codes
Income in Monticello
Income Overview in Monticello
Per Capita Income in Monticello is $33,503, while median incomes of families and households are $100,481 and $80,290 respectively.
| Characteristic | Number | Measure |
| Per Capita Income | 14,447 | $33,503 |
| Median Family Income | 3,352 | $100,481 |
| Mean Family Income | 3,352 | $102,513 |
| Median Household Income | 5,548 | $80,290 |
| Mean Household Income | 5,548 | $87,474 |
| Income Deficit | 3,352 | $14,567 |
| Wage / Income Gap (%) | 14,447 | 24.87% |
| Wage / Income Gap ($) | 14,447 | 75.13¢ per $1 |
| Gini / Inequality Index | 14,447 | 0.35 |
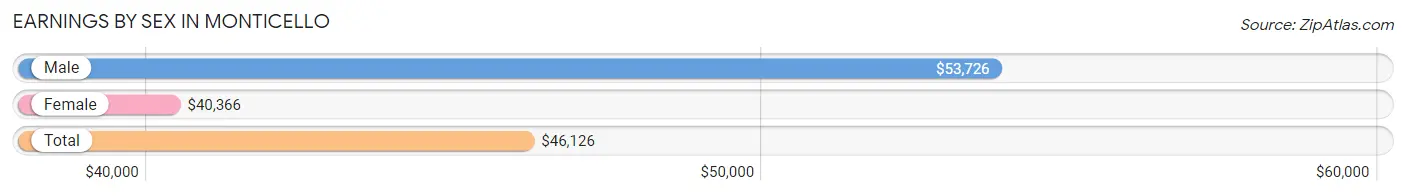
Earnings by Sex in Monticello
Average Earnings in Monticello are $46,126, $53,726 for men and $40,366 for women, a difference of 24.9%.
| Sex | Number | Average Earnings |
| Male | 4,621 (52.9%) | $53,726 |
| Female | 4,120 (47.1%) | $40,366 |
| Total | 8,741 (100.0%) | $46,126 |
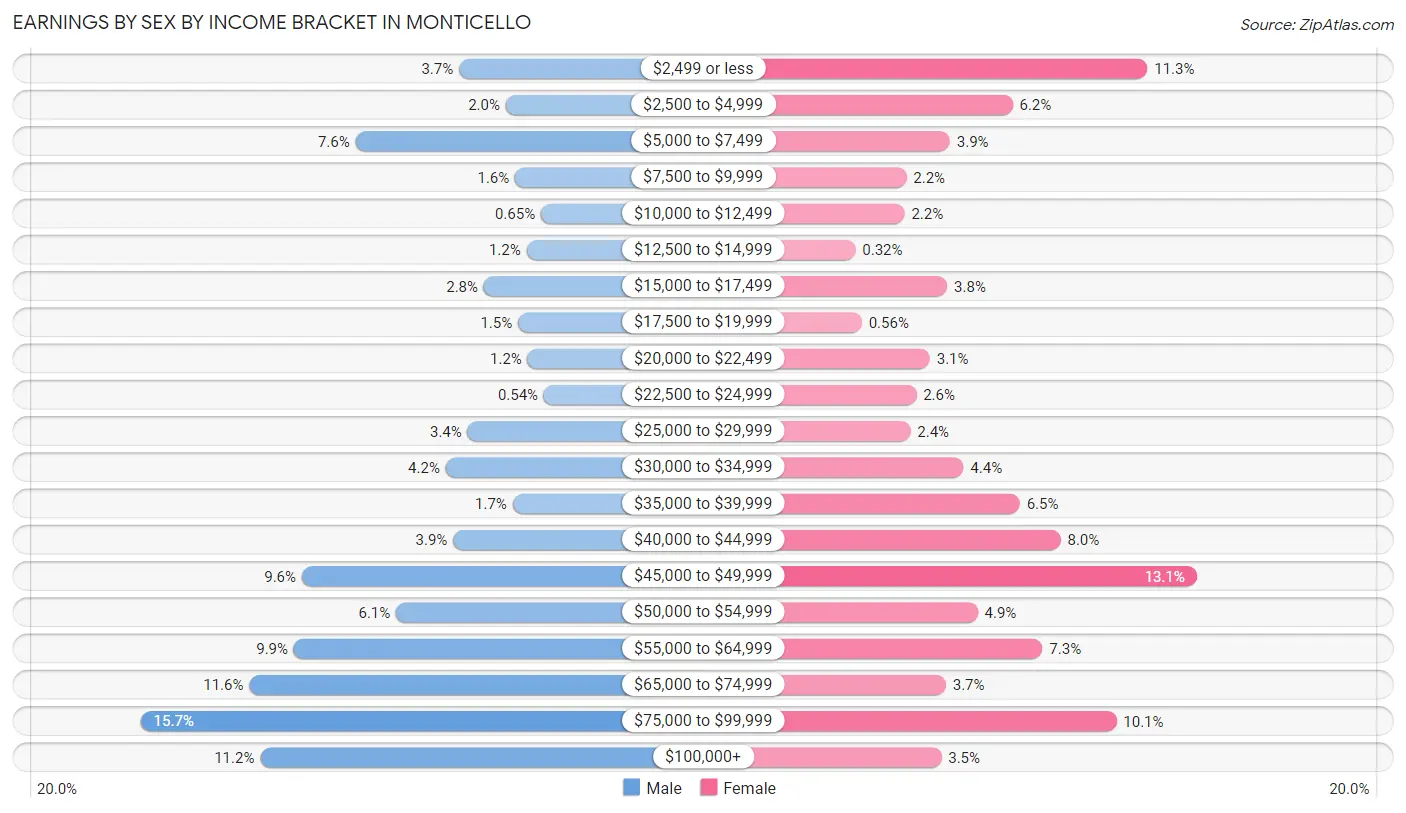
Earnings by Sex by Income Bracket in Monticello
The most common earnings brackets in Monticello are $75,000 to $99,999 for men (723 | 15.7%) and $45,000 to $49,999 for women (540 | 13.1%).
| Income | Male | Female |
| $2,499 or less | 172 (3.7%) | 464 (11.3%) |
| $2,500 to $4,999 | 91 (2.0%) | 256 (6.2%) |
| $5,000 to $7,499 | 351 (7.6%) | 159 (3.9%) |
| $7,500 to $9,999 | 75 (1.6%) | 92 (2.2%) |
| $10,000 to $12,499 | 30 (0.6%) | 89 (2.2%) |
| $12,500 to $14,999 | 55 (1.2%) | 13 (0.3%) |
| $15,000 to $17,499 | 129 (2.8%) | 155 (3.8%) |
| $17,500 to $19,999 | 70 (1.5%) | 23 (0.6%) |
| $20,000 to $22,499 | 53 (1.1%) | 128 (3.1%) |
| $22,500 to $24,999 | 25 (0.5%) | 107 (2.6%) |
| $25,000 to $29,999 | 157 (3.4%) | 98 (2.4%) |
| $30,000 to $34,999 | 195 (4.2%) | 180 (4.4%) |
| $35,000 to $39,999 | 79 (1.7%) | 267 (6.5%) |
| $40,000 to $44,999 | 182 (3.9%) | 330 (8.0%) |
| $45,000 to $49,999 | 444 (9.6%) | 540 (13.1%) |
| $50,000 to $54,999 | 281 (6.1%) | 202 (4.9%) |
| $55,000 to $64,999 | 458 (9.9%) | 302 (7.3%) |
| $65,000 to $74,999 | 535 (11.6%) | 153 (3.7%) |
| $75,000 to $99,999 | 723 (15.7%) | 416 (10.1%) |
| $100,000+ | 516 (11.2%) | 146 (3.5%) |
| Total | 4,621 (100.0%) | 4,120 (100.0%) |
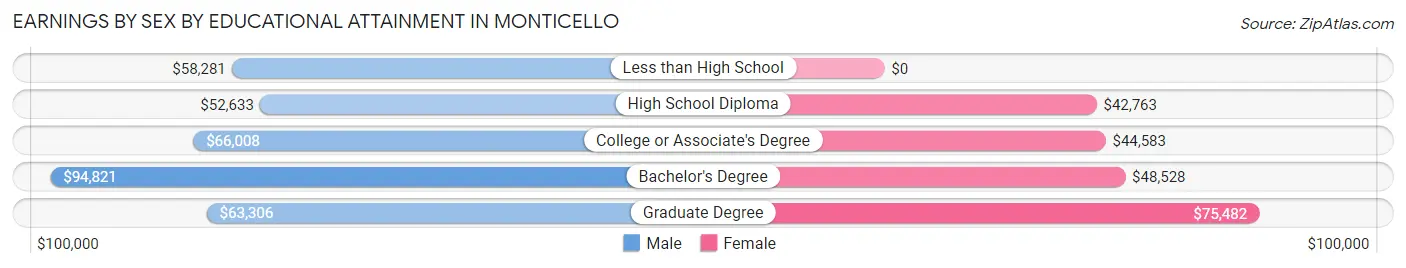
Earnings by Sex by Educational Attainment in Monticello
Average earnings in Monticello are $59,956 for men and $45,096 for women, a difference of 24.8%. Men with an educational attainment of bachelor's degree enjoy the highest average annual earnings of $94,821, while those with high school diploma education earn the least with $52,633. Women with an educational attainment of graduate degree earn the most with the average annual earnings of $75,482, while those with high school diploma education have the smallest earnings of $42,763.
| Educational Attainment | Male Income | Female Income |
| Less than High School | $58,281 | $0 |
| High School Diploma | $52,633 | $42,763 |
| College or Associate's Degree | $66,008 | $44,583 |
| Bachelor's Degree | $94,821 | $48,528 |
| Graduate Degree | $63,306 | $75,482 |
| Total | $59,956 | $45,096 |
Family Income in Monticello
Family Income Brackets in Monticello
According to the Monticello family income data, there are 1,066 families falling into the $100,000 to $149,999 income range, which is the most common income bracket and makes up 31.8% of all families. Conversely, the $10,000 to $14,999 income bracket is the least frequent group with only 27 families (0.8%) belonging to this category.
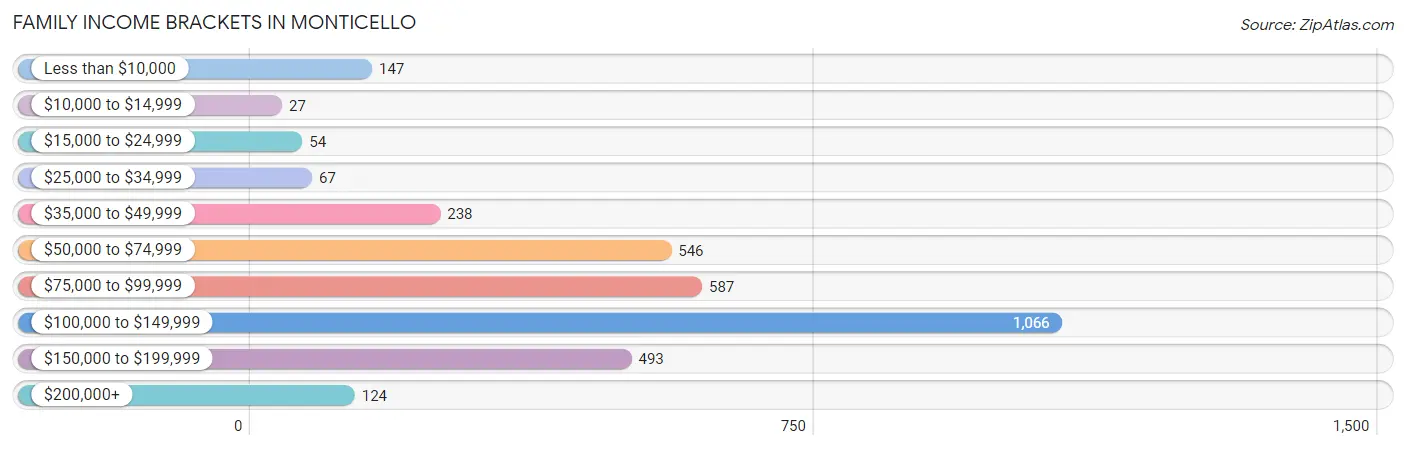
| Income Bracket | # Families | % Families |
| Less than $10,000 | 147 | 4.4% |
| $10,000 to $14,999 | 27 | 0.8% |
| $15,000 to $24,999 | 54 | 1.6% |
| $25,000 to $34,999 | 67 | 2.0% |
| $35,000 to $49,999 | 238 | 7.1% |
| $50,000 to $74,999 | 546 | 16.3% |
| $75,000 to $99,999 | 587 | 17.5% |
| $100,000 to $149,999 | 1,066 | 31.8% |
| $150,000 to $199,999 | 493 | 14.7% |
| $200,000+ | 124 | 3.7% |
Family Income by Famaliy Size in Monticello
5-person families (784 | 23.4%) account for the highest median family income in Monticello with $125,231 per family, while 2-person families (987 | 29.4%) have the highest median income of $40,542 per family member.
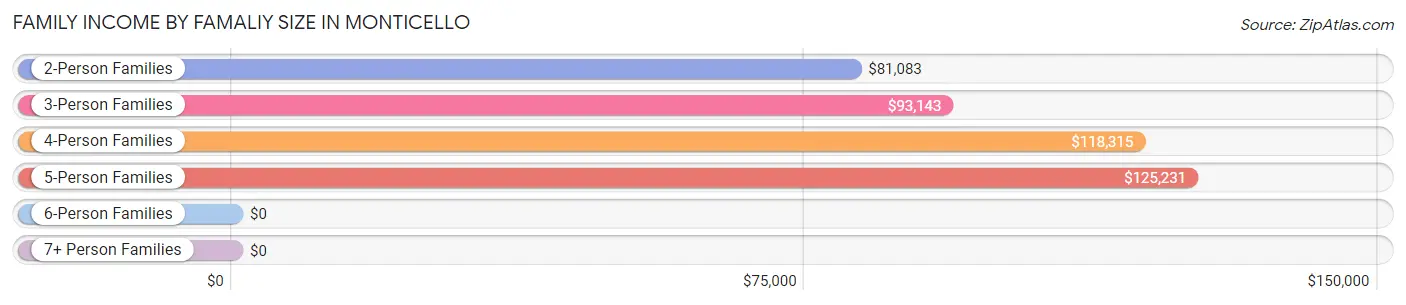
| Income Bracket | # Families | Median Income |
| 2-Person Families | 987 (29.4%) | $81,083 |
| 3-Person Families | 906 (27.0%) | $93,143 |
| 4-Person Families | 511 (15.2%) | $118,315 |
| 5-Person Families | 784 (23.4%) | $125,231 |
| 6-Person Families | 164 (4.9%) | $0 |
| 7+ Person Families | 0 (0.0%) | $0 |
| Total | 3,352 (100.0%) | $100,481 |
Family Income by Number of Earners in Monticello
The median family income in Monticello is $100,481, with families comprising 3+ earners (607) having the highest median family income of $137,550, while families with no earners (216) have the lowest median family income of $43,723, accounting for 18.1% and 6.4% of families, respectively.
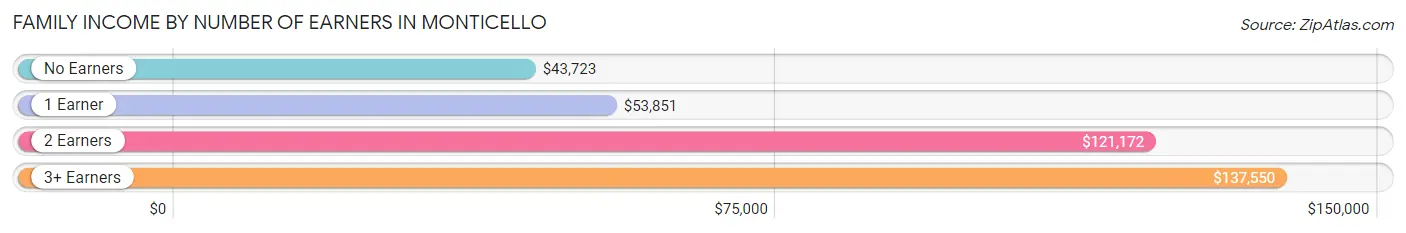
| Number of Earners | # Families | Median Income |
| No Earners | 216 (6.4%) | $43,723 |
| 1 Earner | 777 (23.2%) | $53,851 |
| 2 Earners | 1,752 (52.3%) | $121,172 |
| 3+ Earners | 607 (18.1%) | $137,550 |
| Total | 3,352 (100.0%) | $100,481 |
Household Income in Monticello
Household Income Brackets in Monticello
With 1,248 households falling in the category, the $100,000 to $149,999 income range is the most frequent in Monticello, accounting for 22.5% of all households. In contrast, only 39 households (0.7%) fall into the $10,000 to $14,999 income bracket, making it the least populous group.
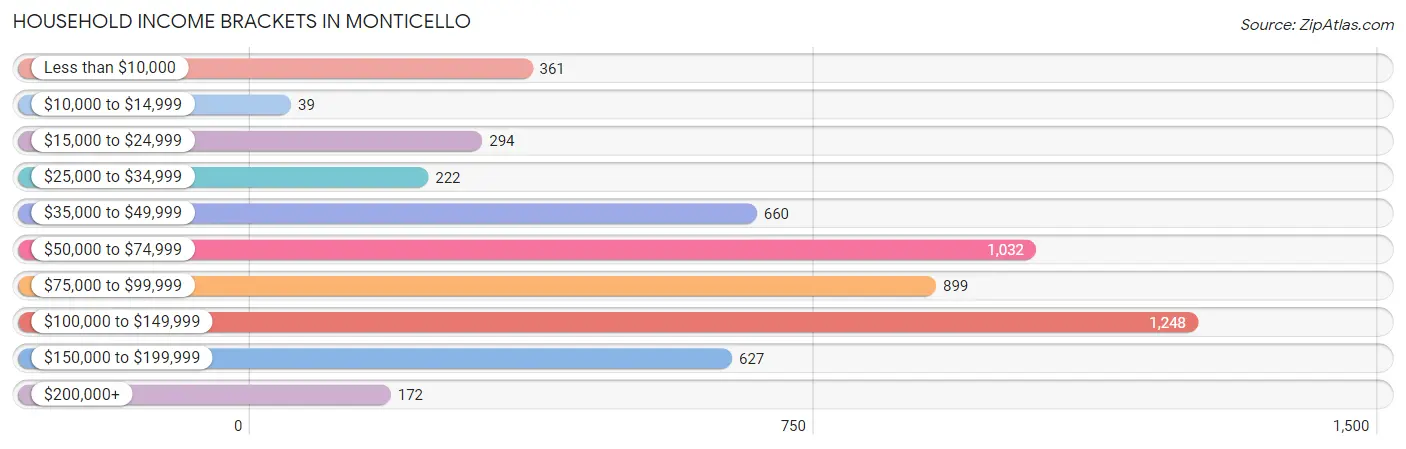
| Income Bracket | # Households | % Households |
| Less than $10,000 | 361 | 6.5% |
| $10,000 to $14,999 | 39 | 0.7% |
| $15,000 to $24,999 | 294 | 5.3% |
| $25,000 to $34,999 | 222 | 4.0% |
| $35,000 to $49,999 | 660 | 11.9% |
| $50,000 to $74,999 | 1,032 | 18.6% |
| $75,000 to $99,999 | 899 | 16.2% |
| $100,000 to $149,999 | 1,248 | 22.5% |
| $150,000 to $199,999 | 627 | 11.3% |
| $200,000+ | 172 | 3.1% |
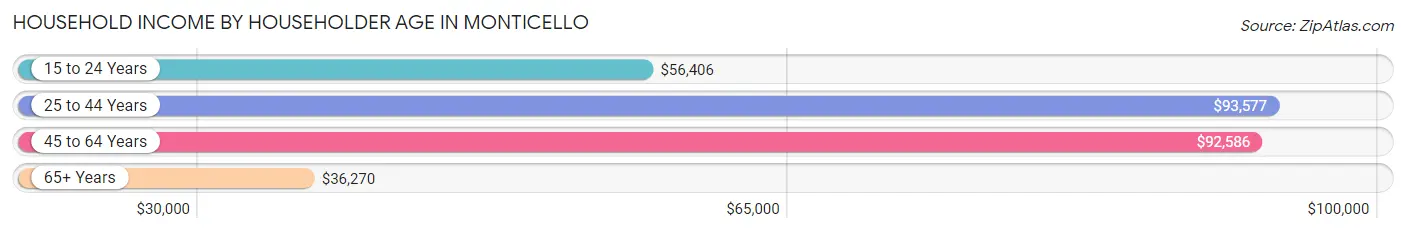
Household Income by Householder Age in Monticello
The median household income in Monticello is $80,290, with the highest median household income of $93,577 found in the 25 to 44 years age bracket for the primary householder. A total of 2,415 households (43.5%) fall into this category. Meanwhile, the 65+ years age bracket for the primary householder has the lowest median household income of $36,270, with 1,107 households (20.0%) in this group.
| Income Bracket | # Households | Median Income |
| 15 to 24 Years | 336 (6.1%) | $56,406 |
| 25 to 44 Years | 2,415 (43.5%) | $93,577 |
| 45 to 64 Years | 1,690 (30.5%) | $92,586 |
| 65+ Years | 1,107 (20.0%) | $36,270 |
| Total | 5,548 (100.0%) | $80,290 |
Poverty in Monticello
Income Below Poverty by Sex and Age in Monticello
With 5.7% poverty level for males and 12.7% for females among the residents of Monticello, under 5 year old males and 18 to 24 year old females are the most vulnerable to poverty, with 66 males (13.7%) and 233 females (34.7%) in their respective age groups living below the poverty level.
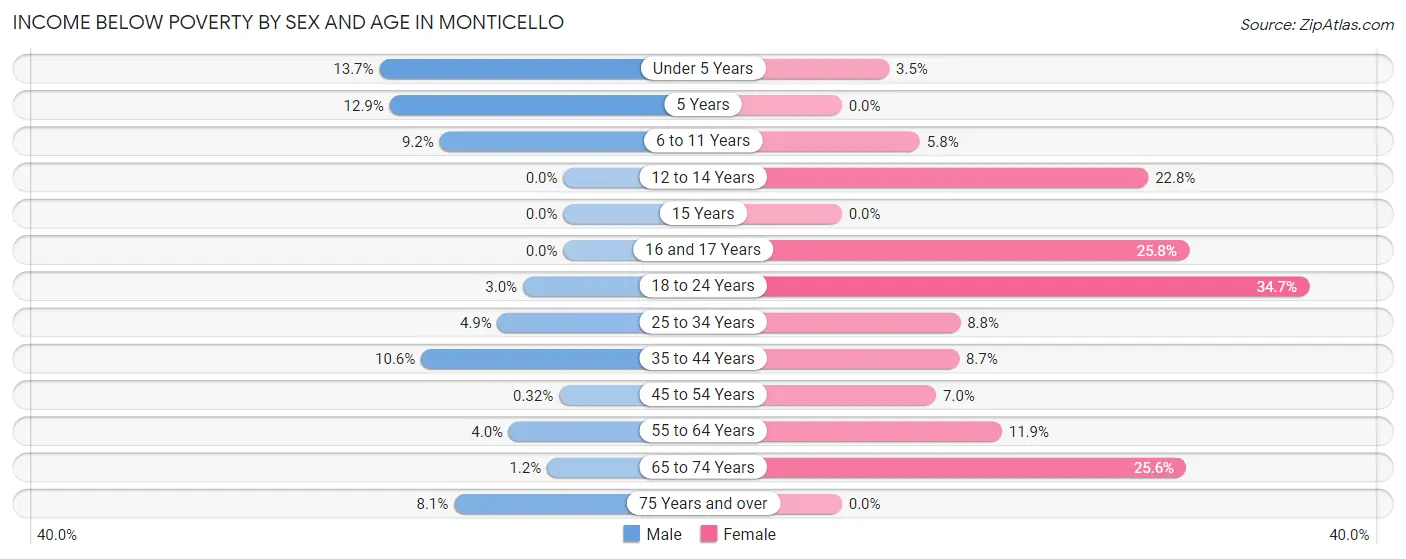
| Age Bracket | Male | Female |
| Under 5 Years | 66 (13.7%) | 18 (3.5%) |
| 5 Years | 12 (12.9%) | 0 (0.0%) |
| 6 to 11 Years | 44 (9.2%) | 36 (5.8%) |
| 12 to 14 Years | 0 (0.0%) | 81 (22.8%) |
| 15 Years | 0 (0.0%) | 0 (0.0%) |
| 16 and 17 Years | 0 (0.0%) | 68 (25.8%) |
| 18 to 24 Years | 21 (3.0%) | 233 (34.7%) |
| 25 to 34 Years | 58 (4.9%) | 87 (8.8%) |
| 35 to 44 Years | 136 (10.6%) | 90 (8.7%) |
| 45 to 54 Years | 2 (0.3%) | 59 (7.0%) |
| 55 to 64 Years | 35 (4.0%) | 89 (11.9%) |
| 65 to 74 Years | 3 (1.2%) | 162 (25.6%) |
| 75 Years and over | 24 (8.1%) | 0 (0.0%) |
| Total | 401 (5.7%) | 923 (12.7%) |
Income Above Poverty by Sex and Age in Monticello
According to the poverty statistics in Monticello, males aged 12 to 14 years and females aged 5 years are the age groups that are most secure financially, with 100.0% of males and 100.0% of females in these age groups living above the poverty line.
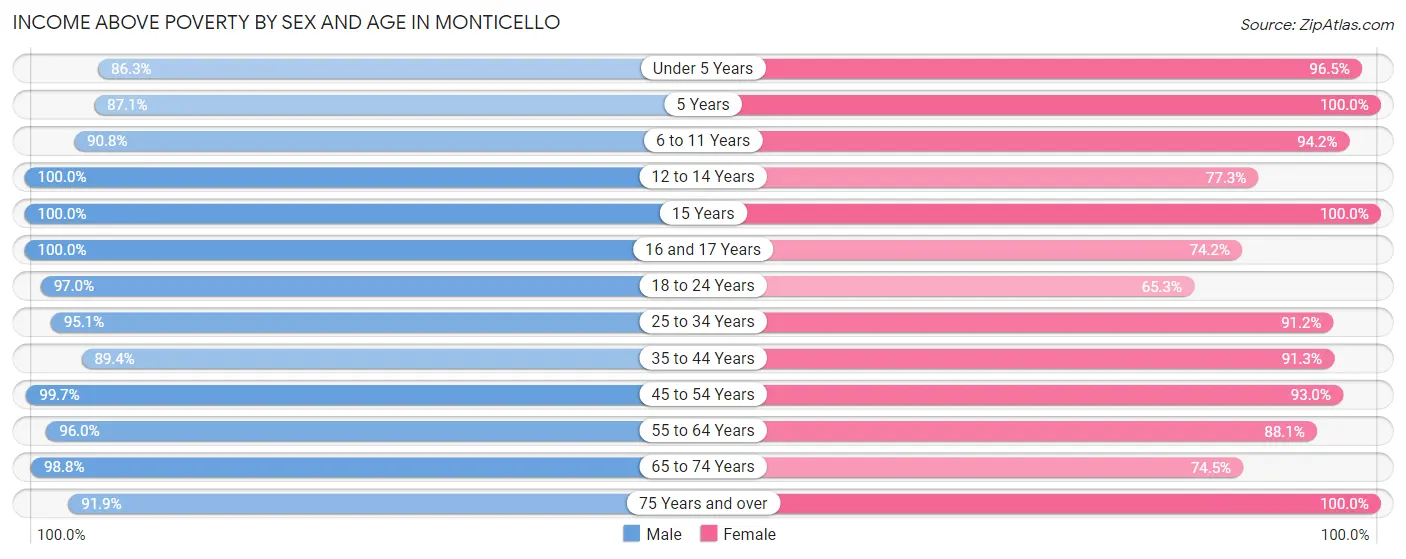
| Age Bracket | Male | Female |
| Under 5 Years | 417 (86.3%) | 495 (96.5%) |
| 5 Years | 81 (87.1%) | 172 (100.0%) |
| 6 to 11 Years | 435 (90.8%) | 585 (94.2%) |
| 12 to 14 Years | 461 (100.0%) | 275 (77.2%) |
| 15 Years | 97 (100.0%) | 81 (100.0%) |
| 16 and 17 Years | 250 (100.0%) | 196 (74.2%) |
| 18 to 24 Years | 680 (97.0%) | 439 (65.3%) |
| 25 to 34 Years | 1,130 (95.1%) | 903 (91.2%) |
| 35 to 44 Years | 1,152 (89.4%) | 944 (91.3%) |
| 45 to 54 Years | 625 (99.7%) | 784 (93.0%) |
| 55 to 64 Years | 831 (96.0%) | 660 (88.1%) |
| 65 to 74 Years | 244 (98.8%) | 472 (74.5%) |
| 75 Years and over | 272 (91.9%) | 317 (100.0%) |
| Total | 6,675 (94.3%) | 6,323 (87.3%) |
Income Below Poverty Among Married-Couple Families in Monticello
The poverty statistics for married-couple families in Monticello show that 2.1% or 55 of the total 2,603 families live below the poverty line. Families with 1 or 2 children have the highest poverty rate of 4.1%, comprising of 39 families. On the other hand, families with no children have the lowest poverty rate of 0.0%, which includes 0 families.
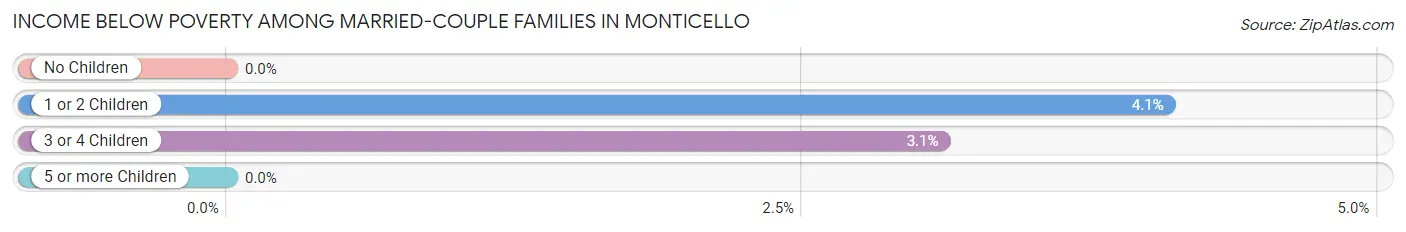
| Children | Above Poverty | Below Poverty |
| No Children | 1,130 (100.0%) | 0 (0.0%) |
| 1 or 2 Children | 918 (95.9%) | 39 (4.1%) |
| 3 or 4 Children | 500 (96.9%) | 16 (3.1%) |
| 5 or more Children | 0 (0.0%) | 0 (0.0%) |
| Total | 2,548 (97.9%) | 55 (2.1%) |
Income Below Poverty Among Single-Parent Households in Monticello
According to the poverty data in Monticello, 24.5% or 82 single-father households and 17.3% or 72 single-mother households are living below the poverty line. Among single-father households, those with 1 or 2 children have the highest poverty rate, with 79 households (33.5%) experiencing poverty. Likewise, among single-mother households, those with 1 or 2 children have the highest poverty rate, with 72 households (39.1%) falling below the poverty line.
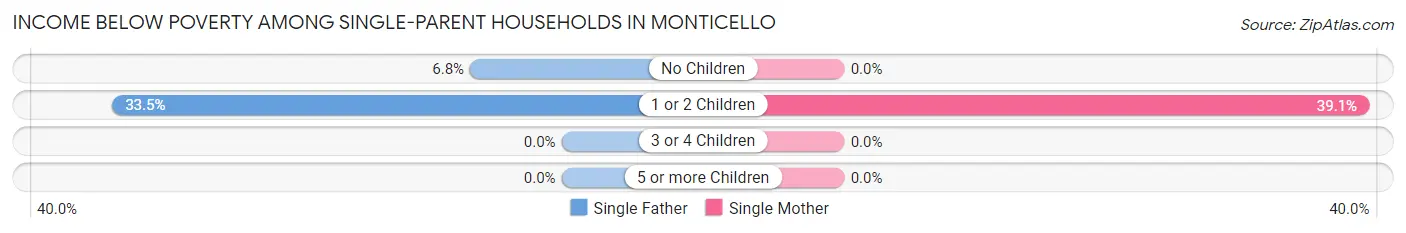
| Children | Single Father | Single Mother |
| No Children | 3 (6.8%) | 0 (0.0%) |
| 1 or 2 Children | 79 (33.5%) | 72 (39.1%) |
| 3 or 4 Children | 0 (0.0%) | 0 (0.0%) |
| 5 or more Children | 0 (0.0%) | 0 (0.0%) |
| Total | 82 (24.5%) | 72 (17.3%) |
Income Below Poverty Among Married-Couple vs Single-Parent Households in Monticello
The poverty data for Monticello shows that 55 of the married-couple family households (2.1%) and 154 of the single-parent households (20.6%) are living below the poverty level. Within the married-couple family households, those with 1 or 2 children have the highest poverty rate, with 39 households (4.1%) falling below the poverty line. Among the single-parent households, those with 1 or 2 children have the highest poverty rate, with 151 household (35.9%) living below poverty.
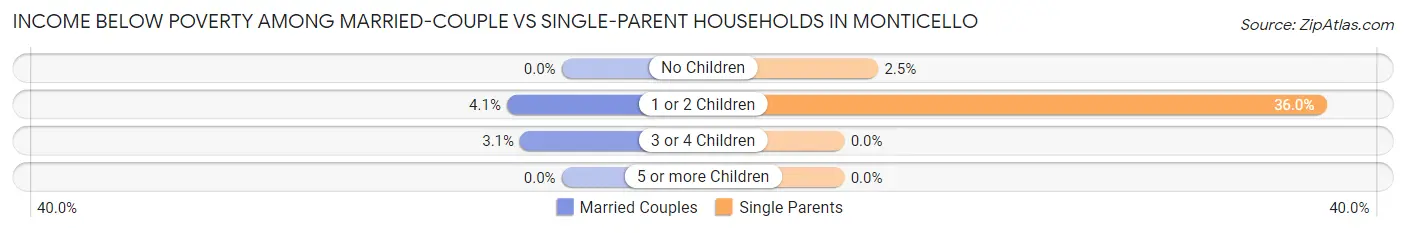
| Children | Married-Couple Families | Single-Parent Households |
| No Children | 0 (0.0%) | 3 (2.5%) |
| 1 or 2 Children | 39 (4.1%) | 151 (35.9%) |
| 3 or 4 Children | 16 (3.1%) | 0 (0.0%) |
| 5 or more Children | 0 (0.0%) | 0 (0.0%) |
| Total | 55 (2.1%) | 154 (20.6%) |
Race in Monticello
The most populous races in Monticello are White / Caucasian (12,652 | 87.6%), Hispanic or Latino (1,176 | 8.1%), and Two or more Races (654 | 4.5%).
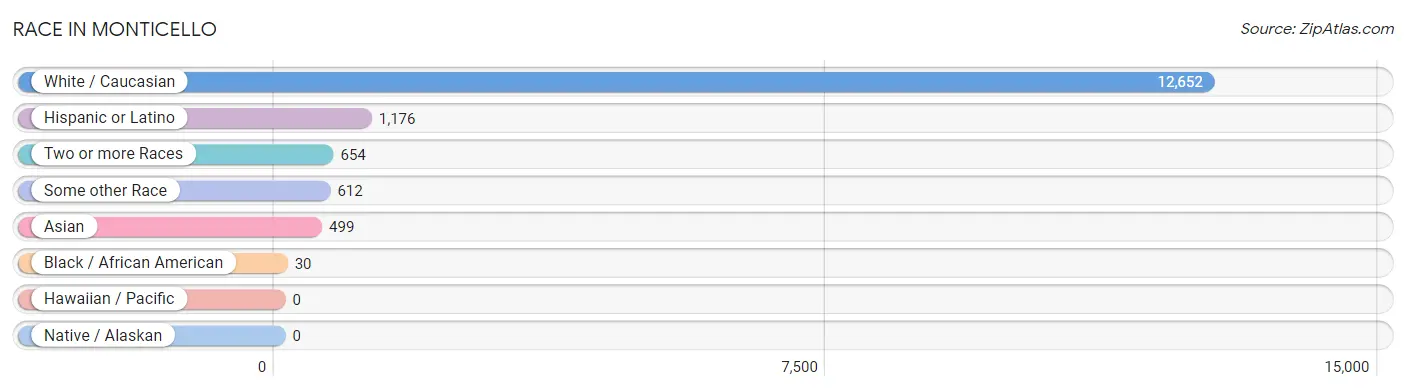
| Race | # Population | % Population |
| Asian | 499 | 3.5% |
| Black / African American | 30 | 0.2% |
| Hawaiian / Pacific | 0 | 0.0% |
| Hispanic or Latino | 1,176 | 8.1% |
| Native / Alaskan | 0 | 0.0% |
| White / Caucasian | 12,652 | 87.6% |
| Two or more Races | 654 | 4.5% |
| Some other Race | 612 | 4.2% |
| Total | 14,447 | 100.0% |
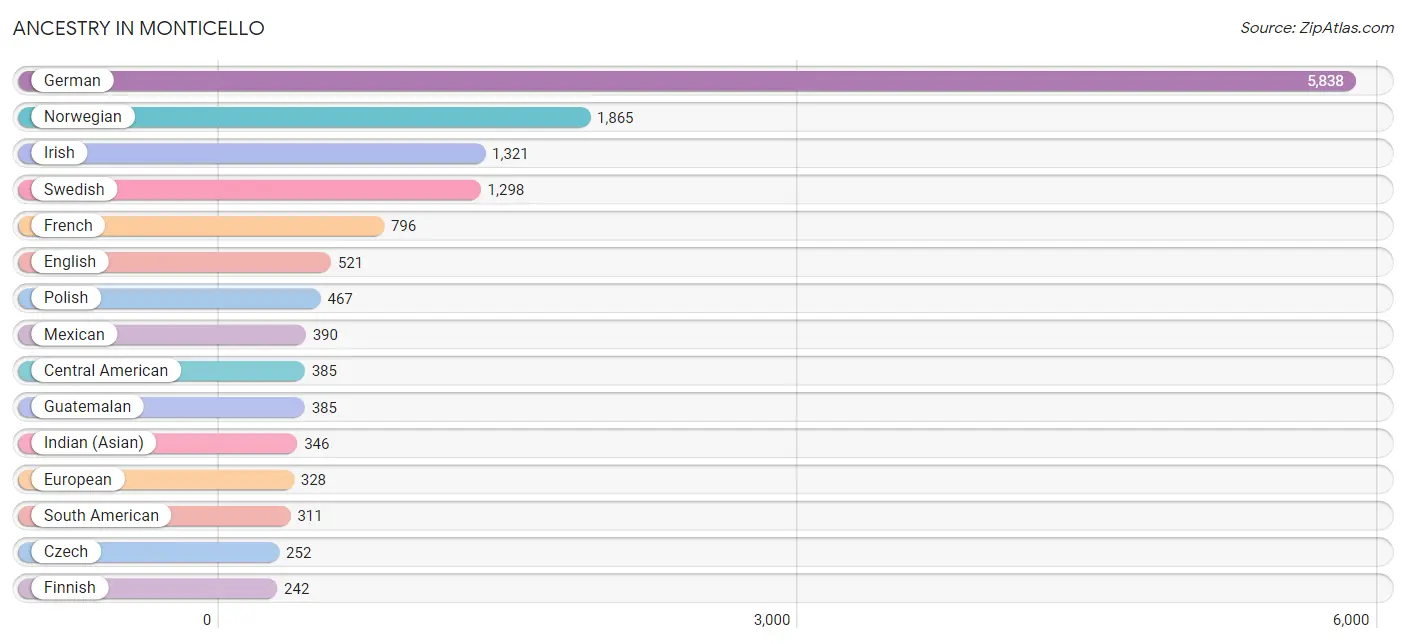
Ancestry in Monticello
The most populous ancestries reported in Monticello are German (5,838 | 40.4%), Norwegian (1,865 | 12.9%), Irish (1,321 | 9.1%), Swedish (1,298 | 9.0%), and French (796 | 5.5%), together accounting for 77.0% of all Monticello residents.
| Ancestry | # Population | % Population |
| American | 140 | 1.0% |
| Arab | 29 | 0.2% |
| Austrian | 27 | 0.2% |
| Bangladeshi | 76 | 0.5% |
| Belgian | 31 | 0.2% |
| Bhutanese | 15 | 0.1% |
| British | 86 | 0.6% |
| Burmese | 23 | 0.2% |
| Central American | 385 | 2.7% |
| Croatian | 14 | 0.1% |
| Cuban | 19 | 0.1% |
| Czech | 252 | 1.7% |
| Danish | 41 | 0.3% |
| Dutch | 87 | 0.6% |
| Ecuadorian | 117 | 0.8% |
| English | 521 | 3.6% |
| European | 328 | 2.3% |
| Finnish | 242 | 1.7% |
| French | 796 | 5.5% |
| French Canadian | 57 | 0.4% |
| German | 5,838 | 40.4% |
| Greek | 19 | 0.1% |
| Guatemalan | 385 | 2.7% |
| Indian (Asian) | 346 | 2.4% |
| Indonesian | 60 | 0.4% |
| Irish | 1,321 | 9.1% |
| Italian | 136 | 0.9% |
| Korean | 100 | 0.7% |
| Malaysian | 11 | 0.1% |
| Mexican | 390 | 2.7% |
| Native Hawaiian | 25 | 0.2% |
| Norwegian | 1,865 | 12.9% |
| Peruvian | 194 | 1.3% |
| Polish | 467 | 3.2% |
| Puerto Rican | 43 | 0.3% |
| Scandinavian | 108 | 0.7% |
| Scotch-Irish | 121 | 0.8% |
| Scottish | 110 | 0.8% |
| Sioux | 16 | 0.1% |
| Slovak | 46 | 0.3% |
| South American | 311 | 2.1% |
| Sri Lankan | 60 | 0.4% |
| Swedish | 1,298 | 9.0% |
| Swiss | 35 | 0.2% |
| Thai | 11 | 0.1% |
| Ukrainian | 25 | 0.2% |
| Welsh | 94 | 0.6% | View All 47 Rows |
Immigrants in Monticello
The most numerous immigrant groups reported in Monticello came from Latin America (587 | 4.1%), Central America (430 | 3.0%), Asia (417 | 2.9%), Eastern Asia (345 | 2.4%), and China (330 | 2.3%), together accounting for 14.6% of all Monticello residents.
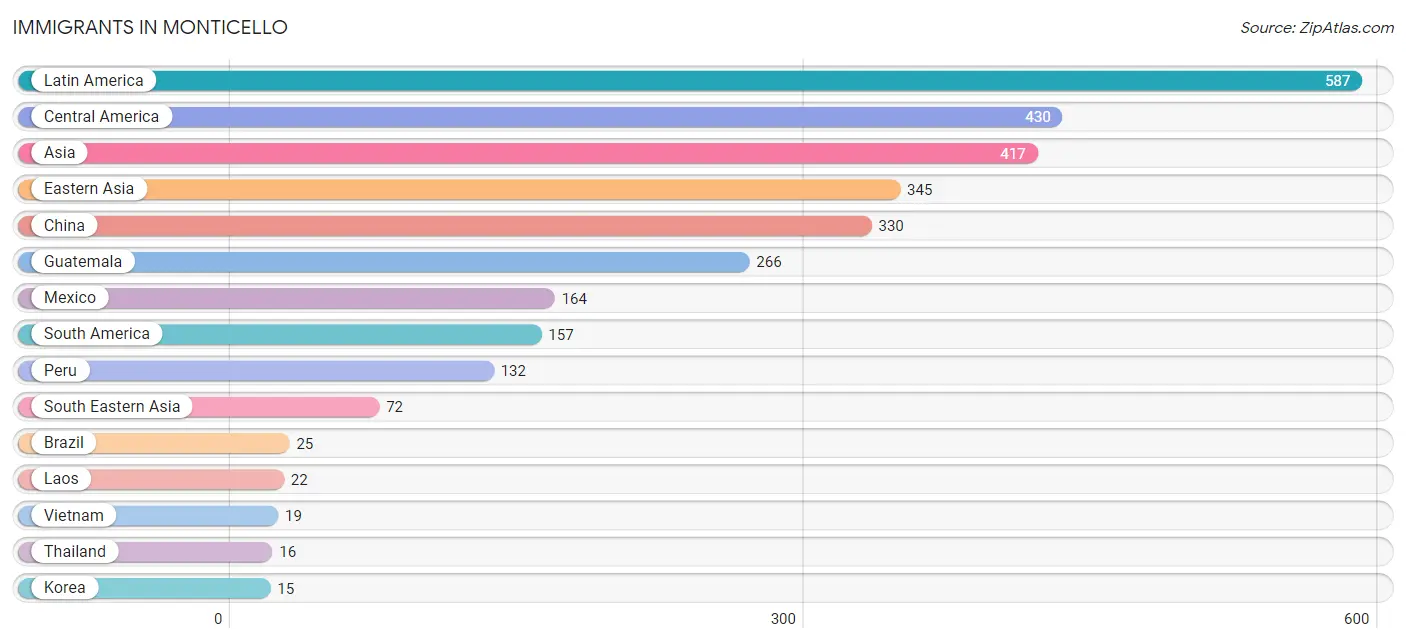
| Immigration Origin | # Population | % Population |
| Asia | 417 | 2.9% |
| Brazil | 25 | 0.2% |
| Central America | 430 | 3.0% |
| China | 330 | 2.3% |
| Eastern Asia | 345 | 2.4% |
| Europe | 8 | 0.1% |
| France | 8 | 0.1% |
| Guatemala | 266 | 1.8% |
| Korea | 15 | 0.1% |
| Laos | 22 | 0.2% |
| Latin America | 587 | 4.1% |
| Mexico | 164 | 1.1% |
| Peru | 132 | 0.9% |
| Philippines | 15 | 0.1% |
| South America | 157 | 1.1% |
| South Eastern Asia | 72 | 0.5% |
| Thailand | 16 | 0.1% |
| Vietnam | 19 | 0.1% |
| Western Europe | 8 | 0.1% | View All 19 Rows |
Sex and Age in Monticello
Sex and Age in Monticello
The most populous age groups in Monticello are 35 to 39 Years (645 | 9.0%) for men and 30 to 34 Years (630 | 8.6%) for women.
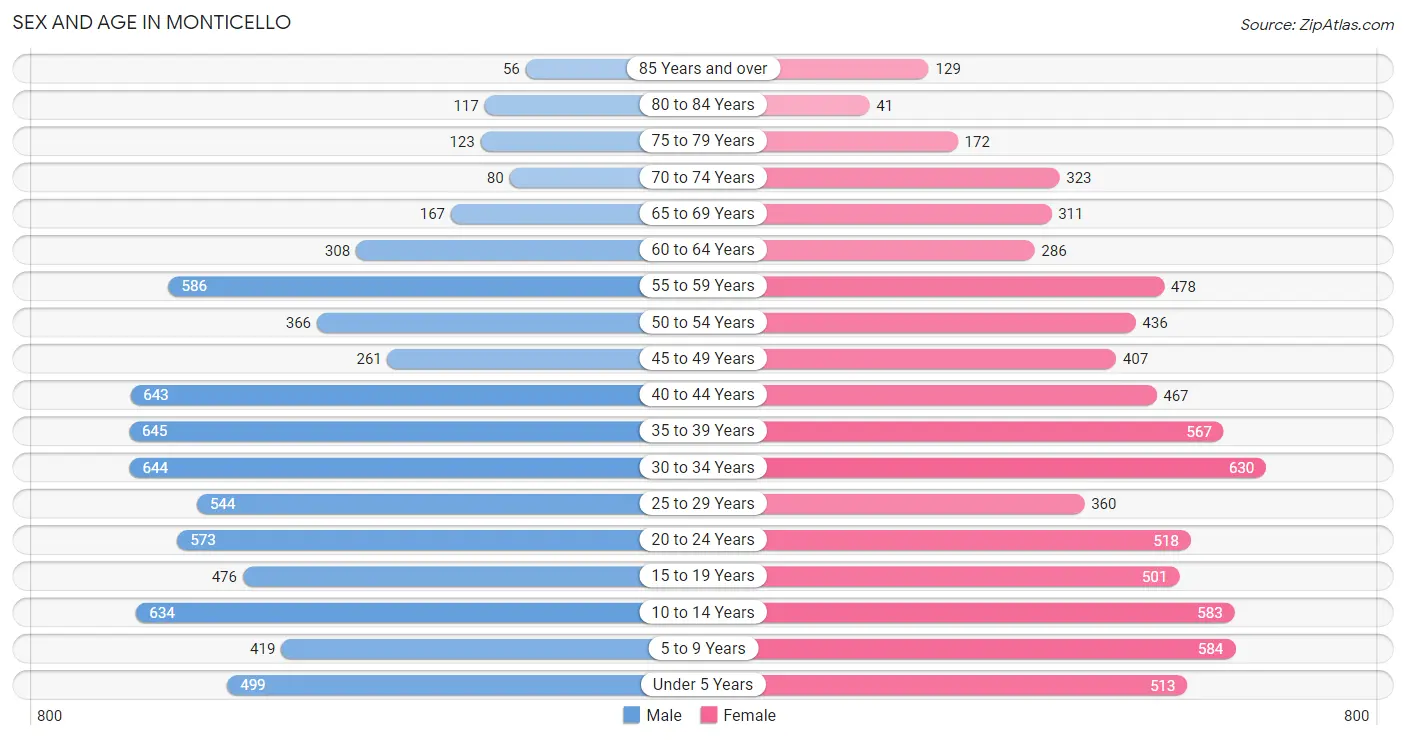
| Age Bracket | Male | Female |
| Under 5 Years | 499 (7.0%) | 513 (7.0%) |
| 5 to 9 Years | 419 (5.9%) | 584 (8.0%) |
| 10 to 14 Years | 634 (8.9%) | 583 (8.0%) |
| 15 to 19 Years | 476 (6.7%) | 501 (6.9%) |
| 20 to 24 Years | 573 (8.0%) | 518 (7.1%) |
| 25 to 29 Years | 544 (7.6%) | 360 (4.9%) |
| 30 to 34 Years | 644 (9.0%) | 630 (8.6%) |
| 35 to 39 Years | 645 (9.0%) | 567 (7.8%) |
| 40 to 44 Years | 643 (9.0%) | 467 (6.4%) |
| 45 to 49 Years | 261 (3.6%) | 407 (5.6%) |
| 50 to 54 Years | 366 (5.1%) | 436 (6.0%) |
| 55 to 59 Years | 586 (8.2%) | 478 (6.5%) |
| 60 to 64 Years | 308 (4.3%) | 286 (3.9%) |
| 65 to 69 Years | 167 (2.3%) | 311 (4.3%) |
| 70 to 74 Years | 80 (1.1%) | 323 (4.4%) |
| 75 to 79 Years | 123 (1.7%) | 172 (2.4%) |
| 80 to 84 Years | 117 (1.6%) | 41 (0.6%) |
| 85 Years and over | 56 (0.8%) | 129 (1.8%) |
| Total | 7,141 (100.0%) | 7,306 (100.0%) |
Families and Households in Monticello
Median Family Size in Monticello
The median family size in Monticello is 3.30 persons per family, with single male/father families (334 | 10.0%) accounting for the largest median family size of 3.53 persons per family. On the other hand, single female/mother families (415 | 12.4%) represent the smallest median family size with 3.25 persons per family.
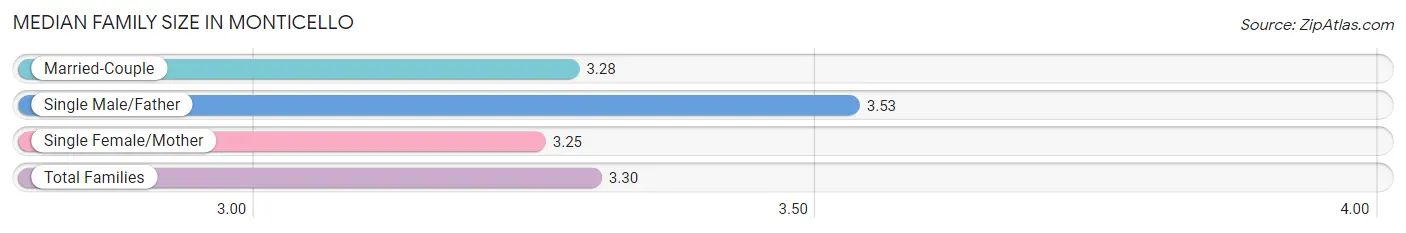
| Family Type | # Families | Family Size |
| Married-Couple | 2,603 (77.7%) | 3.28 |
| Single Male/Father | 334 (10.0%) | 3.53 |
| Single Female/Mother | 415 (12.4%) | 3.25 |
| Total Families | 3,352 (100.0%) | 3.30 |
Median Household Size in Monticello
The median household size in Monticello is 2.58 persons per household, with single male/father households (334 | 6.0%) accounting for the largest median household size of 3.95 persons per household. non-family households (2,196 | 39.6%) represent the smallest median household size with 1.26 persons per household.
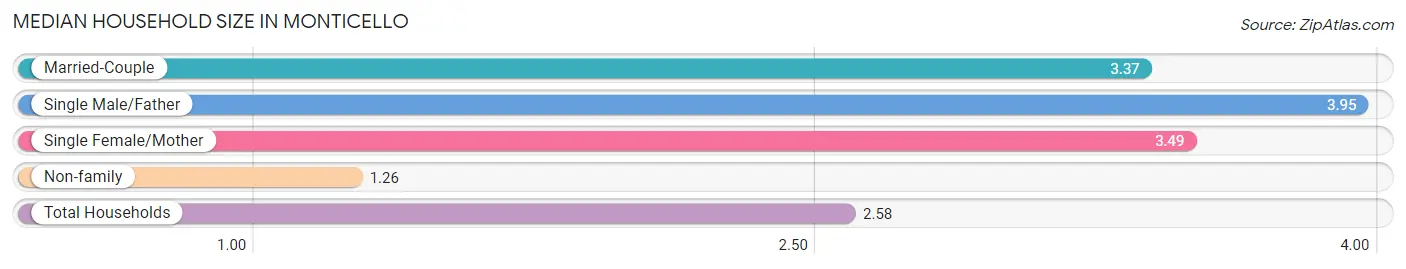
| Household Type | # Households | Household Size |
| Married-Couple | 2,603 (46.9%) | 3.37 |
| Single Male/Father | 334 (6.0%) | 3.95 |
| Single Female/Mother | 415 (7.5%) | 3.49 |
| Non-family | 2,196 (39.6%) | 1.26 |
| Total Households | 5,548 (100.0%) | 2.58 |
Household Size by Marriage Status in Monticello
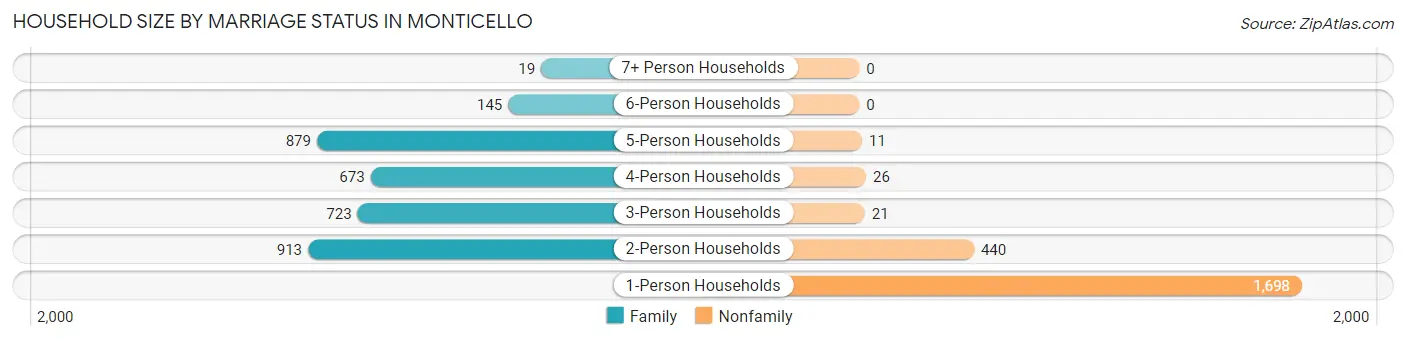
Out of a total of 5,548 households in Monticello, 3,352 (60.4%) are family households, while 2,196 (39.6%) are nonfamily households. The most numerous type of family households are 2-person households, comprising 913, and the most common type of nonfamily households are 1-person households, comprising 1,698.
| Household Size | Family Households | Nonfamily Households |
| 1-Person Households | - | 1,698 (30.6%) |
| 2-Person Households | 913 (16.5%) | 440 (7.9%) |
| 3-Person Households | 723 (13.0%) | 21 (0.4%) |
| 4-Person Households | 673 (12.1%) | 26 (0.5%) |
| 5-Person Households | 879 (15.8%) | 11 (0.2%) |
| 6-Person Households | 145 (2.6%) | 0 (0.0%) |
| 7+ Person Households | 19 (0.3%) | 0 (0.0%) |
| Total | 3,352 (60.4%) | 2,196 (39.6%) |
Female Fertility in Monticello
Fertility by Age in Monticello
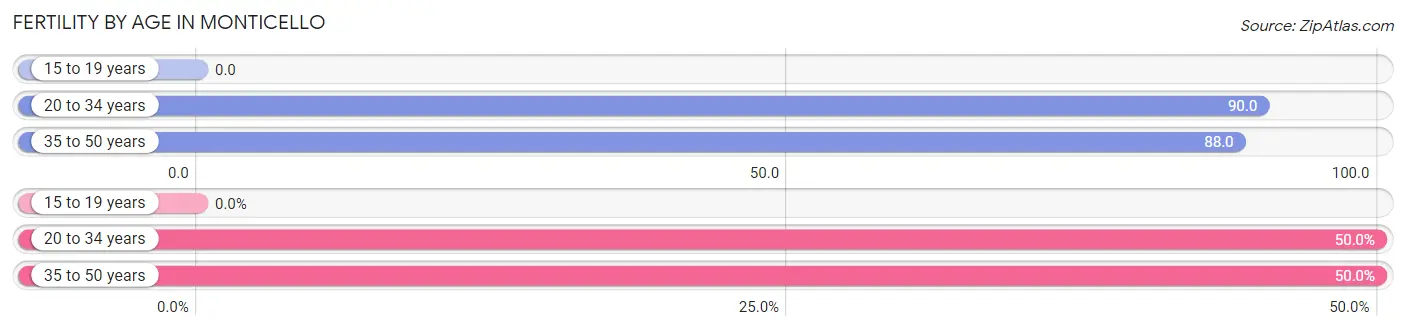
Average fertility rate in Monticello is 76.0 births per 1,000 women. Women in the age bracket of 20 to 34 years have the highest fertility rate with 90.0 births per 1,000 women. Women in the age bracket of 20 to 34 years acount for 50.0% of all women with births.
| Age Bracket | Women with Births | Births / 1,000 Women |
| 15 to 19 years | 0 (0.0%) | 0.0 |
| 20 to 34 years | 135 (50.0%) | 90.0 |
| 35 to 50 years | 135 (50.0%) | 88.0 |
| Total | 270 (100.0%) | 76.0 |
Fertility by Age by Marriage Status in Monticello
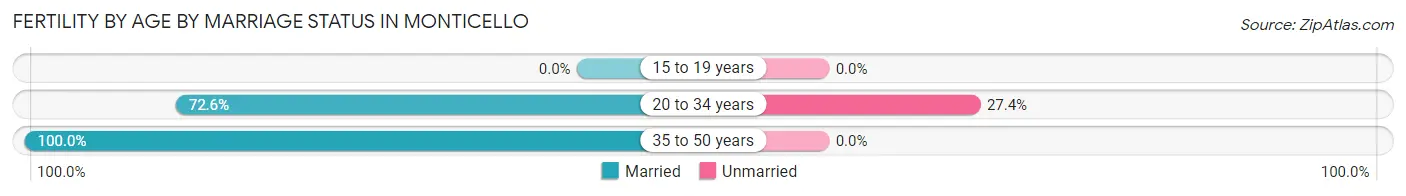
86.3% of women with births (270) in Monticello are married. The highest percentage of unmarried women with births falls into 20 to 34 years age bracket with 27.4% of them unmarried at the time of birth, while the lowest percentage of unmarried women with births belong to 35 to 50 years age bracket with 0.0% of them unmarried.
| Age Bracket | Married | Unmarried |
| 15 to 19 years | 0 (0.0%) | 0 (0.0%) |
| 20 to 34 years | 98 (72.6%) | 37 (27.4%) |
| 35 to 50 years | 135 (100.0%) | 0 (0.0%) |
| Total | 233 (86.3%) | 37 (13.7%) |
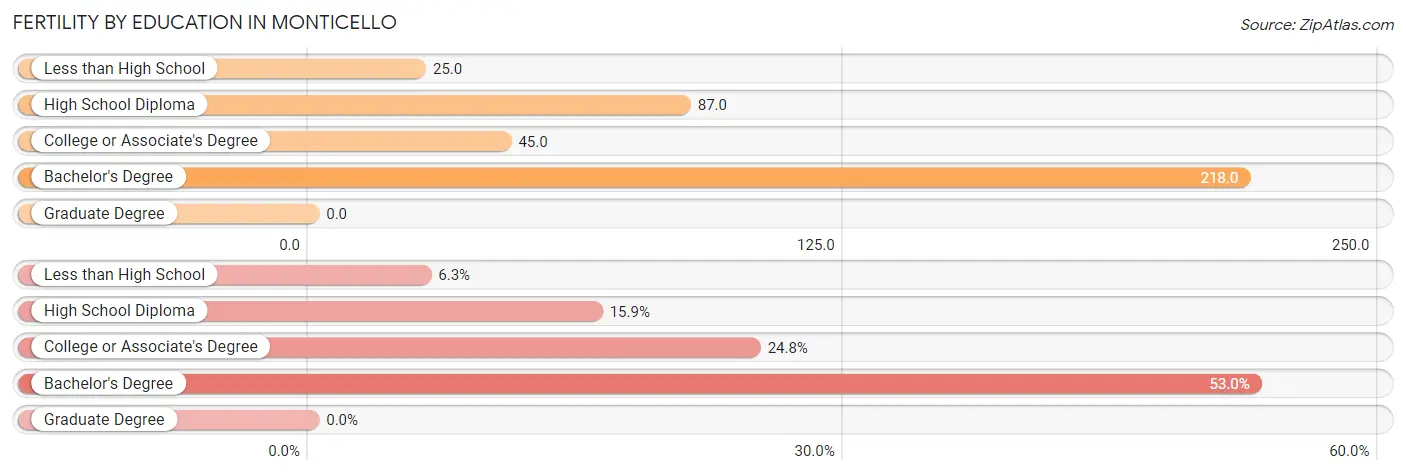
Fertility by Education in Monticello
| Educational Attainment | Women with Births | Births / 1,000 Women |
| Less than High School | 17 (6.3%) | 25.0 |
| High School Diploma | 43 (15.9%) | 87.0 |
| College or Associate's Degree | 67 (24.8%) | 45.0 |
| Bachelor's Degree | 143 (53.0%) | 218.0 |
| Graduate Degree | 0 (0.0%) | 0.0 |
| Total | 270 (100.0%) | 76.0 |
Fertility by Education by Marriage Status in Monticello
13.7% of women with births in Monticello are unmarried. Women with the educational attainment of college or associate's degree are most likely to be married with 100.0% of them married at childbirth, while women with the educational attainment of less than high school are least likely to be married with 100.0% of them unmarried at childbirth.
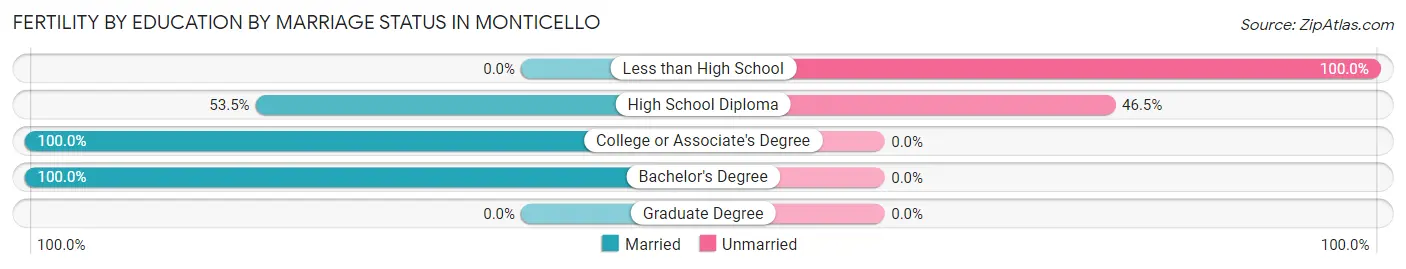
| Educational Attainment | Married | Unmarried |
| Less than High School | 0 (0.0%) | 17 (100.0%) |
| High School Diploma | 23 (53.5%) | 20 (46.5%) |
| College or Associate's Degree | 67 (100.0%) | 0 (0.0%) |
| Bachelor's Degree | 143 (100.0%) | 0 (0.0%) |
| Graduate Degree | 0 (0.0%) | 0 (0.0%) |
| Total | 233 (86.3%) | 37 (13.7%) |
Employment Characteristics in Monticello
Employment by Class of Employer in Monticello
Among the 7,685 employed individuals in Monticello, private company employees (5,978 | 77.8%), not-for-profit organizations (636 | 8.3%), and local government employees (553 | 7.2%) make up the most common classes of employment.
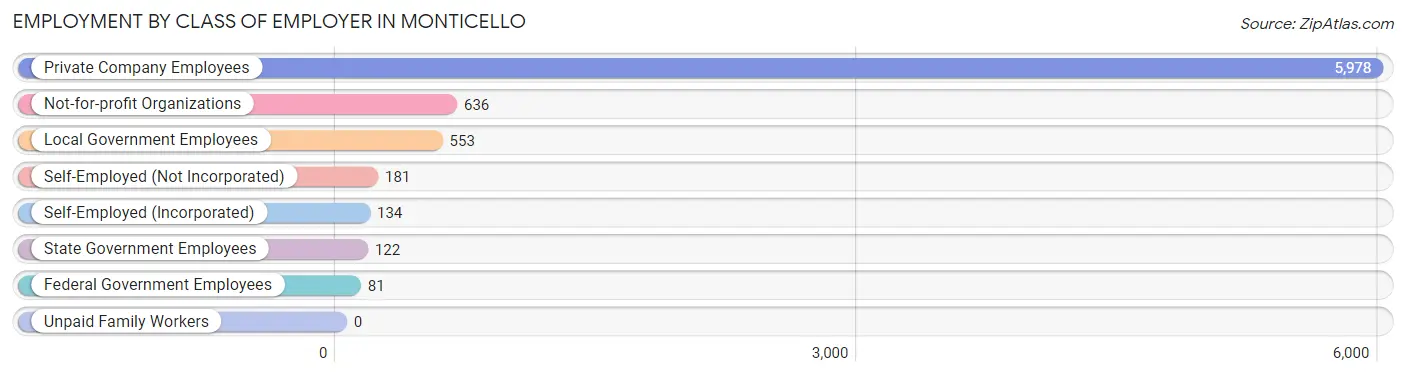
| Employer Class | # Employees | % Employees |
| Private Company Employees | 5,978 | 77.8% |
| Self-Employed (Incorporated) | 134 | 1.7% |
| Self-Employed (Not Incorporated) | 181 | 2.4% |
| Not-for-profit Organizations | 636 | 8.3% |
| Local Government Employees | 553 | 7.2% |
| State Government Employees | 122 | 1.6% |
| Federal Government Employees | 81 | 1.1% |
| Unpaid Family Workers | 0 | 0.0% |
| Total | 7,685 | 100.0% |
Employment Status by Age in Monticello
According to the labor force statistics for Monticello, out of the total population over 16 years of age (11,037), 73.2% or 8,079 individuals are in the labor force, with 1.8% or 145 of them unemployed. The age group with the highest labor force participation rate is 25 to 29 years, with 95.0% or 859 individuals in the labor force. Within the labor force, the 20 to 24 years age range has the highest percentage of unemployed individuals, with 5.7% or 42 of them being unemployed.
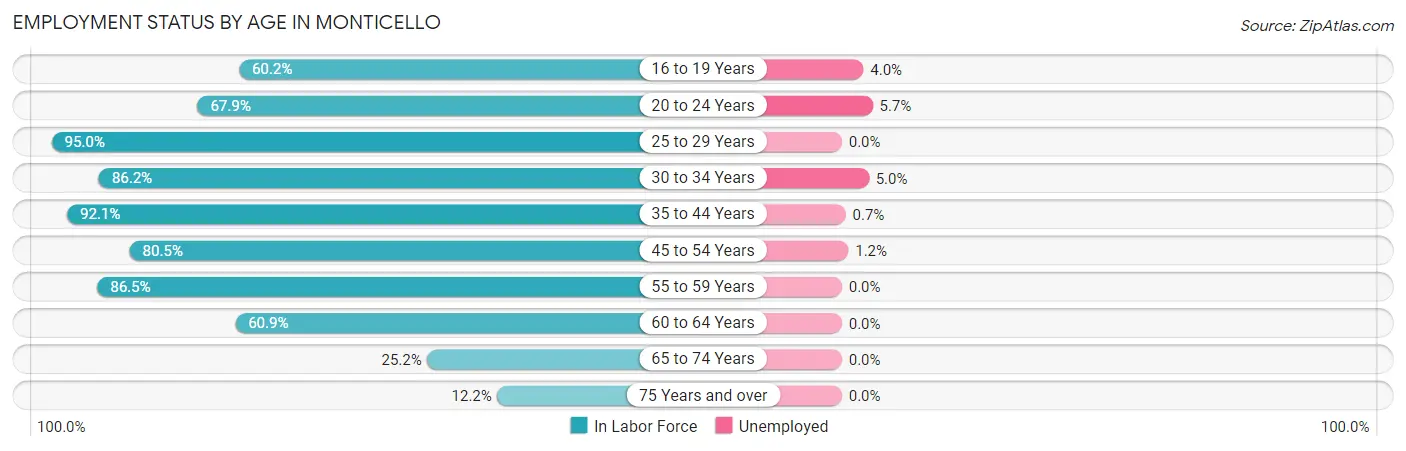
| Age Bracket | In Labor Force | Unemployed |
| 16 to 19 Years | 481 (60.2%) | 19 (4.0%) |
| 20 to 24 Years | 741 (67.9%) | 42 (5.7%) |
| 25 to 29 Years | 859 (95.0%) | 0 (0.0%) |
| 30 to 34 Years | 1,098 (86.2%) | 55 (5.0%) |
| 35 to 44 Years | 2,139 (92.1%) | 15 (0.7%) |
| 45 to 54 Years | 1,183 (80.5%) | 14 (1.2%) |
| 55 to 59 Years | 920 (86.5%) | 0 (0.0%) |
| 60 to 64 Years | 362 (60.9%) | 0 (0.0%) |
| 65 to 74 Years | 222 (25.2%) | 0 (0.0%) |
| 75 Years and over | 78 (12.2%) | 0 (0.0%) |
| Total | 8,079 (73.2%) | 145 (1.8%) |
Employment Status by Educational Attainment in Monticello
According to labor force statistics for Monticello, 86.0% of individuals (6,560) out of the total population between 25 and 64 years of age (7,628) are in the labor force, with 1.3% or 85 of them being unemployed. The group with the highest labor force participation rate are those with the educational attainment of bachelor's degree or higher, with 90.3% or 1,713 individuals in the labor force. Within the labor force, individuals with college / associate degree education have the highest percentage of unemployment, with 2.3% or 55 of them being unemployed.
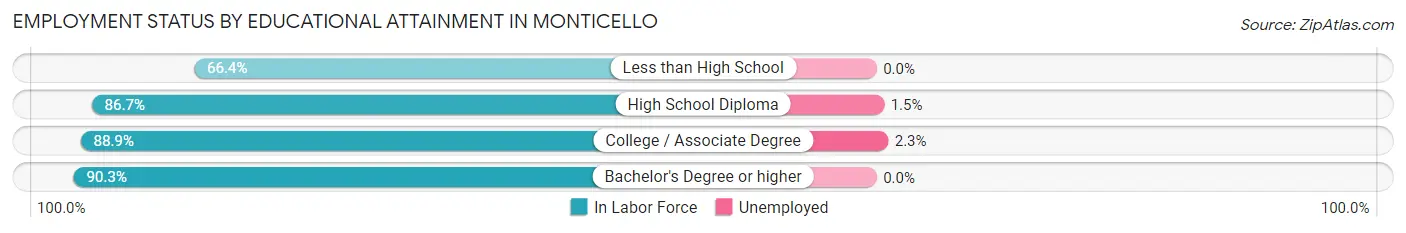
| Educational Attainment | In Labor Force | Unemployed |
| Less than High School | 588 (66.4%) | 0 (0.0%) |
| High School Diploma | 1,861 (86.7%) | 32 (1.5%) |
| College / Associate Degree | 2,399 (88.9%) | 62 (2.3%) |
| Bachelor's Degree or higher | 1,713 (90.3%) | 0 (0.0%) |
| Total | 6,560 (86.0%) | 99 (1.3%) |
Employment Occupations by Sex in Monticello
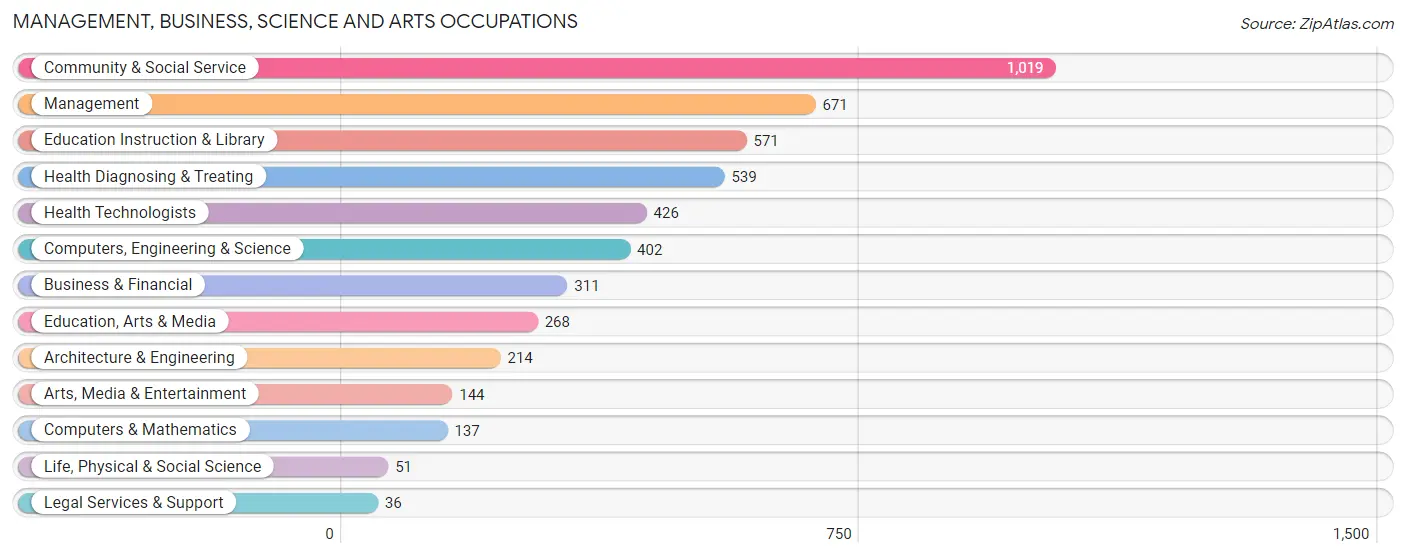
Management, Business, Science and Arts Occupations
The most common Management, Business, Science and Arts occupations in Monticello are Community & Social Service (1,019 | 12.8%), Management (671 | 8.5%), Education Instruction & Library (571 | 7.2%), Health Diagnosing & Treating (539 | 6.8%), and Health Technologists (426 | 5.4%).
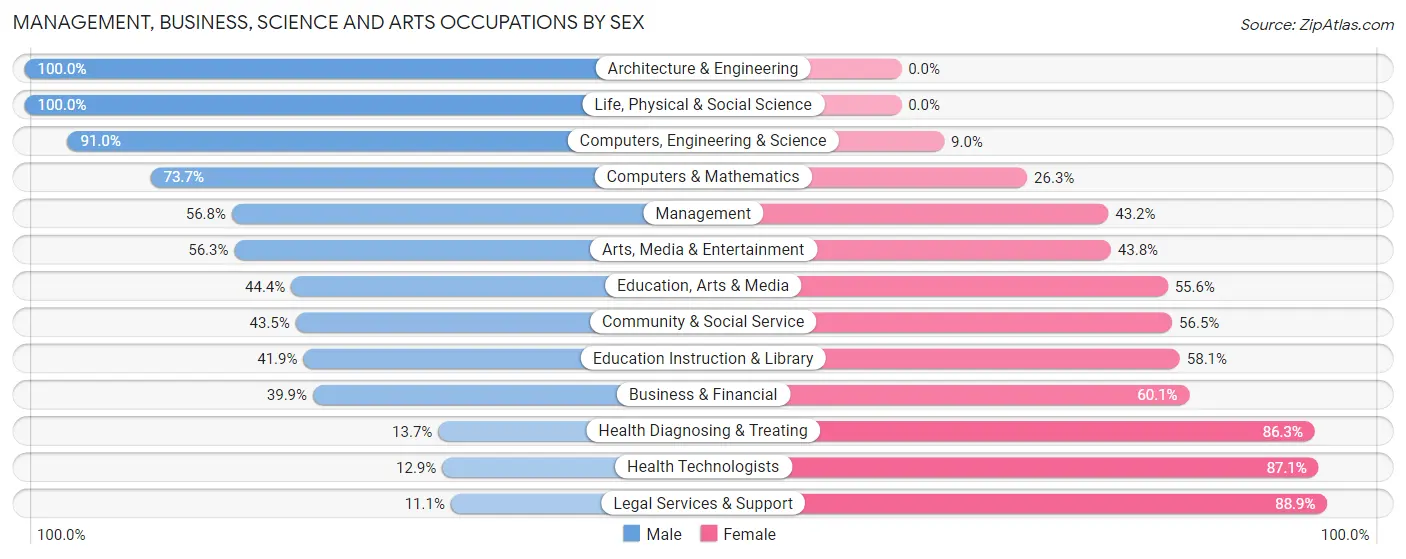
Management, Business, Science and Arts Occupations by Sex
Within the Management, Business, Science and Arts occupations in Monticello, the most male-oriented occupations are Architecture & Engineering (100.0%), Life, Physical & Social Science (100.0%), and Computers, Engineering & Science (91.0%), while the most female-oriented occupations are Legal Services & Support (88.9%), Health Technologists (87.1%), and Health Diagnosing & Treating (86.3%).
| Occupation | Male | Female |
| Management | 381 (56.8%) | 290 (43.2%) |
| Business & Financial | 124 (39.9%) | 187 (60.1%) |
| Computers, Engineering & Science | 366 (91.0%) | 36 (9.0%) |
| Computers & Mathematics | 101 (73.7%) | 36 (26.3%) |
| Architecture & Engineering | 214 (100.0%) | 0 (0.0%) |
| Life, Physical & Social Science | 51 (100.0%) | 0 (0.0%) |
| Community & Social Service | 443 (43.5%) | 576 (56.5%) |
| Education, Arts & Media | 119 (44.4%) | 149 (55.6%) |
| Legal Services & Support | 4 (11.1%) | 32 (88.9%) |
| Education Instruction & Library | 239 (41.9%) | 332 (58.1%) |
| Arts, Media & Entertainment | 81 (56.2%) | 63 (43.8%) |
| Health Diagnosing & Treating | 74 (13.7%) | 465 (86.3%) |
| Health Technologists | 55 (12.9%) | 371 (87.1%) |
| Total (Category) | 1,388 (47.2%) | 1,554 (52.8%) |
| Total (Overall) | 4,282 (53.9%) | 3,656 (46.1%) |
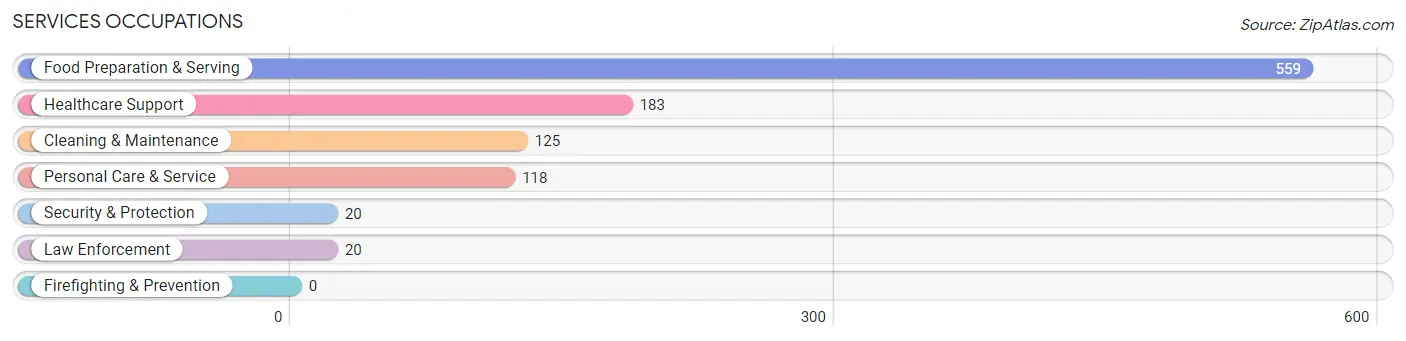
Services Occupations
The most common Services occupations in Monticello are Food Preparation & Serving (559 | 7.0%), Healthcare Support (183 | 2.3%), Cleaning & Maintenance (125 | 1.6%), Personal Care & Service (118 | 1.5%), and Security & Protection (20 | 0.3%).
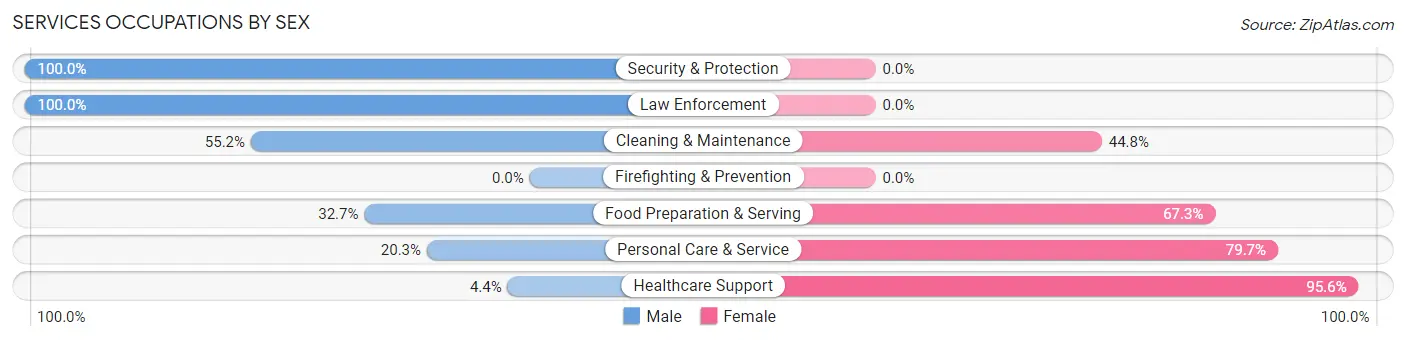
Services Occupations by Sex
Within the Services occupations in Monticello, the most male-oriented occupations are Security & Protection (100.0%), Law Enforcement (100.0%), and Cleaning & Maintenance (55.2%), while the most female-oriented occupations are Healthcare Support (95.6%), Personal Care & Service (79.7%), and Food Preparation & Serving (67.3%).
| Occupation | Male | Female |
| Healthcare Support | 8 (4.4%) | 175 (95.6%) |
| Security & Protection | 20 (100.0%) | 0 (0.0%) |
| Firefighting & Prevention | 0 (0.0%) | 0 (0.0%) |
| Law Enforcement | 20 (100.0%) | 0 (0.0%) |
| Food Preparation & Serving | 183 (32.7%) | 376 (67.3%) |
| Cleaning & Maintenance | 69 (55.2%) | 56 (44.8%) |
| Personal Care & Service | 24 (20.3%) | 94 (79.7%) |
| Total (Category) | 304 (30.2%) | 701 (69.8%) |
| Total (Overall) | 4,282 (53.9%) | 3,656 (46.1%) |
Sales and Office Occupations
The most common Sales and Office occupations in Monticello are Sales & Related (744 | 9.4%), and Office & Administration (693 | 8.7%).
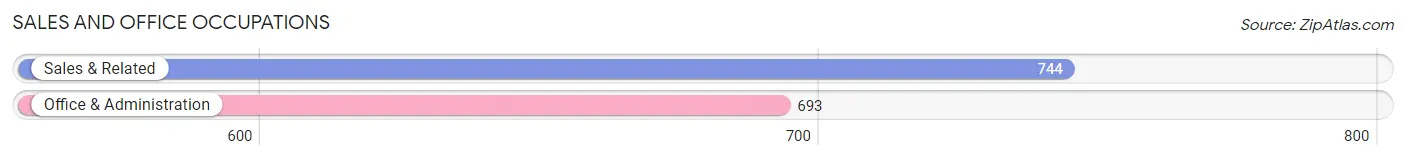
Sales and Office Occupations by Sex
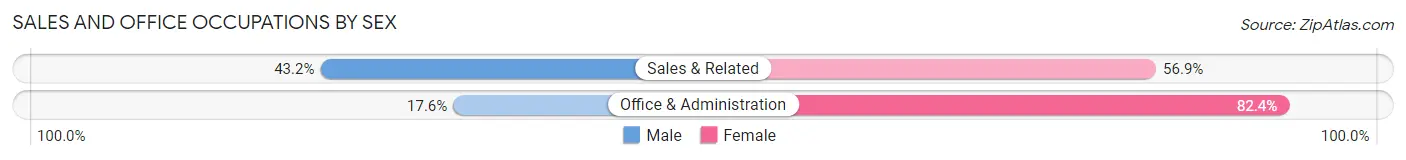
| Occupation | Male | Female |
| Sales & Related | 321 (43.1%) | 423 (56.9%) |
| Office & Administration | 122 (17.6%) | 571 (82.4%) |
| Total (Category) | 443 (30.8%) | 994 (69.2%) |
| Total (Overall) | 4,282 (53.9%) | 3,656 (46.1%) |
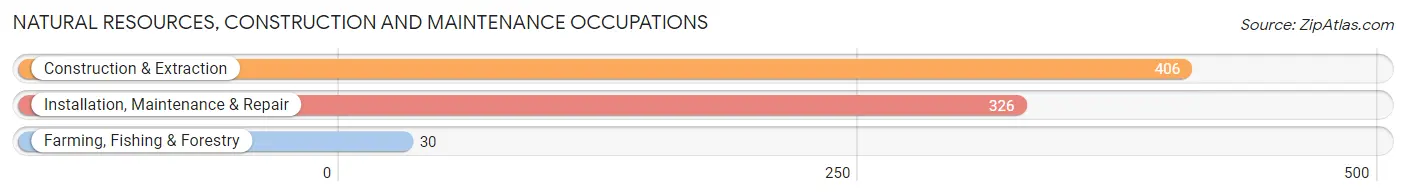
Natural Resources, Construction and Maintenance Occupations
The most common Natural Resources, Construction and Maintenance occupations in Monticello are Construction & Extraction (406 | 5.1%), Installation, Maintenance & Repair (326 | 4.1%), and Farming, Fishing & Forestry (30 | 0.4%).
Natural Resources, Construction and Maintenance Occupations by Sex
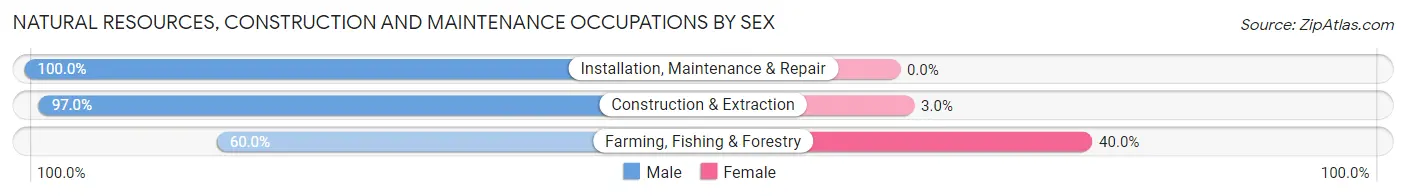
| Occupation | Male | Female |
| Farming, Fishing & Forestry | 18 (60.0%) | 12 (40.0%) |
| Construction & Extraction | 394 (97.0%) | 12 (3.0%) |
| Installation, Maintenance & Repair | 326 (100.0%) | 0 (0.0%) |
| Total (Category) | 738 (96.9%) | 24 (3.2%) |
| Total (Overall) | 4,282 (53.9%) | 3,656 (46.1%) |
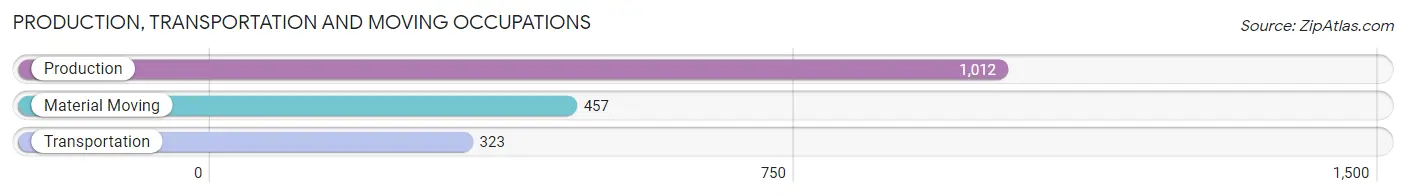
Production, Transportation and Moving Occupations
The most common Production, Transportation and Moving occupations in Monticello are Production (1,012 | 12.8%), Material Moving (457 | 5.8%), and Transportation (323 | 4.1%).
Production, Transportation and Moving Occupations by Sex
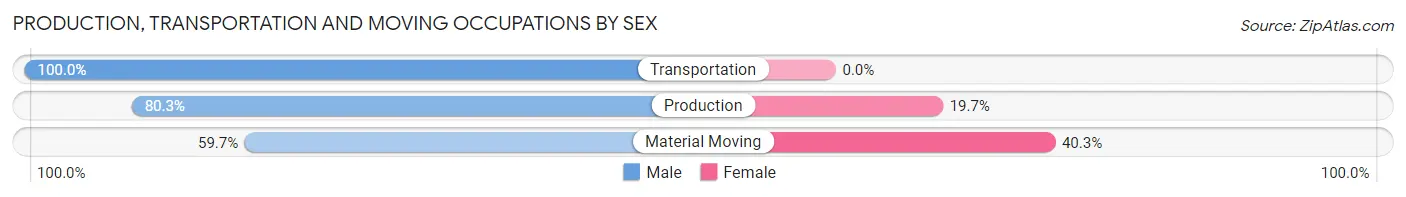
| Occupation | Male | Female |
| Production | 813 (80.3%) | 199 (19.7%) |
| Transportation | 323 (100.0%) | 0 (0.0%) |
| Material Moving | 273 (59.7%) | 184 (40.3%) |
| Total (Category) | 1,409 (78.6%) | 383 (21.4%) |
| Total (Overall) | 4,282 (53.9%) | 3,656 (46.1%) |
Employment Industries by Sex in Monticello
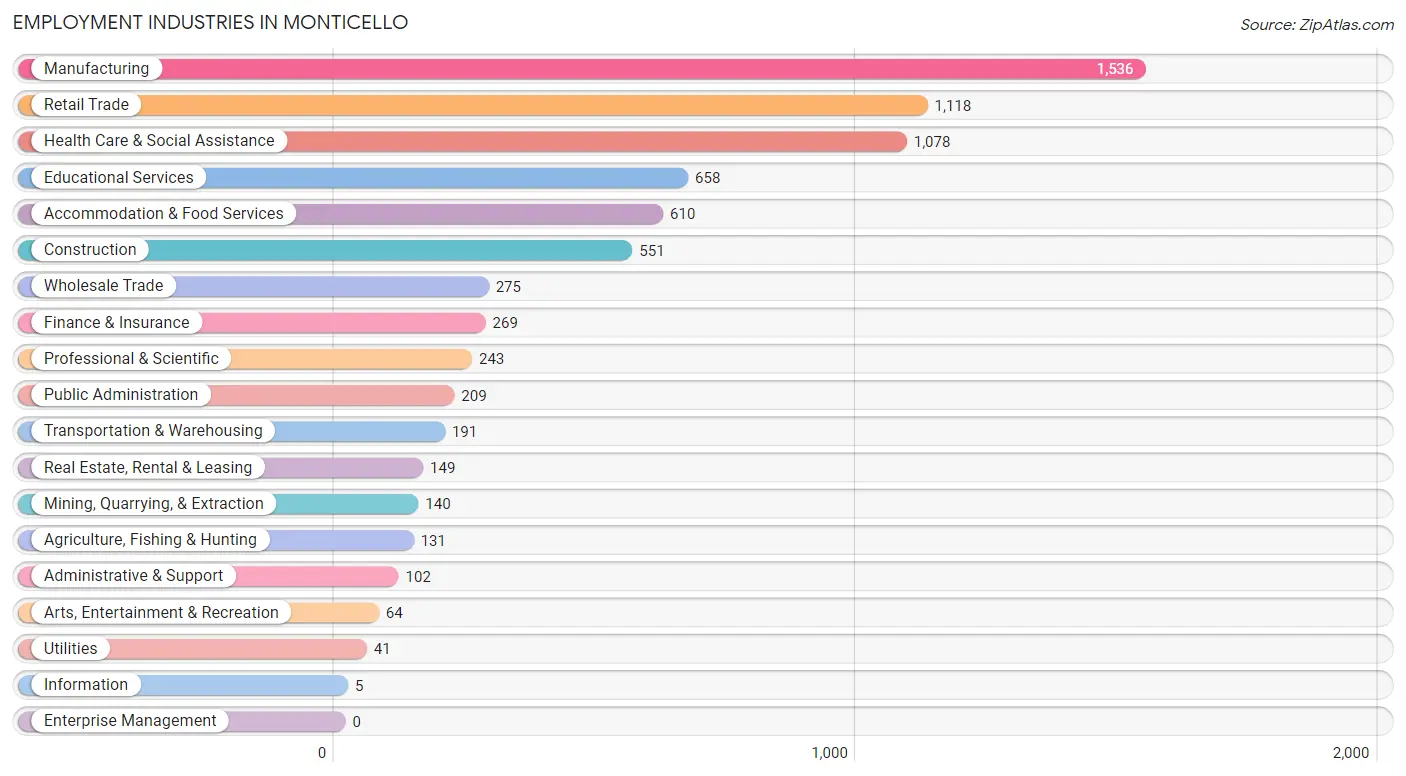
Employment Industries in Monticello
The major employment industries in Monticello include Manufacturing (1,536 | 19.4%), Retail Trade (1,118 | 14.1%), Health Care & Social Assistance (1,078 | 13.6%), Educational Services (658 | 8.3%), and Accommodation & Food Services (610 | 7.7%).
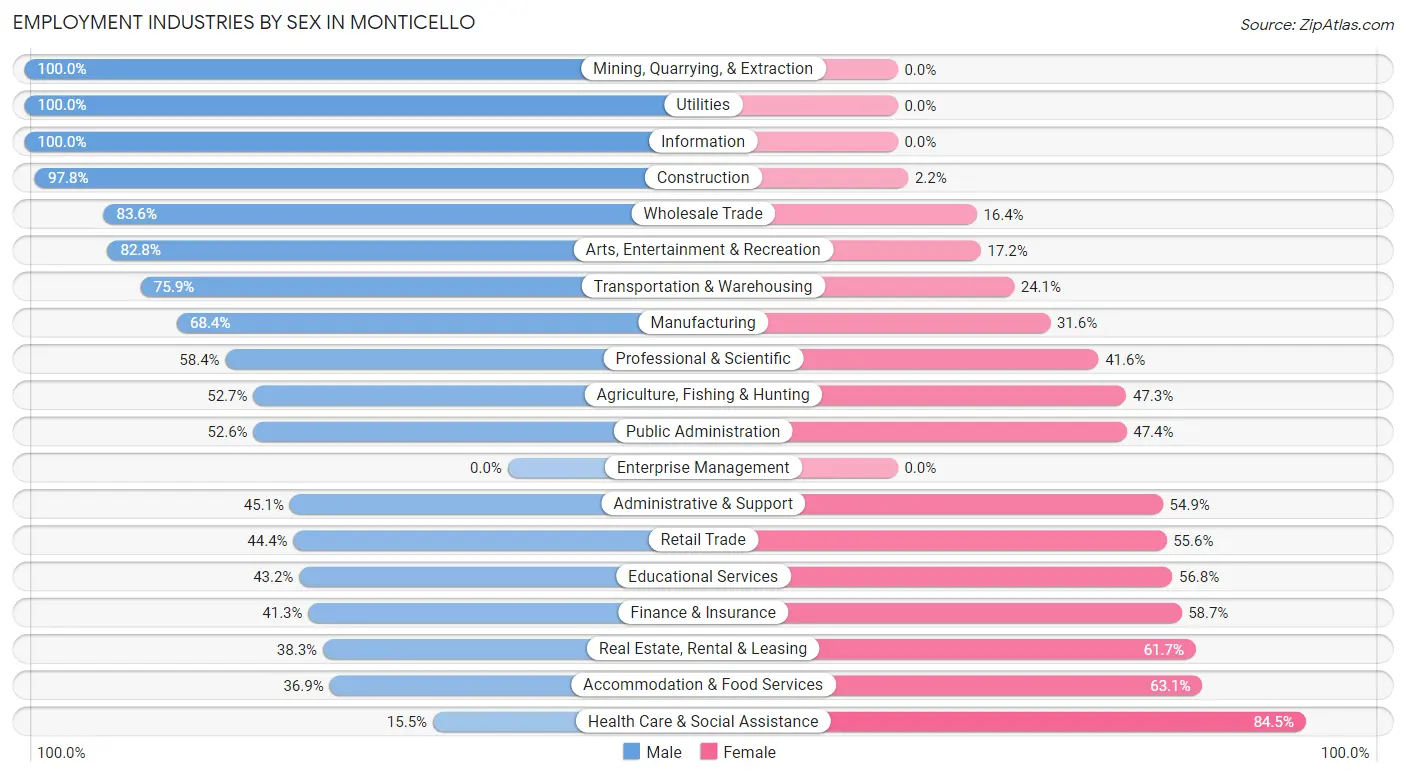
Employment Industries by Sex in Monticello
The Monticello industries that see more men than women are Mining, Quarrying, & Extraction (100.0%), Utilities (100.0%), and Information (100.0%), whereas the industries that tend to have a higher number of women are Health Care & Social Assistance (84.5%), Accommodation & Food Services (63.1%), and Real Estate, Rental & Leasing (61.7%).
| Industry | Male | Female |
| Agriculture, Fishing & Hunting | 69 (52.7%) | 62 (47.3%) |
| Mining, Quarrying, & Extraction | 140 (100.0%) | 0 (0.0%) |
| Construction | 539 (97.8%) | 12 (2.2%) |
| Manufacturing | 1,051 (68.4%) | 485 (31.6%) |
| Wholesale Trade | 230 (83.6%) | 45 (16.4%) |
| Retail Trade | 496 (44.4%) | 622 (55.6%) |
| Transportation & Warehousing | 145 (75.9%) | 46 (24.1%) |
| Utilities | 41 (100.0%) | 0 (0.0%) |
| Information | 5 (100.0%) | 0 (0.0%) |
| Finance & Insurance | 111 (41.3%) | 158 (58.7%) |
| Real Estate, Rental & Leasing | 57 (38.3%) | 92 (61.7%) |
| Professional & Scientific | 142 (58.4%) | 101 (41.6%) |
| Enterprise Management | 0 (0.0%) | 0 (0.0%) |
| Administrative & Support | 46 (45.1%) | 56 (54.9%) |
| Educational Services | 284 (43.2%) | 374 (56.8%) |
| Health Care & Social Assistance | 167 (15.5%) | 911 (84.5%) |
| Arts, Entertainment & Recreation | 53 (82.8%) | 11 (17.2%) |
| Accommodation & Food Services | 225 (36.9%) | 385 (63.1%) |
| Public Administration | 110 (52.6%) | 99 (47.4%) |
| Total | 4,282 (53.9%) | 3,656 (46.1%) |
Education in Monticello
School Enrollment in Monticello
The most common levels of schooling among the 4,132 students in Monticello are middle school (1,038 | 25.1%), high school (878 | 21.2%), and elementary school (754 | 18.2%).
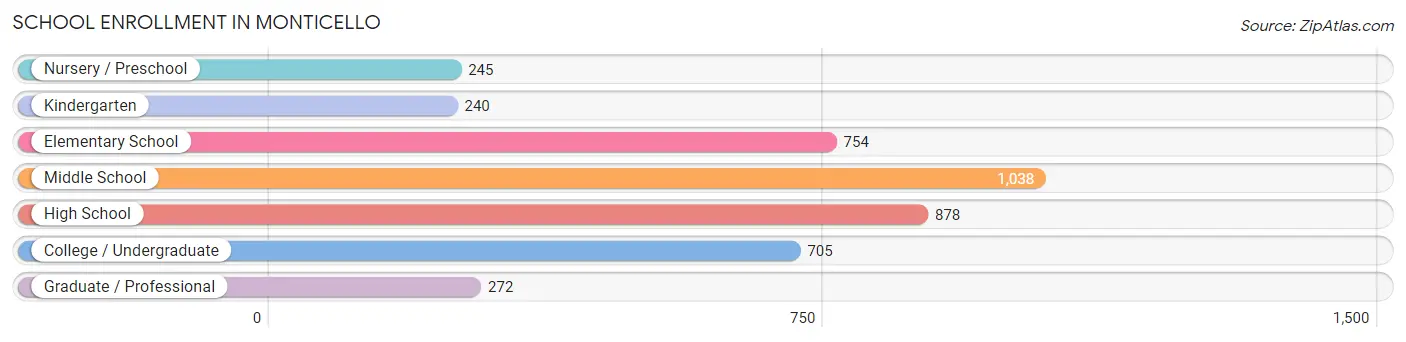
| School Level | # Students | % Students |
| Nursery / Preschool | 245 | 5.9% |
| Kindergarten | 240 | 5.8% |
| Elementary School | 754 | 18.2% |
| Middle School | 1,038 | 25.1% |
| High School | 878 | 21.2% |
| College / Undergraduate | 705 | 17.1% |
| Graduate / Professional | 272 | 6.6% |
| Total | 4,132 | 100.0% |
School Enrollment by Age by Funding Source in Monticello
Out of a total of 4,132 students who are enrolled in schools in Monticello, 397 (9.6%) attend a private institution, while the remaining 3,735 (90.4%) are enrolled in public schools. The age group of 35 years and over has the highest likelihood of being enrolled in private schools, with 72 (59.0% in the age bracket) enrolled. Conversely, the age group of 18 to 19 year olds has the lowest likelihood of being enrolled in a private school, with 247 (100.0% in the age bracket) attending a public institution.
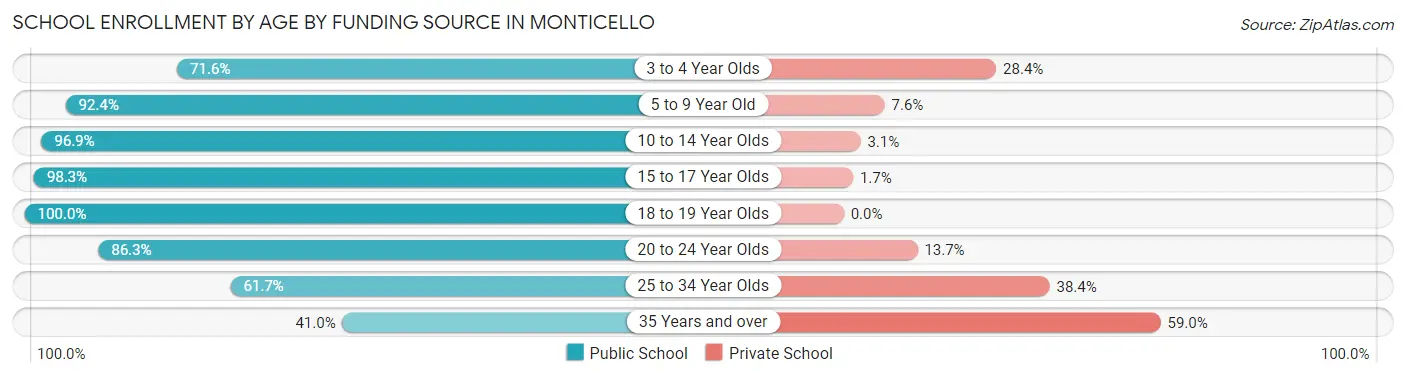
| Age Bracket | Public School | Private School |
| 3 to 4 Year Olds | 116 (71.6%) | 46 (28.4%) |
| 5 to 9 Year Old | 873 (92.4%) | 72 (7.6%) |
| 10 to 14 Year Olds | 1,145 (96.9%) | 37 (3.1%) |
| 15 to 17 Year Olds | 681 (98.3%) | 12 (1.7%) |
| 18 to 19 Year Olds | 247 (100.0%) | 0 (0.0%) |
| 20 to 24 Year Olds | 496 (86.3%) | 79 (13.7%) |
| 25 to 34 Year Olds | 127 (61.7%) | 79 (38.4%) |
| 35 Years and over | 50 (41.0%) | 72 (59.0%) |
| Total | 3,735 (90.4%) | 397 (9.6%) |
Educational Attainment by Field of Study in Monticello
Business (501 | 20.2%), education (361 | 14.6%), science & technology (360 | 14.5%), psychology (306 | 12.4%), and arts & humanities (251 | 10.1%) are the most common fields of study among 2,476 individuals in Monticello who have obtained a bachelor's degree or higher.
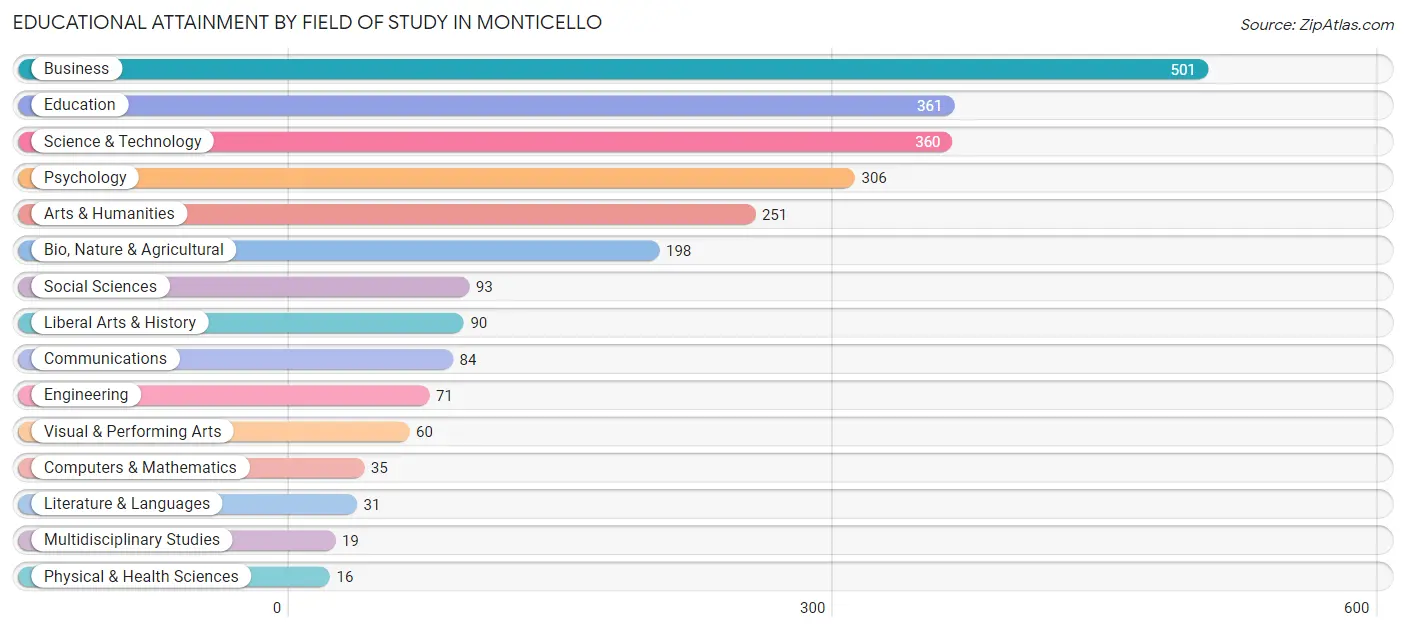
| Field of Study | # Graduates | % Graduates |
| Computers & Mathematics | 35 | 1.4% |
| Bio, Nature & Agricultural | 198 | 8.0% |
| Physical & Health Sciences | 16 | 0.6% |
| Psychology | 306 | 12.4% |
| Social Sciences | 93 | 3.8% |
| Engineering | 71 | 2.9% |
| Multidisciplinary Studies | 19 | 0.8% |
| Science & Technology | 360 | 14.5% |
| Business | 501 | 20.2% |
| Education | 361 | 14.6% |
| Literature & Languages | 31 | 1.3% |
| Liberal Arts & History | 90 | 3.6% |
| Visual & Performing Arts | 60 | 2.4% |
| Communications | 84 | 3.4% |
| Arts & Humanities | 251 | 10.1% |
| Total | 2,476 | 100.0% |
Transportation & Commute in Monticello
Vehicle Availability by Sex in Monticello
The most prevalent vehicle ownership categories in Monticello are males with 2 vehicles (1,782, accounting for 42.5%) and females with 2 vehicles (1,411, making up 51.5%).
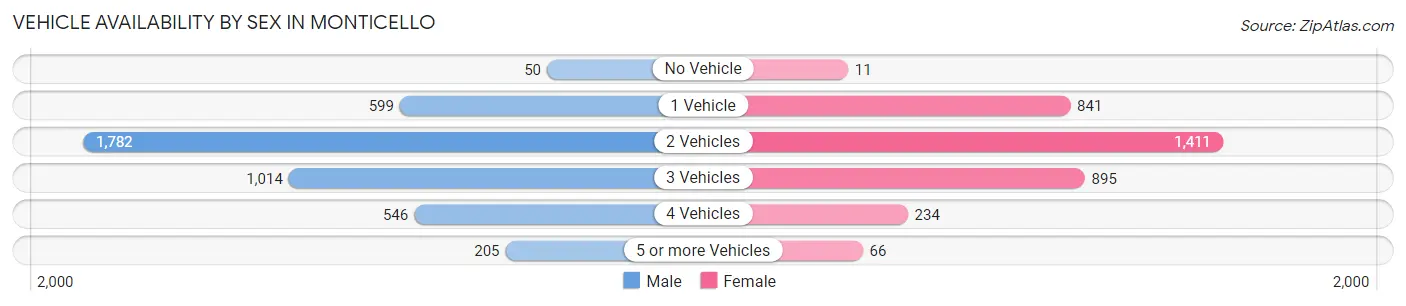
| Vehicles Available | Male | Female |
| No Vehicle | 50 (1.2%) | 11 (0.3%) |
| 1 Vehicle | 599 (14.3%) | 841 (24.3%) |
| 2 Vehicles | 1,782 (42.5%) | 1,411 (40.8%) |
| 3 Vehicles | 1,014 (24.2%) | 895 (25.9%) |
| 4 Vehicles | 546 (13.0%) | 234 (6.8%) |
| 5 or more Vehicles | 205 (4.9%) | 66 (1.9%) |
| Total | 4,196 (100.0%) | 3,458 (100.0%) |
Commute Time in Monticello
The most frequently occuring commute durations in Monticello are 10 to 14 minutes (947 commuters, 13.5%), 45 to 59 minutes (912 commuters, 13.0%), and 5 to 9 minutes (898 commuters, 12.8%).
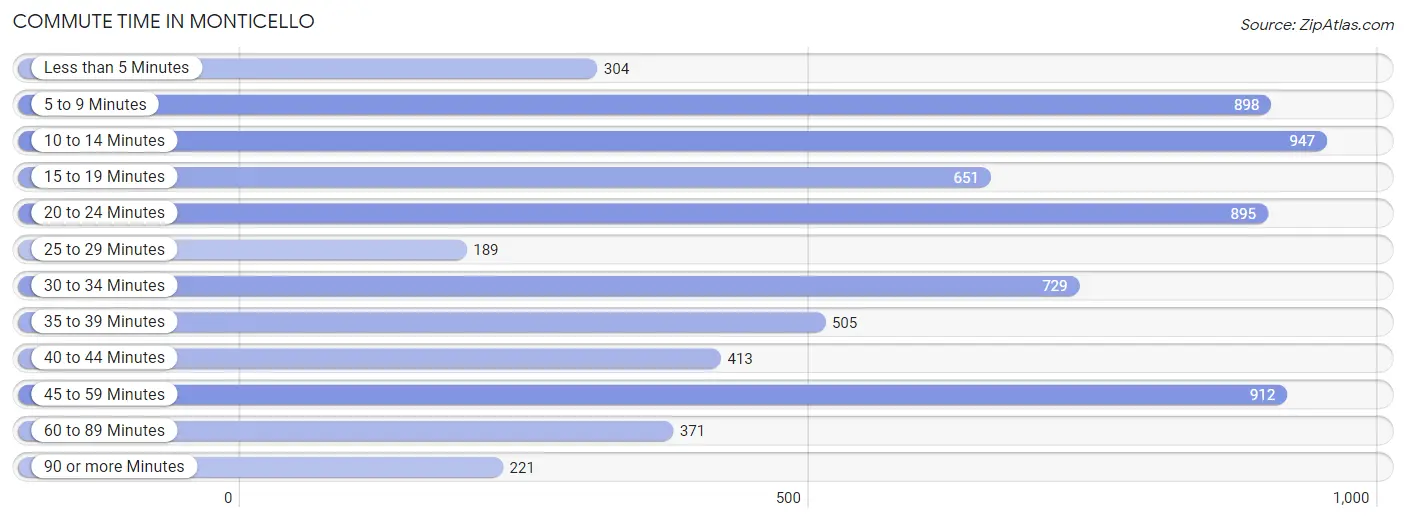
| Commute Time | # Commuters | % Commuters |
| Less than 5 Minutes | 304 | 4.3% |
| 5 to 9 Minutes | 898 | 12.8% |
| 10 to 14 Minutes | 947 | 13.5% |
| 15 to 19 Minutes | 651 | 9.2% |
| 20 to 24 Minutes | 895 | 12.7% |
| 25 to 29 Minutes | 189 | 2.7% |
| 30 to 34 Minutes | 729 | 10.4% |
| 35 to 39 Minutes | 505 | 7.2% |
| 40 to 44 Minutes | 413 | 5.9% |
| 45 to 59 Minutes | 912 | 13.0% |
| 60 to 89 Minutes | 371 | 5.3% |
| 90 or more Minutes | 221 | 3.1% |
Commute Time by Sex in Monticello
The most common commute times in Monticello are 20 to 24 minutes (539 commuters, 13.7%) for males and 10 to 14 minutes (476 commuters, 15.3%) for females.
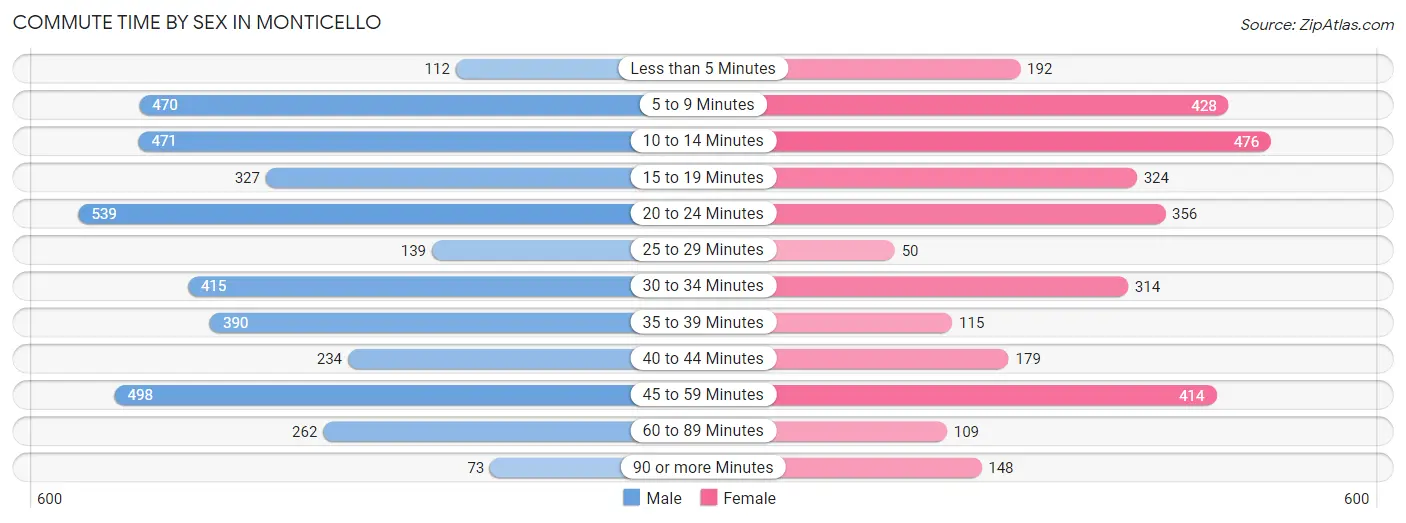
| Commute Time | Male | Female |
| Less than 5 Minutes | 112 (2.9%) | 192 (6.2%) |
| 5 to 9 Minutes | 470 (12.0%) | 428 (13.8%) |
| 10 to 14 Minutes | 471 (12.0%) | 476 (15.3%) |
| 15 to 19 Minutes | 327 (8.3%) | 324 (10.4%) |
| 20 to 24 Minutes | 539 (13.7%) | 356 (11.5%) |
| 25 to 29 Minutes | 139 (3.5%) | 50 (1.6%) |
| 30 to 34 Minutes | 415 (10.6%) | 314 (10.1%) |
| 35 to 39 Minutes | 390 (9.9%) | 115 (3.7%) |
| 40 to 44 Minutes | 234 (5.9%) | 179 (5.8%) |
| 45 to 59 Minutes | 498 (12.7%) | 414 (13.3%) |
| 60 to 89 Minutes | 262 (6.7%) | 109 (3.5%) |
| 90 or more Minutes | 73 (1.9%) | 148 (4.8%) |
Time of Departure to Work by Sex in Monticello
The most frequent times of departure to work in Monticello are 6:00 AM to 6:29 AM (593, 15.1%) for males and 7:30 AM to 7:59 AM (546, 17.6%) for females.
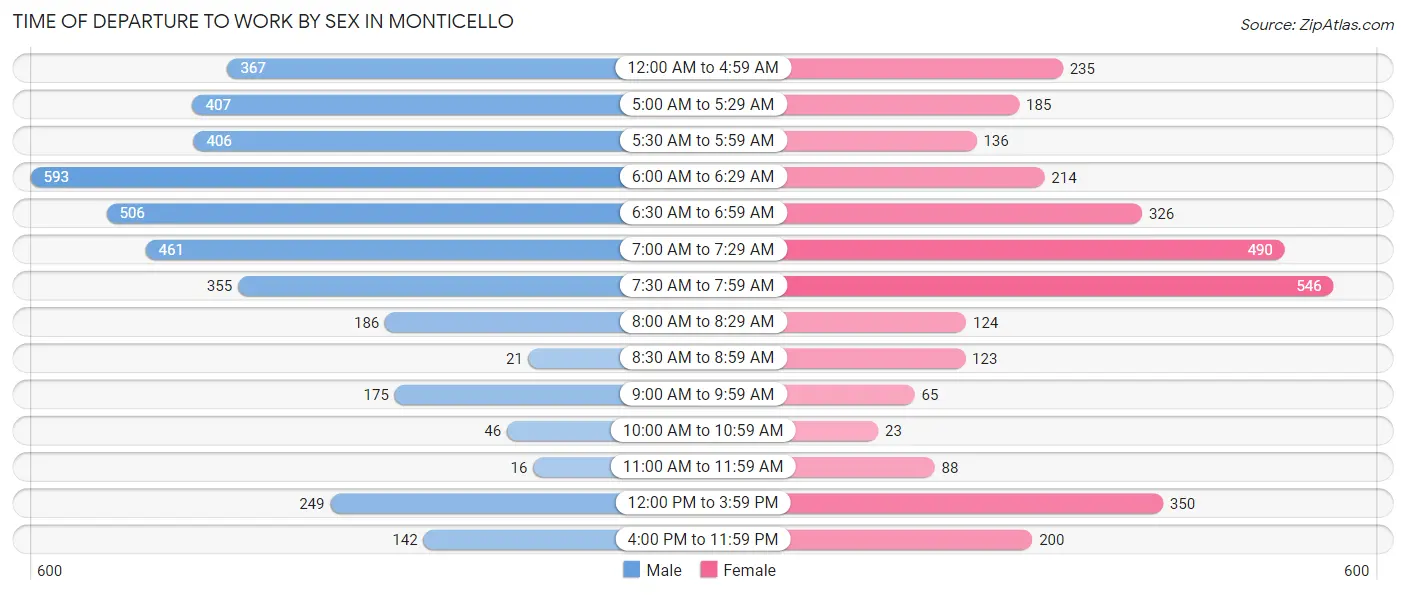
| Time of Departure | Male | Female |
| 12:00 AM to 4:59 AM | 367 (9.3%) | 235 (7.6%) |
| 5:00 AM to 5:29 AM | 407 (10.4%) | 185 (6.0%) |
| 5:30 AM to 5:59 AM | 406 (10.3%) | 136 (4.4%) |
| 6:00 AM to 6:29 AM | 593 (15.1%) | 214 (6.9%) |
| 6:30 AM to 6:59 AM | 506 (12.9%) | 326 (10.5%) |
| 7:00 AM to 7:29 AM | 461 (11.7%) | 490 (15.8%) |
| 7:30 AM to 7:59 AM | 355 (9.0%) | 546 (17.6%) |
| 8:00 AM to 8:29 AM | 186 (4.7%) | 124 (4.0%) |
| 8:30 AM to 8:59 AM | 21 (0.5%) | 123 (4.0%) |
| 9:00 AM to 9:59 AM | 175 (4.4%) | 65 (2.1%) |
| 10:00 AM to 10:59 AM | 46 (1.2%) | 23 (0.7%) |
| 11:00 AM to 11:59 AM | 16 (0.4%) | 88 (2.8%) |
| 12:00 PM to 3:59 PM | 249 (6.3%) | 350 (11.3%) |
| 4:00 PM to 11:59 PM | 142 (3.6%) | 200 (6.4%) |
| Total | 3,930 (100.0%) | 3,105 (100.0%) |
Housing Occupancy in Monticello
Occupancy by Ownership in Monticello
Of the total 5,548 dwellings in Monticello, owner-occupied units account for 3,610 (65.1%), while renter-occupied units make up 1,938 (34.9%).
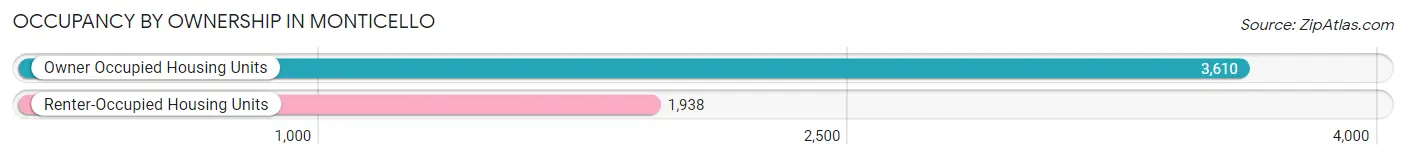
| Occupancy | # Housing Units | % Housing Units |
| Owner Occupied Housing Units | 3,610 | 65.1% |
| Renter-Occupied Housing Units | 1,938 | 34.9% |
| Total Occupied Housing Units | 5,548 | 100.0% |
Occupancy by Household Size in Monticello
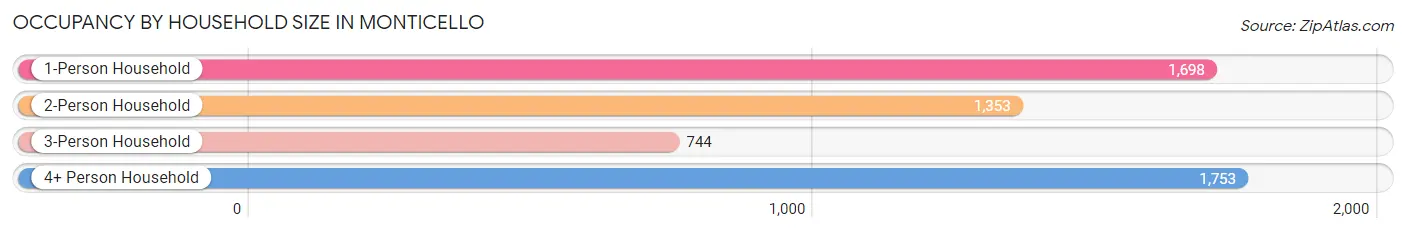
| Household Size | # Housing Units | % Housing Units |
| 1-Person Household | 1,698 | 30.6% |
| 2-Person Household | 1,353 | 24.4% |
| 3-Person Household | 744 | 13.4% |
| 4+ Person Household | 1,753 | 31.6% |
| Total Housing Units | 5,548 | 100.0% |
Occupancy by Ownership by Household Size in Monticello
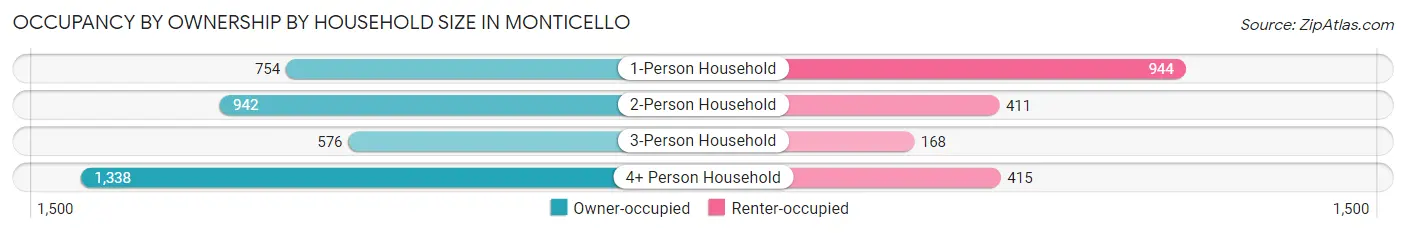
| Household Size | Owner-occupied | Renter-occupied |
| 1-Person Household | 754 (44.4%) | 944 (55.6%) |
| 2-Person Household | 942 (69.6%) | 411 (30.4%) |
| 3-Person Household | 576 (77.4%) | 168 (22.6%) |
| 4+ Person Household | 1,338 (76.3%) | 415 (23.7%) |
| Total Housing Units | 3,610 (65.1%) | 1,938 (34.9%) |
Occupancy by Educational Attainment in Monticello
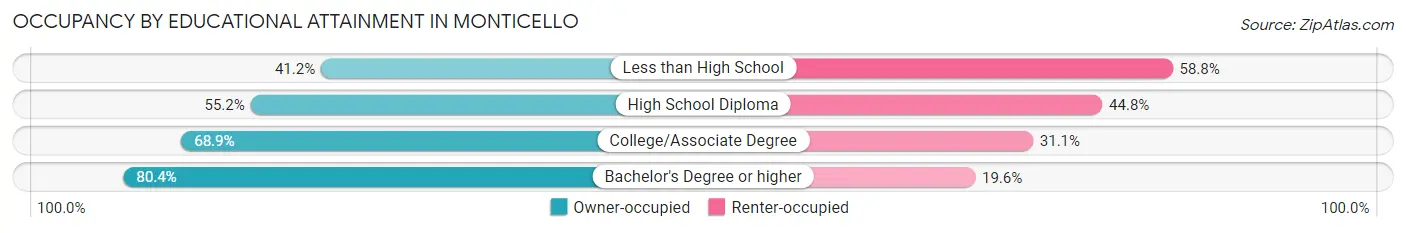
| Household Size | Owner-occupied | Renter-occupied |
| Less than High School | 233 (41.2%) | 332 (58.8%) |
| High School Diploma | 950 (55.2%) | 771 (44.8%) |
| College/Associate Degree | 1,176 (68.9%) | 530 (31.1%) |
| Bachelor's Degree or higher | 1,251 (80.4%) | 305 (19.6%) |
Occupancy by Age of Householder in Monticello
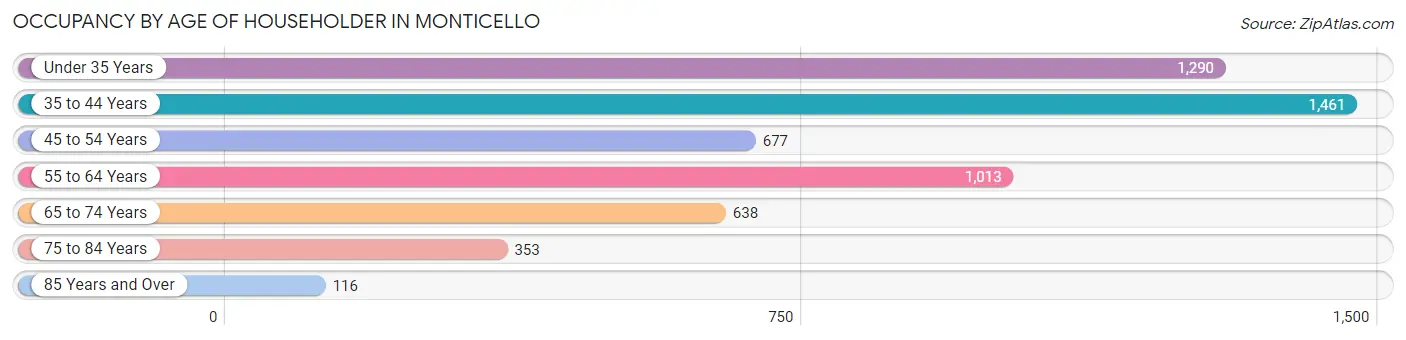
| Age Bracket | # Households | % Households |
| Under 35 Years | 1,290 | 23.3% |
| 35 to 44 Years | 1,461 | 26.3% |
| 45 to 54 Years | 677 | 12.2% |
| 55 to 64 Years | 1,013 | 18.3% |
| 65 to 74 Years | 638 | 11.5% |
| 75 to 84 Years | 353 | 6.4% |
| 85 Years and Over | 116 | 2.1% |
| Total | 5,548 | 100.0% |
Housing Finances in Monticello
Median Income by Occupancy in Monticello
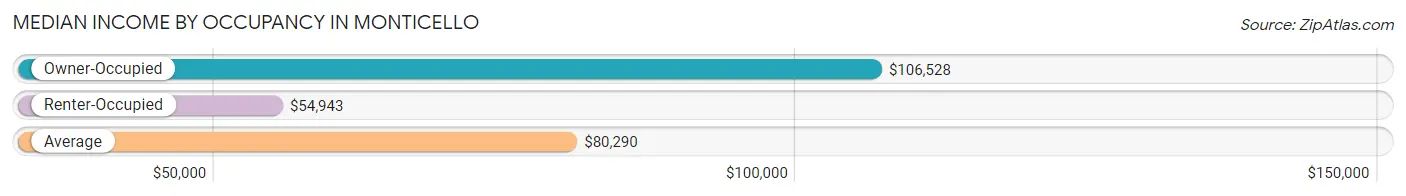
| Occupancy Type | # Households | Median Income |
| Owner-Occupied | 3,610 (65.1%) | $106,528 |
| Renter-Occupied | 1,938 (34.9%) | $54,943 |
| Average | 5,548 (100.0%) | $80,290 |
Occupancy by Householder Income Bracket in Monticello
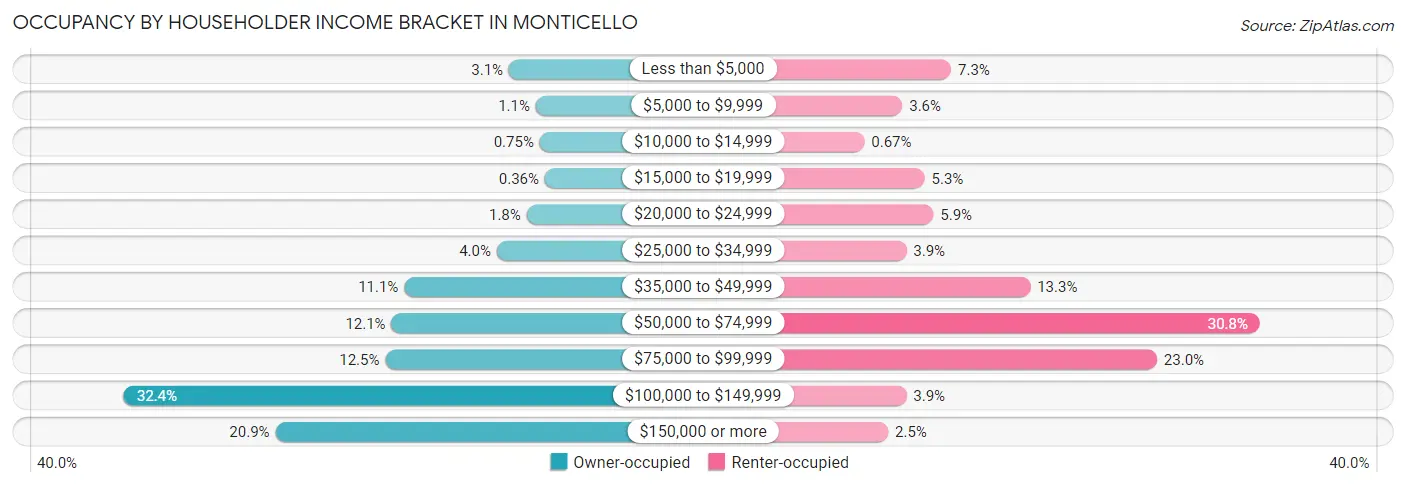
| Income Bracket | Owner-occupied | Renter-occupied |
| Less than $5,000 | 112 (3.1%) | 141 (7.3%) |
| $5,000 to $9,999 | 38 (1.1%) | 69 (3.6%) |
| $10,000 to $14,999 | 27 (0.7%) | 13 (0.7%) |
| $15,000 to $19,999 | 13 (0.4%) | 102 (5.3%) |
| $20,000 to $24,999 | 63 (1.8%) | 115 (5.9%) |
| $25,000 to $34,999 | 145 (4.0%) | 75 (3.9%) |
| $35,000 to $49,999 | 400 (11.1%) | 258 (13.3%) |
| $50,000 to $74,999 | 435 (12.0%) | 597 (30.8%) |
| $75,000 to $99,999 | 452 (12.5%) | 445 (23.0%) |
| $100,000 to $149,999 | 1,171 (32.4%) | 75 (3.9%) |
| $150,000 or more | 754 (20.9%) | 48 (2.5%) |
| Total | 3,610 (100.0%) | 1,938 (100.0%) |
Monthly Housing Cost Tiers in Monticello
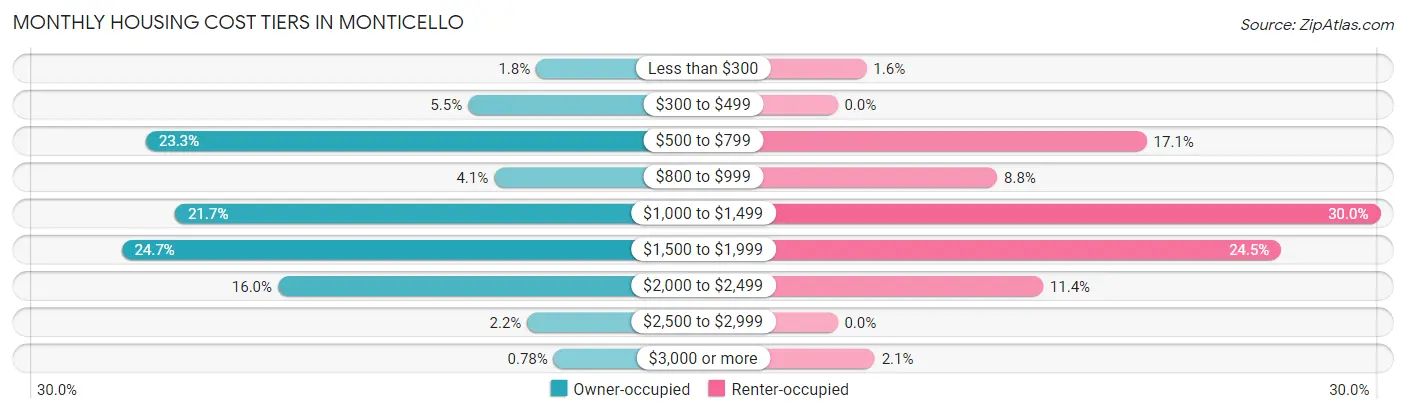
| Monthly Cost | Owner-occupied | Renter-occupied |
| Less than $300 | 63 (1.8%) | 31 (1.6%) |
| $300 to $499 | 199 (5.5%) | 0 (0.0%) |
| $500 to $799 | 841 (23.3%) | 331 (17.1%) |
| $800 to $999 | 147 (4.1%) | 171 (8.8%) |
| $1,000 to $1,499 | 783 (21.7%) | 581 (30.0%) |
| $1,500 to $1,999 | 890 (24.6%) | 475 (24.5%) |
| $2,000 to $2,499 | 578 (16.0%) | 220 (11.4%) |
| $2,500 to $2,999 | 81 (2.2%) | 0 (0.0%) |
| $3,000 or more | 28 (0.8%) | 40 (2.1%) |
| Total | 3,610 (100.0%) | 1,938 (100.0%) |
Physical Housing Characteristics in Monticello
Housing Structures in Monticello
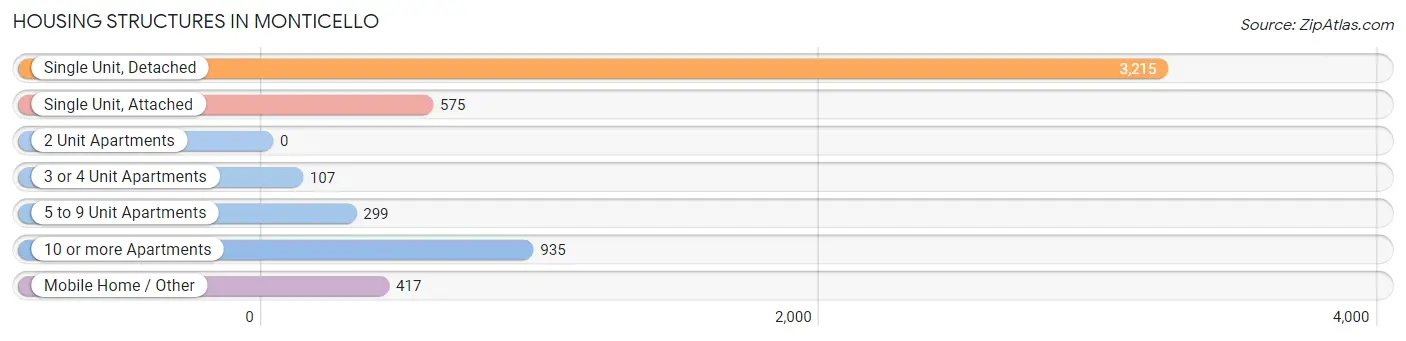
| Structure Type | # Housing Units | % Housing Units |
| Single Unit, Detached | 3,215 | 58.0% |
| Single Unit, Attached | 575 | 10.4% |
| 2 Unit Apartments | 0 | 0.0% |
| 3 or 4 Unit Apartments | 107 | 1.9% |
| 5 to 9 Unit Apartments | 299 | 5.4% |
| 10 or more Apartments | 935 | 16.9% |
| Mobile Home / Other | 417 | 7.5% |
| Total | 5,548 | 100.0% |
Housing Structures by Occupancy in Monticello
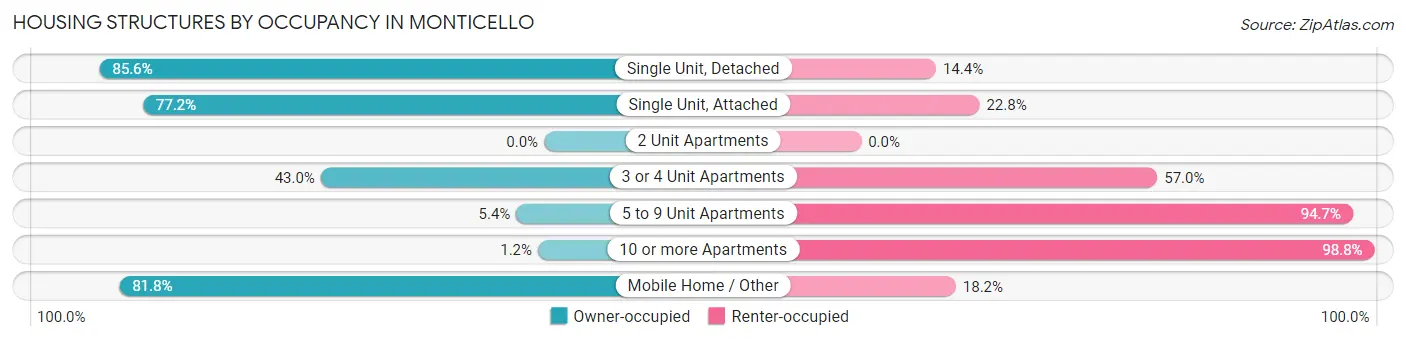
| Structure Type | Owner-occupied | Renter-occupied |
| Single Unit, Detached | 2,752 (85.6%) | 463 (14.4%) |
| Single Unit, Attached | 444 (77.2%) | 131 (22.8%) |
| 2 Unit Apartments | 0 (0.0%) | 0 (0.0%) |
| 3 or 4 Unit Apartments | 46 (43.0%) | 61 (57.0%) |
| 5 to 9 Unit Apartments | 16 (5.3%) | 283 (94.7%) |
| 10 or more Apartments | 11 (1.2%) | 924 (98.8%) |
| Mobile Home / Other | 341 (81.8%) | 76 (18.2%) |
| Total | 3,610 (65.1%) | 1,938 (34.9%) |
Housing Structures by Number of Rooms in Monticello
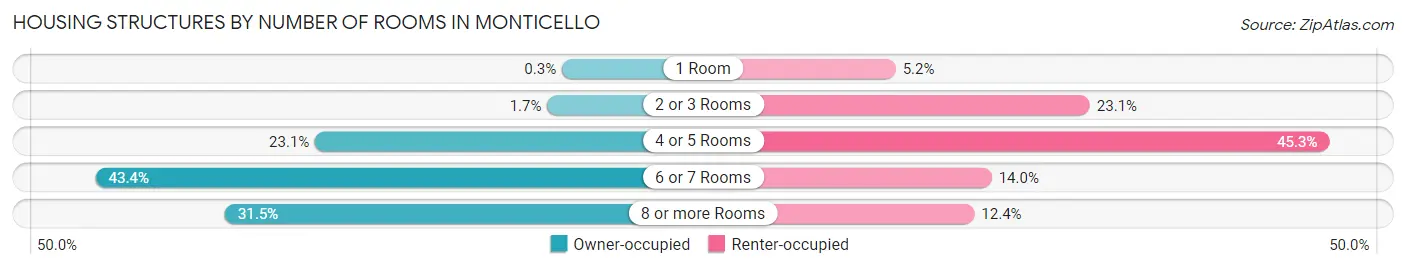
| Number of Rooms | Owner-occupied | Renter-occupied |
| 1 Room | 11 (0.3%) | 100 (5.2%) |
| 2 or 3 Rooms | 60 (1.7%) | 448 (23.1%) |
| 4 or 5 Rooms | 835 (23.1%) | 877 (45.3%) |
| 6 or 7 Rooms | 1,568 (43.4%) | 272 (14.0%) |
| 8 or more Rooms | 1,136 (31.5%) | 241 (12.4%) |
| Total | 3,610 (100.0%) | 1,938 (100.0%) |
Housing Structure by Heating Type in Monticello
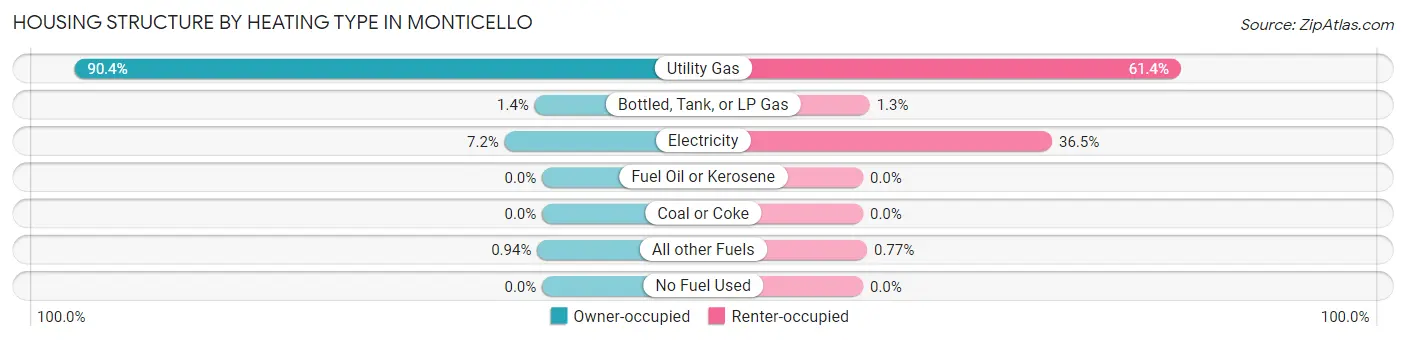
| Heating Type | Owner-occupied | Renter-occupied |
| Utility Gas | 3,263 (90.4%) | 1,190 (61.4%) |
| Bottled, Tank, or LP Gas | 52 (1.4%) | 25 (1.3%) |
| Electricity | 261 (7.2%) | 708 (36.5%) |
| Fuel Oil or Kerosene | 0 (0.0%) | 0 (0.0%) |
| Coal or Coke | 0 (0.0%) | 0 (0.0%) |
| All other Fuels | 34 (0.9%) | 15 (0.8%) |
| No Fuel Used | 0 (0.0%) | 0 (0.0%) |
| Total | 3,610 (100.0%) | 1,938 (100.0%) |
Household Vehicle Usage in Monticello
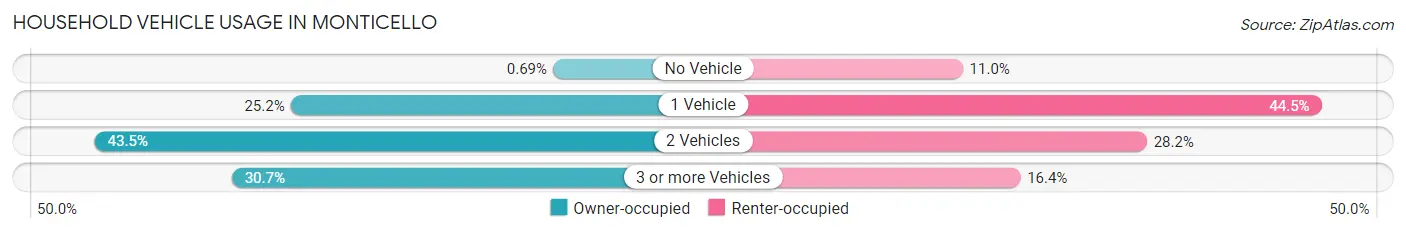
| Vehicles per Household | Owner-occupied | Renter-occupied |
| No Vehicle | 25 (0.7%) | 213 (11.0%) |
| 1 Vehicle | 909 (25.2%) | 862 (44.5%) |
| 2 Vehicles | 1,569 (43.5%) | 546 (28.2%) |
| 3 or more Vehicles | 1,107 (30.7%) | 317 (16.4%) |
| Total | 3,610 (100.0%) | 1,938 (100.0%) |
Real Estate & Mortgages in Monticello
Real Estate and Mortgage Overview in Monticello
| Characteristic | Without Mortgage | With Mortgage |
| Housing Units | 1,142 | 2,468 |
| Median Property Value | $259,800 | $285,000 |
| Median Household Income | $73,500 | $705 |
| Monthly Housing Costs | $587 | $28 |
| Real Estate Taxes | $2,303 | $65 |
Property Value by Mortgage Status in Monticello
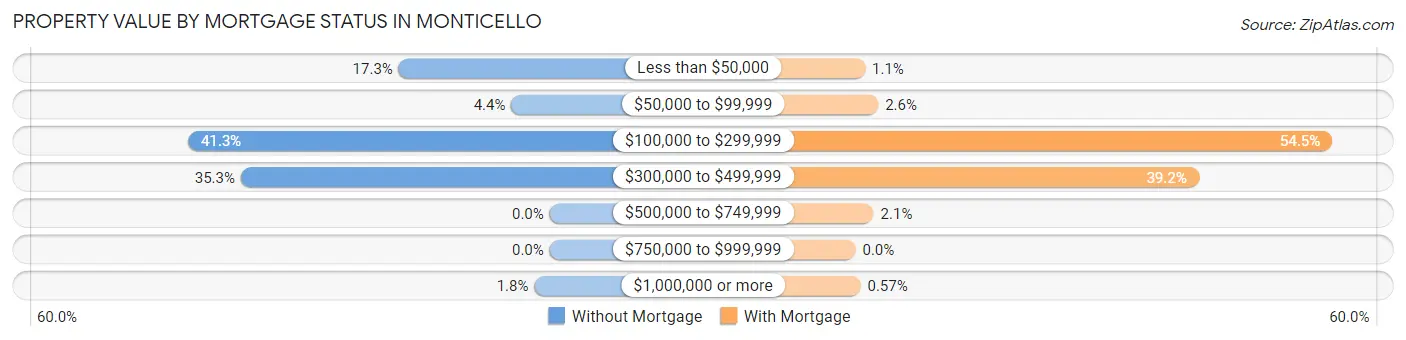
| Property Value | Without Mortgage | With Mortgage |
| Less than $50,000 | 197 (17.2%) | 27 (1.1%) |
| $50,000 to $99,999 | 50 (4.4%) | 64 (2.6%) |
| $100,000 to $299,999 | 472 (41.3%) | 1,344 (54.5%) |
| $300,000 to $499,999 | 403 (35.3%) | 968 (39.2%) |
| $500,000 to $749,999 | 0 (0.0%) | 51 (2.1%) |
| $750,000 to $999,999 | 0 (0.0%) | 0 (0.0%) |
| $1,000,000 or more | 20 (1.8%) | 14 (0.6%) |
| Total | 1,142 (100.0%) | 2,468 (100.0%) |
Household Income by Mortgage Status in Monticello
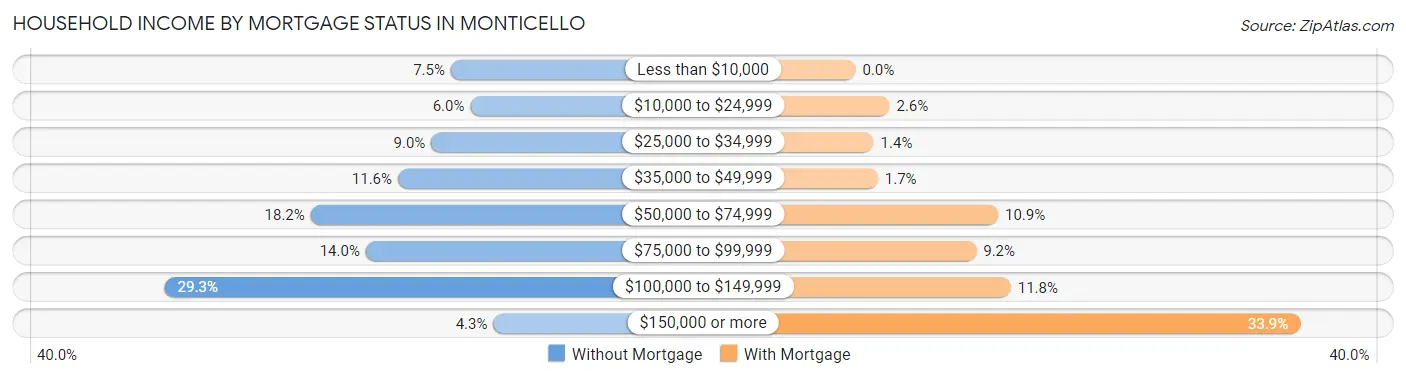
| Household Income | Without Mortgage | With Mortgage |
| Less than $10,000 | 86 (7.5%) | 0 (0.0%) |
| $10,000 to $24,999 | 69 (6.0%) | 64 (2.6%) |
| $25,000 to $34,999 | 103 (9.0%) | 34 (1.4%) |
| $35,000 to $49,999 | 132 (11.6%) | 42 (1.7%) |
| $50,000 to $74,999 | 208 (18.2%) | 268 (10.9%) |
| $75,000 to $99,999 | 160 (14.0%) | 227 (9.2%) |
| $100,000 to $149,999 | 335 (29.3%) | 292 (11.8%) |
| $150,000 or more | 49 (4.3%) | 836 (33.9%) |
| Total | 1,142 (100.0%) | 2,468 (100.0%) |
Property Value to Household Income Ratio in Monticello
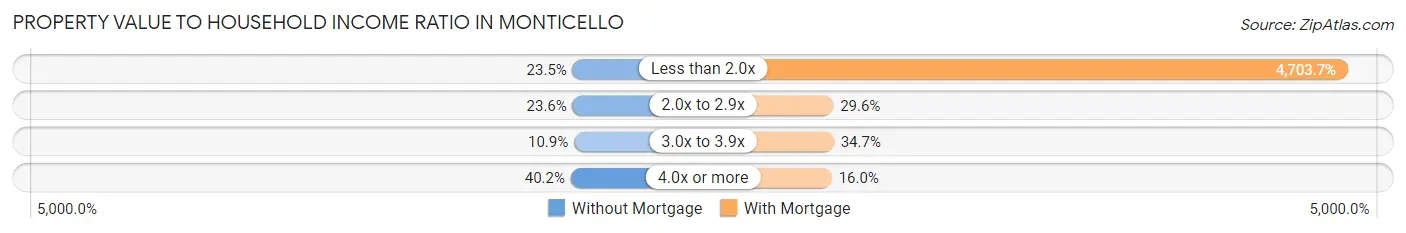
| Value-to-Income Ratio | Without Mortgage | With Mortgage |
| Less than 2.0x | 268 (23.5%) | 116,087 (4,703.7%) |
| 2.0x to 2.9x | 270 (23.6%) | 731 (29.6%) |
| 3.0x to 3.9x | 124 (10.9%) | 856 (34.7%) |
| 4.0x or more | 459 (40.2%) | 395 (16.0%) |
| Total | 1,142 (100.0%) | 2,468 (100.0%) |
Real Estate Taxes by Mortgage Status in Monticello
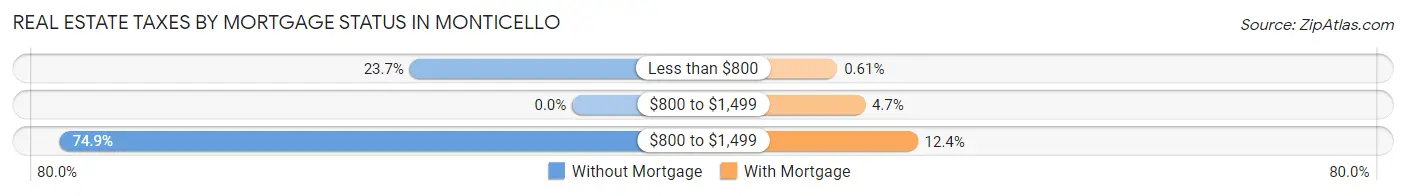
| Property Taxes | Without Mortgage | With Mortgage |
| Less than $800 | 271 (23.7%) | 15 (0.6%) |
| $800 to $1,499 | 0 (0.0%) | 115 (4.7%) |
| $800 to $1,499 | 855 (74.9%) | 305 (12.4%) |
| Total | 1,142 (100.0%) | 2,468 (100.0%) |
Health & Disability in Monticello
Health Insurance Coverage by Age in Monticello
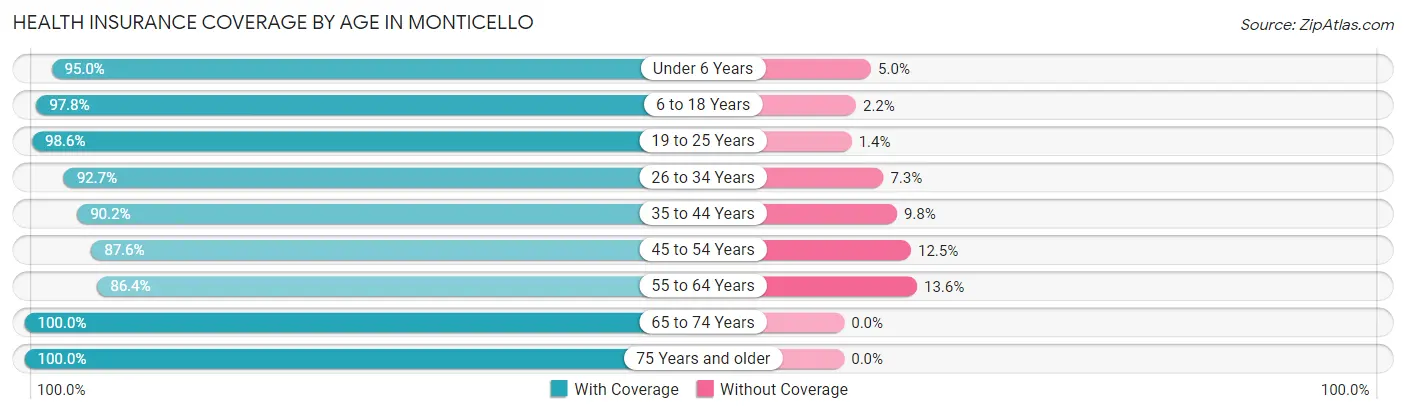
| Age Bracket | With Coverage | Without Coverage |
| Under 6 Years | 1,213 (95.0%) | 64 (5.0%) |
| 6 to 18 Years | 2,724 (97.8%) | 61 (2.2%) |
| 19 to 25 Years | 1,351 (98.6%) | 19 (1.4%) |
| 26 to 34 Years | 1,892 (92.7%) | 149 (7.3%) |
| 35 to 44 Years | 2,094 (90.2%) | 228 (9.8%) |
| 45 to 54 Years | 1,287 (87.5%) | 183 (12.4%) |
| 55 to 64 Years | 1,396 (86.4%) | 219 (13.6%) |
| 65 to 74 Years | 881 (100.0%) | 0 (0.0%) |
| 75 Years and older | 613 (100.0%) | 0 (0.0%) |
| Total | 13,451 (93.6%) | 923 (6.4%) |
Health Insurance Coverage by Citizenship Status in Monticello
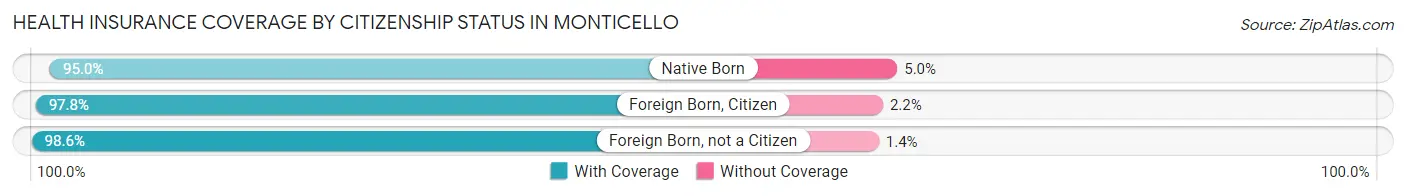
| Citizenship Status | With Coverage | Without Coverage |
| Native Born | 1,213 (95.0%) | 64 (5.0%) |
| Foreign Born, Citizen | 2,724 (97.8%) | 61 (2.2%) |
| Foreign Born, not a Citizen | 1,351 (98.6%) | 19 (1.4%) |
Health Insurance Coverage by Household Income in Monticello
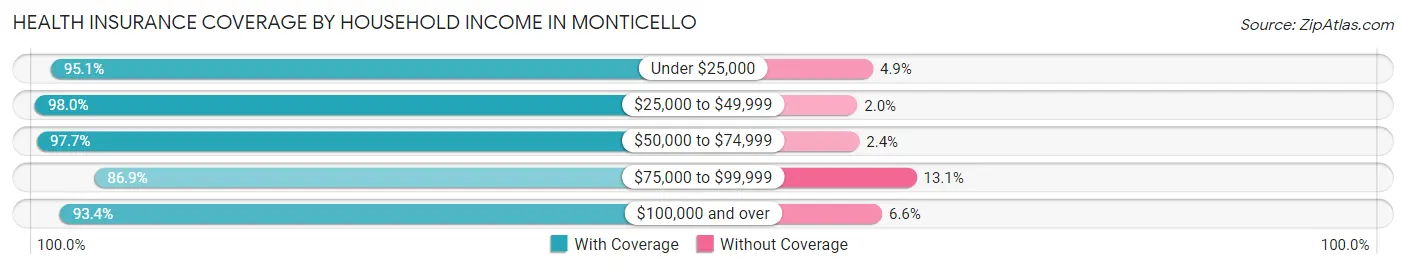
| Household Income | With Coverage | Without Coverage |
| Under $25,000 | 1,005 (95.1%) | 52 (4.9%) |
| $25,000 to $49,999 | 1,546 (98.0%) | 31 (2.0%) |
| $50,000 to $74,999 | 2,290 (97.7%) | 55 (2.4%) |
| $75,000 to $99,999 | 2,275 (86.9%) | 342 (13.1%) |
| $100,000 and over | 6,273 (93.4%) | 443 (6.6%) |
Public vs Private Health Insurance Coverage by Age in Monticello
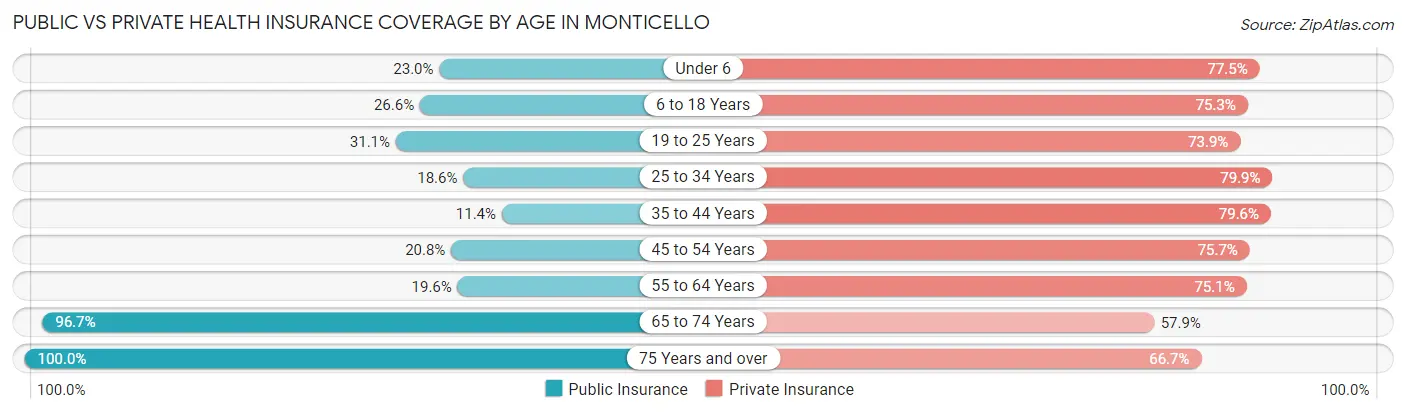
| Age Bracket | Public Insurance | Private Insurance |
| Under 6 | 294 (23.0%) | 990 (77.5%) |
| 6 to 18 Years | 741 (26.6%) | 2,098 (75.3%) |
| 19 to 25 Years | 426 (31.1%) | 1,013 (73.9%) |
| 25 to 34 Years | 379 (18.6%) | 1,631 (79.9%) |
| 35 to 44 Years | 265 (11.4%) | 1,849 (79.6%) |
| 45 to 54 Years | 306 (20.8%) | 1,113 (75.7%) |
| 55 to 64 Years | 317 (19.6%) | 1,213 (75.1%) |
| 65 to 74 Years | 852 (96.7%) | 510 (57.9%) |
| 75 Years and over | 613 (100.0%) | 409 (66.7%) |
| Total | 4,193 (29.2%) | 10,826 (75.3%) |
Disability Status by Sex by Age in Monticello
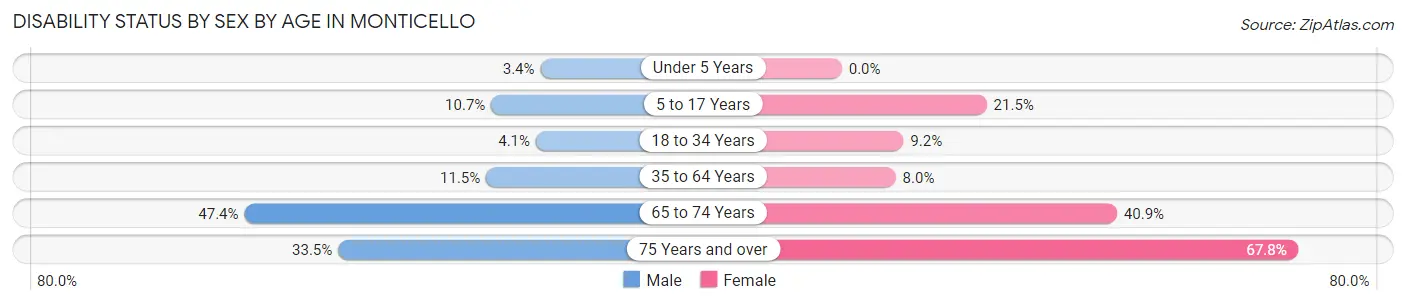
| Age Bracket | Male | Female |
| Under 5 Years | 17 (3.4%) | 0 (0.0%) |
| 5 to 17 Years | 150 (10.7%) | 325 (21.5%) |
| 18 to 34 Years | 77 (4.1%) | 152 (9.1%) |
| 35 to 64 Years | 319 (11.5%) | 210 (8.0%) |
| 65 to 74 Years | 117 (47.4%) | 259 (40.8%) |
| 75 Years and over | 99 (33.5%) | 215 (67.8%) |
Disability Class by Sex by Age in Monticello
Disability Class: Hearing Difficulty
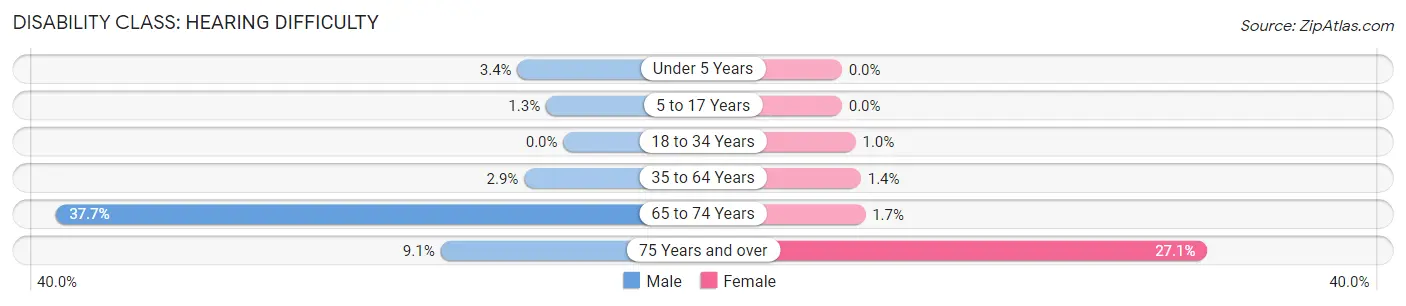
| Age Bracket | Male | Female |
| Under 5 Years | 17 (3.4%) | 0 (0.0%) |
| 5 to 17 Years | 18 (1.3%) | 0 (0.0%) |
| 18 to 34 Years | 0 (0.0%) | 17 (1.0%) |
| 35 to 64 Years | 81 (2.9%) | 37 (1.4%) |
| 65 to 74 Years | 93 (37.7%) | 11 (1.7%) |
| 75 Years and over | 27 (9.1%) | 86 (27.1%) |
Disability Class: Vision Difficulty
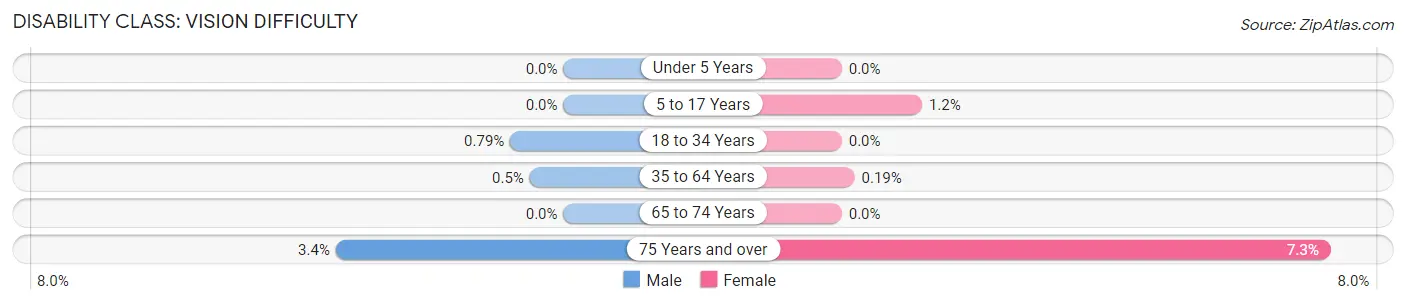
| Age Bracket | Male | Female |
| Under 5 Years | 0 (0.0%) | 0 (0.0%) |
| 5 to 17 Years | 0 (0.0%) | 18 (1.2%) |
| 18 to 34 Years | 15 (0.8%) | 0 (0.0%) |
| 35 to 64 Years | 14 (0.5%) | 5 (0.2%) |
| 65 to 74 Years | 0 (0.0%) | 0 (0.0%) |
| 75 Years and over | 10 (3.4%) | 23 (7.3%) |
Disability Class: Cognitive Difficulty
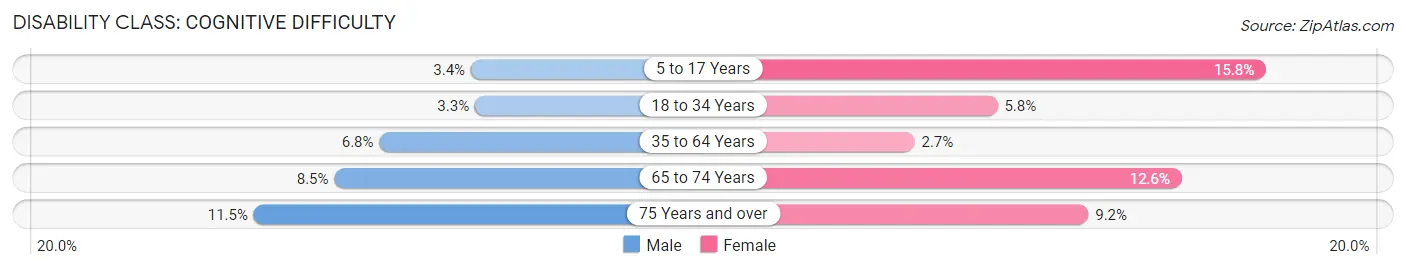
| Age Bracket | Male | Female |
| 5 to 17 Years | 48 (3.4%) | 238 (15.8%) |
| 18 to 34 Years | 62 (3.3%) | 96 (5.8%) |
| 35 to 64 Years | 190 (6.8%) | 71 (2.7%) |
| 65 to 74 Years | 21 (8.5%) | 80 (12.6%) |
| 75 Years and over | 34 (11.5%) | 29 (9.1%) |
Disability Class: Ambulatory Difficulty
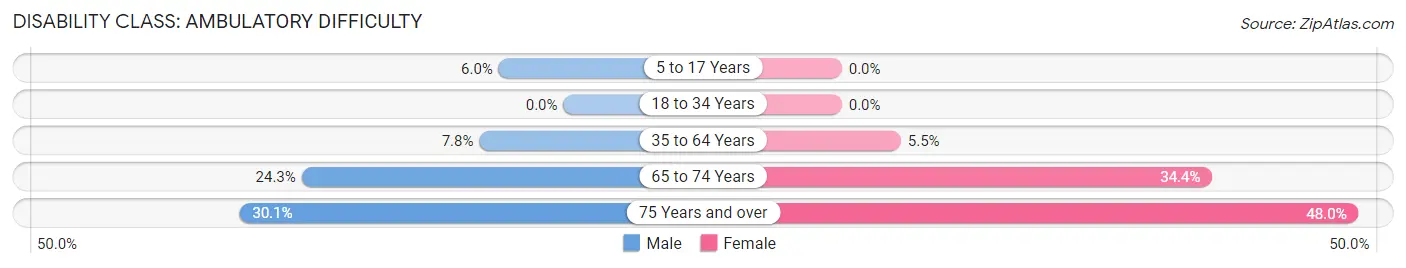
| Age Bracket | Male | Female |
| 5 to 17 Years | 84 (6.0%) | 0 (0.0%) |
| 18 to 34 Years | 0 (0.0%) | 0 (0.0%) |
| 35 to 64 Years | 217 (7.8%) | 144 (5.5%) |
| 65 to 74 Years | 60 (24.3%) | 218 (34.4%) |
| 75 Years and over | 89 (30.1%) | 152 (47.9%) |
Disability Class: Self-Care Difficulty
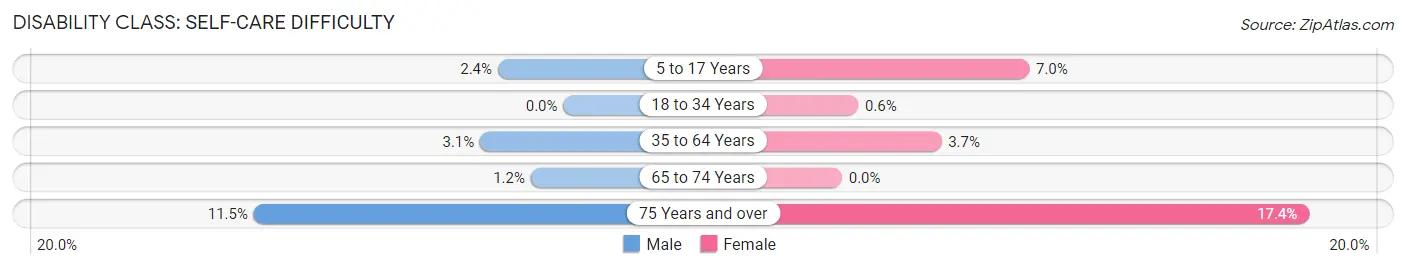
| Age Bracket | Male | Female |
| 5 to 17 Years | 34 (2.4%) | 105 (7.0%) |
| 18 to 34 Years | 0 (0.0%) | 10 (0.6%) |
| 35 to 64 Years | 86 (3.1%) | 97 (3.7%) |
| 65 to 74 Years | 3 (1.2%) | 0 (0.0%) |
| 75 Years and over | 34 (11.5%) | 55 (17.3%) |
Technology Access in Monticello
Computing Device Access in Monticello
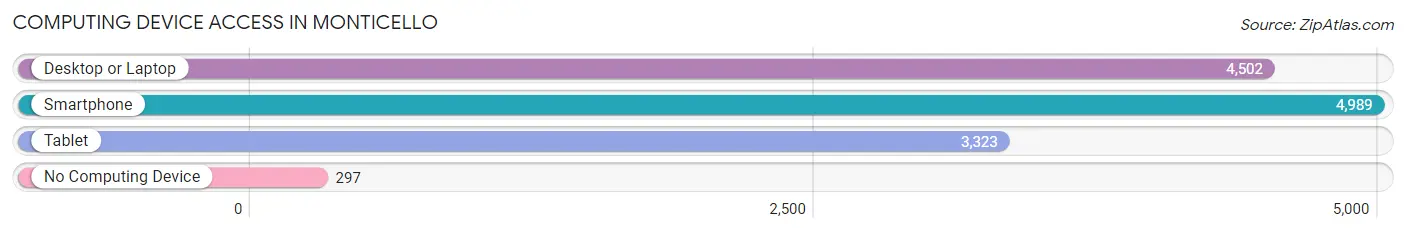
| Device Type | # Households | % Households |
| Desktop or Laptop | 4,502 | 81.1% |
| Smartphone | 4,989 | 89.9% |
| Tablet | 3,323 | 59.9% |
| No Computing Device | 297 | 5.3% |
| Total | 5,548 | 100.0% |
Internet Access in Monticello
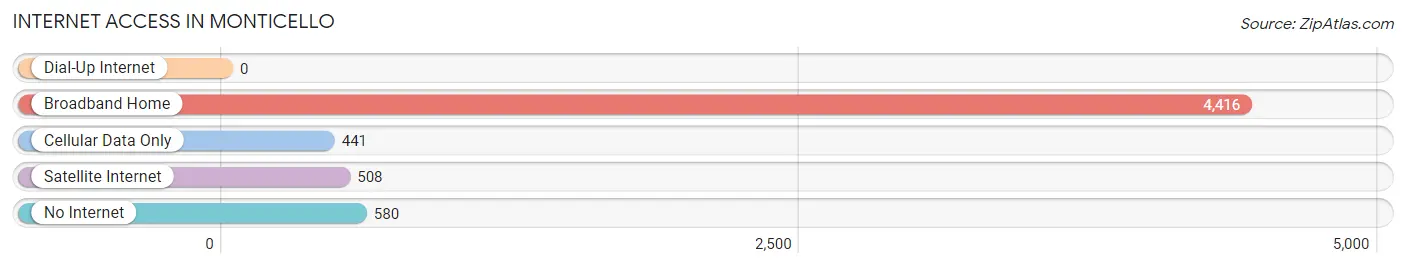
| Internet Type | # Households | % Households |
| Dial-Up Internet | 0 | 0.0% |
| Broadband Home | 4,416 | 79.6% |
| Cellular Data Only | 441 | 8.0% |
| Satellite Internet | 508 | 9.2% |
| No Internet | 580 | 10.4% |
| Total | 5,548 | 100.0% |
Monticello Summary
Monticello, Minnesota is a small city located in the central part of the state, about 40 miles northwest of Minneapolis. It is part of the Twin Cities metropolitan area and is home to a population of about 12,000 people. The city is known for its small-town charm and its proximity to the Twin Cities.
History
Monticello was founded in 1856 by a group of settlers from New York. The city was named after the nearby Monticello Township, which was named after Thomas Jefferson's estate in Virginia. The city was incorporated in 1858 and quickly grew to become a thriving community.
The city was an important stop on the Minneapolis and St. Paul Railroad, which connected the Twin Cities to the rest of the country. The railroad brought many new businesses to the city, including a flour mill, a sawmill, and a brickyard.
In the late 19th century, Monticello was a popular destination for tourists. The city was home to several resorts, including the Monticello Hotel, which was built in 1891. The hotel was a popular destination for wealthy visitors from the Twin Cities.
Geography
Monticello is located in the central part of Minnesota, about 40 miles northwest of Minneapolis. The city is situated on the banks of the Mississippi River and is surrounded by rolling hills and forests. The city is located in Wright County and is part of the Twin Cities metropolitan area.
The city has a total area of 8.3 square miles, of which 8.2 square miles is land and 0.1 square miles is water. The city is located at an elevation of 890 feet above sea level.
Economy
Monticello is a small city with a diverse economy. The city is home to several large employers, including the Monticello Nuclear Generating Plant, which is owned by Xcel Energy. The plant provides jobs for about 1,000 people.
Other major employers in the city include the Monticello School District, the Monticello Public Library, and the Monticello Medical Center. The city is also home to several small businesses, including restaurants, retail stores, and service providers.
Demographics
As of the 2010 census, the population of Monticello was 11,922. The city has a population density of 1,440 people per square mile. The median age of the population is 37.7 years, and the median household income is $60,945.
The racial makeup of the city is 87.3% White, 5.2% African American, 0.7% Native American, 1.3% Asian, 0.1% Pacific Islander, 3.2% from other races, and 2.4% from two or more races. The city is home to a large Hispanic population, with 11.3% of the population identifying as Hispanic or Latino.
Monticello is a small city with a rich history and a diverse economy. The city is home to a variety of businesses and is a popular destination for tourists. The city is also home to a diverse population, with a large Hispanic population and a median household income that is higher than the state average.
Common Questions
What is Per Capita Income in Monticello?
Per Capita income in Monticello is $33,503.
What is the Median Family Income in Monticello?
Median Family Income in Monticello is $100,481.
What is the Median Household income in Monticello?
Median Household Income in Monticello is $80,290.
What is Income or Wage Gap in Monticello?
Income or Wage Gap in Monticello is 24.9%.
Women in Monticello earn 75.1 cents for every dollar earned by a man.
What is Family Income Deficit in Monticello?
Family Income Deficit in Monticello is $14,567.
Families that are below poverty line in Monticello earn $14,567 less on average than the poverty threshold level.
What is Inequality or Gini Index in Monticello?
Inequality or Gini Index in Monticello is 0.35.
What is the Total Population of Monticello?
Total Population of Monticello is 14,447.
What is the Total Male Population of Monticello?
Total Male Population of Monticello is 7,141.
What is the Total Female Population of Monticello?
Total Female Population of Monticello is 7,306.
What is the Ratio of Males per 100 Females in Monticello?
There are 97.74 Males per 100 Females in Monticello.
What is the Ratio of Females per 100 Males in Monticello?
There are 102.31 Females per 100 Males in Monticello.
What is the Median Population Age in Monticello?
Median Population Age in Monticello is 34.1 Years.
What is the Average Family Size in Monticello
Average Family Size in Monticello is 3.3 People.
What is the Average Household Size in Monticello
Average Household Size in Monticello is 2.6 People.
How Large is the Labor Force in Monticello?
There are 8,079 People in the Labor Forcein in Monticello.
What is the Percentage of People in the Labor Force in Monticello?
73.2% of People are in the Labor Force in Monticello.
What is the Unemployment Rate in Monticello?
Unemployment Rate in Monticello is 1.8%.