Rice, MN Map & Demographics
Rice Map
Rice Overview
$34,453
PER CAPITA INCOME
$103,607
AVG FAMILY INCOME
$100,208
AVG HOUSEHOLD INCOME
14.3%
WAGE / INCOME GAP [ % ]
85.7¢/ $1
WAGE / INCOME GAP [ $ ]
0.27
INEQUALITY / GINI INDEX
1,900
TOTAL POPULATION
1,026
MALE POPULATION
874
FEMALE POPULATION
117.39
MALES / 100 FEMALES
85.19
FEMALES / 100 MALES
32.8
MEDIAN AGE
3.2
AVG FAMILY SIZE
2.9
AVG HOUSEHOLD SIZE
1,148
LABOR FORCE [ PEOPLE ]
84.2%
PERCENT IN LABOR FORCE
2.3%
UNEMPLOYMENT RATE
Rice Zip Codes
Rice Area Codes
Income in Rice
Income Overview in Rice
Per Capita Income in Rice is $34,453, while median incomes of families and households are $103,607 and $100,208 respectively.
| Characteristic | Number | Measure |
| Per Capita Income | 1,900 | $34,453 |
| Median Family Income | 535 | $103,607 |
| Mean Family Income | 535 | $106,101 |
| Median Household Income | 663 | $100,208 |
| Mean Household Income | 663 | $98,021 |
| Income Deficit | 535 | $0 |
| Wage / Income Gap (%) | 1,900 | 14.30% |
| Wage / Income Gap ($) | 1,900 | 85.70¢ per $1 |
| Gini / Inequality Index | 1,900 | 0.27 |
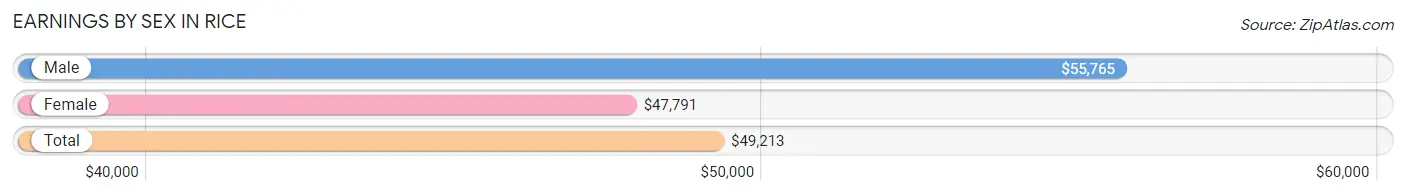
Earnings by Sex in Rice
Average Earnings in Rice are $49,213, $55,765 for men and $47,791 for women, a difference of 14.3%.
| Sex | Number | Average Earnings |
| Male | 594 (50.1%) | $55,765 |
| Female | 592 (49.9%) | $47,791 |
| Total | 1,186 (100.0%) | $49,213 |
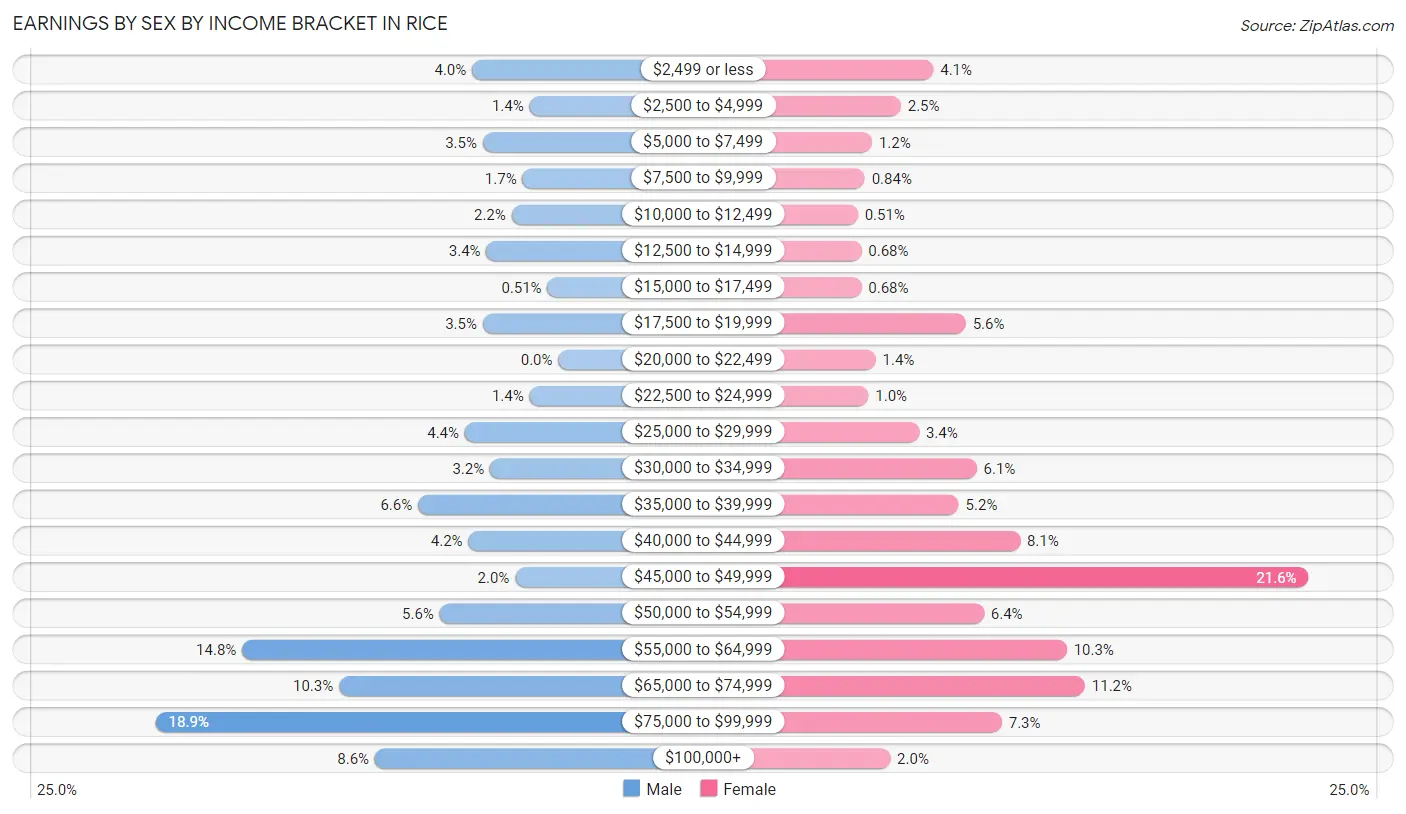
Earnings by Sex by Income Bracket in Rice
The most common earnings brackets in Rice are $75,000 to $99,999 for men (112 | 18.9%) and $45,000 to $49,999 for women (128 | 21.6%).
| Income | Male | Female |
| $2,499 or less | 24 (4.0%) | 24 (4.1%) |
| $2,500 to $4,999 | 8 (1.3%) | 15 (2.5%) |
| $5,000 to $7,499 | 21 (3.5%) | 7 (1.2%) |
| $7,500 to $9,999 | 10 (1.7%) | 5 (0.8%) |
| $10,000 to $12,499 | 13 (2.2%) | 3 (0.5%) |
| $12,500 to $14,999 | 20 (3.4%) | 4 (0.7%) |
| $15,000 to $17,499 | 3 (0.5%) | 4 (0.7%) |
| $17,500 to $19,999 | 21 (3.5%) | 33 (5.6%) |
| $20,000 to $22,499 | 0 (0.0%) | 8 (1.3%) |
| $22,500 to $24,999 | 8 (1.3%) | 6 (1.0%) |
| $25,000 to $29,999 | 26 (4.4%) | 20 (3.4%) |
| $30,000 to $34,999 | 19 (3.2%) | 36 (6.1%) |
| $35,000 to $39,999 | 39 (6.6%) | 31 (5.2%) |
| $40,000 to $44,999 | 25 (4.2%) | 48 (8.1%) |
| $45,000 to $49,999 | 12 (2.0%) | 128 (21.6%) |
| $50,000 to $54,999 | 33 (5.6%) | 38 (6.4%) |
| $55,000 to $64,999 | 88 (14.8%) | 61 (10.3%) |
| $65,000 to $74,999 | 61 (10.3%) | 66 (11.2%) |
| $75,000 to $99,999 | 112 (18.9%) | 43 (7.3%) |
| $100,000+ | 51 (8.6%) | 12 (2.0%) |
| Total | 594 (100.0%) | 592 (100.0%) |
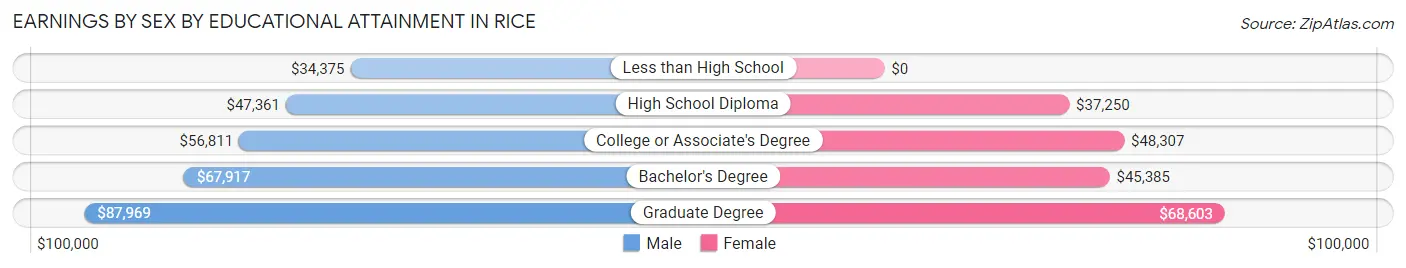
Earnings by Sex by Educational Attainment in Rice
Average earnings in Rice are $57,423 for men and $48,634 for women, a difference of 15.3%. Men with an educational attainment of graduate degree enjoy the highest average annual earnings of $87,969, while those with less than high school education earn the least with $34,375. Women with an educational attainment of graduate degree earn the most with the average annual earnings of $68,603, while those with high school diploma education have the smallest earnings of $37,250.
| Educational Attainment | Male Income | Female Income |
| Less than High School | $34,375 | $0 |
| High School Diploma | $47,361 | $37,250 |
| College or Associate's Degree | $56,811 | $48,307 |
| Bachelor's Degree | $67,917 | $45,385 |
| Graduate Degree | $87,969 | $68,603 |
| Total | $57,423 | $48,634 |
Family Income in Rice
Family Income Brackets in Rice
According to the Rice family income data, there are 227 families falling into the $100,000 to $149,999 income range, which is the most common income bracket and makes up 42.4% of all families.
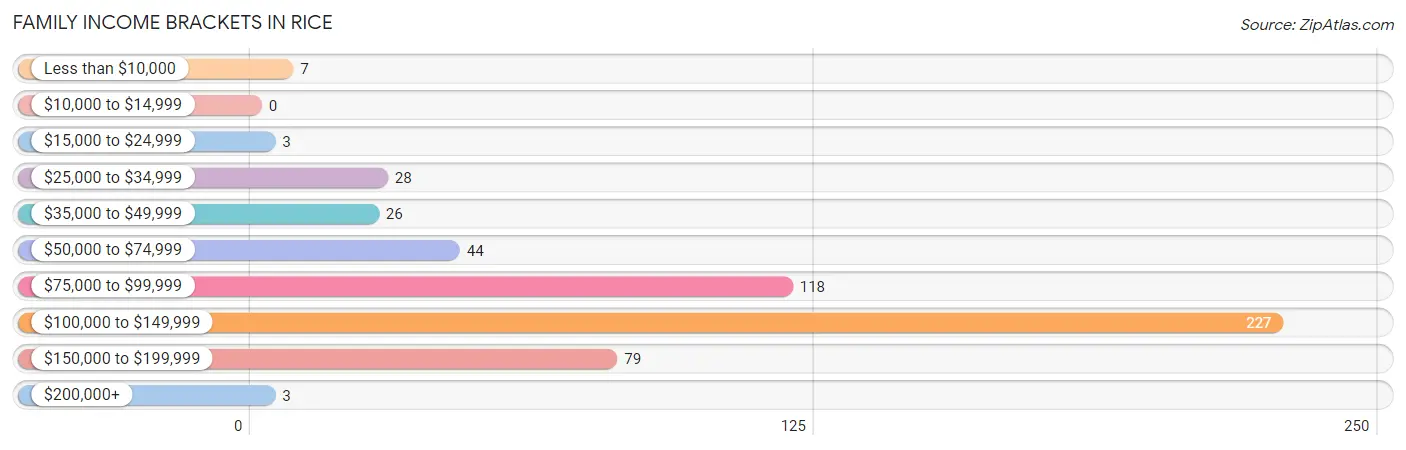
| Income Bracket | # Families | % Families |
| Less than $10,000 | 7 | 1.3% |
| $10,000 to $14,999 | 0 | 0.0% |
| $15,000 to $24,999 | 3 | 0.6% |
| $25,000 to $34,999 | 28 | 5.2% |
| $35,000 to $49,999 | 26 | 4.9% |
| $50,000 to $74,999 | 44 | 8.2% |
| $75,000 to $99,999 | 118 | 22.1% |
| $100,000 to $149,999 | 227 | 42.4% |
| $150,000 to $199,999 | 79 | 14.8% |
| $200,000+ | 3 | 0.6% |
Family Income by Famaliy Size in Rice
4-person families (163 | 30.5%) account for the highest median family income in Rice with $120,208 per family, while 2-person families (234 | 43.7%) have the highest median income of $47,143 per family member.
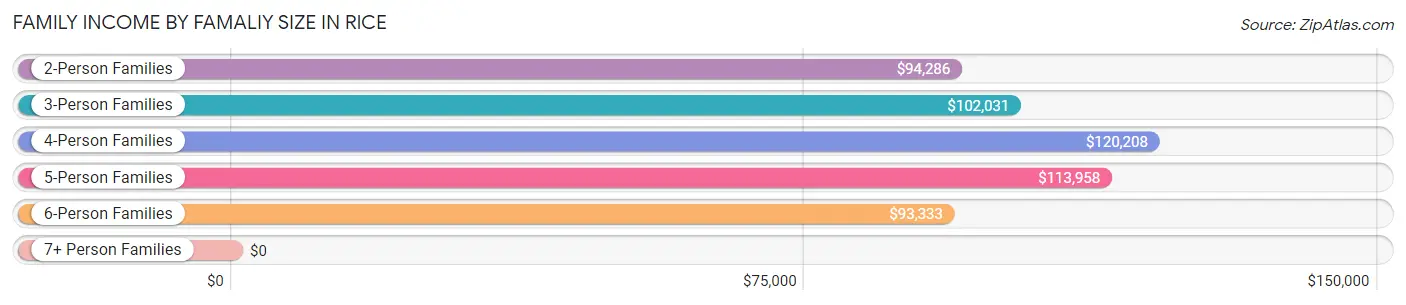
| Income Bracket | # Families | Median Income |
| 2-Person Families | 234 (43.7%) | $94,286 |
| 3-Person Families | 88 (16.5%) | $102,031 |
| 4-Person Families | 163 (30.5%) | $120,208 |
| 5-Person Families | 37 (6.9%) | $113,958 |
| 6-Person Families | 10 (1.9%) | $93,333 |
| 7+ Person Families | 3 (0.6%) | $0 |
| Total | 535 (100.0%) | $103,607 |
Family Income by Number of Earners in Rice
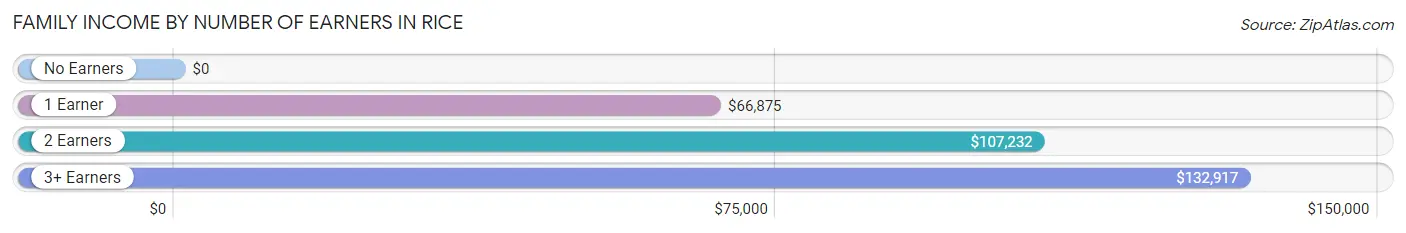
| Number of Earners | # Families | Median Income |
| No Earners | 30 (5.6%) | $0 |
| 1 Earner | 61 (11.4%) | $66,875 |
| 2 Earners | 397 (74.2%) | $107,232 |
| 3+ Earners | 47 (8.8%) | $132,917 |
| Total | 535 (100.0%) | $103,607 |
Household Income in Rice
Household Income Brackets in Rice
With 243 households falling in the category, the $100,000 to $149,999 income range is the most frequent in Rice, accounting for 36.6% of all households. In contrast, only 3 households (0.4%) fall into the $200,000+ income bracket, making it the least populous group.
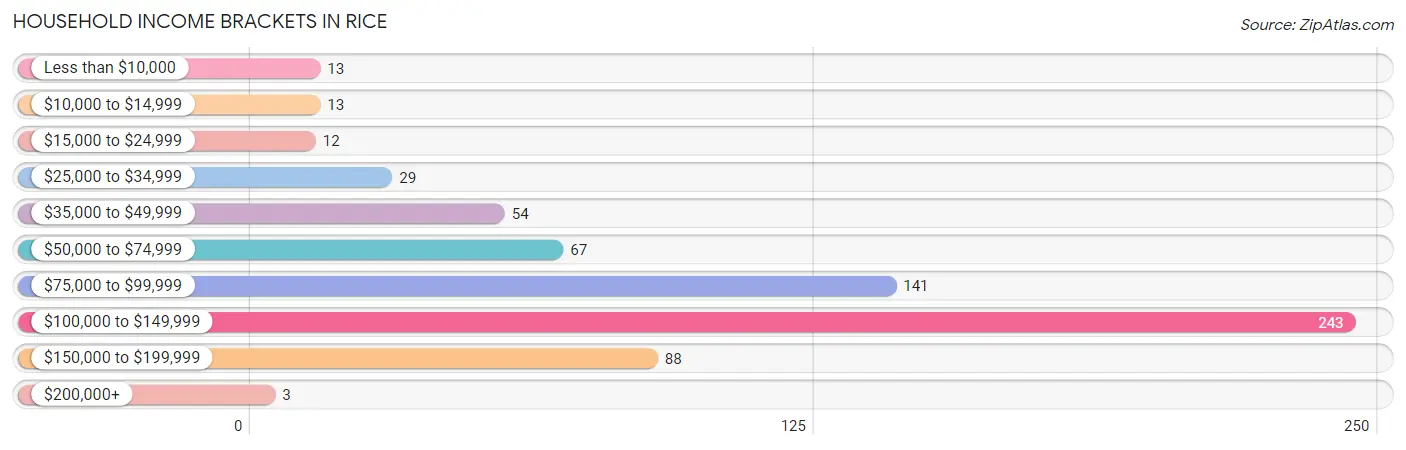
| Income Bracket | # Households | % Households |
| Less than $10,000 | 13 | 2.0% |
| $10,000 to $14,999 | 13 | 2.0% |
| $15,000 to $24,999 | 12 | 1.8% |
| $25,000 to $34,999 | 29 | 4.4% |
| $35,000 to $49,999 | 54 | 8.1% |
| $50,000 to $74,999 | 67 | 10.1% |
| $75,000 to $99,999 | 141 | 21.3% |
| $100,000 to $149,999 | 243 | 36.7% |
| $150,000 to $199,999 | 88 | 13.3% |
| $200,000+ | 3 | 0.5% |
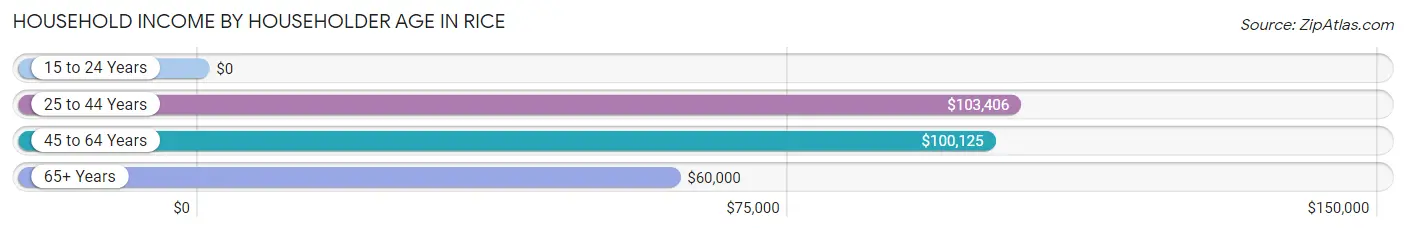
Household Income by Householder Age in Rice
The median household income in Rice is $100,208, with the highest median household income of $103,406 found in the 25 to 44 years age bracket for the primary householder. A total of 405 households (61.1%) fall into this category. Meanwhile, the 15 to 24 years age bracket for the primary householder has the lowest median household income of $0, with 9 households (1.4%) in this group.
| Income Bracket | # Households | Median Income |
| 15 to 24 Years | 9 (1.4%) | $0 |
| 25 to 44 Years | 405 (61.1%) | $103,406 |
| 45 to 64 Years | 169 (25.5%) | $100,125 |
| 65+ Years | 80 (12.1%) | $60,000 |
| Total | 663 (100.0%) | $100,208 |
Poverty in Rice
Income Below Poverty by Sex and Age in Rice
With 2.2% poverty level for males and 4.0% for females among the residents of Rice, 5 year old males and 75 year old and over females are the most vulnerable to poverty, with 3 males (15.8%) and 16 females (57.1%) in their respective age groups living below the poverty level.
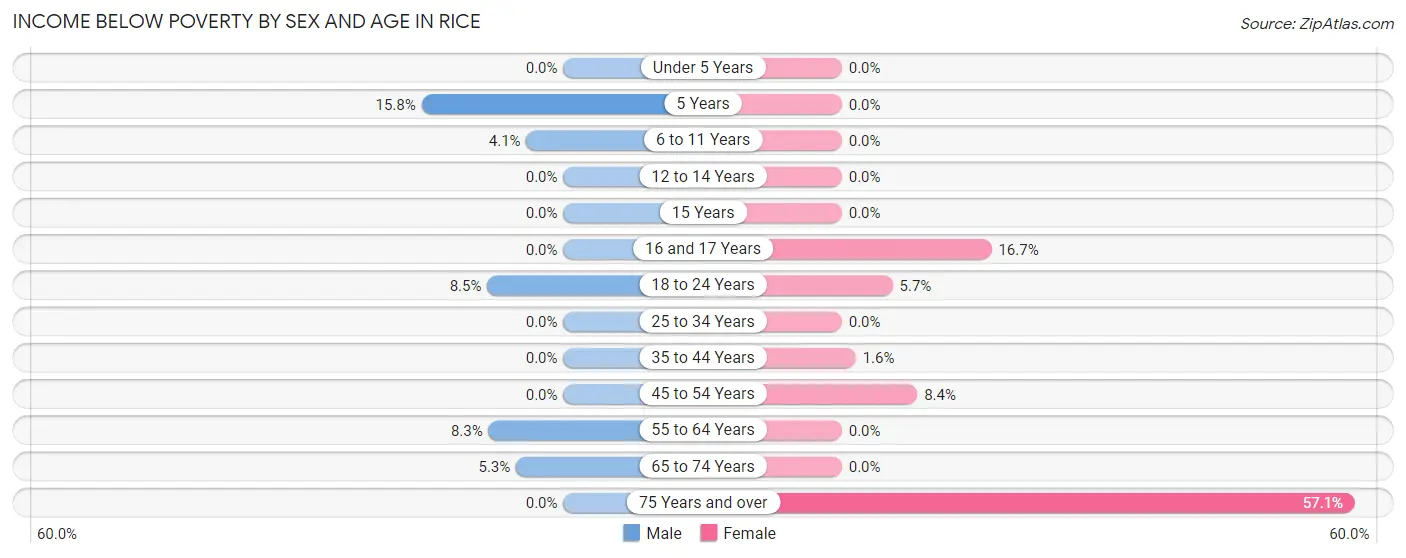
| Age Bracket | Male | Female |
| Under 5 Years | 0 (0.0%) | 0 (0.0%) |
| 5 Years | 3 (15.8%) | 0 (0.0%) |
| 6 to 11 Years | 6 (4.1%) | 0 (0.0%) |
| 12 to 14 Years | 0 (0.0%) | 0 (0.0%) |
| 15 Years | 0 (0.0%) | 0 (0.0%) |
| 16 and 17 Years | 0 (0.0%) | 2 (16.7%) |
| 18 to 24 Years | 5 (8.5%) | 3 (5.7%) |
| 25 to 34 Years | 0 (0.0%) | 0 (0.0%) |
| 35 to 44 Years | 0 (0.0%) | 3 (1.5%) |
| 45 to 54 Years | 0 (0.0%) | 11 (8.4%) |
| 55 to 64 Years | 6 (8.3%) | 0 (0.0%) |
| 65 to 74 Years | 3 (5.3%) | 0 (0.0%) |
| 75 Years and over | 0 (0.0%) | 16 (57.1%) |
| Total | 23 (2.2%) | 35 (4.0%) |
Income Above Poverty by Sex and Age in Rice
According to the poverty statistics in Rice, males aged under 5 years and females aged under 5 years are the age groups that are most secure financially, with 100.0% of males and 100.0% of females in these age groups living above the poverty line.
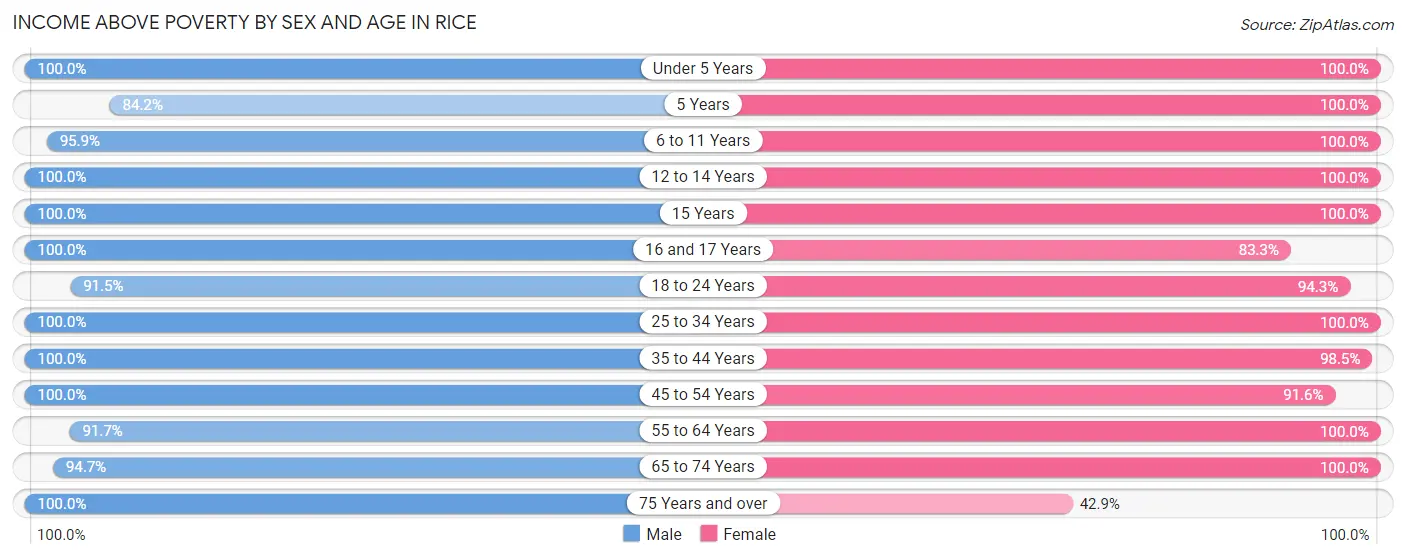
| Age Bracket | Male | Female |
| Under 5 Years | 118 (100.0%) | 49 (100.0%) |
| 5 Years | 16 (84.2%) | 13 (100.0%) |
| 6 to 11 Years | 140 (95.9%) | 93 (100.0%) |
| 12 to 14 Years | 57 (100.0%) | 22 (100.0%) |
| 15 Years | 4 (100.0%) | 10 (100.0%) |
| 16 and 17 Years | 29 (100.0%) | 10 (83.3%) |
| 18 to 24 Years | 54 (91.5%) | 50 (94.3%) |
| 25 to 34 Years | 148 (100.0%) | 166 (100.0%) |
| 35 to 44 Years | 247 (100.0%) | 190 (98.5%) |
| 45 to 54 Years | 59 (100.0%) | 120 (91.6%) |
| 55 to 64 Years | 66 (91.7%) | 68 (100.0%) |
| 65 to 74 Years | 54 (94.7%) | 36 (100.0%) |
| 75 Years and over | 6 (100.0%) | 12 (42.9%) |
| Total | 998 (97.8%) | 839 (96.0%) |
Income Below Poverty Among Married-Couple Families in Rice
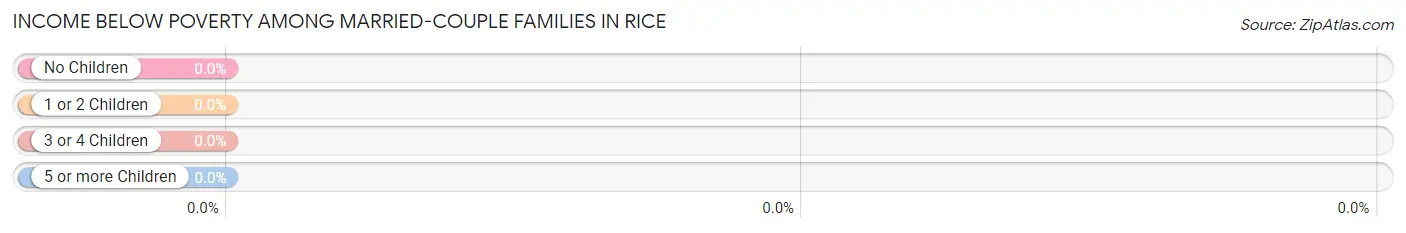
| Children | Above Poverty | Below Poverty |
| No Children | 200 (100.0%) | 0 (0.0%) |
| 1 or 2 Children | 224 (100.0%) | 0 (0.0%) |
| 3 or 4 Children | 42 (100.0%) | 0 (0.0%) |
| 5 or more Children | 3 (100.0%) | 0 (0.0%) |
| Total | 469 (100.0%) | 0 (0.0%) |
Income Below Poverty Among Single-Parent Households in Rice
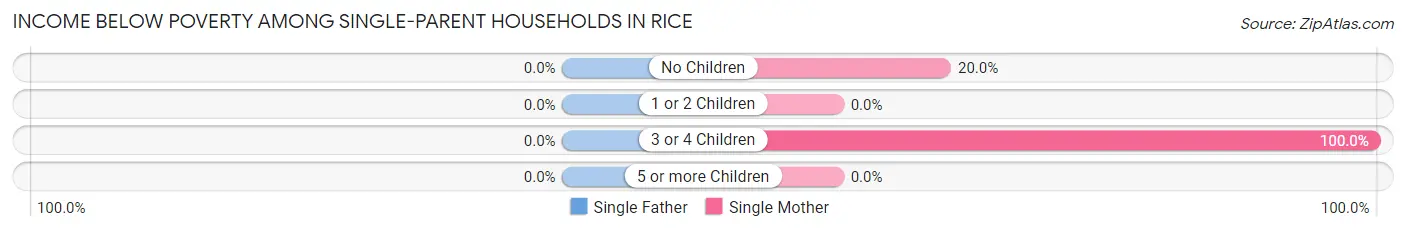
| Children | Single Father | Single Mother |
| No Children | 0 (0.0%) | 4 (20.0%) |
| 1 or 2 Children | 0 (0.0%) | 0 (0.0%) |
| 3 or 4 Children | 0 (0.0%) | 3 (100.0%) |
| 5 or more Children | 0 (0.0%) | 0 (0.0%) |
| Total | 0 (0.0%) | 7 (15.2%) |
Income Below Poverty Among Married-Couple vs Single-Parent Households in Rice
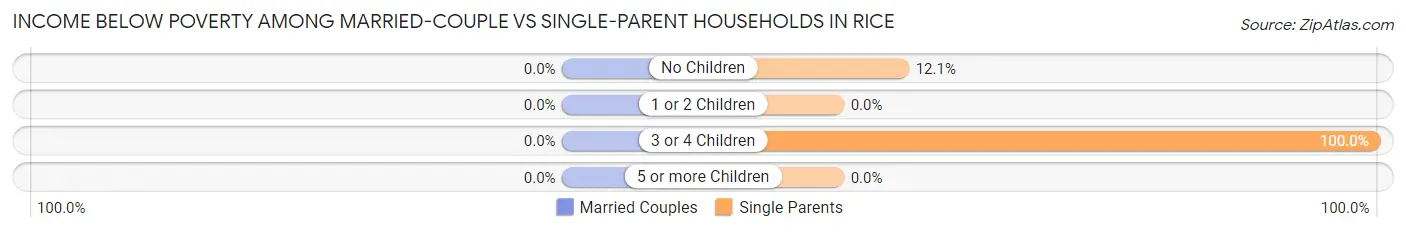
| Children | Married-Couple Families | Single-Parent Households |
| No Children | 0 (0.0%) | 4 (12.1%) |
| 1 or 2 Children | 0 (0.0%) | 0 (0.0%) |
| 3 or 4 Children | 0 (0.0%) | 3 (100.0%) |
| 5 or more Children | 0 (0.0%) | 0 (0.0%) |
| Total | 0 (0.0%) | 7 (10.6%) |
Race in Rice
The most populous races in Rice are White / Caucasian (1,817 | 95.6%), Two or more Races (44 | 2.3%), and Black / African American (39 | 2.1%).
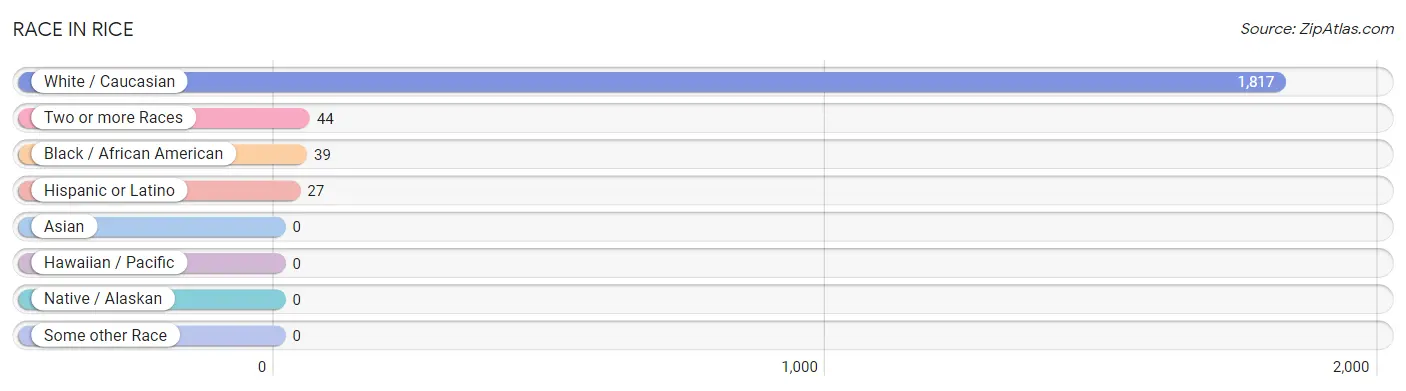
| Race | # Population | % Population |
| Asian | 0 | 0.0% |
| Black / African American | 39 | 2.1% |
| Hawaiian / Pacific | 0 | 0.0% |
| Hispanic or Latino | 27 | 1.4% |
| Native / Alaskan | 0 | 0.0% |
| White / Caucasian | 1,817 | 95.6% |
| Two or more Races | 44 | 2.3% |
| Some other Race | 0 | 0.0% |
| Total | 1,900 | 100.0% |
Ancestry in Rice
The most populous ancestries reported in Rice are German (937 | 49.3%), Polish (264 | 13.9%), Irish (196 | 10.3%), Norwegian (177 | 9.3%), and American (90 | 4.7%), together accounting for 87.6% of all Rice residents.
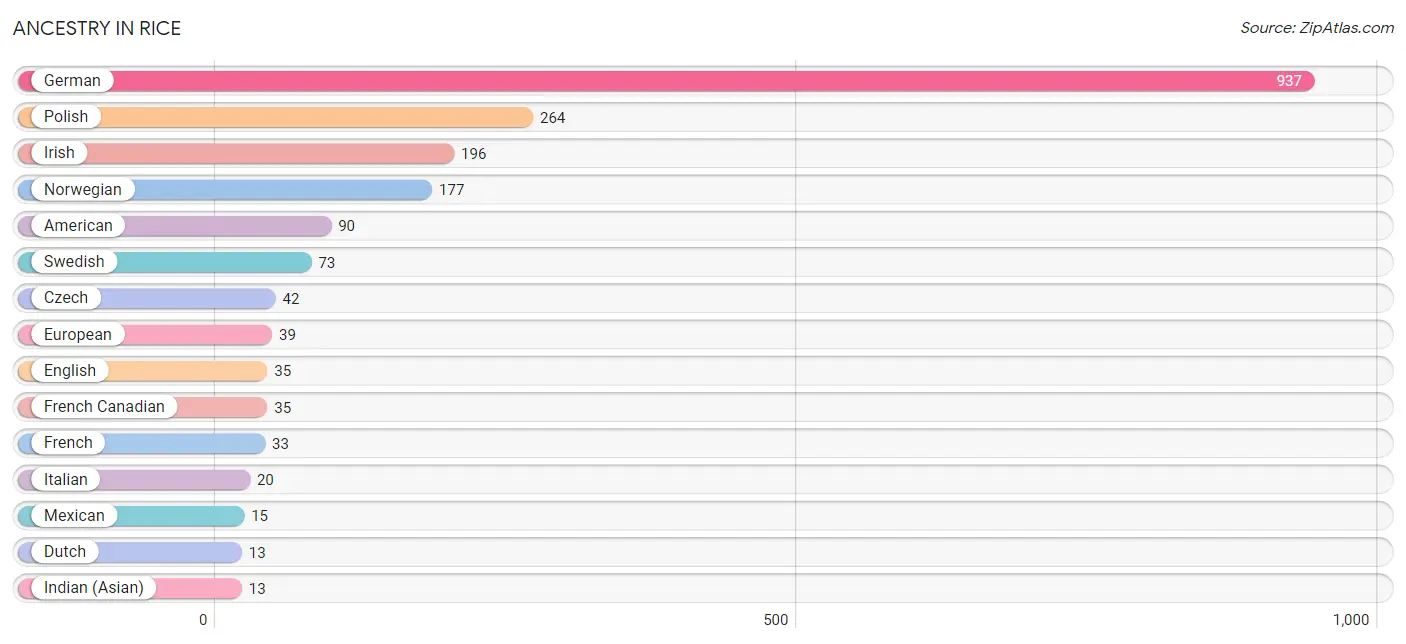
| Ancestry | # Population | % Population |
| American | 90 | 4.7% |
| Austrian | 2 | 0.1% |
| Belgian | 12 | 0.6% |
| Bhutanese | 4 | 0.2% |
| British | 2 | 0.1% |
| Central American | 12 | 0.6% |
| Chippewa | 2 | 0.1% |
| Czech | 42 | 2.2% |
| Dutch | 13 | 0.7% |
| English | 35 | 1.8% |
| European | 39 | 2.1% |
| Finnish | 3 | 0.2% |
| French | 33 | 1.7% |
| French Canadian | 35 | 1.8% |
| German | 937 | 49.3% |
| Indian (Asian) | 13 | 0.7% |
| Irish | 196 | 10.3% |
| Italian | 20 | 1.1% |
| Mexican | 15 | 0.8% |
| Nicaraguan | 12 | 0.6% |
| Northern European | 8 | 0.4% |
| Norwegian | 177 | 9.3% |
| Polish | 264 | 13.9% |
| Scandinavian | 3 | 0.2% |
| Scottish | 8 | 0.4% |
| Slovene | 7 | 0.4% |
| Swedish | 73 | 3.8% |
| Welsh | 1 | 0.1% | View All 28 Rows |
Immigrants in Rice
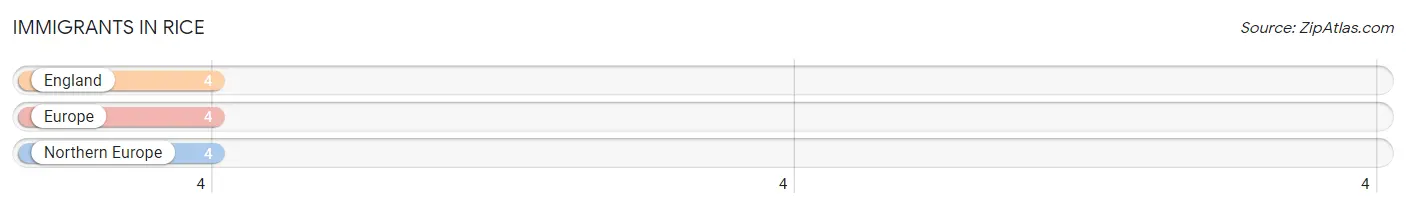
The most numerous immigrant groups reported in Rice came from England (4 | 0.2%), Europe (4 | 0.2%), and Northern Europe (4 | 0.2%), together accounting for 0.6% of all Rice residents.
| Immigration Origin | # Population | % Population |
| England | 4 | 0.2% |
| Europe | 4 | 0.2% |
| Northern Europe | 4 | 0.2% | View All 3 Rows |
Sex and Age in Rice
Sex and Age in Rice
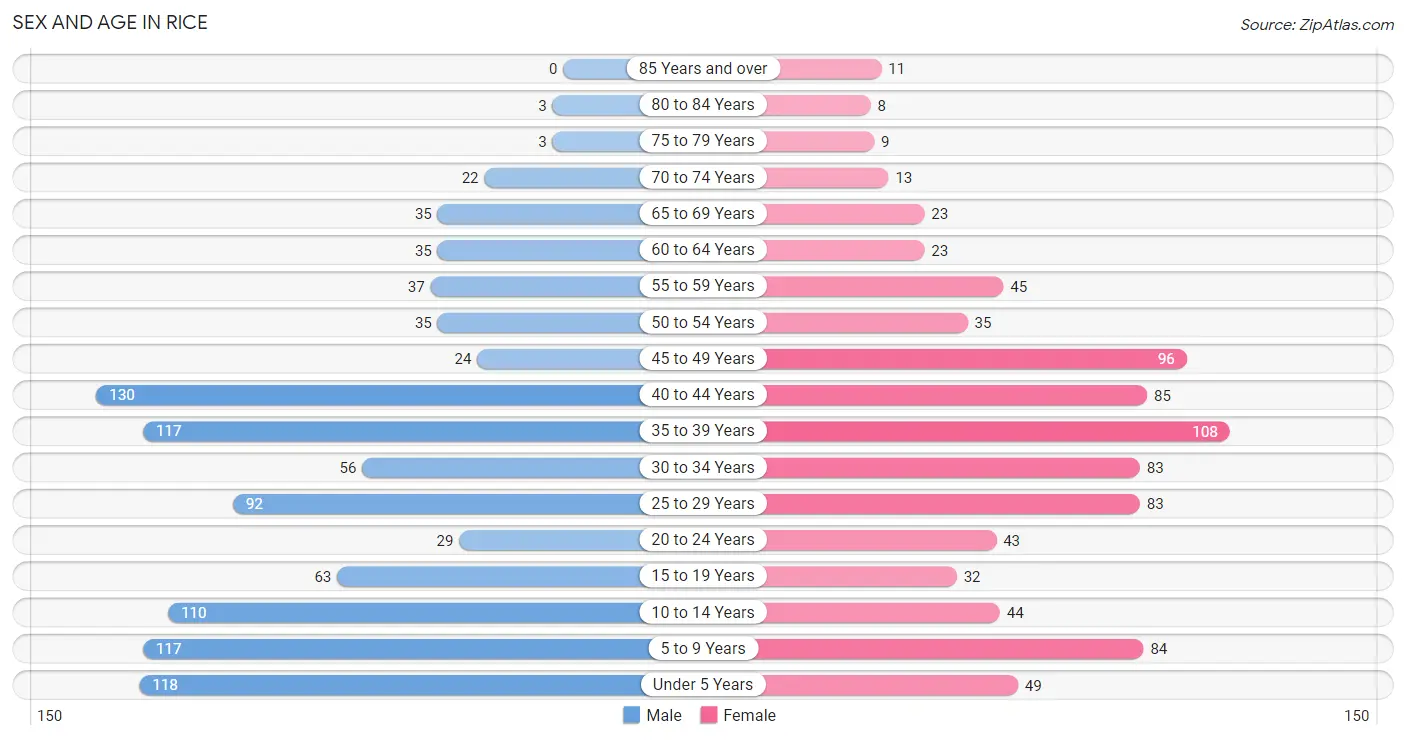
The most populous age groups in Rice are 40 to 44 Years (130 | 12.7%) for men and 35 to 39 Years (108 | 12.4%) for women.
| Age Bracket | Male | Female |
| Under 5 Years | 118 (11.5%) | 49 (5.6%) |
| 5 to 9 Years | 117 (11.4%) | 84 (9.6%) |
| 10 to 14 Years | 110 (10.7%) | 44 (5.0%) |
| 15 to 19 Years | 63 (6.1%) | 32 (3.7%) |
| 20 to 24 Years | 29 (2.8%) | 43 (4.9%) |
| 25 to 29 Years | 92 (9.0%) | 83 (9.5%) |
| 30 to 34 Years | 56 (5.5%) | 83 (9.5%) |
| 35 to 39 Years | 117 (11.4%) | 108 (12.4%) |
| 40 to 44 Years | 130 (12.7%) | 85 (9.7%) |
| 45 to 49 Years | 24 (2.3%) | 96 (11.0%) |
| 50 to 54 Years | 35 (3.4%) | 35 (4.0%) |
| 55 to 59 Years | 37 (3.6%) | 45 (5.1%) |
| 60 to 64 Years | 35 (3.4%) | 23 (2.6%) |
| 65 to 69 Years | 35 (3.4%) | 23 (2.6%) |
| 70 to 74 Years | 22 (2.1%) | 13 (1.5%) |
| 75 to 79 Years | 3 (0.3%) | 9 (1.0%) |
| 80 to 84 Years | 3 (0.3%) | 8 (0.9%) |
| 85 Years and over | 0 (0.0%) | 11 (1.3%) |
| Total | 1,026 (100.0%) | 874 (100.0%) |
Families and Households in Rice
Median Family Size in Rice
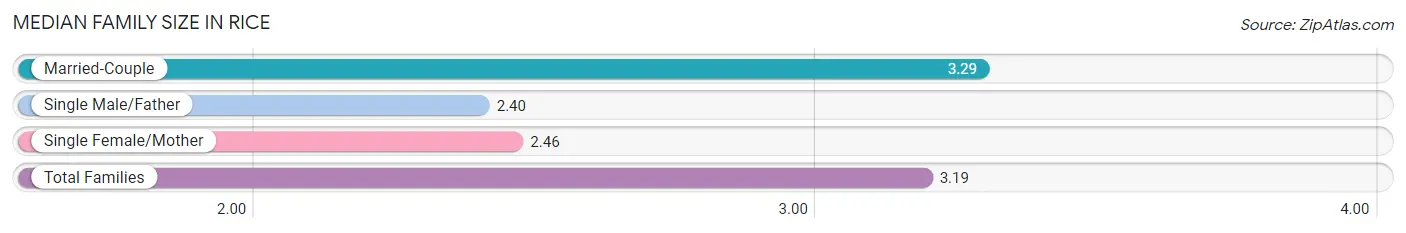
The median family size in Rice is 3.19 persons per family, with married-couple families (469 | 87.7%) accounting for the largest median family size of 3.29 persons per family. On the other hand, single male/father families (20 | 3.7%) represent the smallest median family size with 2.40 persons per family.
| Family Type | # Families | Family Size |
| Married-Couple | 469 (87.7%) | 3.29 |
| Single Male/Father | 20 (3.7%) | 2.40 |
| Single Female/Mother | 46 (8.6%) | 2.46 |
| Total Families | 535 (100.0%) | 3.19 |
Median Household Size in Rice
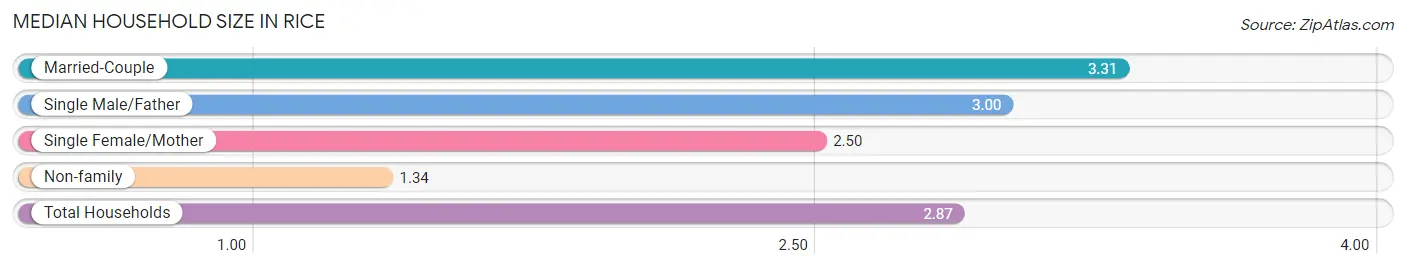
The median household size in Rice is 2.87 persons per household, with married-couple households (469 | 70.7%) accounting for the largest median household size of 3.31 persons per household. non-family households (128 | 19.3%) represent the smallest median household size with 1.34 persons per household.
| Household Type | # Households | Household Size |
| Married-Couple | 469 (70.7%) | 3.31 |
| Single Male/Father | 20 (3.0%) | 3.00 |
| Single Female/Mother | 46 (6.9%) | 2.50 |
| Non-family | 128 (19.3%) | 1.34 |
| Total Households | 663 (100.0%) | 2.87 |
Household Size by Marriage Status in Rice
Out of a total of 663 households in Rice, 535 (80.7%) are family households, while 128 (19.3%) are nonfamily households. The most numerous type of family households are 2-person households, comprising 220, and the most common type of nonfamily households are 1-person households, comprising 93.
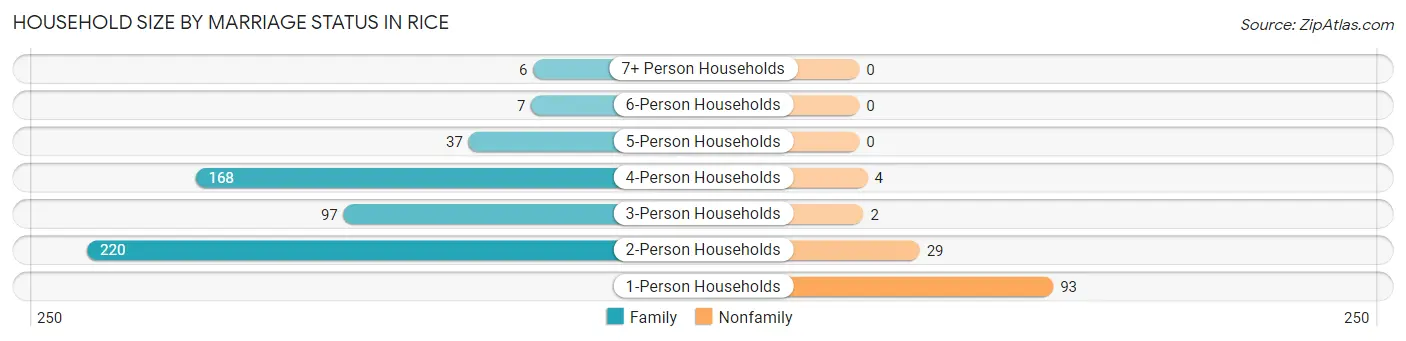
| Household Size | Family Households | Nonfamily Households |
| 1-Person Households | - | 93 (14.0%) |
| 2-Person Households | 220 (33.2%) | 29 (4.4%) |
| 3-Person Households | 97 (14.6%) | 2 (0.3%) |
| 4-Person Households | 168 (25.3%) | 4 (0.6%) |
| 5-Person Households | 37 (5.6%) | 0 (0.0%) |
| 6-Person Households | 7 (1.1%) | 0 (0.0%) |
| 7+ Person Households | 6 (0.9%) | 0 (0.0%) |
| Total | 535 (80.7%) | 128 (19.3%) |
Female Fertility in Rice
Fertility by Age in Rice
Average fertility rate in Rice is 79.0 births per 1,000 women. Women in the age bracket of 20 to 34 years have the highest fertility rate with 153.0 births per 1,000 women. Women in the age bracket of 20 to 34 years acount for 74.4% of all women with births.
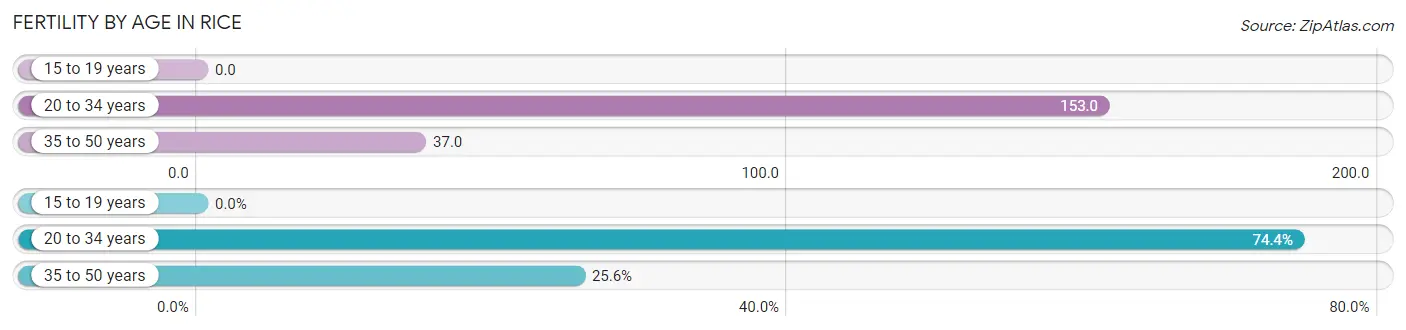
| Age Bracket | Women with Births | Births / 1,000 Women |
| 15 to 19 years | 0 (0.0%) | 0.0 |
| 20 to 34 years | 32 (74.4%) | 153.0 |
| 35 to 50 years | 11 (25.6%) | 37.0 |
| Total | 43 (100.0%) | 79.0 |
Fertility by Age by Marriage Status in Rice
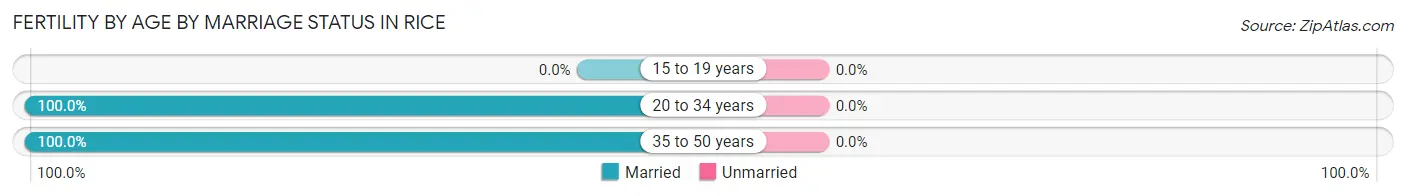
| Age Bracket | Married | Unmarried |
| 15 to 19 years | 0 (0.0%) | 0 (0.0%) |
| 20 to 34 years | 32 (100.0%) | 0 (0.0%) |
| 35 to 50 years | 11 (100.0%) | 0 (0.0%) |
| Total | 43 (100.0%) | 0 (0.0%) |
Fertility by Education in Rice
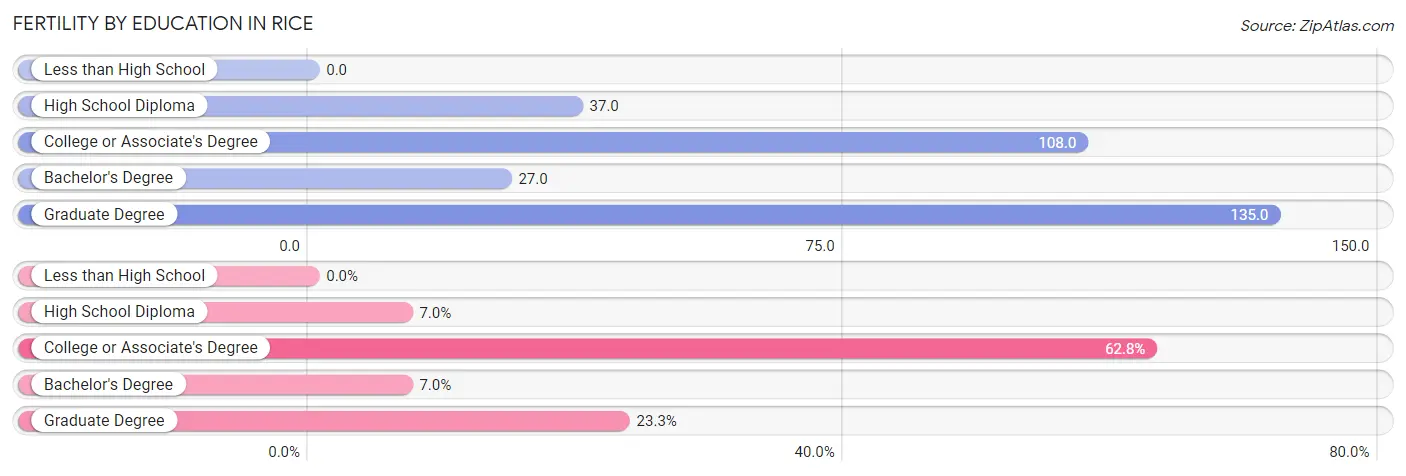
| Educational Attainment | Women with Births | Births / 1,000 Women |
| Less than High School | 0 (0.0%) | 0.0 |
| High School Diploma | 3 (7.0%) | 37.0 |
| College or Associate's Degree | 27 (62.8%) | 108.0 |
| Bachelor's Degree | 3 (7.0%) | 27.0 |
| Graduate Degree | 10 (23.3%) | 135.0 |
| Total | 43 (100.0%) | 79.0 |
Fertility by Education by Marriage Status in Rice
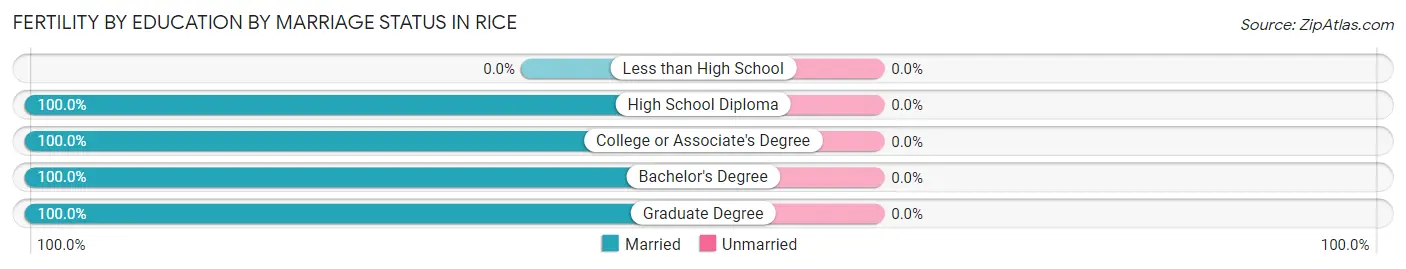
| Educational Attainment | Married | Unmarried |
| Less than High School | 0 (0.0%) | 0 (0.0%) |
| High School Diploma | 3 (100.0%) | 0 (0.0%) |
| College or Associate's Degree | 27 (100.0%) | 0 (0.0%) |
| Bachelor's Degree | 3 (100.0%) | 0 (0.0%) |
| Graduate Degree | 10 (100.0%) | 0 (0.0%) |
| Total | 43 (100.0%) | 0 (0.0%) |
Employment Characteristics in Rice
Employment by Class of Employer in Rice
Among the 1,114 employed individuals in Rice, private company employees (713 | 64.0%), not-for-profit organizations (146 | 13.1%), and local government employees (130 | 11.7%) make up the most common classes of employment.
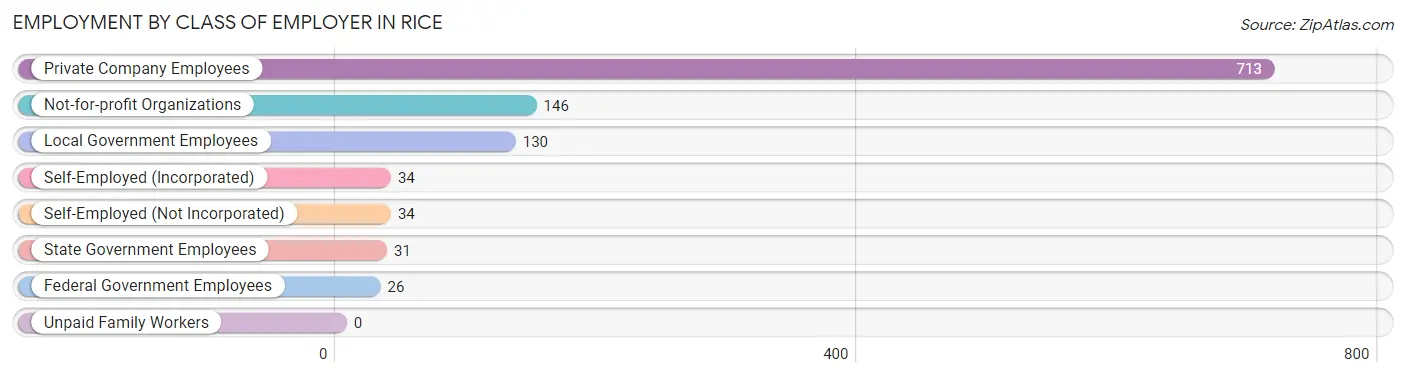
| Employer Class | # Employees | % Employees |
| Private Company Employees | 713 | 64.0% |
| Self-Employed (Incorporated) | 34 | 3.0% |
| Self-Employed (Not Incorporated) | 34 | 3.0% |
| Not-for-profit Organizations | 146 | 13.1% |
| Local Government Employees | 130 | 11.7% |
| State Government Employees | 31 | 2.8% |
| Federal Government Employees | 26 | 2.3% |
| Unpaid Family Workers | 0 | 0.0% |
| Total | 1,114 | 100.0% |
Employment Status by Age in Rice
According to the labor force statistics for Rice, out of the total population over 16 years of age (1,364), 84.2% or 1,148 individuals are in the labor force, with 2.3% or 26 of them unemployed. The age group with the highest labor force participation rate is 30 to 34 years, with 97.8% or 136 individuals in the labor force. Within the labor force, the 60 to 64 years age range has the highest percentage of unemployed individuals, with 18.5% or 10 of them being unemployed.
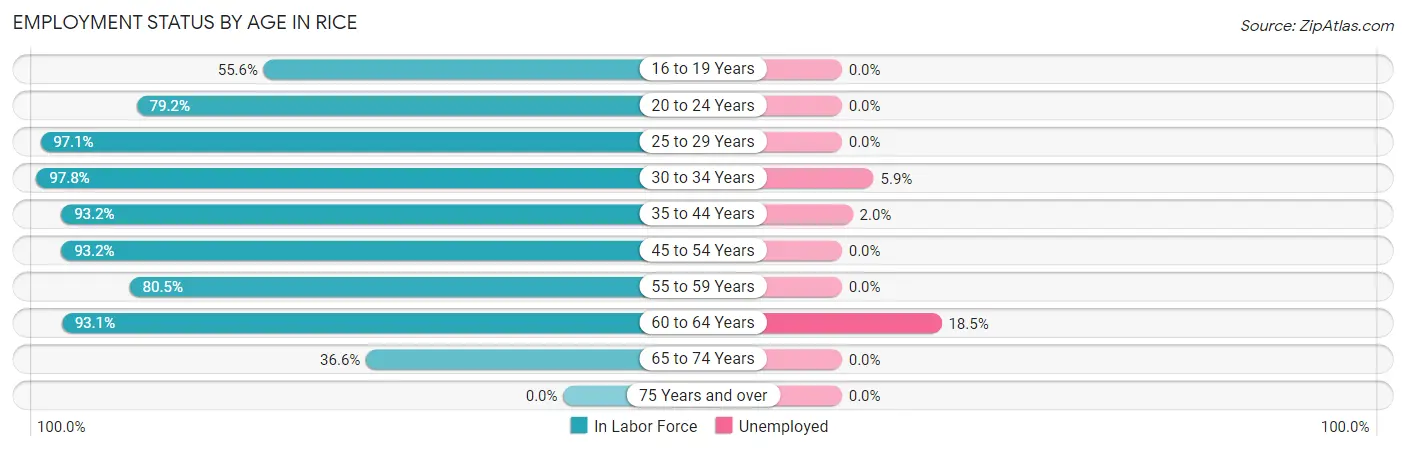
| Age Bracket | In Labor Force | Unemployed |
| 16 to 19 Years | 45 (55.6%) | 0 (0.0%) |
| 20 to 24 Years | 57 (79.2%) | 0 (0.0%) |
| 25 to 29 Years | 170 (97.1%) | 0 (0.0%) |
| 30 to 34 Years | 136 (97.8%) | 8 (5.9%) |
| 35 to 44 Years | 410 (93.2%) | 8 (2.0%) |
| 45 to 54 Years | 177 (93.2%) | 0 (0.0%) |
| 55 to 59 Years | 66 (80.5%) | 0 (0.0%) |
| 60 to 64 Years | 54 (93.1%) | 10 (18.5%) |
| 65 to 74 Years | 34 (36.6%) | 0 (0.0%) |
| 75 Years and over | 0 (0.0%) | 0 (0.0%) |
| Total | 1,148 (84.2%) | 26 (2.3%) |
Employment Status by Educational Attainment in Rice
According to labor force statistics for Rice, 93.5% of individuals (1,014) out of the total population between 25 and 64 years of age (1,084) are in the labor force, with 2.6% or 26 of them being unemployed. The group with the highest labor force participation rate are those with the educational attainment of bachelor's degree or higher, with 98.8% or 334 individuals in the labor force. Within the labor force, individuals with less than high school education have the highest percentage of unemployment, with 40.0% or 10 of them being unemployed.
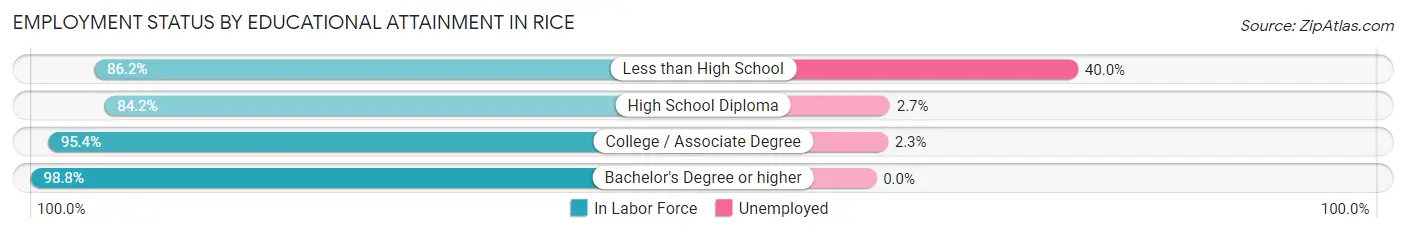
| Educational Attainment | In Labor Force | Unemployed |
| Less than High School | 25 (86.2%) | 12 (40.0%) |
| High School Diploma | 223 (84.2%) | 7 (2.7%) |
| College / Associate Degree | 431 (95.4%) | 10 (2.3%) |
| Bachelor's Degree or higher | 334 (98.8%) | 0 (0.0%) |
| Total | 1,014 (93.5%) | 28 (2.6%) |
Employment Occupations by Sex in Rice
Management, Business, Science and Arts Occupations
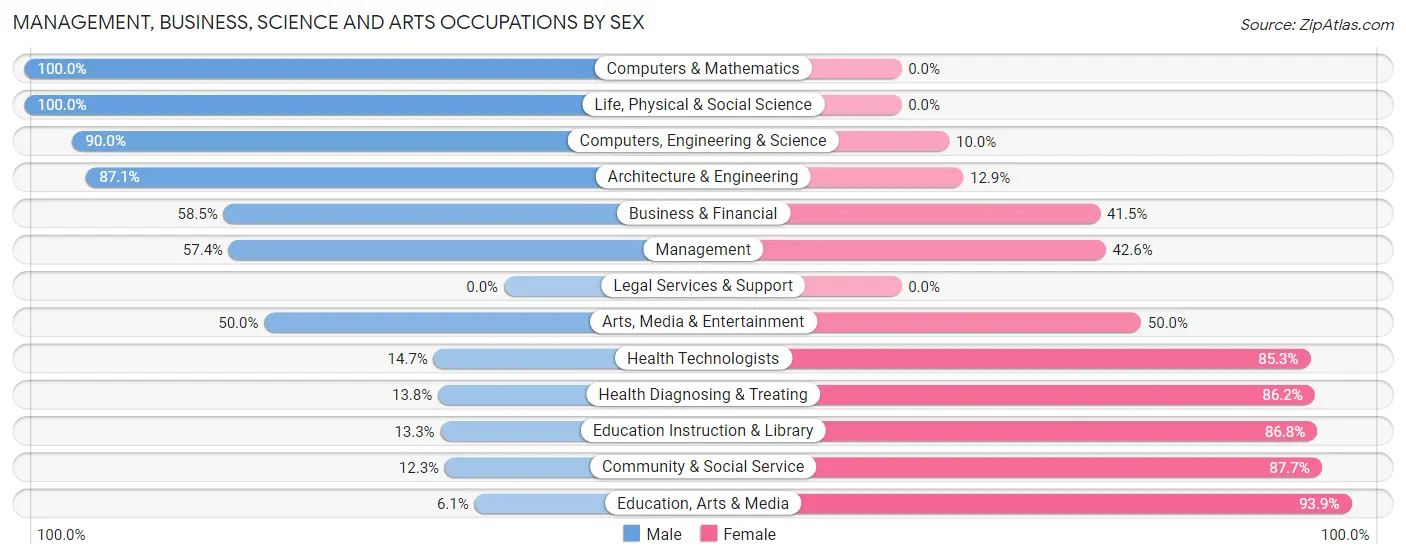
The most common Management, Business, Science and Arts occupations in Rice are Community & Social Service (138 | 12.3%), Health Diagnosing & Treating (109 | 9.7%), Education Instruction & Library (83 | 7.4%), Health Technologists (75 | 6.7%), and Management (61 | 5.4%).

Management, Business, Science and Arts Occupations by Sex
Within the Management, Business, Science and Arts occupations in Rice, the most male-oriented occupations are Computers & Mathematics (100.0%), Life, Physical & Social Science (100.0%), and Computers, Engineering & Science (90.0%), while the most female-oriented occupations are Education, Arts & Media (93.9%), Community & Social Service (87.7%), and Education Instruction & Library (86.8%).
| Occupation | Male | Female |
| Management | 35 (57.4%) | 26 (42.6%) |
| Business & Financial | 31 (58.5%) | 22 (41.5%) |
| Computers, Engineering & Science | 36 (90.0%) | 4 (10.0%) |
| Computers & Mathematics | 5 (100.0%) | 0 (0.0%) |
| Architecture & Engineering | 27 (87.1%) | 4 (12.9%) |
| Life, Physical & Social Science | 4 (100.0%) | 0 (0.0%) |
| Community & Social Service | 17 (12.3%) | 121 (87.7%) |
| Education, Arts & Media | 3 (6.1%) | 46 (93.9%) |
| Legal Services & Support | 0 (0.0%) | 0 (0.0%) |
| Education Instruction & Library | 11 (13.3%) | 72 (86.8%) |
| Arts, Media & Entertainment | 3 (50.0%) | 3 (50.0%) |
| Health Diagnosing & Treating | 15 (13.8%) | 94 (86.2%) |
| Health Technologists | 11 (14.7%) | 64 (85.3%) |
| Total (Category) | 134 (33.4%) | 267 (66.6%) |
| Total (Overall) | 564 (50.2%) | 559 (49.8%) |
Services Occupations
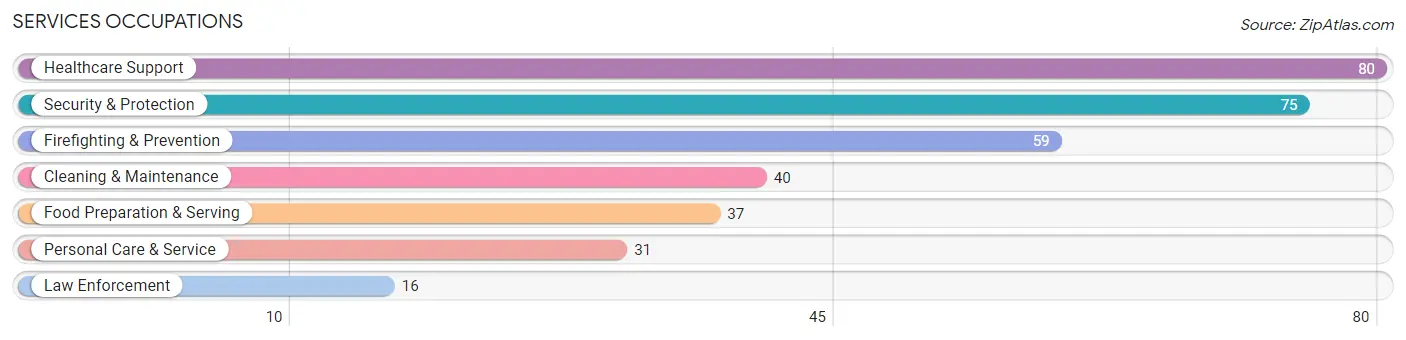
The most common Services occupations in Rice are Healthcare Support (80 | 7.1%), Security & Protection (75 | 6.7%), Firefighting & Prevention (59 | 5.2%), Cleaning & Maintenance (40 | 3.6%), and Food Preparation & Serving (37 | 3.3%).
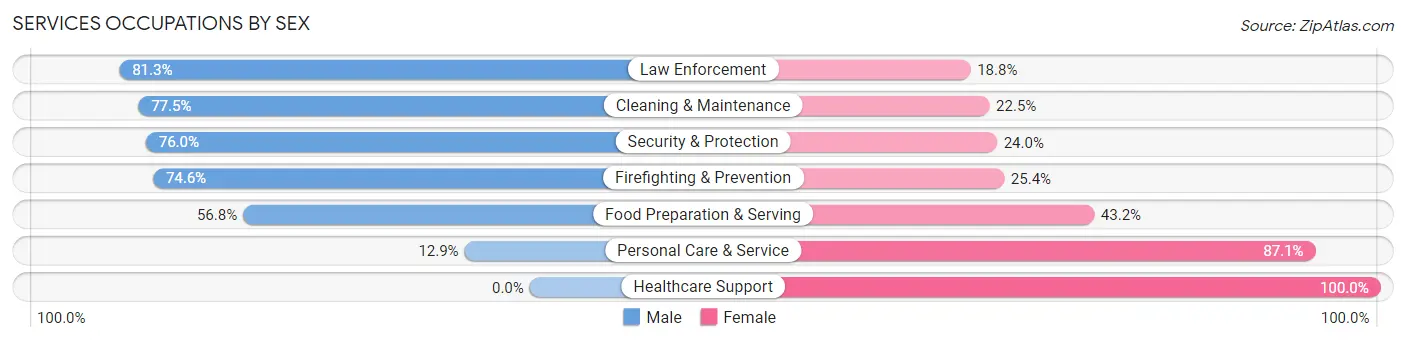
Services Occupations by Sex
Within the Services occupations in Rice, the most male-oriented occupations are Law Enforcement (81.2%), Cleaning & Maintenance (77.5%), and Security & Protection (76.0%), while the most female-oriented occupations are Healthcare Support (100.0%), Personal Care & Service (87.1%), and Food Preparation & Serving (43.2%).
| Occupation | Male | Female |
| Healthcare Support | 0 (0.0%) | 80 (100.0%) |
| Security & Protection | 57 (76.0%) | 18 (24.0%) |
| Firefighting & Prevention | 44 (74.6%) | 15 (25.4%) |
| Law Enforcement | 13 (81.2%) | 3 (18.8%) |
| Food Preparation & Serving | 21 (56.8%) | 16 (43.2%) |
| Cleaning & Maintenance | 31 (77.5%) | 9 (22.5%) |
| Personal Care & Service | 4 (12.9%) | 27 (87.1%) |
| Total (Category) | 113 (43.0%) | 150 (57.0%) |
| Total (Overall) | 564 (50.2%) | 559 (49.8%) |
Sales and Office Occupations
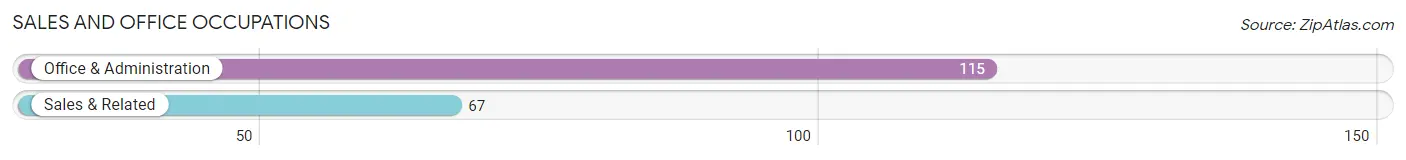
The most common Sales and Office occupations in Rice are Office & Administration (115 | 10.2%), and Sales & Related (67 | 6.0%).
Sales and Office Occupations by Sex
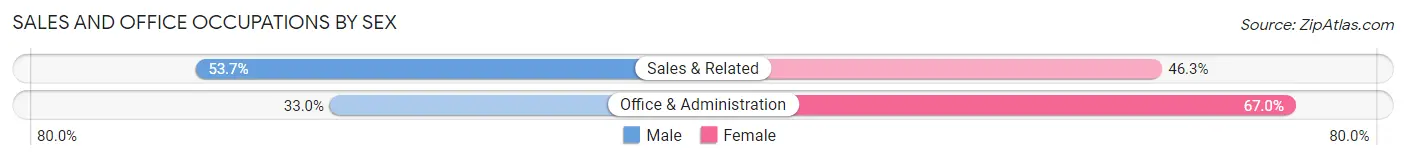
| Occupation | Male | Female |
| Sales & Related | 36 (53.7%) | 31 (46.3%) |
| Office & Administration | 38 (33.0%) | 77 (67.0%) |
| Total (Category) | 74 (40.7%) | 108 (59.3%) |
| Total (Overall) | 564 (50.2%) | 559 (49.8%) |
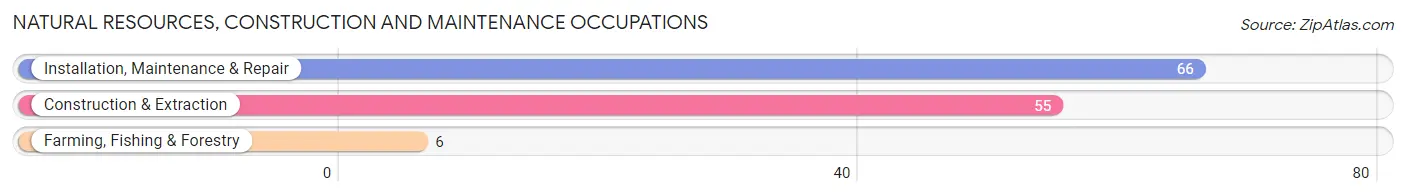
Natural Resources, Construction and Maintenance Occupations
The most common Natural Resources, Construction and Maintenance occupations in Rice are Installation, Maintenance & Repair (66 | 5.9%), Construction & Extraction (55 | 4.9%), and Farming, Fishing & Forestry (6 | 0.5%).
Natural Resources, Construction and Maintenance Occupations by Sex
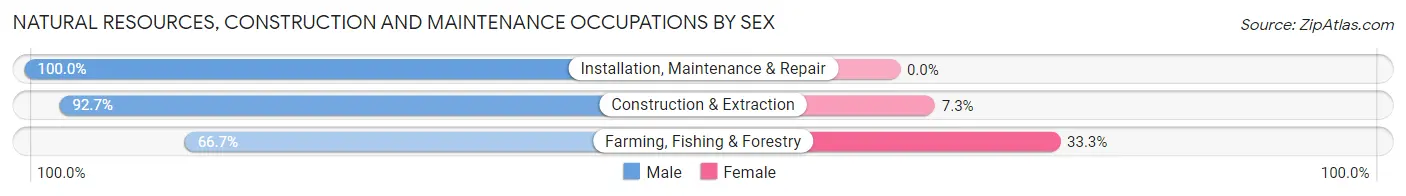
| Occupation | Male | Female |
| Farming, Fishing & Forestry | 4 (66.7%) | 2 (33.3%) |
| Construction & Extraction | 51 (92.7%) | 4 (7.3%) |
| Installation, Maintenance & Repair | 66 (100.0%) | 0 (0.0%) |
| Total (Category) | 121 (95.3%) | 6 (4.7%) |
| Total (Overall) | 564 (50.2%) | 559 (49.8%) |
Production, Transportation and Moving Occupations
The most common Production, Transportation and Moving occupations in Rice are Production (55 | 4.9%), Transportation (55 | 4.9%), and Material Moving (40 | 3.6%).
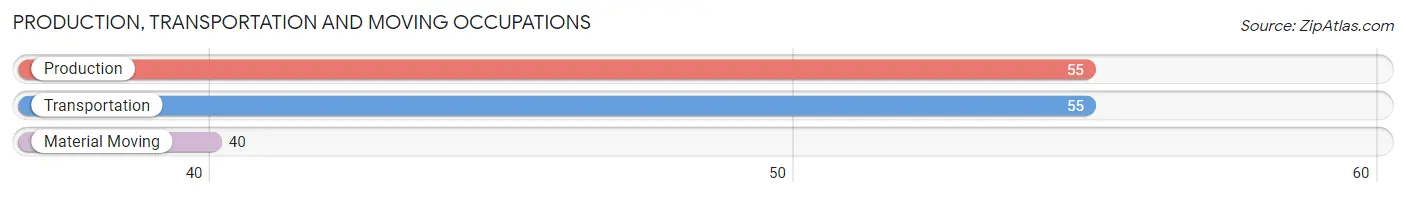
Production, Transportation and Moving Occupations by Sex
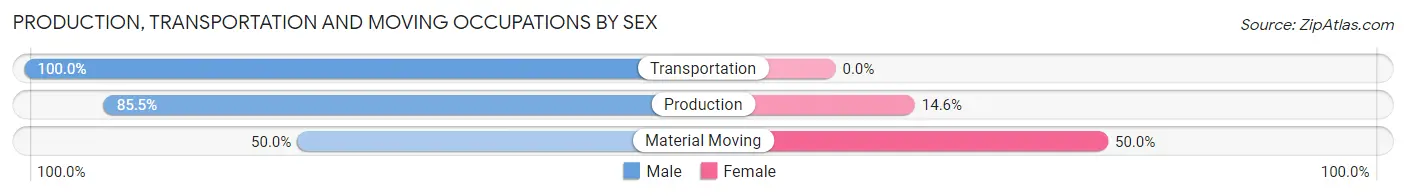
| Occupation | Male | Female |
| Production | 47 (85.5%) | 8 (14.5%) |
| Transportation | 55 (100.0%) | 0 (0.0%) |
| Material Moving | 20 (50.0%) | 20 (50.0%) |
| Total (Category) | 122 (81.3%) | 28 (18.7%) |
| Total (Overall) | 564 (50.2%) | 559 (49.8%) |
Employment Industries by Sex in Rice
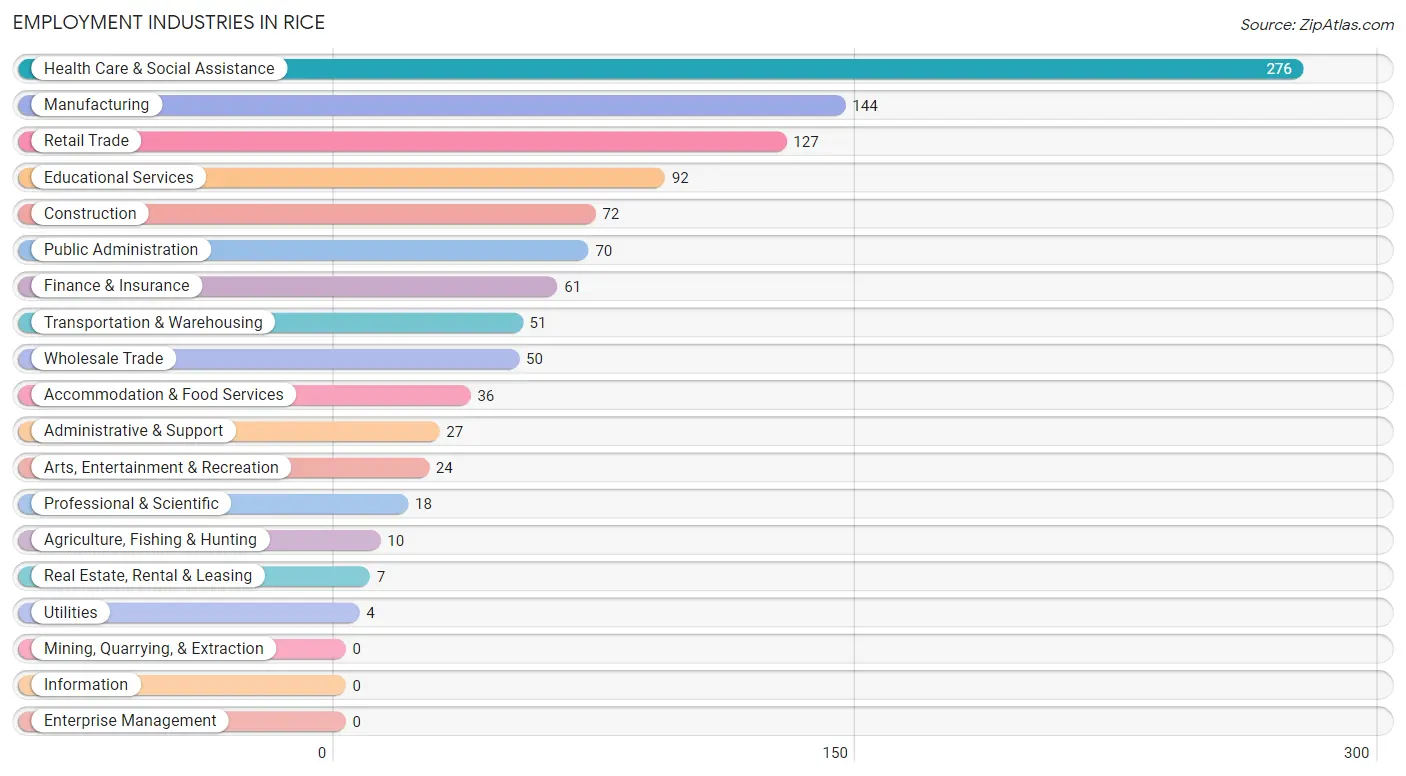
Employment Industries in Rice
The major employment industries in Rice include Health Care & Social Assistance (276 | 24.6%), Manufacturing (144 | 12.8%), Retail Trade (127 | 11.3%), Educational Services (92 | 8.2%), and Construction (72 | 6.4%).
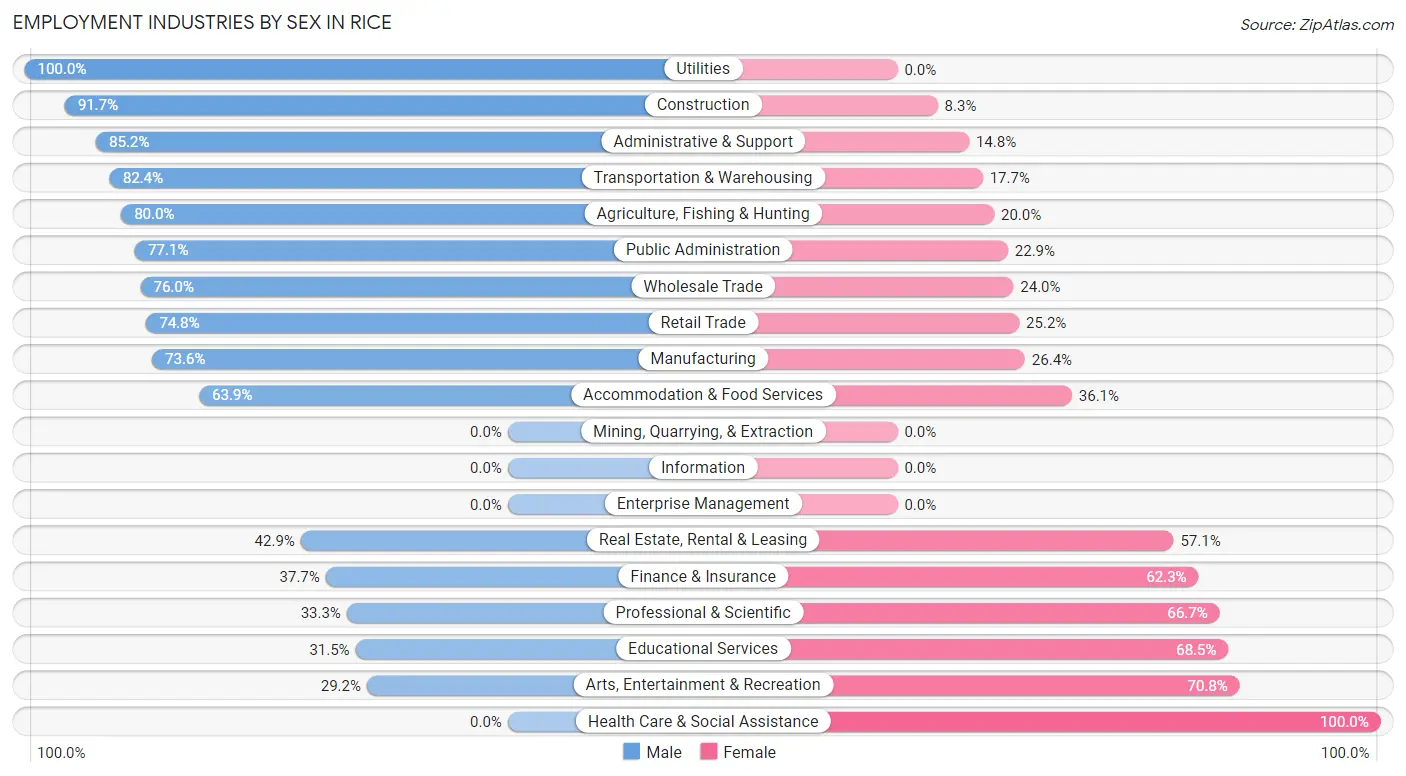
Employment Industries by Sex in Rice
The Rice industries that see more men than women are Utilities (100.0%), Construction (91.7%), and Administrative & Support (85.2%), whereas the industries that tend to have a higher number of women are Health Care & Social Assistance (100.0%), Arts, Entertainment & Recreation (70.8%), and Educational Services (68.5%).
| Industry | Male | Female |
| Agriculture, Fishing & Hunting | 8 (80.0%) | 2 (20.0%) |
| Mining, Quarrying, & Extraction | 0 (0.0%) | 0 (0.0%) |
| Construction | 66 (91.7%) | 6 (8.3%) |
| Manufacturing | 106 (73.6%) | 38 (26.4%) |
| Wholesale Trade | 38 (76.0%) | 12 (24.0%) |
| Retail Trade | 95 (74.8%) | 32 (25.2%) |
| Transportation & Warehousing | 42 (82.4%) | 9 (17.6%) |
| Utilities | 4 (100.0%) | 0 (0.0%) |
| Information | 0 (0.0%) | 0 (0.0%) |
| Finance & Insurance | 23 (37.7%) | 38 (62.3%) |
| Real Estate, Rental & Leasing | 3 (42.9%) | 4 (57.1%) |
| Professional & Scientific | 6 (33.3%) | 12 (66.7%) |
| Enterprise Management | 0 (0.0%) | 0 (0.0%) |
| Administrative & Support | 23 (85.2%) | 4 (14.8%) |
| Educational Services | 29 (31.5%) | 63 (68.5%) |
| Health Care & Social Assistance | 0 (0.0%) | 276 (100.0%) |
| Arts, Entertainment & Recreation | 7 (29.2%) | 17 (70.8%) |
| Accommodation & Food Services | 23 (63.9%) | 13 (36.1%) |
| Public Administration | 54 (77.1%) | 16 (22.9%) |
| Total | 564 (50.2%) | 559 (49.8%) |
Education in Rice
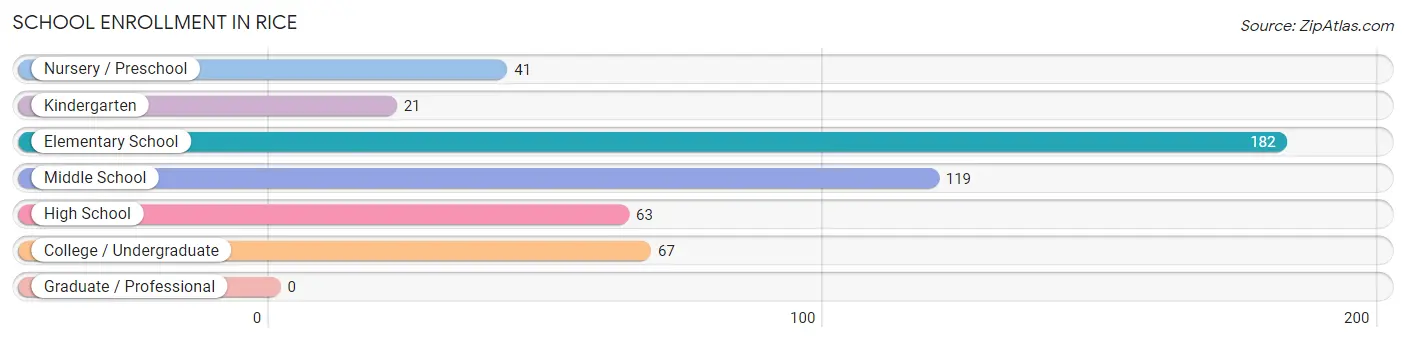
School Enrollment in Rice
The most common levels of schooling among the 493 students in Rice are elementary school (182 | 36.9%), middle school (119 | 24.1%), and college / undergraduate (67 | 13.6%).
| School Level | # Students | % Students |
| Nursery / Preschool | 41 | 8.3% |
| Kindergarten | 21 | 4.3% |
| Elementary School | 182 | 36.9% |
| Middle School | 119 | 24.1% |
| High School | 63 | 12.8% |
| College / Undergraduate | 67 | 13.6% |
| Graduate / Professional | 0 | 0.0% |
| Total | 493 | 100.0% |
School Enrollment by Age by Funding Source in Rice
Out of a total of 493 students who are enrolled in schools in Rice, 55 (11.2%) attend a private institution, while the remaining 438 (88.8%) are enrolled in public schools. The age group of 35 years and over has the highest likelihood of being enrolled in private schools, with 11 (100.0% in the age bracket) enrolled. Conversely, the age group of 3 to 4 year olds has the lowest likelihood of being enrolled in a private school, with 17 (100.0% in the age bracket) attending a public institution.
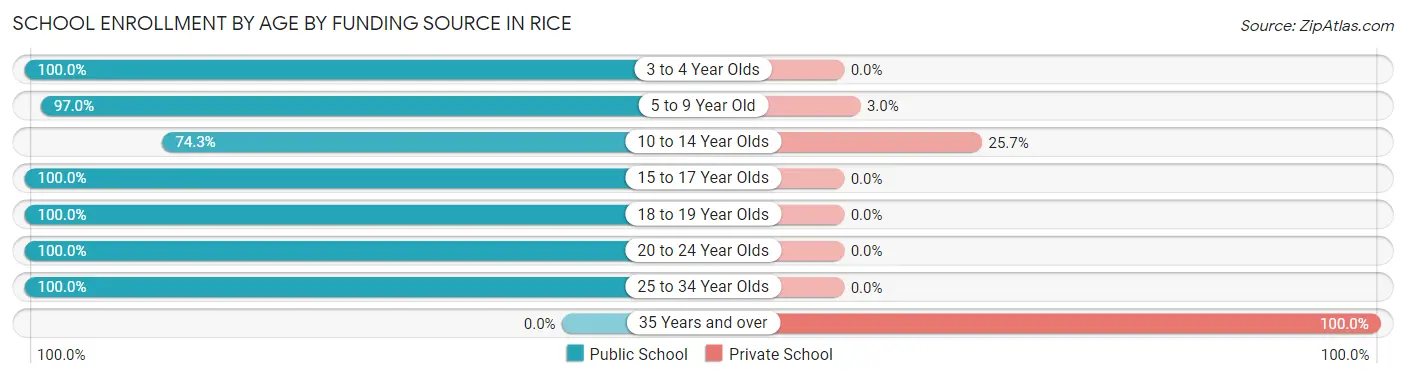
| Age Bracket | Public School | Private School |
| 3 to 4 Year Olds | 17 (100.0%) | 0 (0.0%) |
| 5 to 9 Year Old | 192 (97.0%) | 6 (3.0%) |
| 10 to 14 Year Olds | 110 (74.3%) | 38 (25.7%) |
| 15 to 17 Year Olds | 55 (100.0%) | 0 (0.0%) |
| 18 to 19 Year Olds | 18 (100.0%) | 0 (0.0%) |
| 20 to 24 Year Olds | 20 (100.0%) | 0 (0.0%) |
| 25 to 34 Year Olds | 26 (100.0%) | 0 (0.0%) |
| 35 Years and over | 0 (0.0%) | 11 (100.0%) |
| Total | 438 (88.8%) | 55 (11.2%) |
Educational Attainment by Field of Study in Rice
Business (103 | 28.0%), education (95 | 25.8%), arts & humanities (61 | 16.6%), science & technology (42 | 11.4%), and psychology (26 | 7.1%) are the most common fields of study among 368 individuals in Rice who have obtained a bachelor's degree or higher.
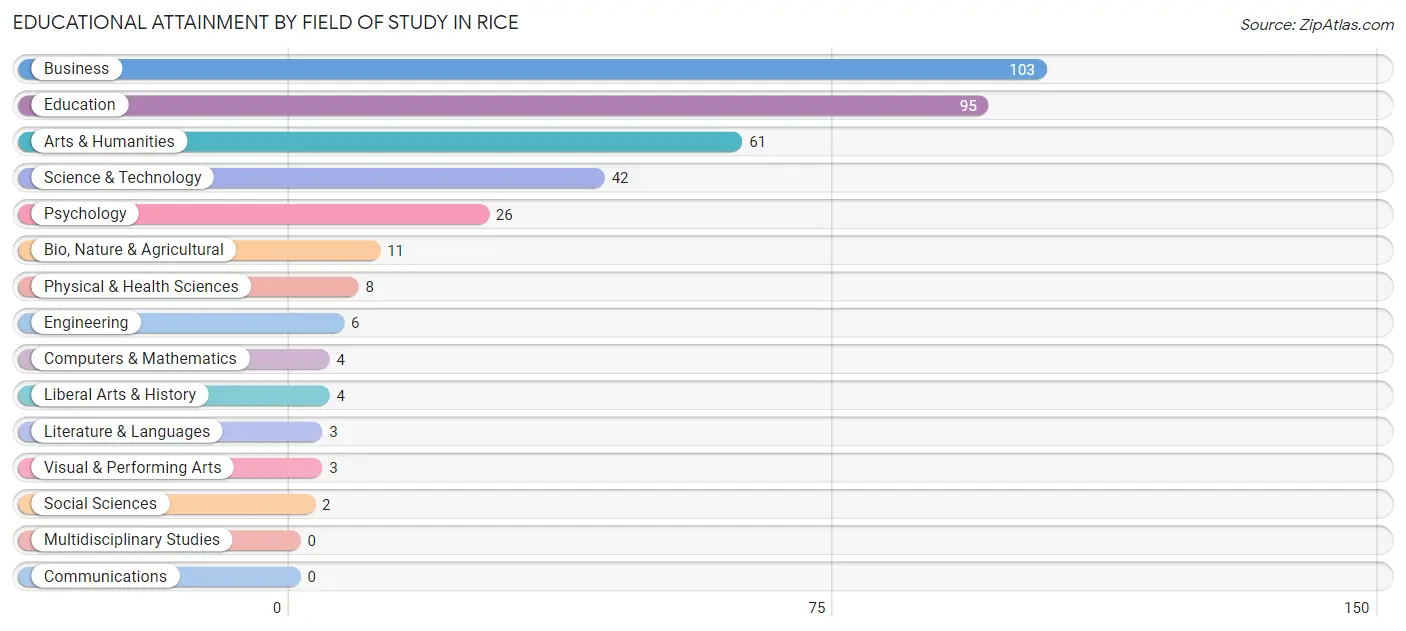
| Field of Study | # Graduates | % Graduates |
| Computers & Mathematics | 4 | 1.1% |
| Bio, Nature & Agricultural | 11 | 3.0% |
| Physical & Health Sciences | 8 | 2.2% |
| Psychology | 26 | 7.1% |
| Social Sciences | 2 | 0.5% |
| Engineering | 6 | 1.6% |
| Multidisciplinary Studies | 0 | 0.0% |
| Science & Technology | 42 | 11.4% |
| Business | 103 | 28.0% |
| Education | 95 | 25.8% |
| Literature & Languages | 3 | 0.8% |
| Liberal Arts & History | 4 | 1.1% |
| Visual & Performing Arts | 3 | 0.8% |
| Communications | 0 | 0.0% |
| Arts & Humanities | 61 | 16.6% |
| Total | 368 | 100.0% |
Transportation & Commute in Rice
Vehicle Availability by Sex in Rice
The most prevalent vehicle ownership categories in Rice are males with 2 vehicles (260, accounting for 46.7%) and females with 2 vehicles (278, making up 46.7%).
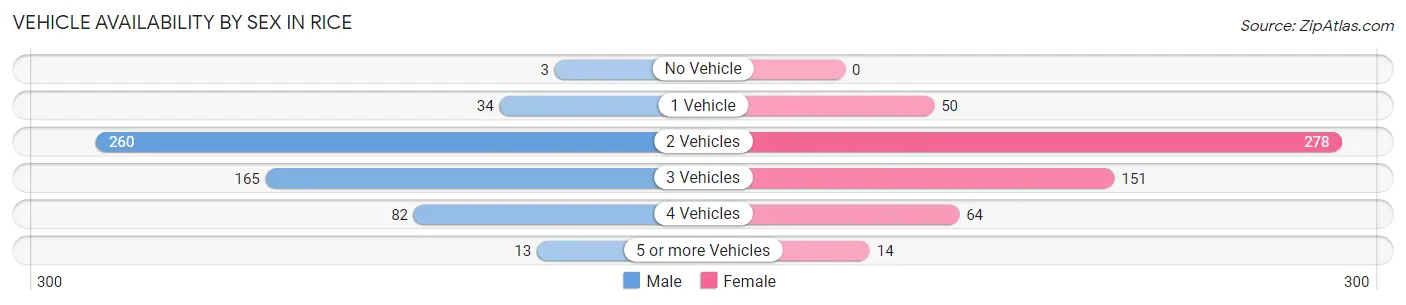
| Vehicles Available | Male | Female |
| No Vehicle | 3 (0.5%) | 0 (0.0%) |
| 1 Vehicle | 34 (6.1%) | 50 (9.0%) |
| 2 Vehicles | 260 (46.7%) | 278 (49.9%) |
| 3 Vehicles | 165 (29.6%) | 151 (27.1%) |
| 4 Vehicles | 82 (14.7%) | 64 (11.5%) |
| 5 or more Vehicles | 13 (2.3%) | 14 (2.5%) |
| Total | 557 (100.0%) | 557 (100.0%) |
Commute Time in Rice
The most frequently occuring commute durations in Rice are 20 to 24 minutes (334 commuters, 32.8%), 15 to 19 minutes (249 commuters, 24.5%), and 25 to 29 minutes (140 commuters, 13.8%).
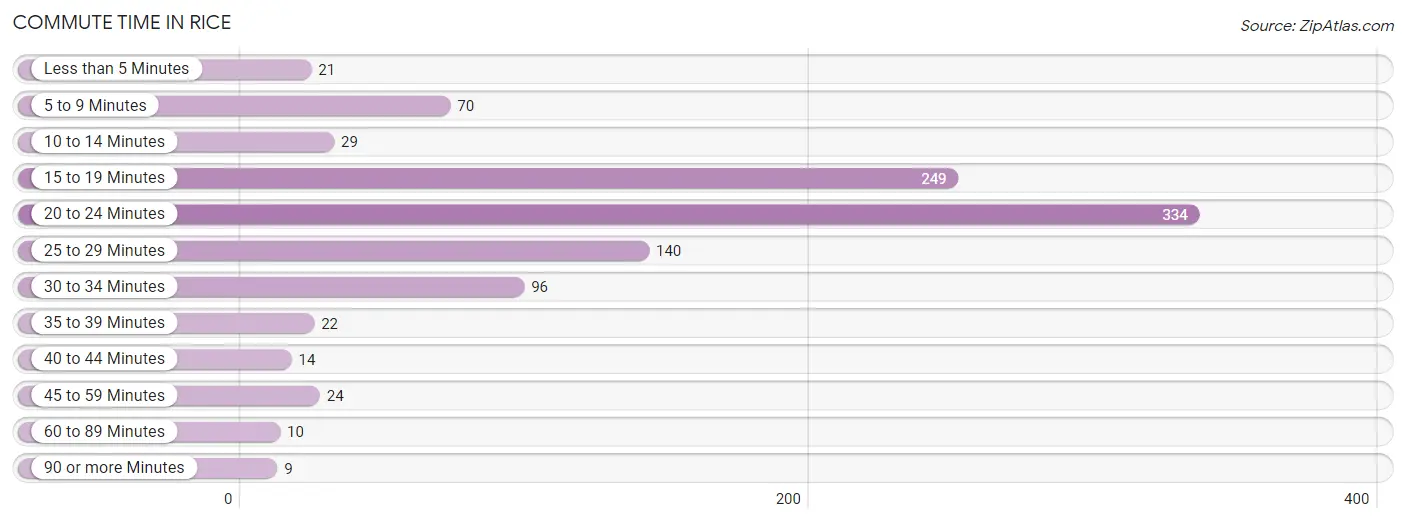
| Commute Time | # Commuters | % Commuters |
| Less than 5 Minutes | 21 | 2.1% |
| 5 to 9 Minutes | 70 | 6.9% |
| 10 to 14 Minutes | 29 | 2.9% |
| 15 to 19 Minutes | 249 | 24.5% |
| 20 to 24 Minutes | 334 | 32.8% |
| 25 to 29 Minutes | 140 | 13.8% |
| 30 to 34 Minutes | 96 | 9.4% |
| 35 to 39 Minutes | 22 | 2.2% |
| 40 to 44 Minutes | 14 | 1.4% |
| 45 to 59 Minutes | 24 | 2.4% |
| 60 to 89 Minutes | 10 | 1.0% |
| 90 or more Minutes | 9 | 0.9% |
Commute Time by Sex in Rice
The most common commute times in Rice are 20 to 24 minutes (158 commuters, 30.3%) for males and 20 to 24 minutes (176 commuters, 35.4%) for females.
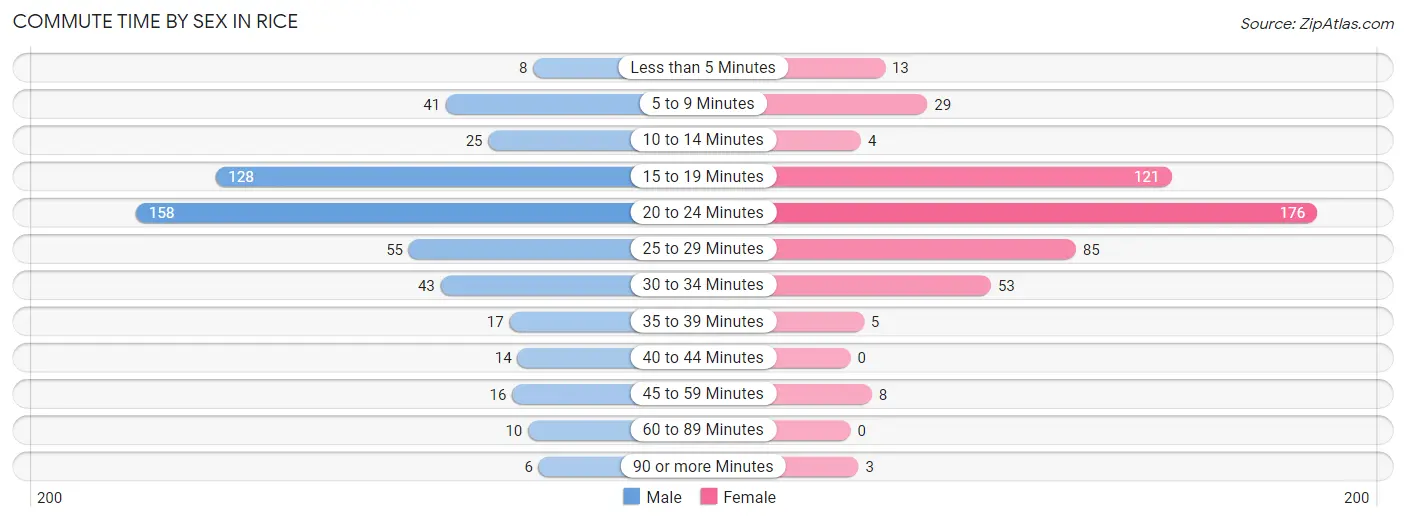
| Commute Time | Male | Female |
| Less than 5 Minutes | 8 (1.5%) | 13 (2.6%) |
| 5 to 9 Minutes | 41 (7.9%) | 29 (5.8%) |
| 10 to 14 Minutes | 25 (4.8%) | 4 (0.8%) |
| 15 to 19 Minutes | 128 (24.6%) | 121 (24.3%) |
| 20 to 24 Minutes | 158 (30.3%) | 176 (35.4%) |
| 25 to 29 Minutes | 55 (10.6%) | 85 (17.1%) |
| 30 to 34 Minutes | 43 (8.3%) | 53 (10.7%) |
| 35 to 39 Minutes | 17 (3.3%) | 5 (1.0%) |
| 40 to 44 Minutes | 14 (2.7%) | 0 (0.0%) |
| 45 to 59 Minutes | 16 (3.1%) | 8 (1.6%) |
| 60 to 89 Minutes | 10 (1.9%) | 0 (0.0%) |
| 90 or more Minutes | 6 (1.1%) | 3 (0.6%) |
Time of Departure to Work by Sex in Rice
The most frequent times of departure to work in Rice are 6:30 AM to 6:59 AM (96, 18.4%) for males and 7:00 AM to 7:29 AM (136, 27.4%) for females.
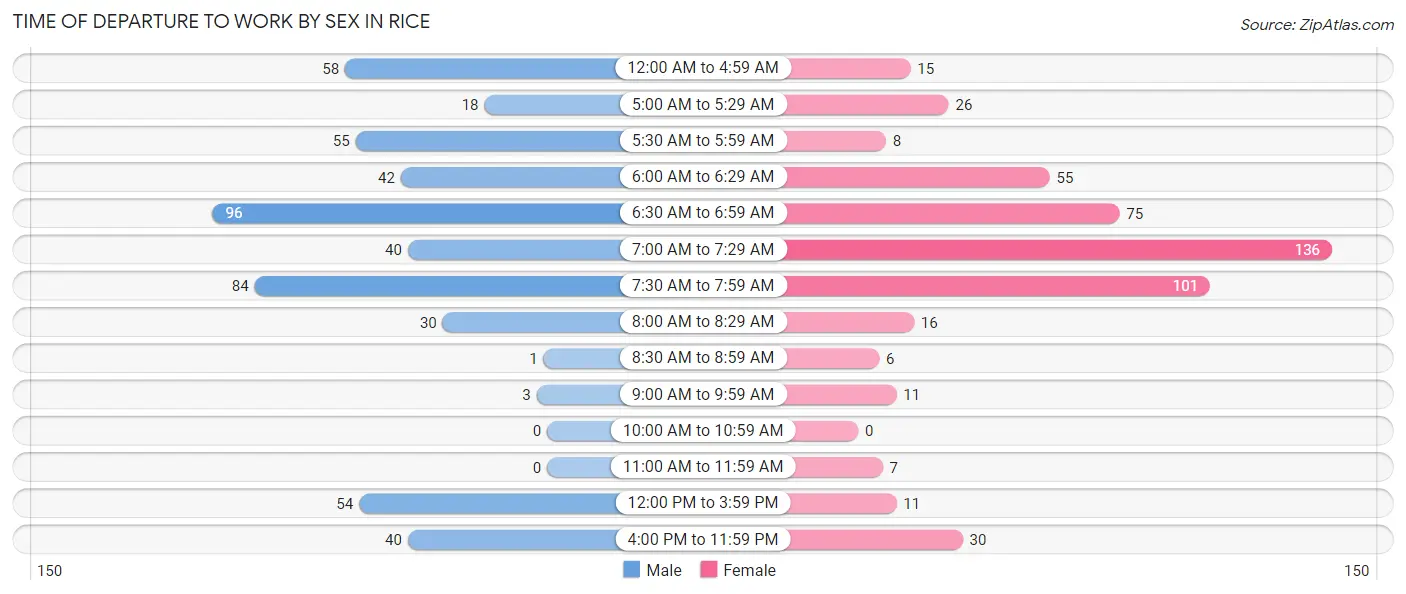
| Time of Departure | Male | Female |
| 12:00 AM to 4:59 AM | 58 (11.1%) | 15 (3.0%) |
| 5:00 AM to 5:29 AM | 18 (3.5%) | 26 (5.2%) |
| 5:30 AM to 5:59 AM | 55 (10.6%) | 8 (1.6%) |
| 6:00 AM to 6:29 AM | 42 (8.1%) | 55 (11.1%) |
| 6:30 AM to 6:59 AM | 96 (18.4%) | 75 (15.1%) |
| 7:00 AM to 7:29 AM | 40 (7.7%) | 136 (27.4%) |
| 7:30 AM to 7:59 AM | 84 (16.1%) | 101 (20.3%) |
| 8:00 AM to 8:29 AM | 30 (5.8%) | 16 (3.2%) |
| 8:30 AM to 8:59 AM | 1 (0.2%) | 6 (1.2%) |
| 9:00 AM to 9:59 AM | 3 (0.6%) | 11 (2.2%) |
| 10:00 AM to 10:59 AM | 0 (0.0%) | 0 (0.0%) |
| 11:00 AM to 11:59 AM | 0 (0.0%) | 7 (1.4%) |
| 12:00 PM to 3:59 PM | 54 (10.4%) | 11 (2.2%) |
| 4:00 PM to 11:59 PM | 40 (7.7%) | 30 (6.0%) |
| Total | 521 (100.0%) | 497 (100.0%) |
Housing Occupancy in Rice
Occupancy by Ownership in Rice
Of the total 663 dwellings in Rice, owner-occupied units account for 577 (87.0%), while renter-occupied units make up 86 (13.0%).
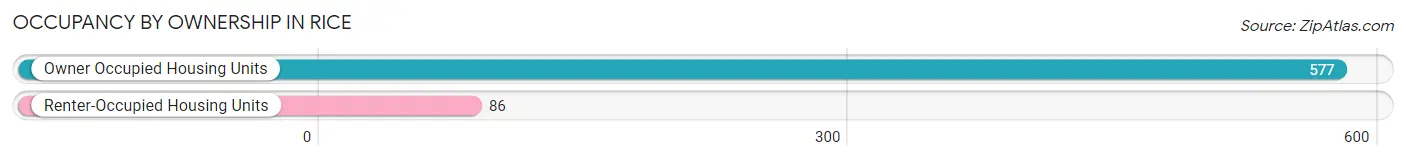
| Occupancy | # Housing Units | % Housing Units |
| Owner Occupied Housing Units | 577 | 87.0% |
| Renter-Occupied Housing Units | 86 | 13.0% |
| Total Occupied Housing Units | 663 | 100.0% |
Occupancy by Household Size in Rice
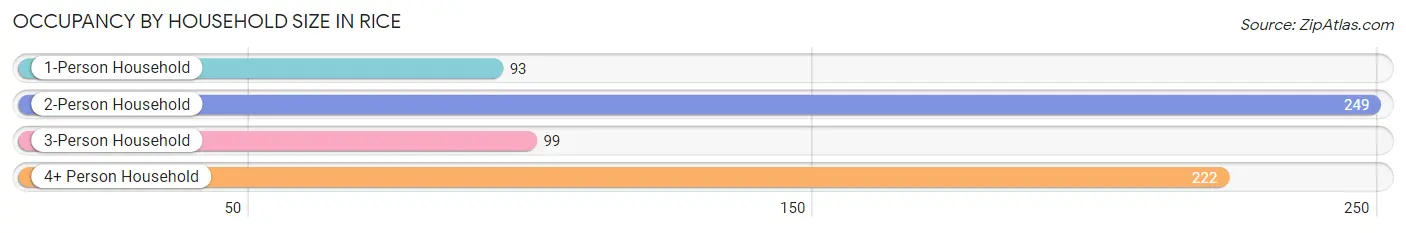
| Household Size | # Housing Units | % Housing Units |
| 1-Person Household | 93 | 14.0% |
| 2-Person Household | 249 | 37.6% |
| 3-Person Household | 99 | 14.9% |
| 4+ Person Household | 222 | 33.5% |
| Total Housing Units | 663 | 100.0% |
Occupancy by Ownership by Household Size in Rice
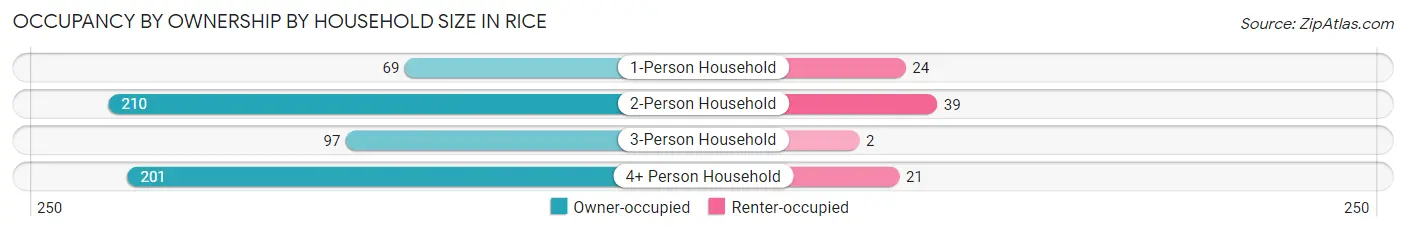
| Household Size | Owner-occupied | Renter-occupied |
| 1-Person Household | 69 (74.2%) | 24 (25.8%) |
| 2-Person Household | 210 (84.3%) | 39 (15.7%) |
| 3-Person Household | 97 (98.0%) | 2 (2.0%) |
| 4+ Person Household | 201 (90.5%) | 21 (9.5%) |
| Total Housing Units | 577 (87.0%) | 86 (13.0%) |
Occupancy by Educational Attainment in Rice
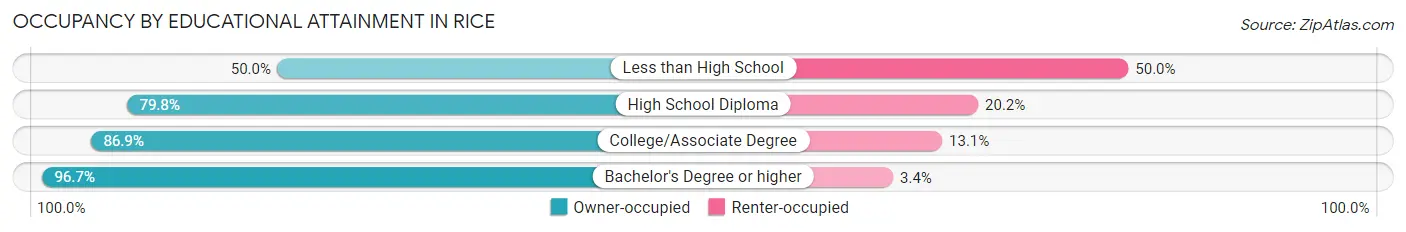
| Household Size | Owner-occupied | Renter-occupied |
| Less than High School | 4 (50.0%) | 4 (50.0%) |
| High School Diploma | 154 (79.8%) | 39 (20.2%) |
| College/Associate Degree | 246 (86.9%) | 37 (13.1%) |
| Bachelor's Degree or higher | 173 (96.7%) | 6 (3.4%) |
Occupancy by Age of Householder in Rice
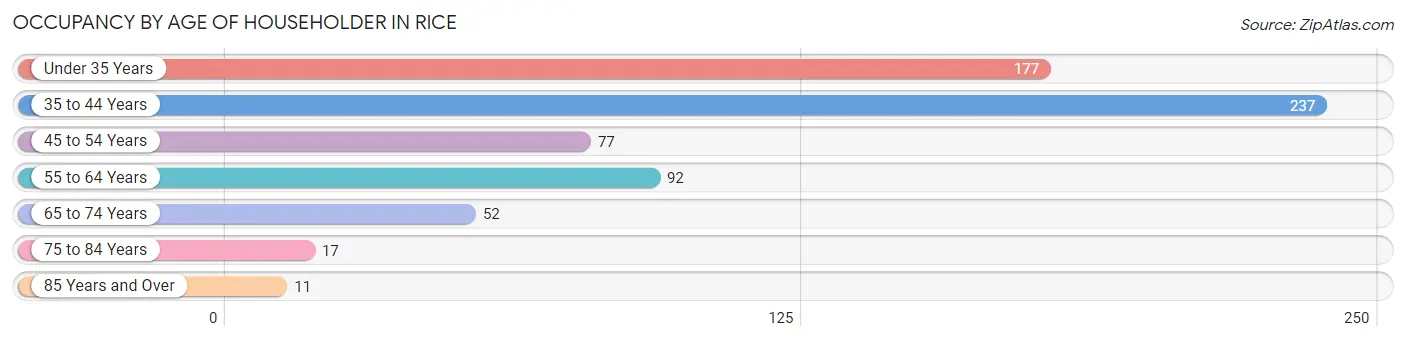
| Age Bracket | # Households | % Households |
| Under 35 Years | 177 | 26.7% |
| 35 to 44 Years | 237 | 35.7% |
| 45 to 54 Years | 77 | 11.6% |
| 55 to 64 Years | 92 | 13.9% |
| 65 to 74 Years | 52 | 7.8% |
| 75 to 84 Years | 17 | 2.6% |
| 85 Years and Over | 11 | 1.7% |
| Total | 663 | 100.0% |
Housing Finances in Rice
Median Income by Occupancy in Rice
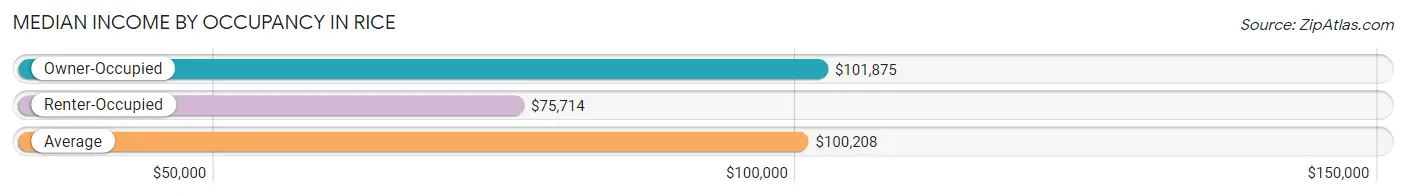
| Occupancy Type | # Households | Median Income |
| Owner-Occupied | 577 (87.0%) | $101,875 |
| Renter-Occupied | 86 (13.0%) | $75,714 |
| Average | 663 (100.0%) | $100,208 |
Occupancy by Householder Income Bracket in Rice
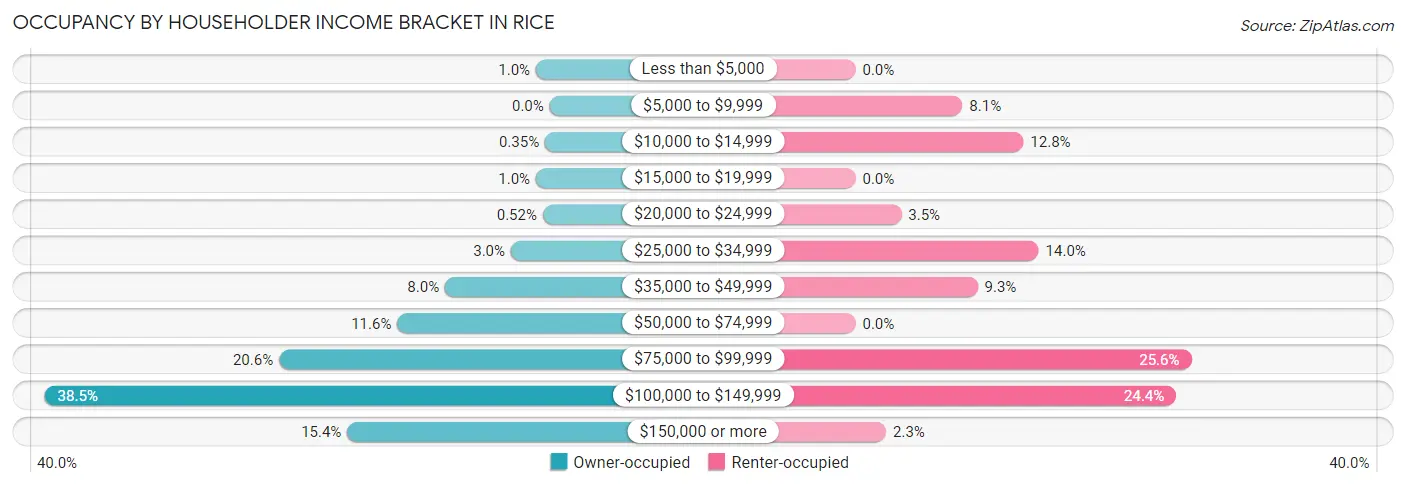
| Income Bracket | Owner-occupied | Renter-occupied |
| Less than $5,000 | 6 (1.0%) | 0 (0.0%) |
| $5,000 to $9,999 | 0 (0.0%) | 7 (8.1%) |
| $10,000 to $14,999 | 2 (0.4%) | 11 (12.8%) |
| $15,000 to $19,999 | 6 (1.0%) | 0 (0.0%) |
| $20,000 to $24,999 | 3 (0.5%) | 3 (3.5%) |
| $25,000 to $34,999 | 17 (2.9%) | 12 (14.0%) |
| $35,000 to $49,999 | 46 (8.0%) | 8 (9.3%) |
| $50,000 to $74,999 | 67 (11.6%) | 0 (0.0%) |
| $75,000 to $99,999 | 119 (20.6%) | 22 (25.6%) |
| $100,000 to $149,999 | 222 (38.5%) | 21 (24.4%) |
| $150,000 or more | 89 (15.4%) | 2 (2.3%) |
| Total | 577 (100.0%) | 86 (100.0%) |
Monthly Housing Cost Tiers in Rice
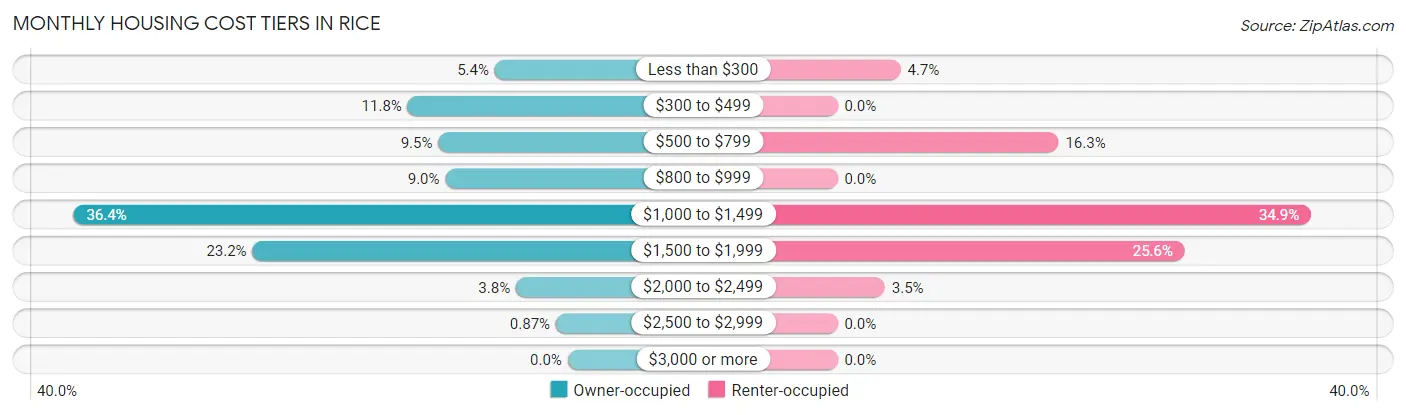
| Monthly Cost | Owner-occupied | Renter-occupied |
| Less than $300 | 31 (5.4%) | 4 (4.6%) |
| $300 to $499 | 68 (11.8%) | 0 (0.0%) |
| $500 to $799 | 55 (9.5%) | 14 (16.3%) |
| $800 to $999 | 52 (9.0%) | 0 (0.0%) |
| $1,000 to $1,499 | 210 (36.4%) | 30 (34.9%) |
| $1,500 to $1,999 | 134 (23.2%) | 22 (25.6%) |
| $2,000 to $2,499 | 22 (3.8%) | 3 (3.5%) |
| $2,500 to $2,999 | 5 (0.9%) | 0 (0.0%) |
| $3,000 or more | 0 (0.0%) | 0 (0.0%) |
| Total | 577 (100.0%) | 86 (100.0%) |
Physical Housing Characteristics in Rice
Housing Structures in Rice
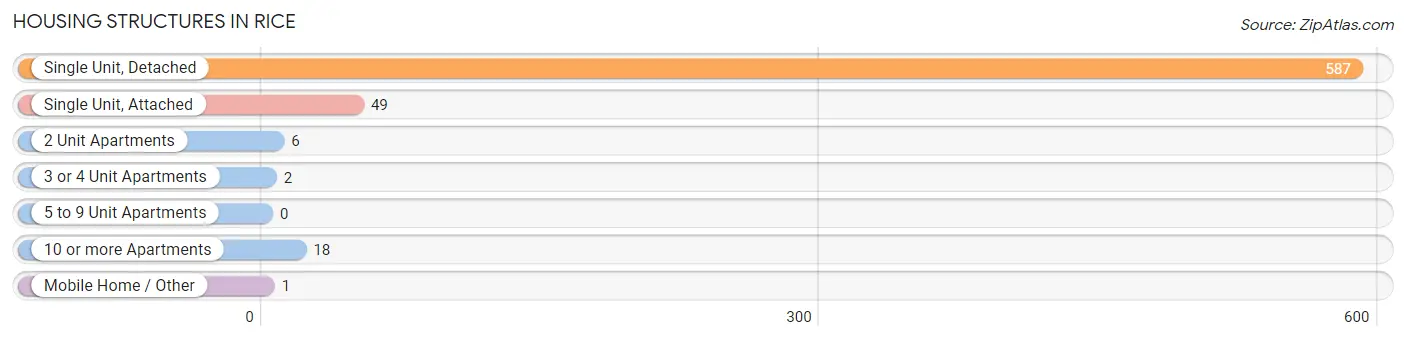
| Structure Type | # Housing Units | % Housing Units |
| Single Unit, Detached | 587 | 88.5% |
| Single Unit, Attached | 49 | 7.4% |
| 2 Unit Apartments | 6 | 0.9% |
| 3 or 4 Unit Apartments | 2 | 0.3% |
| 5 to 9 Unit Apartments | 0 | 0.0% |
| 10 or more Apartments | 18 | 2.7% |
| Mobile Home / Other | 1 | 0.2% |
| Total | 663 | 100.0% |
Housing Structures by Occupancy in Rice
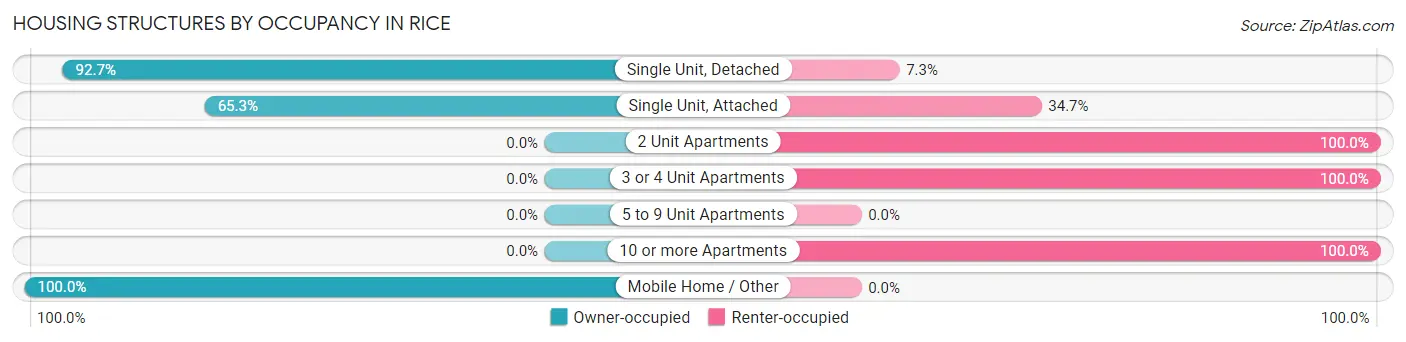
| Structure Type | Owner-occupied | Renter-occupied |
| Single Unit, Detached | 544 (92.7%) | 43 (7.3%) |
| Single Unit, Attached | 32 (65.3%) | 17 (34.7%) |
| 2 Unit Apartments | 0 (0.0%) | 6 (100.0%) |
| 3 or 4 Unit Apartments | 0 (0.0%) | 2 (100.0%) |
| 5 to 9 Unit Apartments | 0 (0.0%) | 0 (0.0%) |
| 10 or more Apartments | 0 (0.0%) | 18 (100.0%) |
| Mobile Home / Other | 1 (100.0%) | 0 (0.0%) |
| Total | 577 (87.0%) | 86 (13.0%) |
Housing Structures by Number of Rooms in Rice
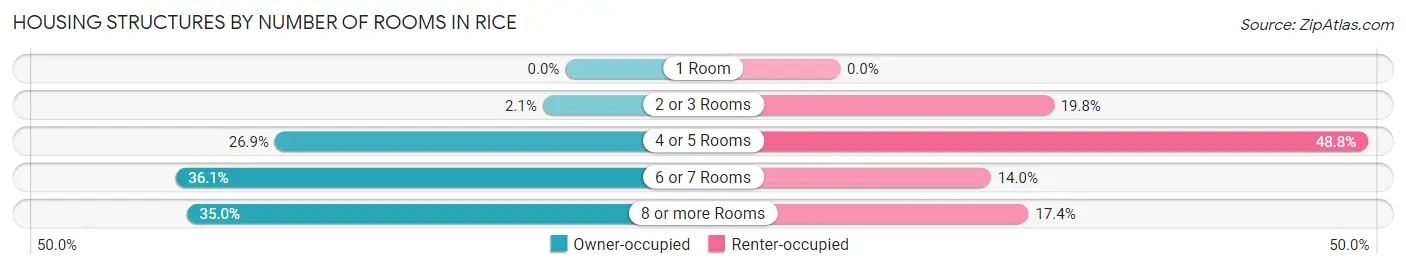
| Number of Rooms | Owner-occupied | Renter-occupied |
| 1 Room | 0 (0.0%) | 0 (0.0%) |
| 2 or 3 Rooms | 12 (2.1%) | 17 (19.8%) |
| 4 or 5 Rooms | 155 (26.9%) | 42 (48.8%) |
| 6 or 7 Rooms | 208 (36.0%) | 12 (14.0%) |
| 8 or more Rooms | 202 (35.0%) | 15 (17.4%) |
| Total | 577 (100.0%) | 86 (100.0%) |
Housing Structure by Heating Type in Rice
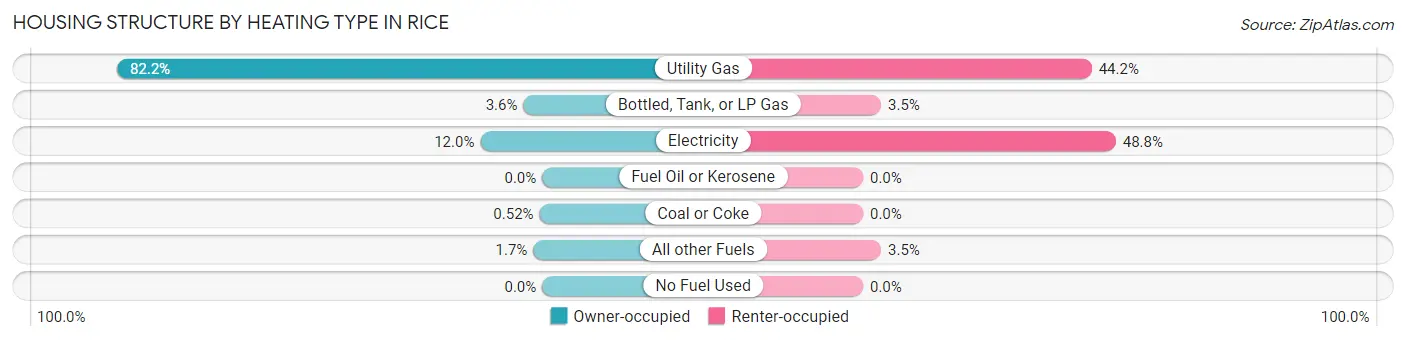
| Heating Type | Owner-occupied | Renter-occupied |
| Utility Gas | 474 (82.2%) | 38 (44.2%) |
| Bottled, Tank, or LP Gas | 21 (3.6%) | 3 (3.5%) |
| Electricity | 69 (12.0%) | 42 (48.8%) |
| Fuel Oil or Kerosene | 0 (0.0%) | 0 (0.0%) |
| Coal or Coke | 3 (0.5%) | 0 (0.0%) |
| All other Fuels | 10 (1.7%) | 3 (3.5%) |
| No Fuel Used | 0 (0.0%) | 0 (0.0%) |
| Total | 577 (100.0%) | 86 (100.0%) |
Household Vehicle Usage in Rice
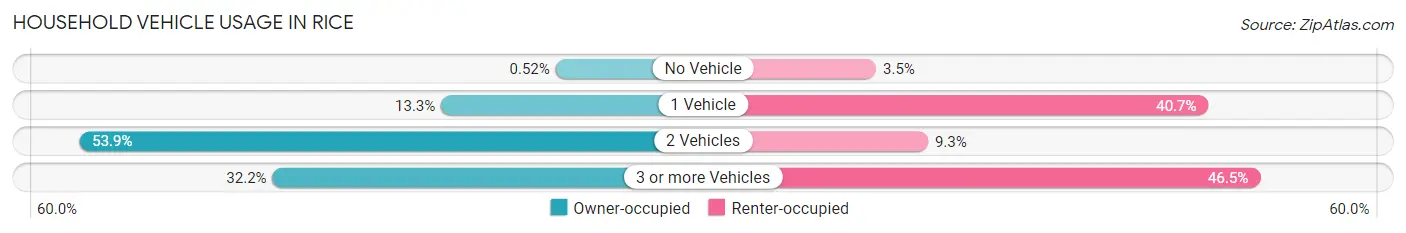
| Vehicles per Household | Owner-occupied | Renter-occupied |
| No Vehicle | 3 (0.5%) | 3 (3.5%) |
| 1 Vehicle | 77 (13.3%) | 35 (40.7%) |
| 2 Vehicles | 311 (53.9%) | 8 (9.3%) |
| 3 or more Vehicles | 186 (32.2%) | 40 (46.5%) |
| Total | 577 (100.0%) | 86 (100.0%) |
Real Estate & Mortgages in Rice
Real Estate and Mortgage Overview in Rice
| Characteristic | Without Mortgage | With Mortgage |
| Housing Units | 143 | 434 |
| Median Property Value | $199,200 | $225,200 |
| Median Household Income | $70,096 | $84 |
| Monthly Housing Costs | $445 | $0 |
| Real Estate Taxes | $2,159 | $21 |
Property Value by Mortgage Status in Rice
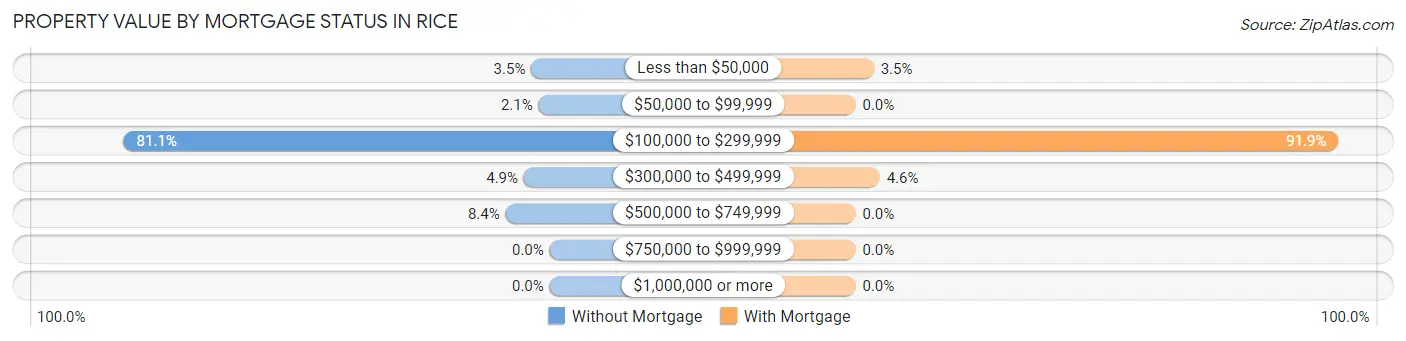
| Property Value | Without Mortgage | With Mortgage |
| Less than $50,000 | 5 (3.5%) | 15 (3.5%) |
| $50,000 to $99,999 | 3 (2.1%) | 0 (0.0%) |
| $100,000 to $299,999 | 116 (81.1%) | 399 (91.9%) |
| $300,000 to $499,999 | 7 (4.9%) | 20 (4.6%) |
| $500,000 to $749,999 | 12 (8.4%) | 0 (0.0%) |
| $750,000 to $999,999 | 0 (0.0%) | 0 (0.0%) |
| $1,000,000 or more | 0 (0.0%) | 0 (0.0%) |
| Total | 143 (100.0%) | 434 (100.0%) |
Household Income by Mortgage Status in Rice
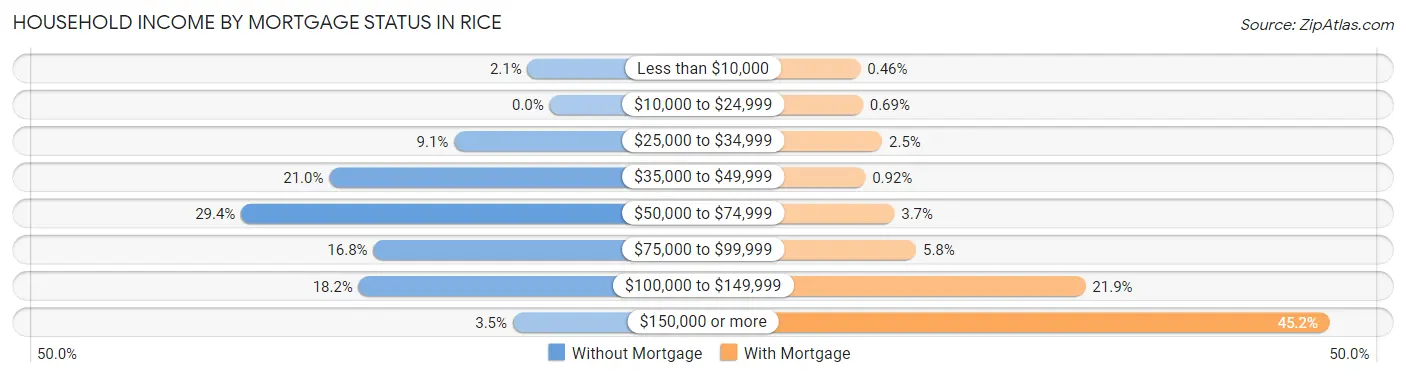
| Household Income | Without Mortgage | With Mortgage |
| Less than $10,000 | 3 (2.1%) | 2 (0.5%) |
| $10,000 to $24,999 | 0 (0.0%) | 3 (0.7%) |
| $25,000 to $34,999 | 13 (9.1%) | 11 (2.5%) |
| $35,000 to $49,999 | 30 (21.0%) | 4 (0.9%) |
| $50,000 to $74,999 | 42 (29.4%) | 16 (3.7%) |
| $75,000 to $99,999 | 24 (16.8%) | 25 (5.8%) |
| $100,000 to $149,999 | 26 (18.2%) | 95 (21.9%) |
| $150,000 or more | 5 (3.5%) | 196 (45.2%) |
| Total | 143 (100.0%) | 434 (100.0%) |
Property Value to Household Income Ratio in Rice
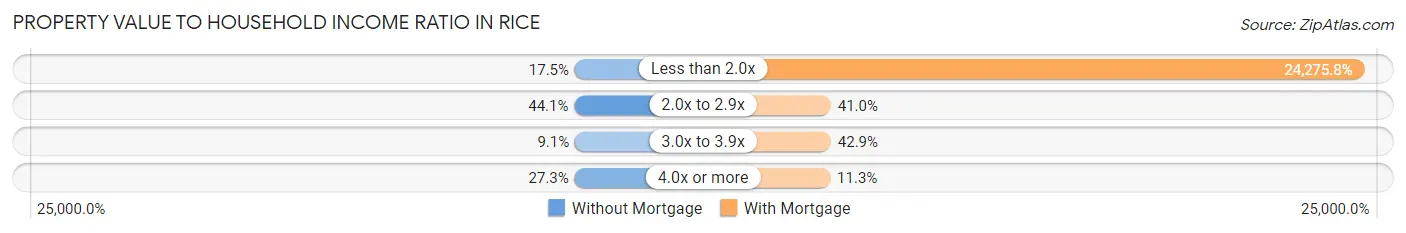
| Value-to-Income Ratio | Without Mortgage | With Mortgage |
| Less than 2.0x | 25 (17.5%) | 105,357 (24,275.8%) |
| 2.0x to 2.9x | 63 (44.1%) | 178 (41.0%) |
| 3.0x to 3.9x | 13 (9.1%) | 186 (42.9%) |
| 4.0x or more | 39 (27.3%) | 49 (11.3%) |
| Total | 143 (100.0%) | 434 (100.0%) |
Real Estate Taxes by Mortgage Status in Rice
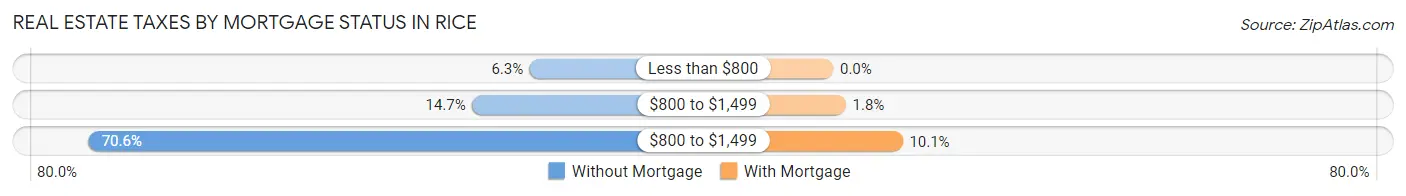
| Property Taxes | Without Mortgage | With Mortgage |
| Less than $800 | 9 (6.3%) | 0 (0.0%) |
| $800 to $1,499 | 21 (14.7%) | 8 (1.8%) |
| $800 to $1,499 | 101 (70.6%) | 44 (10.1%) |
| Total | 143 (100.0%) | 434 (100.0%) |
Health & Disability in Rice
Health Insurance Coverage by Age in Rice
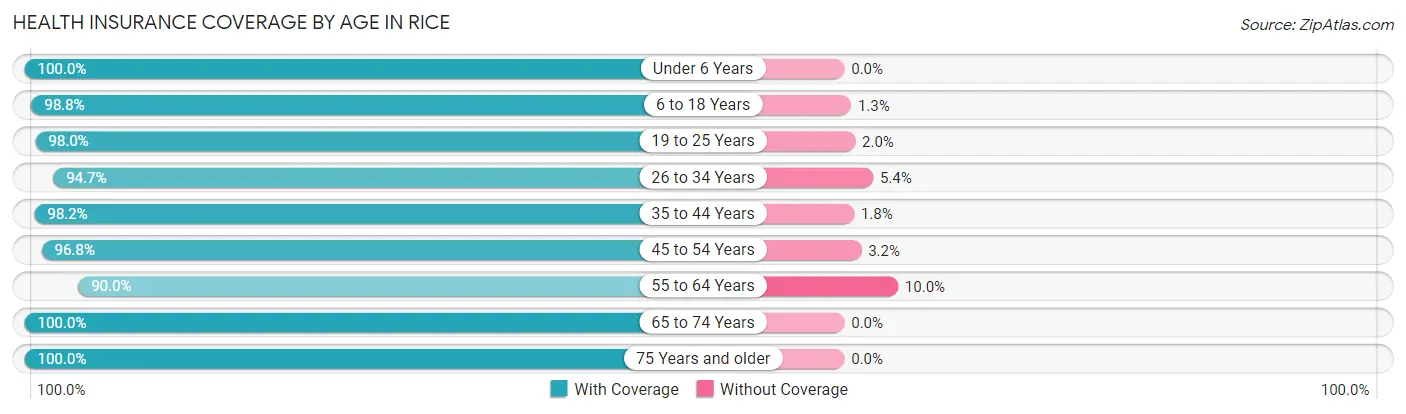
| Age Bracket | With Coverage | Without Coverage |
| Under 6 Years | 204 (100.0%) | 0 (0.0%) |
| 6 to 18 Years | 396 (98.8%) | 5 (1.3%) |
| 19 to 25 Years | 97 (98.0%) | 2 (2.0%) |
| 26 to 34 Years | 283 (94.7%) | 16 (5.3%) |
| 35 to 44 Years | 432 (98.2%) | 8 (1.8%) |
| 45 to 54 Years | 184 (96.8%) | 6 (3.2%) |
| 55 to 64 Years | 126 (90.0%) | 14 (10.0%) |
| 65 to 74 Years | 93 (100.0%) | 0 (0.0%) |
| 75 Years and older | 34 (100.0%) | 0 (0.0%) |
| Total | 1,849 (97.3%) | 51 (2.7%) |
Health Insurance Coverage by Citizenship Status in Rice
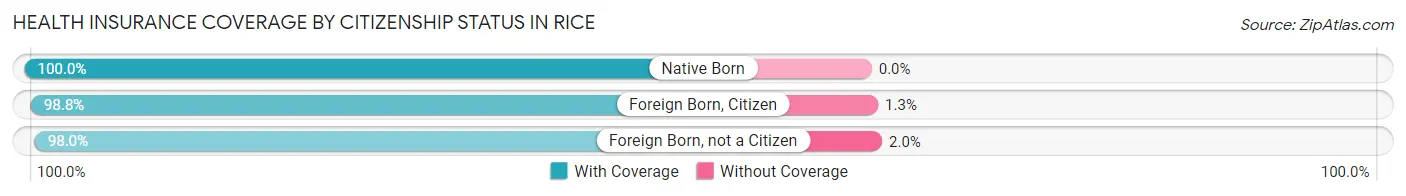
| Citizenship Status | With Coverage | Without Coverage |
| Native Born | 204 (100.0%) | 0 (0.0%) |
| Foreign Born, Citizen | 396 (98.8%) | 5 (1.3%) |
| Foreign Born, not a Citizen | 97 (98.0%) | 2 (2.0%) |
Health Insurance Coverage by Household Income in Rice
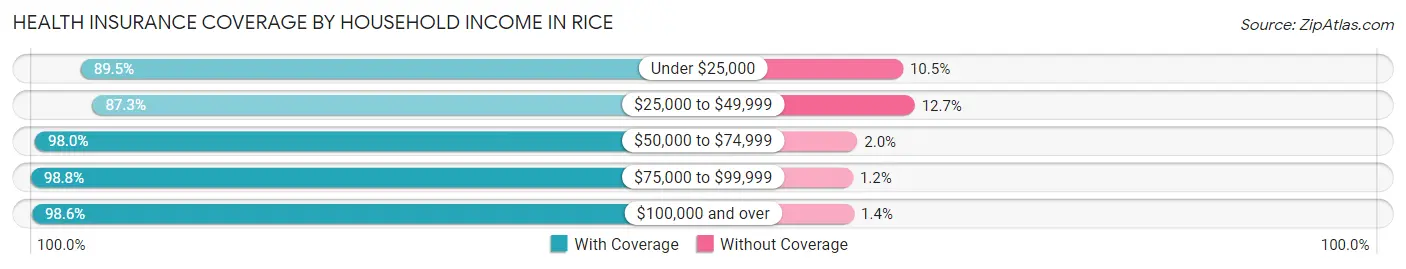
| Household Income | With Coverage | Without Coverage |
| Under $25,000 | 51 (89.5%) | 6 (10.5%) |
| $25,000 to $49,999 | 151 (87.3%) | 22 (12.7%) |
| $50,000 to $74,999 | 149 (98.0%) | 3 (2.0%) |
| $75,000 to $99,999 | 427 (98.8%) | 5 (1.2%) |
| $100,000 and over | 1,071 (98.6%) | 15 (1.4%) |
Public vs Private Health Insurance Coverage by Age in Rice
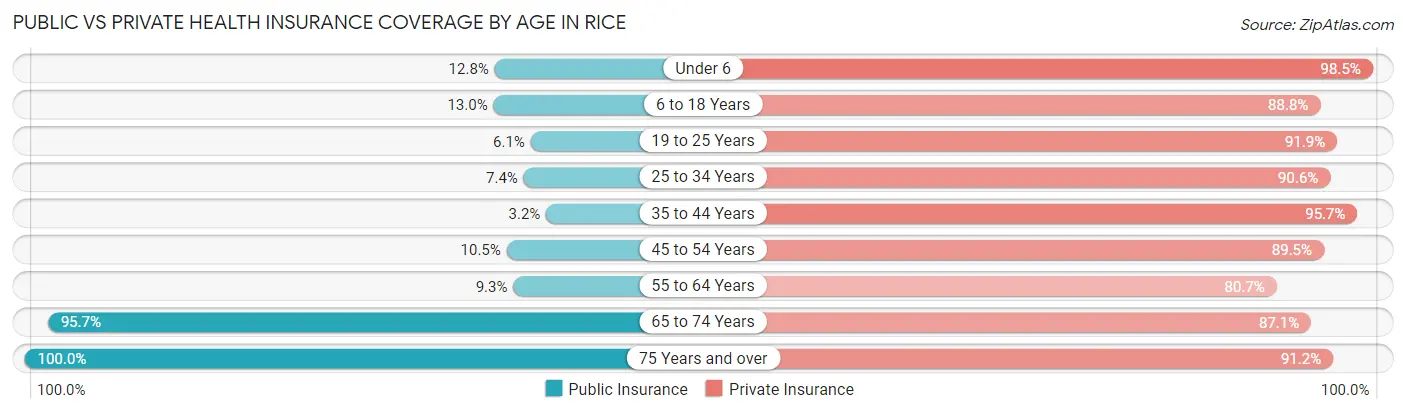
| Age Bracket | Public Insurance | Private Insurance |
| Under 6 | 26 (12.8%) | 201 (98.5%) |
| 6 to 18 Years | 52 (13.0%) | 356 (88.8%) |
| 19 to 25 Years | 6 (6.1%) | 91 (91.9%) |
| 25 to 34 Years | 22 (7.4%) | 271 (90.6%) |
| 35 to 44 Years | 14 (3.2%) | 421 (95.7%) |
| 45 to 54 Years | 20 (10.5%) | 170 (89.5%) |
| 55 to 64 Years | 13 (9.3%) | 113 (80.7%) |
| 65 to 74 Years | 89 (95.7%) | 81 (87.1%) |
| 75 Years and over | 34 (100.0%) | 31 (91.2%) |
| Total | 276 (14.5%) | 1,735 (91.3%) |
Disability Status by Sex by Age in Rice
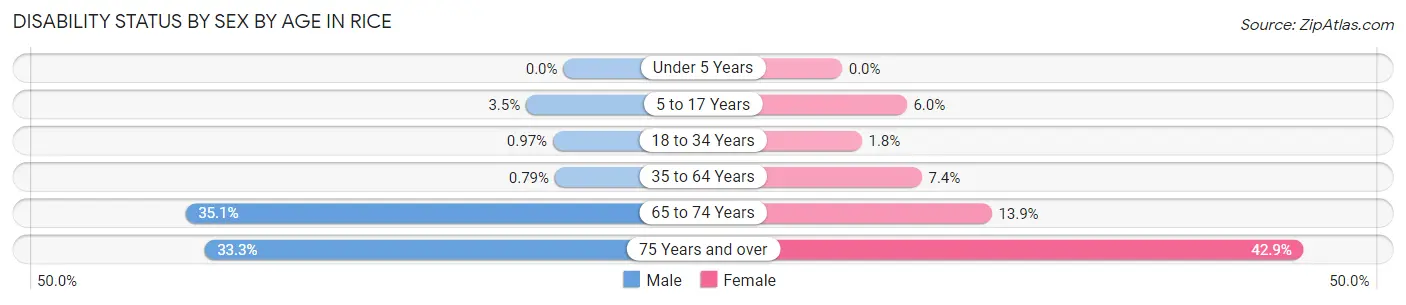
| Age Bracket | Male | Female |
| Under 5 Years | 0 (0.0%) | 0 (0.0%) |
| 5 to 17 Years | 9 (3.5%) | 9 (6.0%) |
| 18 to 34 Years | 2 (1.0%) | 4 (1.8%) |
| 35 to 64 Years | 3 (0.8%) | 29 (7.4%) |
| 65 to 74 Years | 20 (35.1%) | 5 (13.9%) |
| 75 Years and over | 2 (33.3%) | 12 (42.9%) |
Disability Class by Sex by Age in Rice
Disability Class: Hearing Difficulty
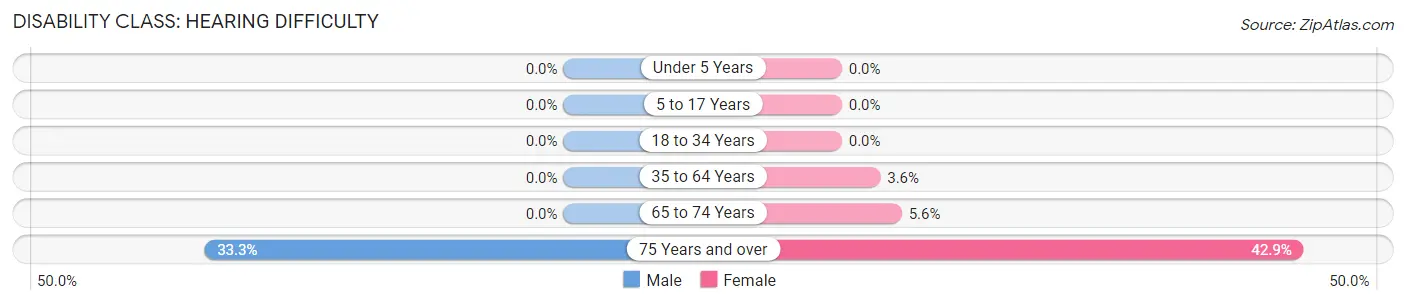
| Age Bracket | Male | Female |
| Under 5 Years | 0 (0.0%) | 0 (0.0%) |
| 5 to 17 Years | 0 (0.0%) | 0 (0.0%) |
| 18 to 34 Years | 0 (0.0%) | 0 (0.0%) |
| 35 to 64 Years | 0 (0.0%) | 14 (3.6%) |
| 65 to 74 Years | 0 (0.0%) | 2 (5.6%) |
| 75 Years and over | 2 (33.3%) | 12 (42.9%) |
Disability Class: Vision Difficulty
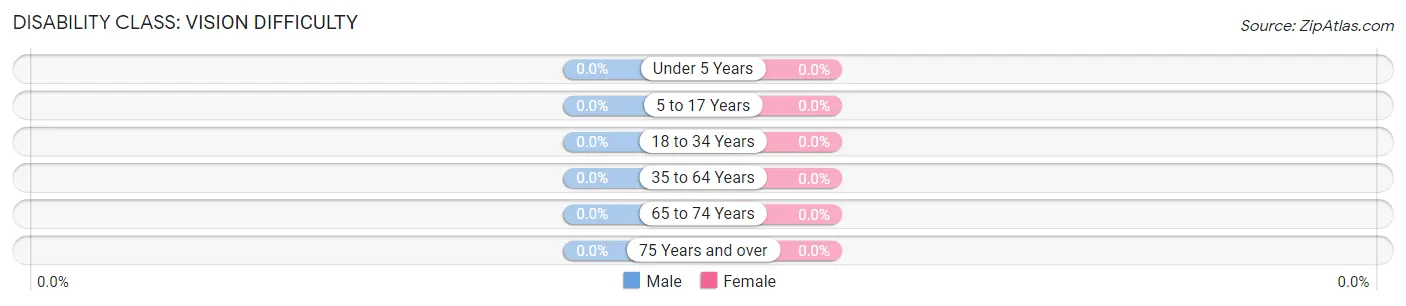
| Age Bracket | Male | Female |
| Under 5 Years | 0 (0.0%) | 0 (0.0%) |
| 5 to 17 Years | 0 (0.0%) | 0 (0.0%) |
| 18 to 34 Years | 0 (0.0%) | 0 (0.0%) |
| 35 to 64 Years | 0 (0.0%) | 0 (0.0%) |
| 65 to 74 Years | 0 (0.0%) | 0 (0.0%) |
| 75 Years and over | 0 (0.0%) | 0 (0.0%) |
Disability Class: Cognitive Difficulty
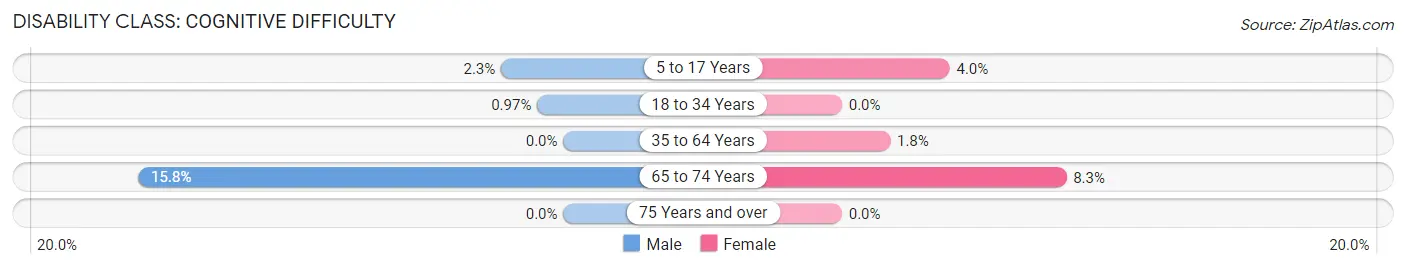
| Age Bracket | Male | Female |
| 5 to 17 Years | 6 (2.3%) | 6 (4.0%) |
| 18 to 34 Years | 2 (1.0%) | 0 (0.0%) |
| 35 to 64 Years | 0 (0.0%) | 7 (1.8%) |
| 65 to 74 Years | 9 (15.8%) | 3 (8.3%) |
| 75 Years and over | 0 (0.0%) | 0 (0.0%) |
Disability Class: Ambulatory Difficulty
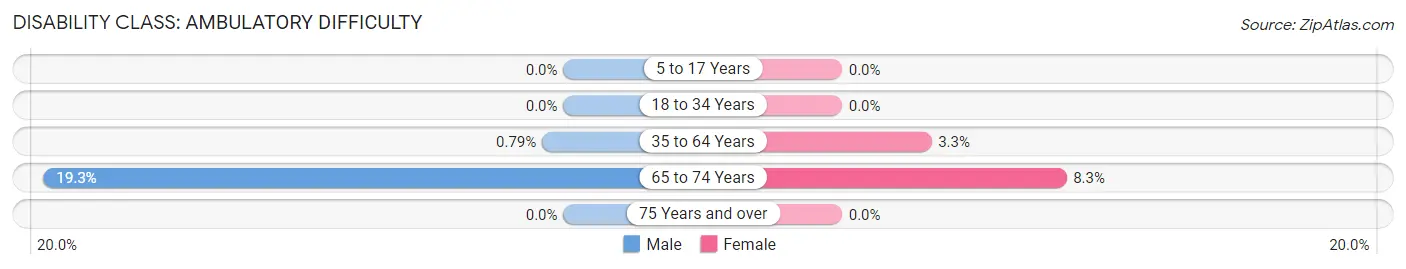
| Age Bracket | Male | Female |
| 5 to 17 Years | 0 (0.0%) | 0 (0.0%) |
| 18 to 34 Years | 0 (0.0%) | 0 (0.0%) |
| 35 to 64 Years | 3 (0.8%) | 13 (3.3%) |
| 65 to 74 Years | 11 (19.3%) | 3 (8.3%) |
| 75 Years and over | 0 (0.0%) | 0 (0.0%) |
Disability Class: Self-Care Difficulty
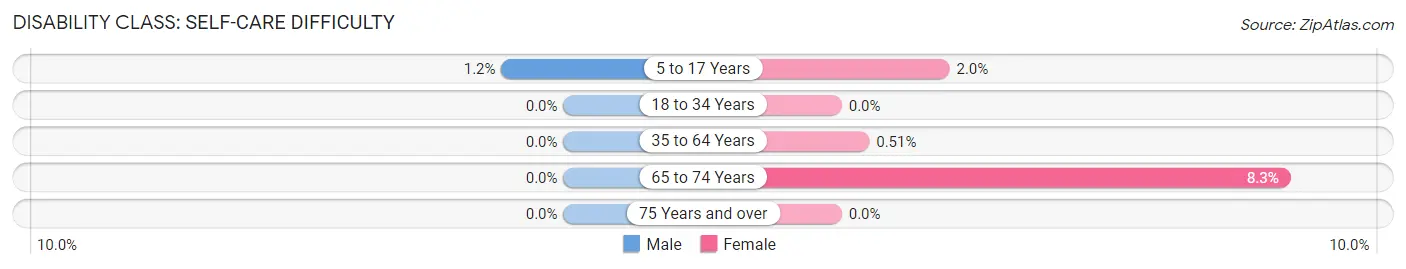
| Age Bracket | Male | Female |
| 5 to 17 Years | 3 (1.1%) | 3 (2.0%) |
| 18 to 34 Years | 0 (0.0%) | 0 (0.0%) |
| 35 to 64 Years | 0 (0.0%) | 2 (0.5%) |
| 65 to 74 Years | 0 (0.0%) | 3 (8.3%) |
| 75 Years and over | 0 (0.0%) | 0 (0.0%) |
Technology Access in Rice
Computing Device Access in Rice
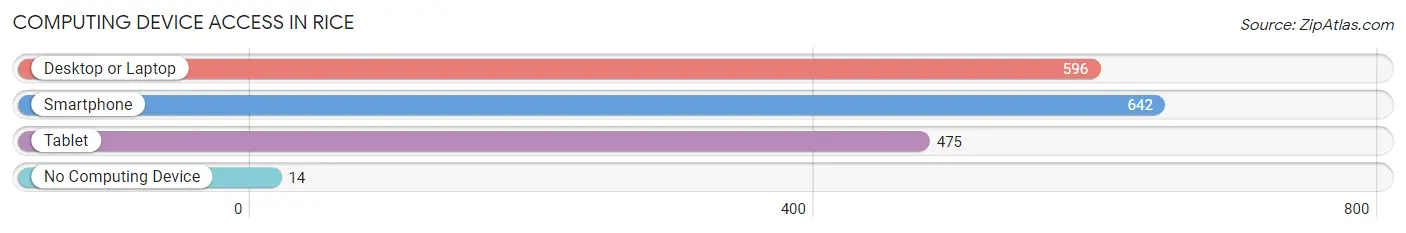
| Device Type | # Households | % Households |
| Desktop or Laptop | 596 | 89.9% |
| Smartphone | 642 | 96.8% |
| Tablet | 475 | 71.6% |
| No Computing Device | 14 | 2.1% |
| Total | 663 | 100.0% |
Internet Access in Rice
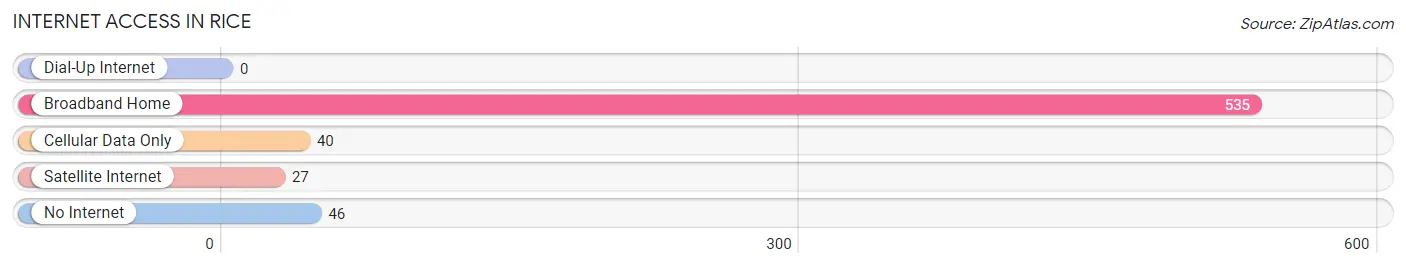
| Internet Type | # Households | % Households |
| Dial-Up Internet | 0 | 0.0% |
| Broadband Home | 535 | 80.7% |
| Cellular Data Only | 40 | 6.0% |
| Satellite Internet | 27 | 4.1% |
| No Internet | 46 | 6.9% |
| Total | 663 | 100.0% |
Rice Summary
Rice, Minnesota is a small city located in Benton County, in the central part of the state. It is situated on the banks of the Mississippi River, about 25 miles north of St. Cloud. The city has a population of 1,719 people, according to the 2010 census.
History
Rice was founded in 1856 by a group of settlers from Wisconsin. The city was named after the Rice family, who were among the first settlers. The city was incorporated in 1872.
In the late 19th century, Rice was a thriving agricultural community. The city was home to several grain mills, a creamery, and a cheese factory. The city also had a sawmill, a brickyard, and a flour mill.
In the early 20th century, Rice began to experience a decline in population. This was due to the decline of the agricultural industry in the area. The city also suffered from a lack of industry and jobs.
In the late 20th century, Rice began to experience a resurgence. The city was able to attract new businesses and industries, such as a plastics factory and a paper mill. The city also began to attract new residents, and the population began to grow again.
Geography
Rice is located in the central part of Minnesota, on the banks of the Mississippi River. The city is situated in Benton County, about 25 miles north of St. Cloud. The city has a total area of 1.2 square miles, all of which is land.
The city is located in a flat, open area, with no major hills or mountains. The city is surrounded by farmland and small towns. The nearest major city is St. Cloud, which is about 25 miles to the south.
Economy
Rice has a diverse economy, with a mix of manufacturing, retail, and service industries. The city is home to several manufacturing companies, including a plastics factory and a paper mill. The city also has several retail stores, restaurants, and other businesses.
The city is also home to several government offices, including the Benton County Courthouse and the Benton County Sheriff's Office.
Demographics
According to the 2010 census, Rice has a population of 1,719 people. The city has a median household income of $45,000, and a median age of 38. The city is predominantly white, with a small Hispanic population.
Conclusion
Rice, Minnesota is a small city located in Benton County, in the central part of the state. It is situated on the banks of the Mississippi River, about 25 miles north of St. Cloud. The city has a population of 1,719 people, according to the 2010 census. Rice has a diverse economy, with a mix of manufacturing, retail, and service industries. The city is predominantly white, with a small Hispanic population. Rice has experienced a resurgence in recent years, with new businesses and industries moving into the area. The city is also home to several government offices, including the Benton County Courthouse and the Benton County Sheriff's Office.
Common Questions
What is Per Capita Income in Rice?
Per Capita income in Rice is $34,453.
What is the Median Family Income in Rice?
Median Family Income in Rice is $103,607.
What is the Median Household income in Rice?
Median Household Income in Rice is $100,208.
What is Income or Wage Gap in Rice?
Income or Wage Gap in Rice is 14.3%.
Women in Rice earn 85.7 cents for every dollar earned by a man.
What is Inequality or Gini Index in Rice?
Inequality or Gini Index in Rice is 0.27.
What is the Total Population of Rice?
Total Population of Rice is 1,900.
What is the Total Male Population of Rice?
Total Male Population of Rice is 1,026.
What is the Total Female Population of Rice?
Total Female Population of Rice is 874.
What is the Ratio of Males per 100 Females in Rice?
There are 117.39 Males per 100 Females in Rice.
What is the Ratio of Females per 100 Males in Rice?
There are 85.19 Females per 100 Males in Rice.
What is the Median Population Age in Rice?
Median Population Age in Rice is 32.8 Years.
What is the Average Family Size in Rice
Average Family Size in Rice is 3.2 People.
What is the Average Household Size in Rice
Average Household Size in Rice is 2.9 People.
How Large is the Labor Force in Rice?
There are 1,148 People in the Labor Forcein in Rice.
What is the Percentage of People in the Labor Force in Rice?
84.2% of People are in the Labor Force in Rice.
What is the Unemployment Rate in Rice?
Unemployment Rate in Rice is 2.3%.