Walker, MN Map & Demographics
Walker Map
Walker Overview
$27,056
PER CAPITA INCOME
$68,750
AVG FAMILY INCOME
$32,857
AVG HOUSEHOLD INCOME
47.9%
WAGE / INCOME GAP [ % ]
52.1¢/ $1
WAGE / INCOME GAP [ $ ]
0.51
INEQUALITY / GINI INDEX
937
TOTAL POPULATION
363
MALE POPULATION
574
FEMALE POPULATION
63.24
MALES / 100 FEMALES
158.13
FEMALES / 100 MALES
54.0
MEDIAN AGE
2.8
AVG FAMILY SIZE
1.9
AVG HOUSEHOLD SIZE
361
LABOR FORCE [ PEOPLE ]
44.7%
PERCENT IN LABOR FORCE
7.5%
UNEMPLOYMENT RATE
Walker Zip Codes
Walker Area Codes
Income in Walker
Income Overview in Walker
Per Capita Income in Walker is $27,056, while median incomes of families and households are $68,750 and $32,857 respectively.
| Characteristic | Number | Measure |
| Per Capita Income | 937 | $27,056 |
| Median Family Income | 157 | $68,750 |
| Mean Family Income | 157 | $78,926 |
| Median Household Income | 438 | $32,857 |
| Mean Household Income | 438 | $52,318 |
| Income Deficit | 157 | $0 |
| Wage / Income Gap (%) | 937 | 47.89% |
| Wage / Income Gap ($) | 937 | 52.11¢ per $1 |
| Gini / Inequality Index | 937 | 0.51 |
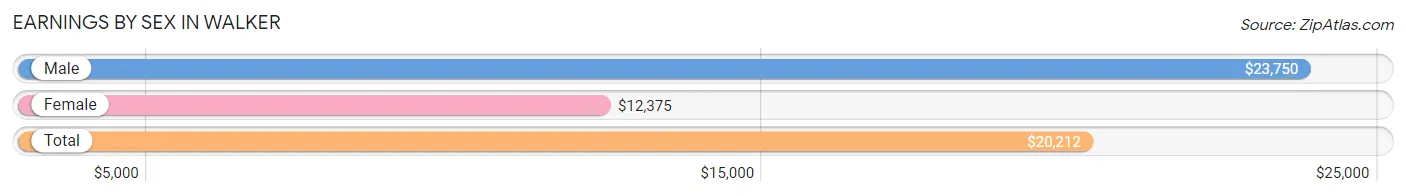
Earnings by Sex in Walker
Average Earnings in Walker are $20,212, $23,750 for men and $12,375 for women, a difference of 47.9%.
| Sex | Number | Average Earnings |
| Male | 186 (42.4%) | $23,750 |
| Female | 253 (57.6%) | $12,375 |
| Total | 439 (100.0%) | $20,212 |
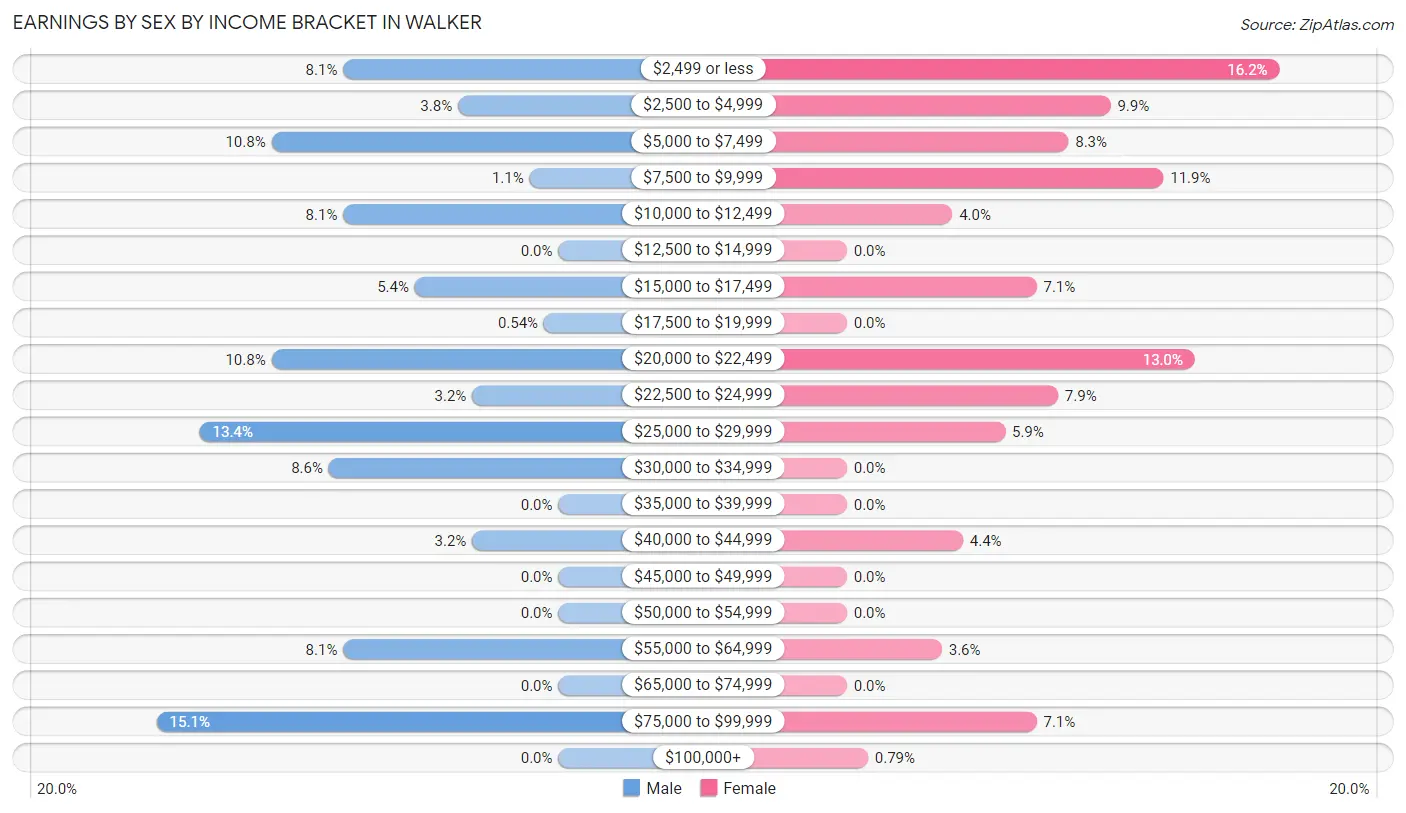
Earnings by Sex by Income Bracket in Walker
The most common earnings brackets in Walker are $75,000 to $99,999 for men (28 | 15.0%) and $2,499 or less for women (41 | 16.2%).
| Income | Male | Female |
| $2,499 or less | 15 (8.1%) | 41 (16.2%) |
| $2,500 to $4,999 | 7 (3.8%) | 25 (9.9%) |
| $5,000 to $7,499 | 20 (10.7%) | 21 (8.3%) |
| $7,500 to $9,999 | 2 (1.1%) | 30 (11.9%) |
| $10,000 to $12,499 | 15 (8.1%) | 10 (4.0%) |
| $12,500 to $14,999 | 0 (0.0%) | 0 (0.0%) |
| $15,000 to $17,499 | 10 (5.4%) | 18 (7.1%) |
| $17,500 to $19,999 | 1 (0.5%) | 0 (0.0%) |
| $20,000 to $22,499 | 20 (10.7%) | 33 (13.0%) |
| $22,500 to $24,999 | 6 (3.2%) | 20 (7.9%) |
| $25,000 to $29,999 | 25 (13.4%) | 15 (5.9%) |
| $30,000 to $34,999 | 16 (8.6%) | 0 (0.0%) |
| $35,000 to $39,999 | 0 (0.0%) | 0 (0.0%) |
| $40,000 to $44,999 | 6 (3.2%) | 11 (4.3%) |
| $45,000 to $49,999 | 0 (0.0%) | 0 (0.0%) |
| $50,000 to $54,999 | 0 (0.0%) | 0 (0.0%) |
| $55,000 to $64,999 | 15 (8.1%) | 9 (3.6%) |
| $65,000 to $74,999 | 0 (0.0%) | 0 (0.0%) |
| $75,000 to $99,999 | 28 (15.0%) | 18 (7.1%) |
| $100,000+ | 0 (0.0%) | 2 (0.8%) |
| Total | 186 (100.0%) | 253 (100.0%) |
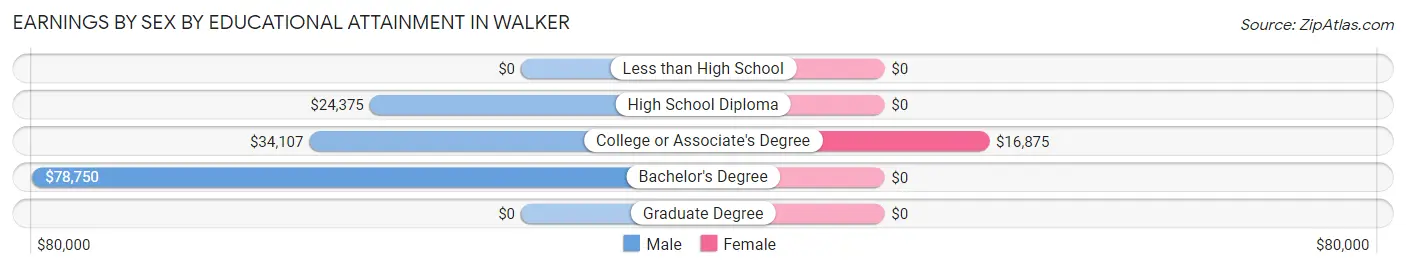
Earnings by Sex by Educational Attainment in Walker
Average earnings in Walker are $28,750 for men and $20,871 for women, a difference of 27.4%. Men with an educational attainment of bachelor's degree enjoy the highest average annual earnings of $78,750, while those with high school diploma education earn the least with $24,375. Women with an educational attainment of college or associate's degree earn the most with the average annual earnings of $16,875, while those with college or associate's degree education have the smallest earnings of $16,875.
| Educational Attainment | Male Income | Female Income |
| Less than High School | - | - |
| High School Diploma | $24,375 | $0 |
| College or Associate's Degree | $34,107 | $16,875 |
| Bachelor's Degree | $78,750 | $0 |
| Graduate Degree | - | - |
| Total | $28,750 | $20,871 |
Family Income in Walker
Family Income Brackets in Walker
According to the Walker family income data, there are 38 families falling into the $50,000 to $74,999 income range, which is the most common income bracket and makes up 24.2% of all families.
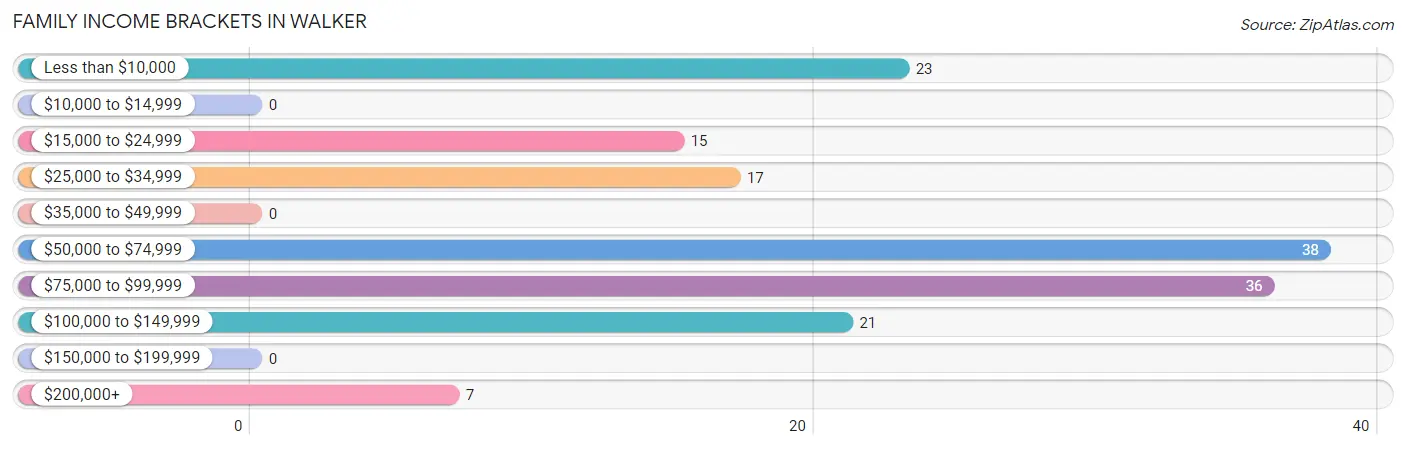
| Income Bracket | # Families | % Families |
| Less than $10,000 | 23 | 14.6% |
| $10,000 to $14,999 | 0 | 0.0% |
| $15,000 to $24,999 | 15 | 9.6% |
| $25,000 to $34,999 | 17 | 10.8% |
| $35,000 to $49,999 | 0 | 0.0% |
| $50,000 to $74,999 | 38 | 24.2% |
| $75,000 to $99,999 | 36 | 22.9% |
| $100,000 to $149,999 | 21 | 13.4% |
| $150,000 to $199,999 | 0 | 0.0% |
| $200,000+ | 7 | 4.5% |
Family Income by Famaliy Size in Walker
3-person families (32 | 20.4%) account for the highest median family income in Walker with $85,909 per family, while 2-person families (94 | 59.9%) have the highest median income of $34,464 per family member.
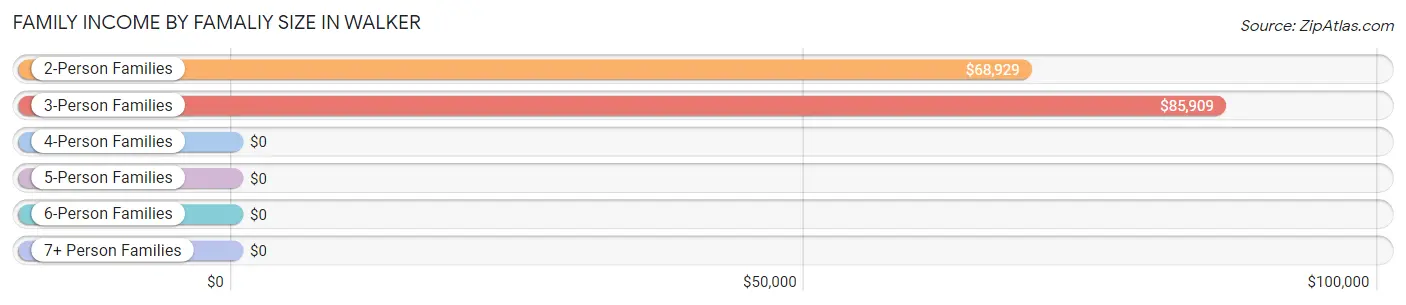
| Income Bracket | # Families | Median Income |
| 2-Person Families | 94 (59.9%) | $68,929 |
| 3-Person Families | 32 (20.4%) | $85,909 |
| 4-Person Families | 20 (12.7%) | $0 |
| 5-Person Families | 11 (7.0%) | $0 |
| 6-Person Families | 0 (0.0%) | $0 |
| 7+ Person Families | 0 (0.0%) | $0 |
| Total | 157 (100.0%) | $68,750 |
Family Income by Number of Earners in Walker
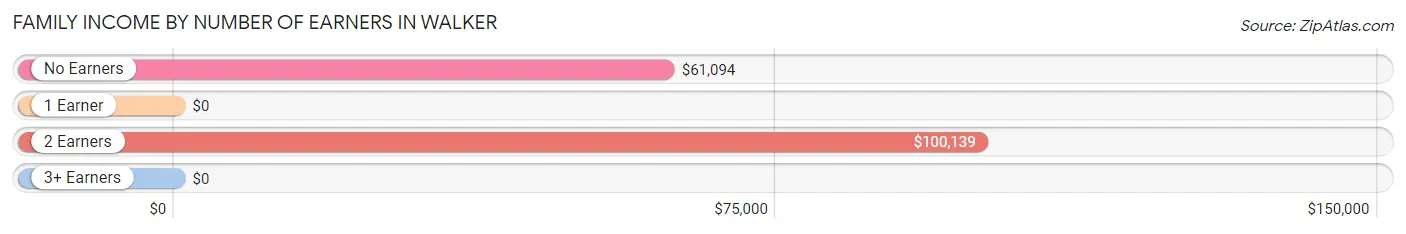
| Number of Earners | # Families | Median Income |
| No Earners | 47 (29.9%) | $61,094 |
| 1 Earner | 65 (41.4%) | $0 |
| 2 Earners | 25 (15.9%) | $100,139 |
| 3+ Earners | 20 (12.7%) | $0 |
| Total | 157 (100.0%) | $68,750 |
Household Income in Walker
Household Income Brackets in Walker
With 80 households falling in the category, the $50,000 to $74,999 income range is the most frequent in Walker, accounting for 18.3% of all households. In contrast, only 7 households (1.6%) fall into the $200,000+ income bracket, making it the least populous group.
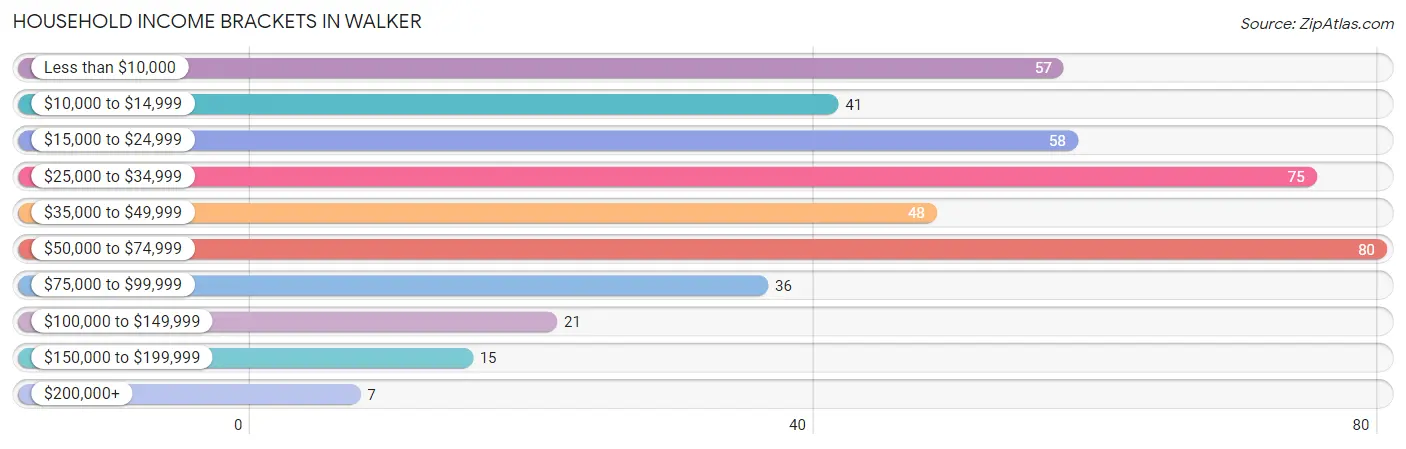
| Income Bracket | # Households | % Households |
| Less than $10,000 | 57 | 13.0% |
| $10,000 to $14,999 | 41 | 9.4% |
| $15,000 to $24,999 | 58 | 13.2% |
| $25,000 to $34,999 | 75 | 17.1% |
| $35,000 to $49,999 | 48 | 11.0% |
| $50,000 to $74,999 | 80 | 18.3% |
| $75,000 to $99,999 | 36 | 8.2% |
| $100,000 to $149,999 | 21 | 4.8% |
| $150,000 to $199,999 | 15 | 3.4% |
| $200,000+ | 7 | 1.6% |
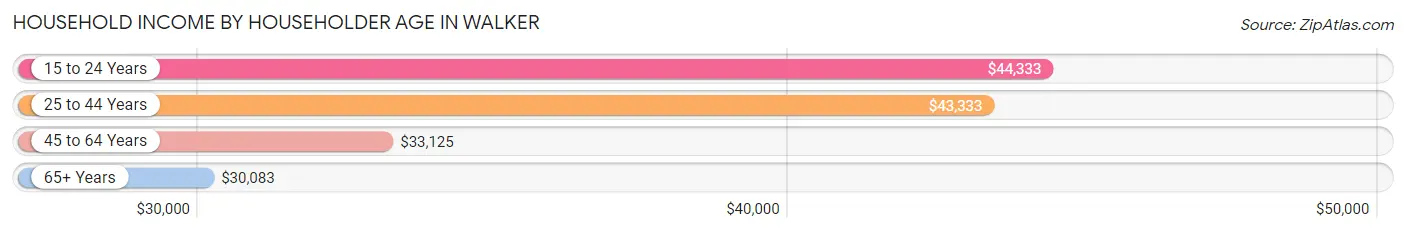
Household Income by Householder Age in Walker
The median household income in Walker is $32,857, with the highest median household income of $44,333 found in the 15 to 24 years age bracket for the primary householder. A total of 32 households (7.3%) fall into this category. Meanwhile, the 65+ years age bracket for the primary householder has the lowest median household income of $30,083, with 195 households (44.5%) in this group.
| Income Bracket | # Households | Median Income |
| 15 to 24 Years | 32 (7.3%) | $44,333 |
| 25 to 44 Years | 60 (13.7%) | $43,333 |
| 45 to 64 Years | 151 (34.5%) | $33,125 |
| 65+ Years | 195 (44.5%) | $30,083 |
| Total | 438 (100.0%) | $32,857 |
Poverty in Walker
Income Below Poverty by Sex and Age in Walker
With 18.2% poverty level for males and 36.5% for females among the residents of Walker, under 5 year old males and under 5 year old females are the most vulnerable to poverty, with 10 males (100.0%) and 41 females (100.0%) in their respective age groups living below the poverty level.
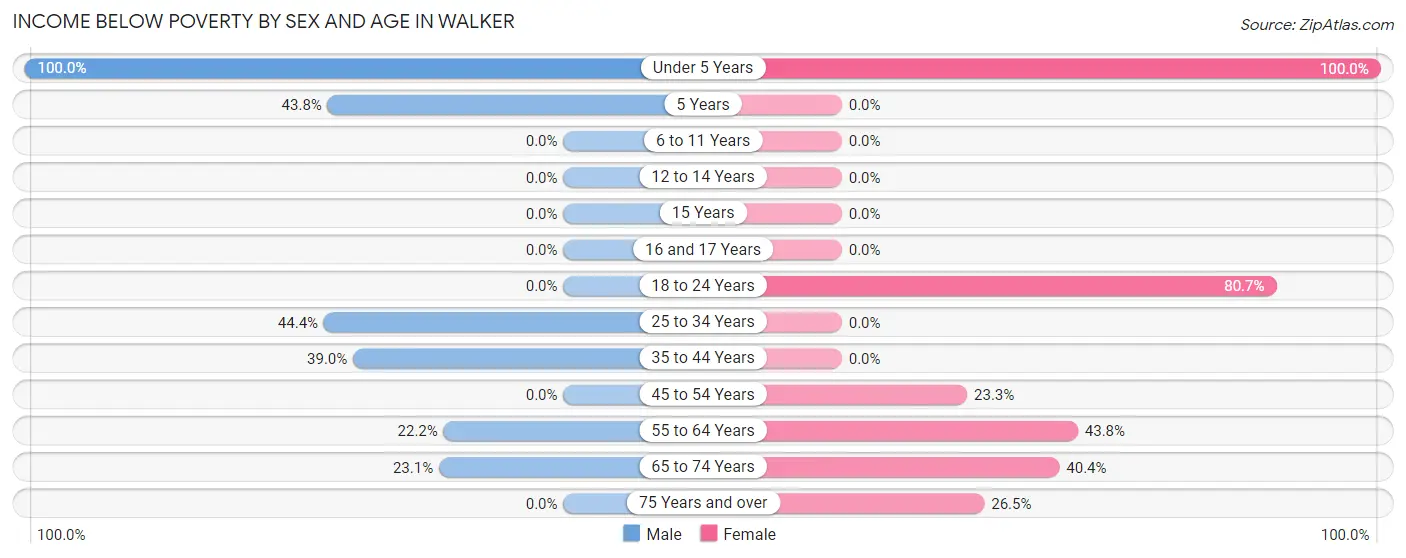
| Age Bracket | Male | Female |
| Under 5 Years | 10 (100.0%) | 41 (100.0%) |
| 5 Years | 7 (43.8%) | 0 (0.0%) |
| 6 to 11 Years | 0 (0.0%) | 0 (0.0%) |
| 12 to 14 Years | 0 (0.0%) | 0 (0.0%) |
| 15 Years | 0 (0.0%) | 0 (0.0%) |
| 16 and 17 Years | 0 (0.0%) | 0 (0.0%) |
| 18 to 24 Years | 0 (0.0%) | 50 (80.6%) |
| 25 to 34 Years | 12 (44.4%) | 0 (0.0%) |
| 35 to 44 Years | 16 (39.0%) | 0 (0.0%) |
| 45 to 54 Years | 0 (0.0%) | 10 (23.3%) |
| 55 to 64 Years | 8 (22.2%) | 39 (43.8%) |
| 65 to 74 Years | 3 (23.1%) | 21 (40.4%) |
| 75 Years and over | 0 (0.0%) | 32 (26.5%) |
| Total | 56 (18.2%) | 193 (36.5%) |
Income Above Poverty by Sex and Age in Walker
According to the poverty statistics in Walker, males aged 15 years and females aged 6 to 11 years are the age groups that are most secure financially, with 100.0% of males and 100.0% of females in these age groups living above the poverty line.
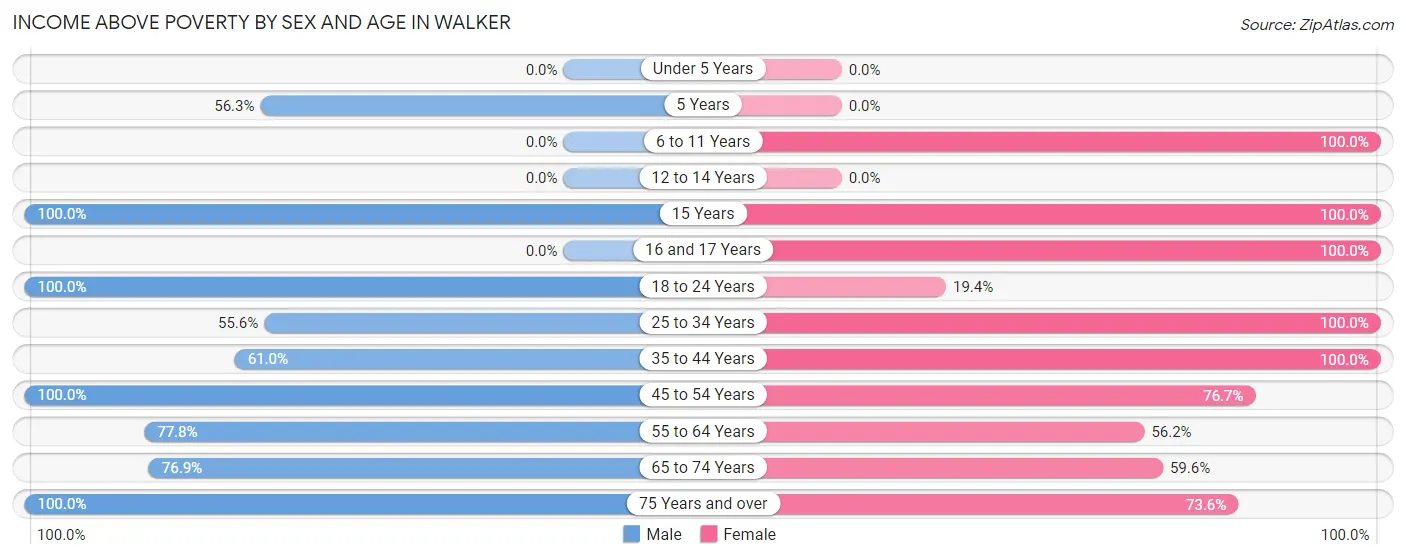
| Age Bracket | Male | Female |
| Under 5 Years | 0 (0.0%) | 0 (0.0%) |
| 5 Years | 9 (56.2%) | 0 (0.0%) |
| 6 to 11 Years | 0 (0.0%) | 15 (100.0%) |
| 12 to 14 Years | 0 (0.0%) | 0 (0.0%) |
| 15 Years | 16 (100.0%) | 12 (100.0%) |
| 16 and 17 Years | 0 (0.0%) | 22 (100.0%) |
| 18 to 24 Years | 31 (100.0%) | 12 (19.4%) |
| 25 to 34 Years | 15 (55.6%) | 48 (100.0%) |
| 35 to 44 Years | 25 (61.0%) | 23 (100.0%) |
| 45 to 54 Years | 41 (100.0%) | 33 (76.7%) |
| 55 to 64 Years | 28 (77.8%) | 50 (56.2%) |
| 65 to 74 Years | 10 (76.9%) | 31 (59.6%) |
| 75 Years and over | 76 (100.0%) | 89 (73.6%) |
| Total | 251 (81.8%) | 335 (63.4%) |
Income Below Poverty Among Married-Couple Families in Walker
The poverty statistics for married-couple families in Walker show that 7.4% or 6 of the total 81 families live below the poverty line. Families with no children have the highest poverty rate of 8.6%, comprising of 6 families. On the other hand, families with 3 or 4 children have the lowest poverty rate of 0.0%, which includes 0 families.
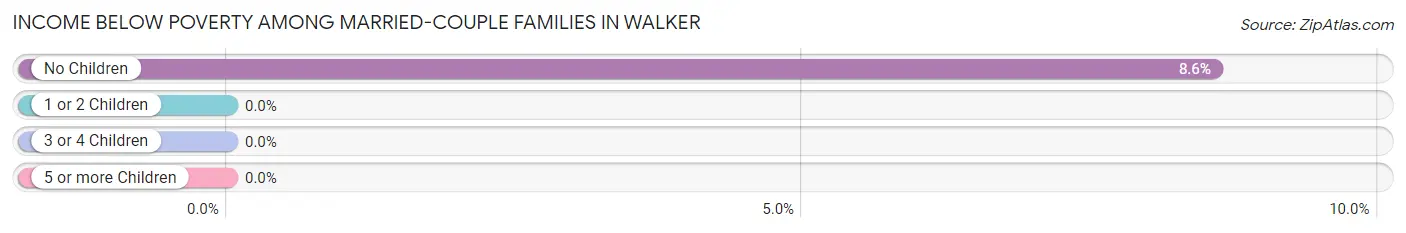
| Children | Above Poverty | Below Poverty |
| No Children | 64 (91.4%) | 6 (8.6%) |
| 1 or 2 Children | 0 (0.0%) | 0 (0.0%) |
| 3 or 4 Children | 11 (100.0%) | 0 (0.0%) |
| 5 or more Children | 0 (0.0%) | 0 (0.0%) |
| Total | 75 (92.6%) | 6 (7.4%) |
Income Below Poverty Among Single-Parent Households in Walker
According to the poverty data in Walker, 40.0% or 12 single-father households and 43.5% or 20 single-mother households are living below the poverty line. Among single-father households, those with 1 or 2 children have the highest poverty rate, with 12 households (40.0%) experiencing poverty. Likewise, among single-mother households, those with 3 or 4 children have the highest poverty rate, with 20 households (100.0%) falling below the poverty line.
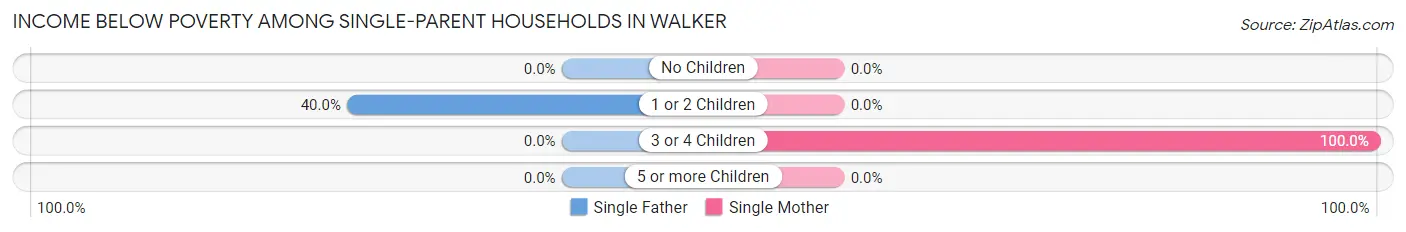
| Children | Single Father | Single Mother |
| No Children | 0 (0.0%) | 0 (0.0%) |
| 1 or 2 Children | 12 (40.0%) | 0 (0.0%) |
| 3 or 4 Children | 0 (0.0%) | 20 (100.0%) |
| 5 or more Children | 0 (0.0%) | 0 (0.0%) |
| Total | 12 (40.0%) | 20 (43.5%) |
Income Below Poverty Among Married-Couple vs Single-Parent Households in Walker
The poverty data for Walker shows that 6 of the married-couple family households (7.4%) and 32 of the single-parent households (42.1%) are living below the poverty level. Within the married-couple family households, those with no children have the highest poverty rate, with 6 households (8.6%) falling below the poverty line. Among the single-parent households, those with 3 or 4 children have the highest poverty rate, with 20 household (100.0%) living below poverty.
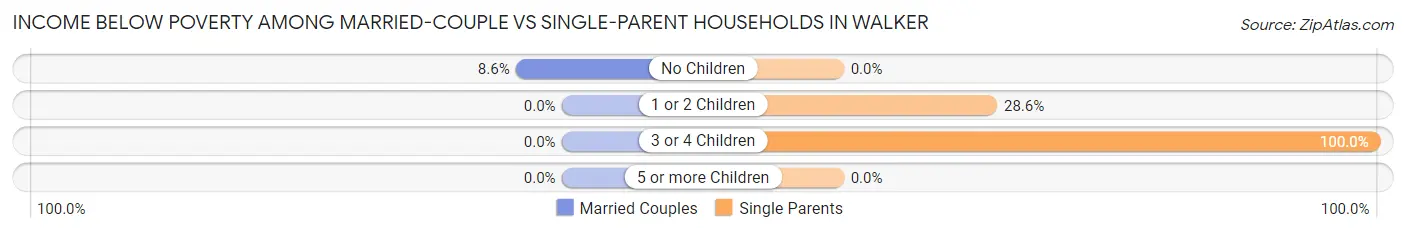
| Children | Married-Couple Families | Single-Parent Households |
| No Children | 6 (8.6%) | 0 (0.0%) |
| 1 or 2 Children | 0 (0.0%) | 12 (28.6%) |
| 3 or 4 Children | 0 (0.0%) | 20 (100.0%) |
| 5 or more Children | 0 (0.0%) | 0 (0.0%) |
| Total | 6 (7.4%) | 32 (42.1%) |
Race in Walker
The most populous races in Walker are White / Caucasian (720 | 76.8%), Native / Alaskan (152 | 16.2%), and Two or more Races (58 | 6.2%).
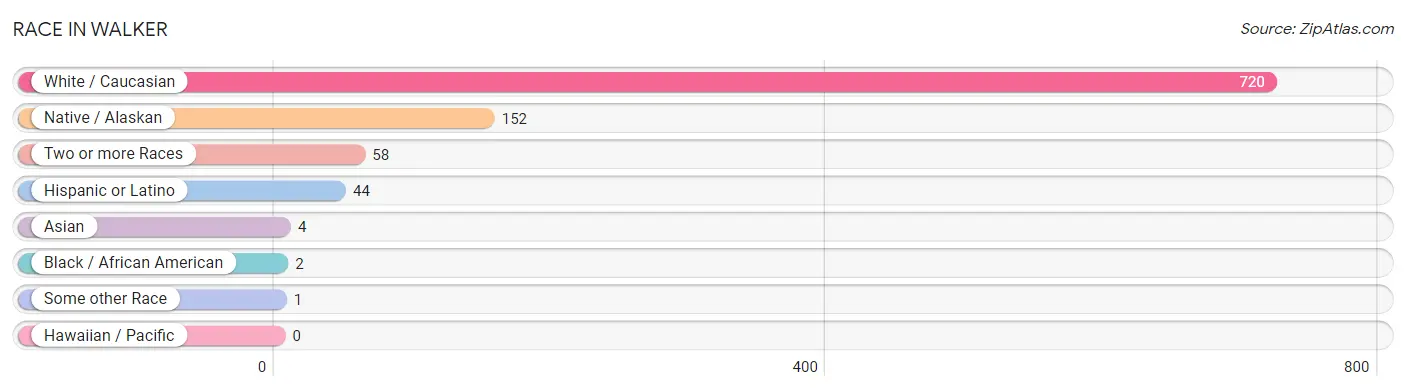
| Race | # Population | % Population |
| Asian | 4 | 0.4% |
| Black / African American | 2 | 0.2% |
| Hawaiian / Pacific | 0 | 0.0% |
| Hispanic or Latino | 44 | 4.7% |
| Native / Alaskan | 152 | 16.2% |
| White / Caucasian | 720 | 76.8% |
| Two or more Races | 58 | 6.2% |
| Some other Race | 1 | 0.1% |
| Total | 937 | 100.0% |
Ancestry in Walker
The most populous ancestries reported in Walker are German (262 | 28.0%), Chippewa (141 | 15.0%), Norwegian (112 | 11.9%), Irish (91 | 9.7%), and Swedish (62 | 6.6%), together accounting for 71.3% of all Walker residents.
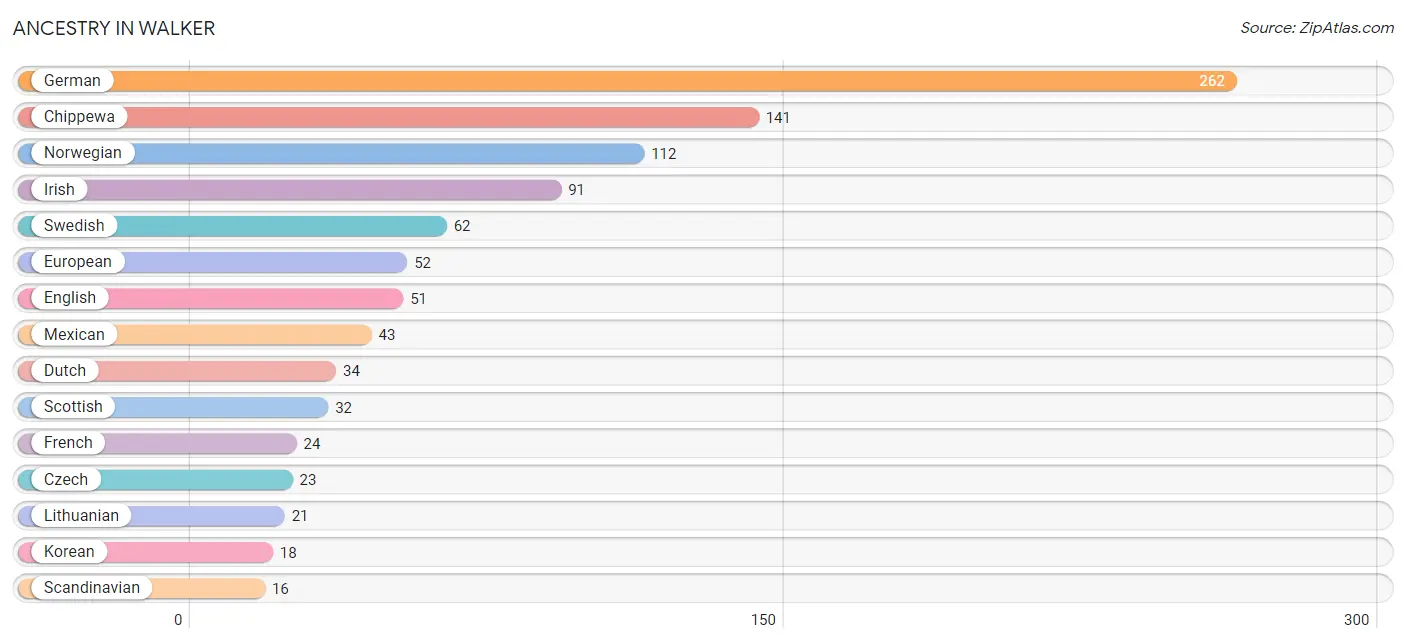
| Ancestry | # Population | % Population |
| American | 3 | 0.3% |
| Central American | 1 | 0.1% |
| Chippewa | 141 | 15.0% |
| Czech | 23 | 2.5% |
| Danish | 10 | 1.1% |
| Dutch | 34 | 3.6% |
| English | 51 | 5.4% |
| Ethiopian | 1 | 0.1% |
| European | 52 | 5.6% |
| French | 24 | 2.6% |
| French Canadian | 2 | 0.2% |
| German | 262 | 28.0% |
| Guatemalan | 1 | 0.1% |
| Irish | 91 | 9.7% |
| Italian | 11 | 1.2% |
| Korean | 18 | 1.9% |
| Lithuanian | 21 | 2.2% |
| Mexican | 43 | 4.6% |
| Mexican American Indian | 7 | 0.7% |
| Northern European | 4 | 0.4% |
| Norwegian | 112 | 11.9% |
| Polish | 3 | 0.3% |
| Scandinavian | 16 | 1.7% |
| Scotch-Irish | 1 | 0.1% |
| Scottish | 32 | 3.4% |
| Subsaharan African | 1 | 0.1% |
| Swedish | 62 | 6.6% |
| Welsh | 2 | 0.2% | View All 28 Rows |
Immigrants in Walker
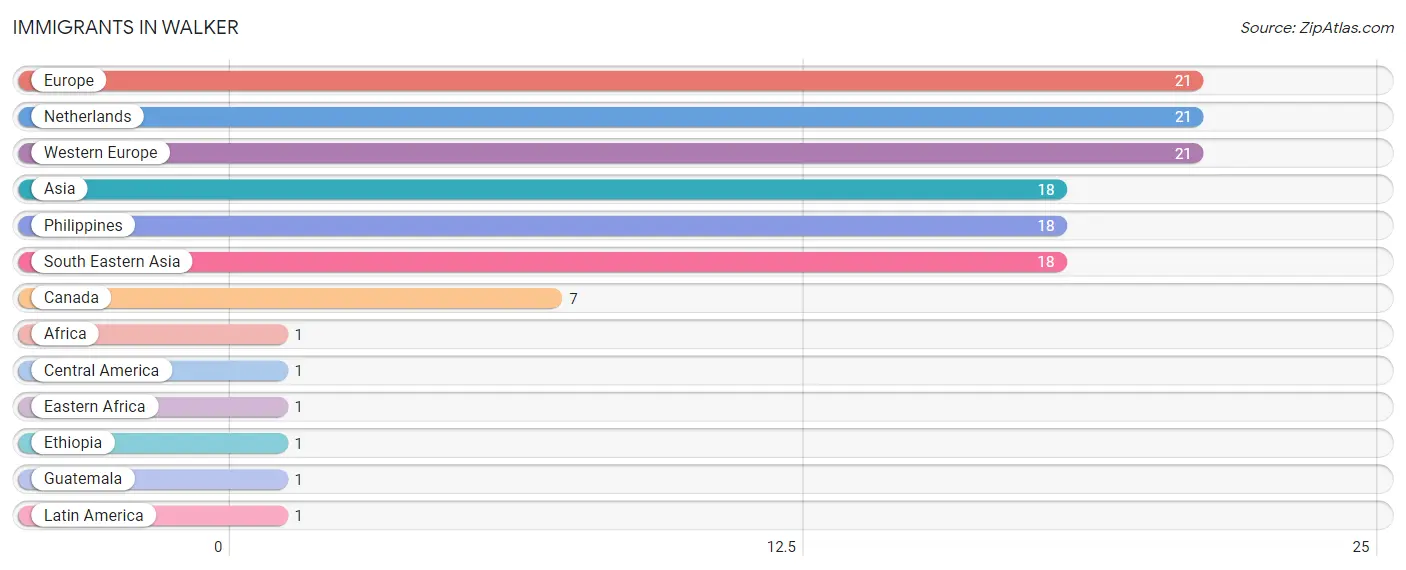
The most numerous immigrant groups reported in Walker came from Europe (21 | 2.2%), Netherlands (21 | 2.2%), Western Europe (21 | 2.2%), Asia (18 | 1.9%), and Philippines (18 | 1.9%), together accounting for 10.6% of all Walker residents.
| Immigration Origin | # Population | % Population |
| Africa | 1 | 0.1% |
| Asia | 18 | 1.9% |
| Canada | 7 | 0.7% |
| Central America | 1 | 0.1% |
| Eastern Africa | 1 | 0.1% |
| Ethiopia | 1 | 0.1% |
| Europe | 21 | 2.2% |
| Guatemala | 1 | 0.1% |
| Latin America | 1 | 0.1% |
| Netherlands | 21 | 2.2% |
| Philippines | 18 | 1.9% |
| South Eastern Asia | 18 | 1.9% |
| Western Europe | 21 | 2.2% | View All 13 Rows |
Sex and Age in Walker
Sex and Age in Walker
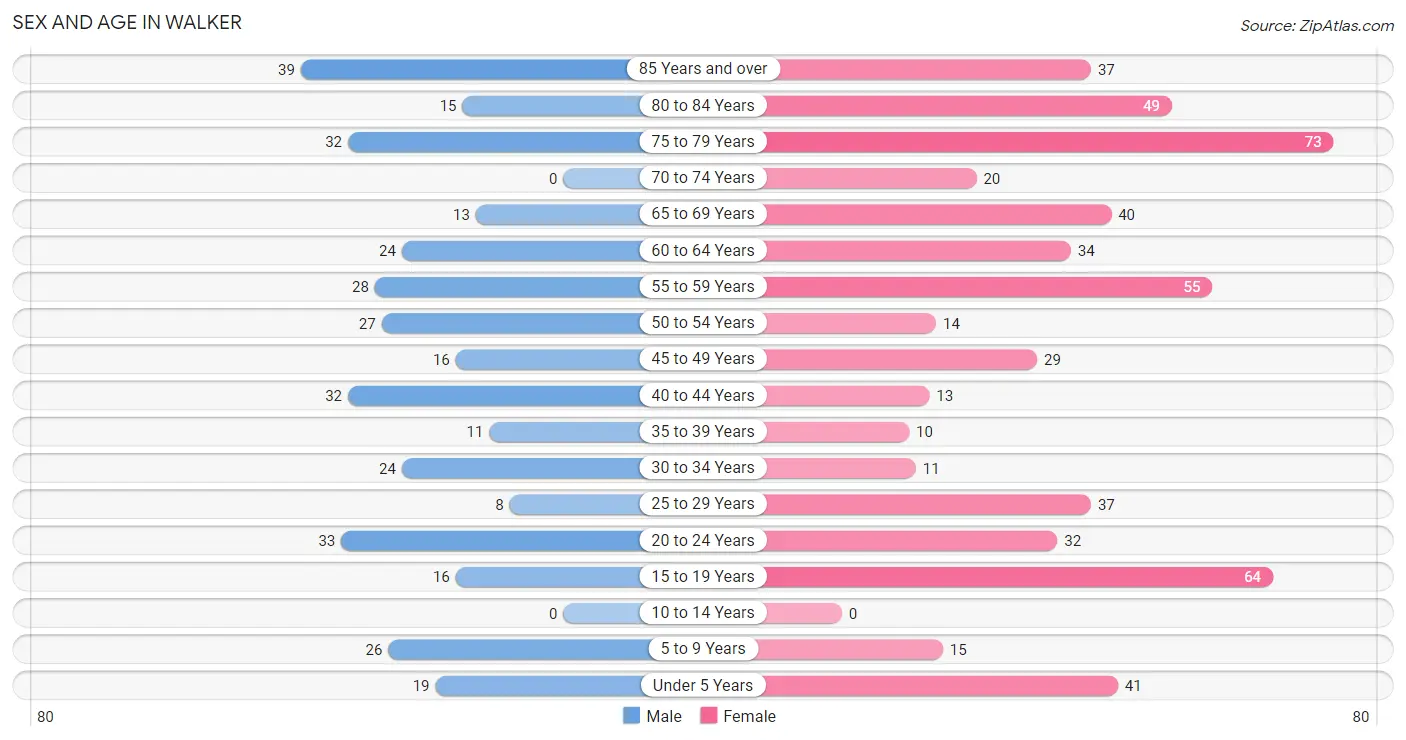
The most populous age groups in Walker are 85 Years and over (39 | 10.7%) for men and 75 to 79 Years (73 | 12.7%) for women.
| Age Bracket | Male | Female |
| Under 5 Years | 19 (5.2%) | 41 (7.1%) |
| 5 to 9 Years | 26 (7.2%) | 15 (2.6%) |
| 10 to 14 Years | 0 (0.0%) | 0 (0.0%) |
| 15 to 19 Years | 16 (4.4%) | 64 (11.2%) |
| 20 to 24 Years | 33 (9.1%) | 32 (5.6%) |
| 25 to 29 Years | 8 (2.2%) | 37 (6.5%) |
| 30 to 34 Years | 24 (6.6%) | 11 (1.9%) |
| 35 to 39 Years | 11 (3.0%) | 10 (1.7%) |
| 40 to 44 Years | 32 (8.8%) | 13 (2.3%) |
| 45 to 49 Years | 16 (4.4%) | 29 (5.1%) |
| 50 to 54 Years | 27 (7.4%) | 14 (2.4%) |
| 55 to 59 Years | 28 (7.7%) | 55 (9.6%) |
| 60 to 64 Years | 24 (6.6%) | 34 (5.9%) |
| 65 to 69 Years | 13 (3.6%) | 40 (7.0%) |
| 70 to 74 Years | 0 (0.0%) | 20 (3.5%) |
| 75 to 79 Years | 32 (8.8%) | 73 (12.7%) |
| 80 to 84 Years | 15 (4.1%) | 49 (8.5%) |
| 85 Years and over | 39 (10.7%) | 37 (6.5%) |
| Total | 363 (100.0%) | 574 (100.0%) |
Families and Households in Walker
Median Family Size in Walker
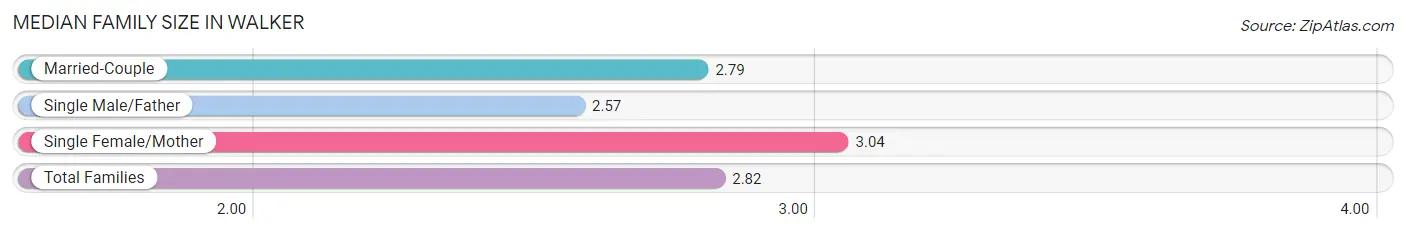
The median family size in Walker is 2.82 persons per family, with single female/mother families (46 | 29.3%) accounting for the largest median family size of 3.04 persons per family. On the other hand, single male/father families (30 | 19.1%) represent the smallest median family size with 2.57 persons per family.
| Family Type | # Families | Family Size |
| Married-Couple | 81 (51.6%) | 2.79 |
| Single Male/Father | 30 (19.1%) | 2.57 |
| Single Female/Mother | 46 (29.3%) | 3.04 |
| Total Families | 157 (100.0%) | 2.82 |
Median Household Size in Walker
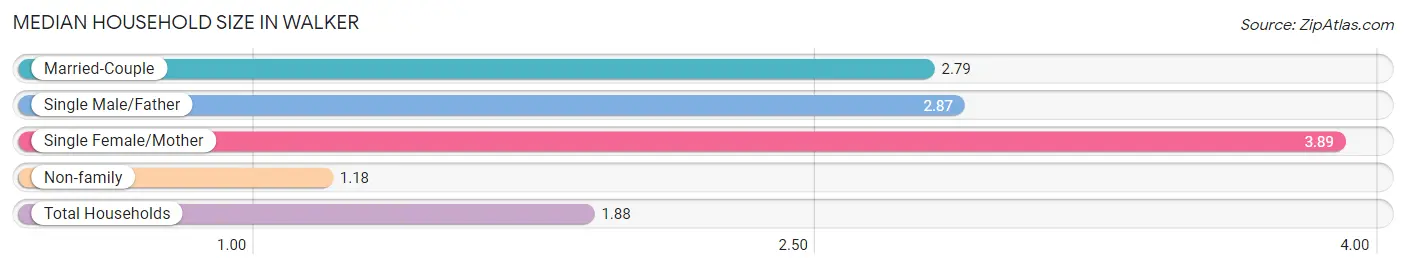
The median household size in Walker is 1.88 persons per household, with single female/mother households (46 | 10.5%) accounting for the largest median household size of 3.89 persons per household. non-family households (281 | 64.2%) represent the smallest median household size with 1.18 persons per household.
| Household Type | # Households | Household Size |
| Married-Couple | 81 (18.5%) | 2.79 |
| Single Male/Father | 30 (6.9%) | 2.87 |
| Single Female/Mother | 46 (10.5%) | 3.89 |
| Non-family | 281 (64.2%) | 1.18 |
| Total Households | 438 (100.0%) | 1.88 |
Household Size by Marriage Status in Walker
Out of a total of 438 households in Walker, 157 (35.8%) are family households, while 281 (64.2%) are nonfamily households. The most numerous type of family households are 2-person households, comprising 80, and the most common type of nonfamily households are 1-person households, comprising 256.
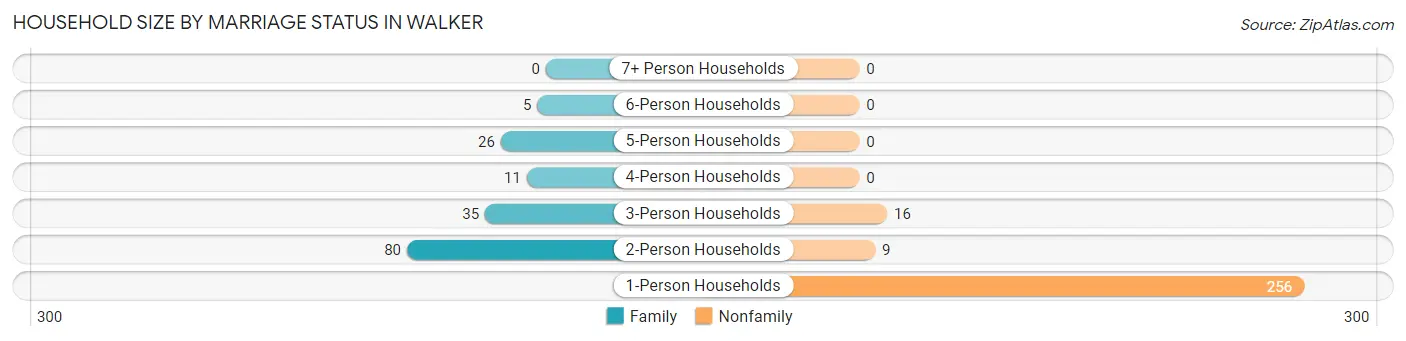
| Household Size | Family Households | Nonfamily Households |
| 1-Person Households | - | 256 (58.5%) |
| 2-Person Households | 80 (18.3%) | 9 (2.1%) |
| 3-Person Households | 35 (8.0%) | 16 (3.6%) |
| 4-Person Households | 11 (2.5%) | 0 (0.0%) |
| 5-Person Households | 26 (5.9%) | 0 (0.0%) |
| 6-Person Households | 5 (1.1%) | 0 (0.0%) |
| 7+ Person Households | 0 (0.0%) | 0 (0.0%) |
| Total | 157 (35.8%) | 281 (64.2%) |
Female Fertility in Walker
Fertility by Age in Walker
Average fertility rate in Walker is 102.0 births per 1,000 women. Women in the age bracket of 20 to 34 years have the highest fertility rate with 250.0 births per 1,000 women. Women in the age bracket of 20 to 34 years acount for 100.0% of all women with births.
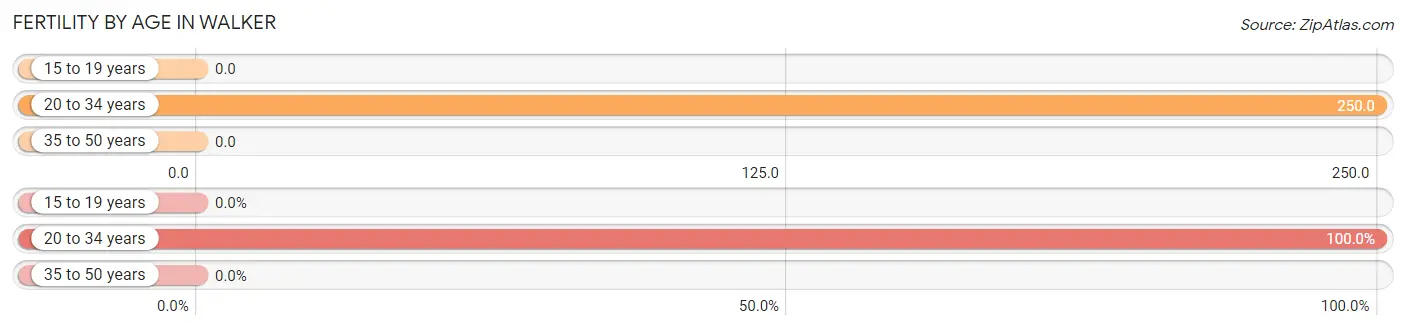
| Age Bracket | Women with Births | Births / 1,000 Women |
| 15 to 19 years | 0 (0.0%) | 0.0 |
| 20 to 34 years | 20 (100.0%) | 250.0 |
| 35 to 50 years | 0 (0.0%) | 0.0 |
| Total | 20 (100.0%) | 102.0 |
Fertility by Age by Marriage Status in Walker
25.0% of women with births (20) in Walker are married. The highest percentage of unmarried women with births falls into 20 to 34 years age bracket with 75.0% of them unmarried at the time of birth, while the lowest percentage of unmarried women with births belong to 20 to 34 years age bracket with 75.0% of them unmarried.
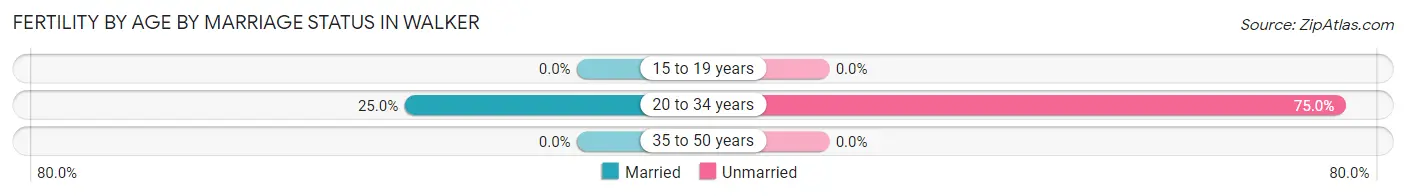
| Age Bracket | Married | Unmarried |
| 15 to 19 years | 0 (0.0%) | 0 (0.0%) |
| 20 to 34 years | 5 (25.0%) | 15 (75.0%) |
| 35 to 50 years | 0 (0.0%) | 0 (0.0%) |
| Total | 5 (25.0%) | 15 (75.0%) |
Fertility by Education in Walker
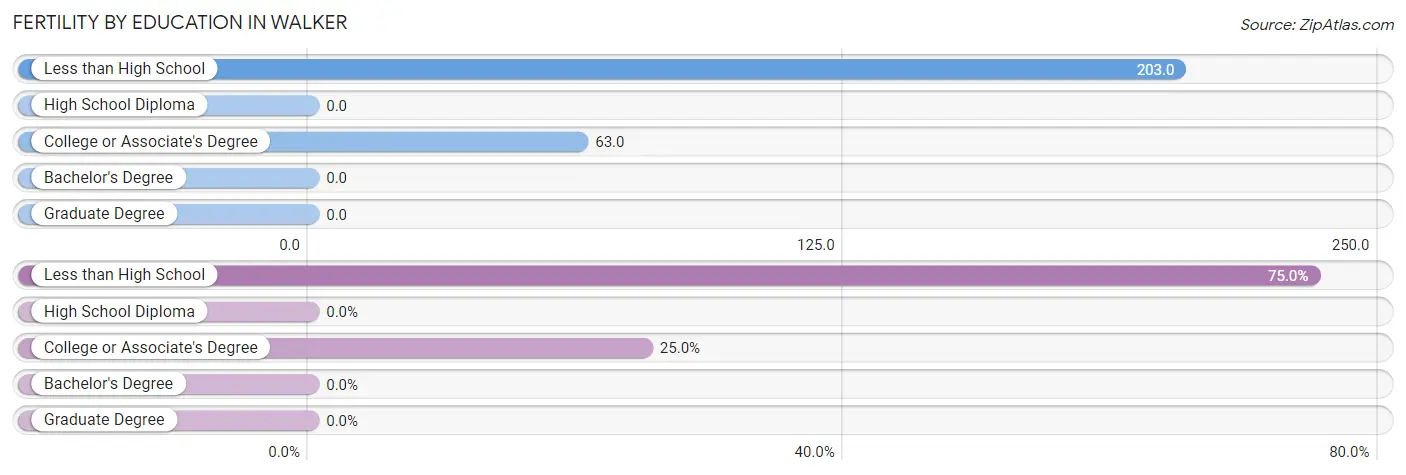
| Educational Attainment | Women with Births | Births / 1,000 Women |
| Less than High School | 15 (75.0%) | 203.0 |
| High School Diploma | 0 (0.0%) | 0.0 |
| College or Associate's Degree | 5 (25.0%) | 63.0 |
| Bachelor's Degree | 0 (0.0%) | 0.0 |
| Graduate Degree | 0 (0.0%) | 0.0 |
| Total | 20 (100.0%) | 102.0 |
Fertility by Education by Marriage Status in Walker
75.0% of women with births in Walker are unmarried. Women with the educational attainment of college or associate's degree are most likely to be married with 100.0% of them married at childbirth, while women with the educational attainment of less than high school are least likely to be married with 100.0% of them unmarried at childbirth.
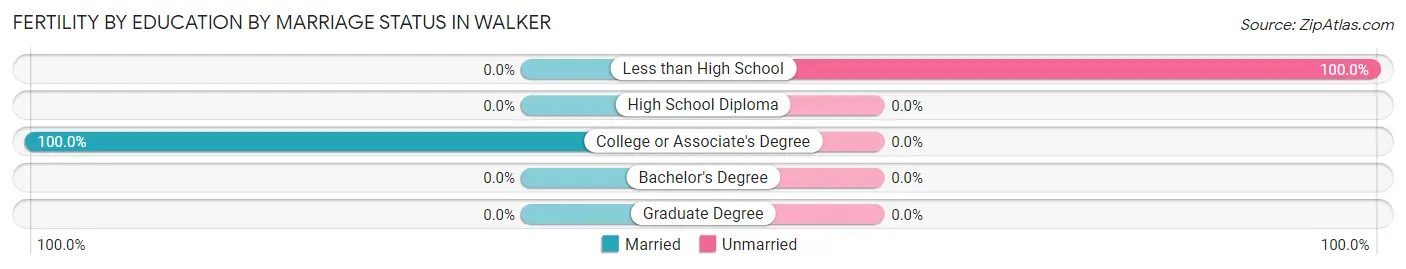
| Educational Attainment | Married | Unmarried |
| Less than High School | 0 (0.0%) | 15 (100.0%) |
| High School Diploma | 0 (0.0%) | 0 (0.0%) |
| College or Associate's Degree | 5 (100.0%) | 0 (0.0%) |
| Bachelor's Degree | 0 (0.0%) | 0 (0.0%) |
| Graduate Degree | 0 (0.0%) | 0 (0.0%) |
| Total | 5 (25.0%) | 15 (75.0%) |
Employment Characteristics in Walker
Employment by Class of Employer in Walker
Among the 334 employed individuals in Walker, private company employees (231 | 69.2%), local government employees (37 | 11.1%), and state government employees (24 | 7.2%) make up the most common classes of employment.
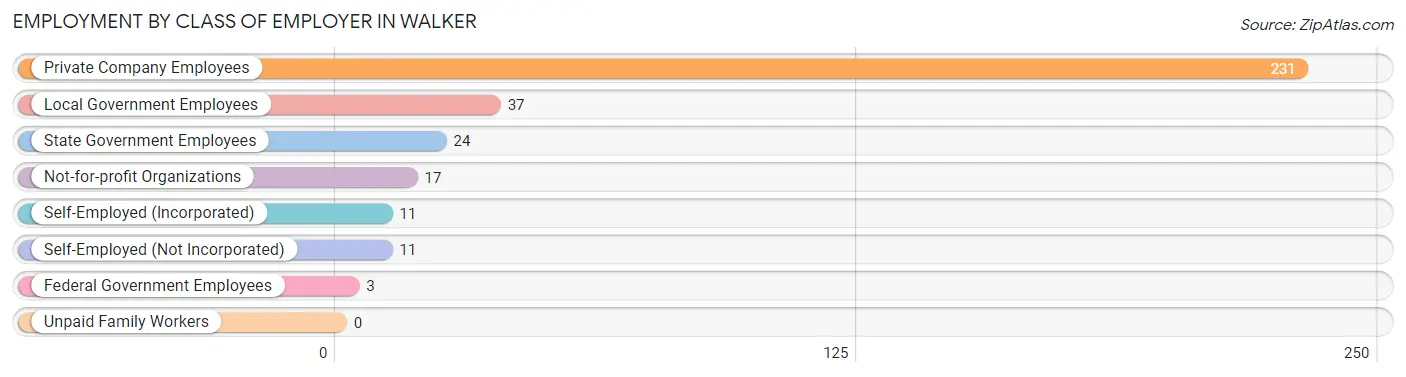
| Employer Class | # Employees | % Employees |
| Private Company Employees | 231 | 69.2% |
| Self-Employed (Incorporated) | 11 | 3.3% |
| Self-Employed (Not Incorporated) | 11 | 3.3% |
| Not-for-profit Organizations | 17 | 5.1% |
| Local Government Employees | 37 | 11.1% |
| State Government Employees | 24 | 7.2% |
| Federal Government Employees | 3 | 0.9% |
| Unpaid Family Workers | 0 | 0.0% |
| Total | 334 | 100.0% |
Employment Status by Age in Walker
According to the labor force statistics for Walker, out of the total population over 16 years of age (808), 44.7% or 361 individuals are in the labor force, with 7.5% or 27 of them unemployed. The age group with the highest labor force participation rate is 16 to 19 years, with 100.0% or 52 individuals in the labor force. Within the labor force, the 65 to 74 years age range has the highest percentage of unemployed individuals, with 70.0% or 21 of them being unemployed.
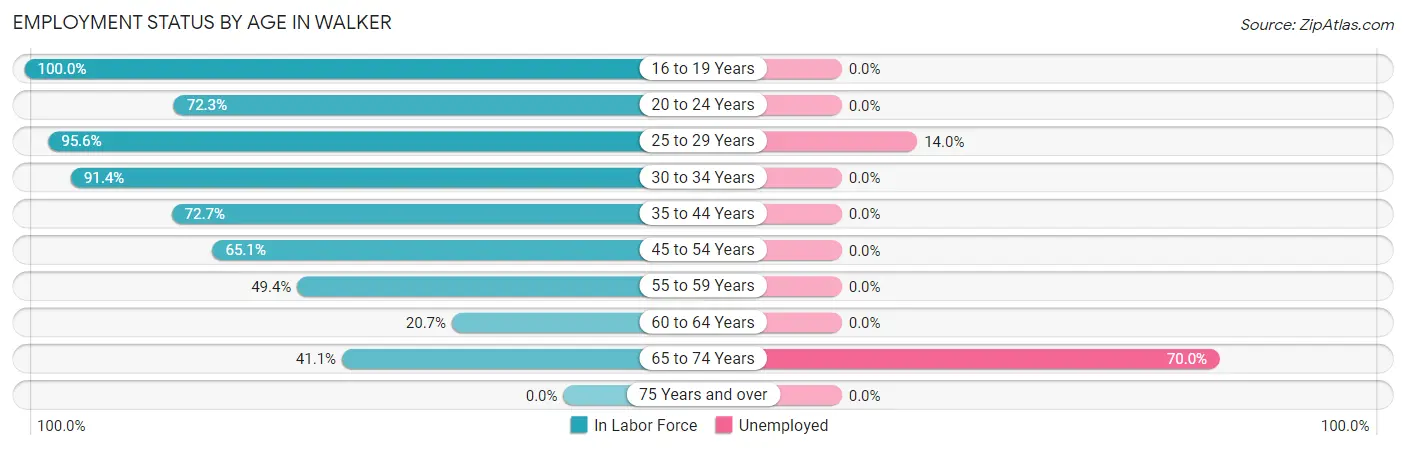
| Age Bracket | In Labor Force | Unemployed |
| 16 to 19 Years | 52 (100.0%) | 0 (0.0%) |
| 20 to 24 Years | 47 (72.3%) | 0 (0.0%) |
| 25 to 29 Years | 43 (95.6%) | 6 (14.0%) |
| 30 to 34 Years | 32 (91.4%) | 0 (0.0%) |
| 35 to 44 Years | 48 (72.7%) | 0 (0.0%) |
| 45 to 54 Years | 56 (65.1%) | 0 (0.0%) |
| 55 to 59 Years | 41 (49.4%) | 0 (0.0%) |
| 60 to 64 Years | 12 (20.7%) | 0 (0.0%) |
| 65 to 74 Years | 30 (41.1%) | 21 (70.0%) |
| 75 Years and over | 0 (0.0%) | 0 (0.0%) |
| Total | 361 (44.7%) | 27 (7.5%) |
Employment Status by Educational Attainment in Walker
According to labor force statistics for Walker, 62.2% of individuals (232) out of the total population between 25 and 64 years of age (373) are in the labor force, with 2.6% or 6 of them being unemployed. The group with the highest labor force participation rate are those with the educational attainment of college / associate degree, with 74.8% or 92 individuals in the labor force. Within the labor force, individuals with high school diploma education have the highest percentage of unemployment, with 10.2% or 6 of them being unemployed.
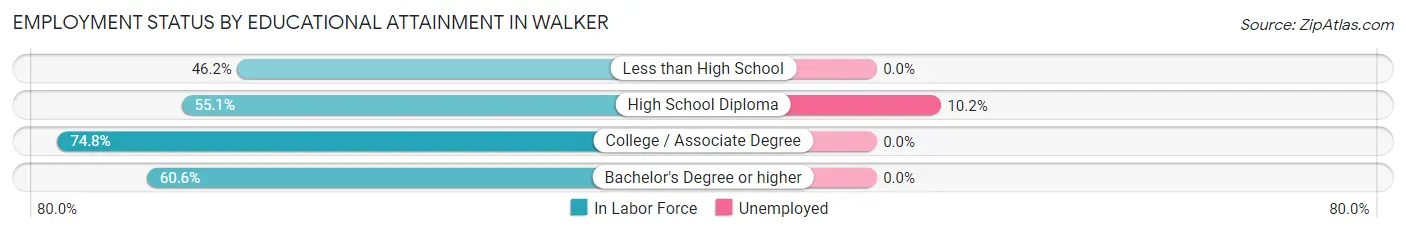
| Educational Attainment | In Labor Force | Unemployed |
| Less than High School | 18 (46.2%) | 0 (0.0%) |
| High School Diploma | 59 (55.1%) | 11 (10.2%) |
| College / Associate Degree | 92 (74.8%) | 0 (0.0%) |
| Bachelor's Degree or higher | 63 (60.6%) | 0 (0.0%) |
| Total | 232 (62.2%) | 10 (2.6%) |
Employment Occupations by Sex in Walker
Management, Business, Science and Arts Occupations
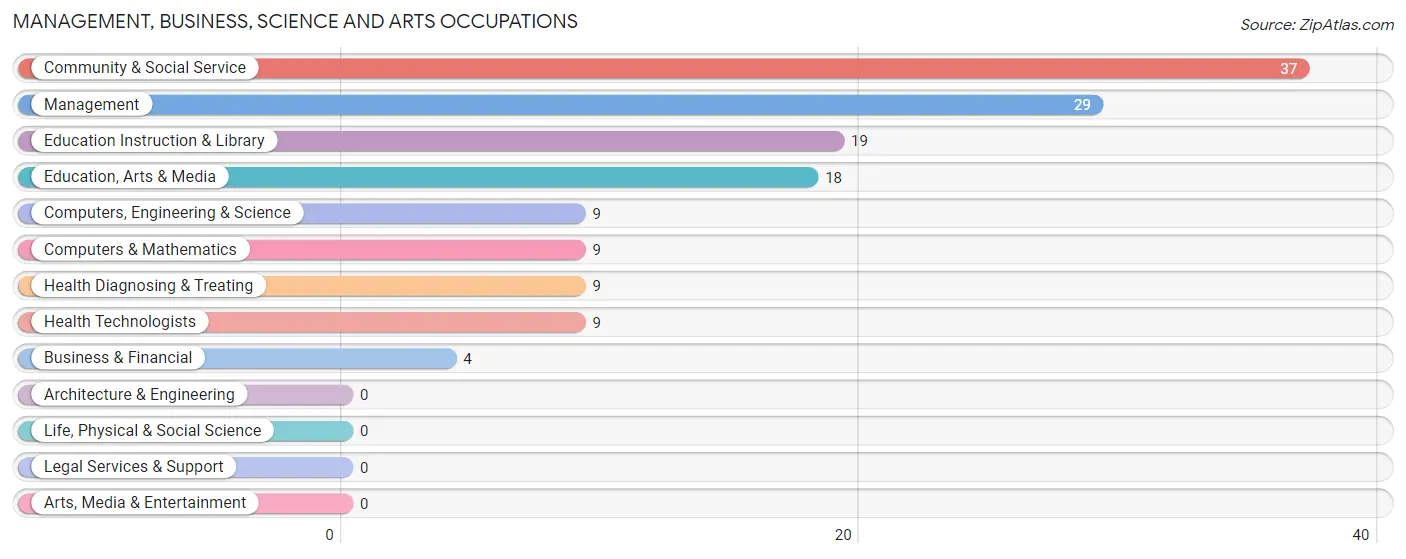
The most common Management, Business, Science and Arts occupations in Walker are Community & Social Service (37 | 11.1%), Management (29 | 8.7%), Education Instruction & Library (19 | 5.7%), Education, Arts & Media (18 | 5.4%), and Computers, Engineering & Science (9 | 2.7%).
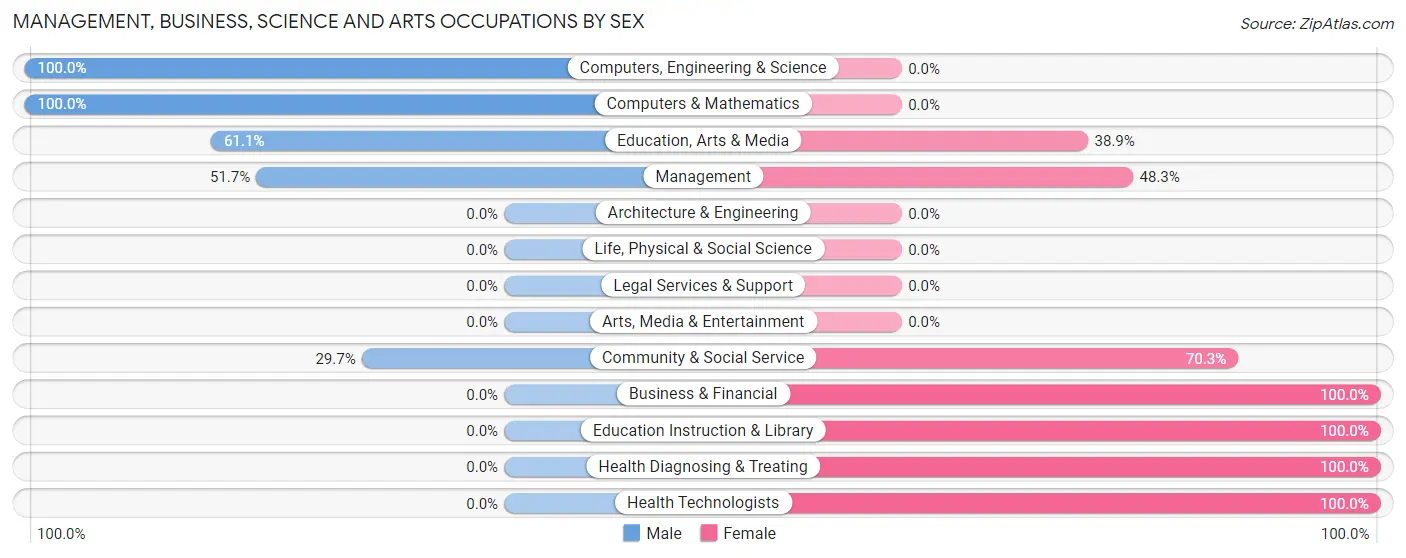
Management, Business, Science and Arts Occupations by Sex
Within the Management, Business, Science and Arts occupations in Walker, the most male-oriented occupations are Computers, Engineering & Science (100.0%), Computers & Mathematics (100.0%), and Education, Arts & Media (61.1%), while the most female-oriented occupations are Business & Financial (100.0%), Education Instruction & Library (100.0%), and Health Diagnosing & Treating (100.0%).
| Occupation | Male | Female |
| Management | 15 (51.7%) | 14 (48.3%) |
| Business & Financial | 0 (0.0%) | 4 (100.0%) |
| Computers, Engineering & Science | 9 (100.0%) | 0 (0.0%) |
| Computers & Mathematics | 9 (100.0%) | 0 (0.0%) |
| Architecture & Engineering | 0 (0.0%) | 0 (0.0%) |
| Life, Physical & Social Science | 0 (0.0%) | 0 (0.0%) |
| Community & Social Service | 11 (29.7%) | 26 (70.3%) |
| Education, Arts & Media | 11 (61.1%) | 7 (38.9%) |
| Legal Services & Support | 0 (0.0%) | 0 (0.0%) |
| Education Instruction & Library | 0 (0.0%) | 19 (100.0%) |
| Arts, Media & Entertainment | 0 (0.0%) | 0 (0.0%) |
| Health Diagnosing & Treating | 0 (0.0%) | 9 (100.0%) |
| Health Technologists | 0 (0.0%) | 9 (100.0%) |
| Total (Category) | 35 (39.8%) | 53 (60.2%) |
| Total (Overall) | 121 (36.2%) | 213 (63.8%) |
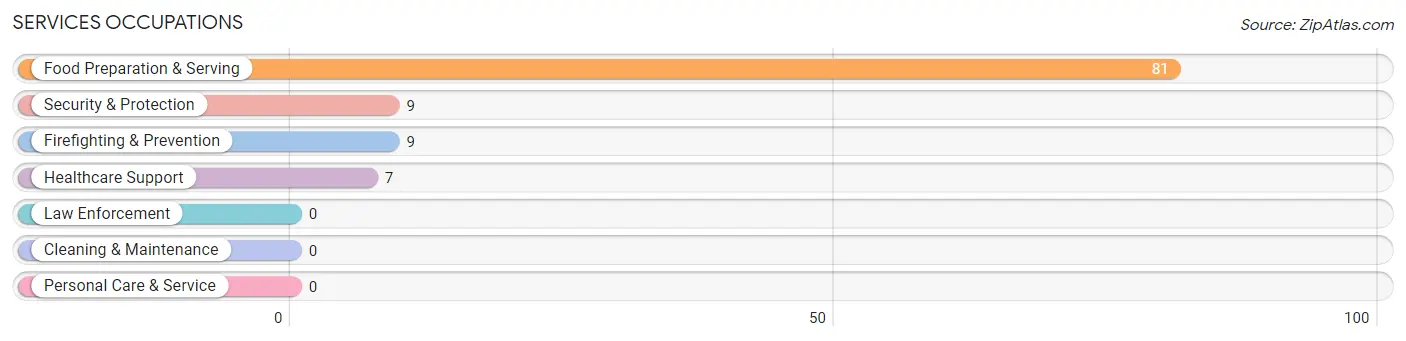
Services Occupations
The most common Services occupations in Walker are Food Preparation & Serving (81 | 24.2%), Security & Protection (9 | 2.7%), Firefighting & Prevention (9 | 2.7%), and Healthcare Support (7 | 2.1%).
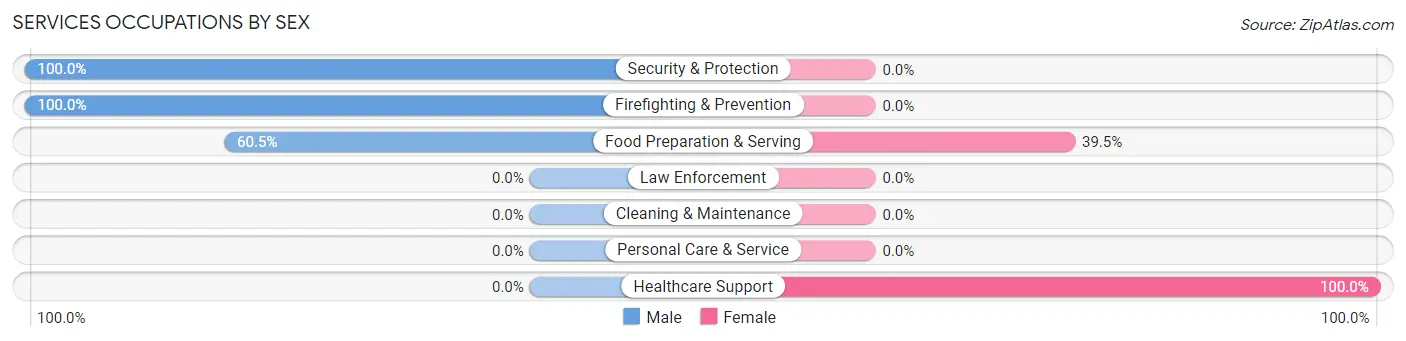
Services Occupations by Sex
Within the Services occupations in Walker, the most male-oriented occupations are Security & Protection (100.0%), Firefighting & Prevention (100.0%), and Food Preparation & Serving (60.5%), while the most female-oriented occupations are Healthcare Support (100.0%), and Food Preparation & Serving (39.5%).
| Occupation | Male | Female |
| Healthcare Support | 0 (0.0%) | 7 (100.0%) |
| Security & Protection | 9 (100.0%) | 0 (0.0%) |
| Firefighting & Prevention | 9 (100.0%) | 0 (0.0%) |
| Law Enforcement | 0 (0.0%) | 0 (0.0%) |
| Food Preparation & Serving | 49 (60.5%) | 32 (39.5%) |
| Cleaning & Maintenance | 0 (0.0%) | 0 (0.0%) |
| Personal Care & Service | 0 (0.0%) | 0 (0.0%) |
| Total (Category) | 58 (59.8%) | 39 (40.2%) |
| Total (Overall) | 121 (36.2%) | 213 (63.8%) |
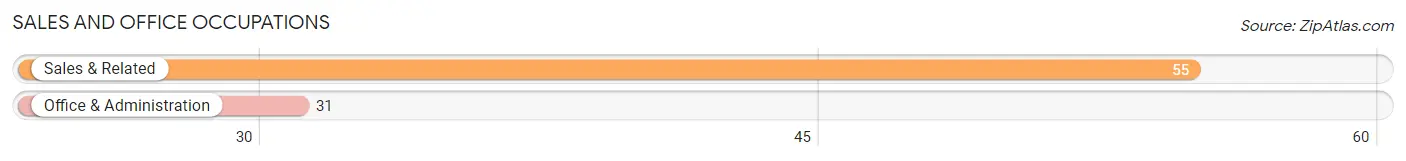
Sales and Office Occupations
The most common Sales and Office occupations in Walker are Sales & Related (55 | 16.5%), and Office & Administration (31 | 9.3%).
Sales and Office Occupations by Sex
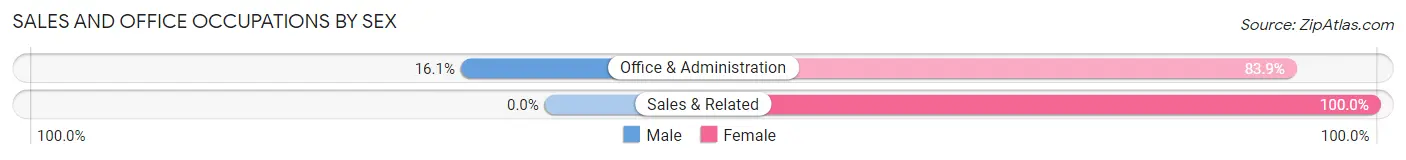
| Occupation | Male | Female |
| Sales & Related | 0 (0.0%) | 55 (100.0%) |
| Office & Administration | 5 (16.1%) | 26 (83.9%) |
| Total (Category) | 5 (5.8%) | 81 (94.2%) |
| Total (Overall) | 121 (36.2%) | 213 (63.8%) |
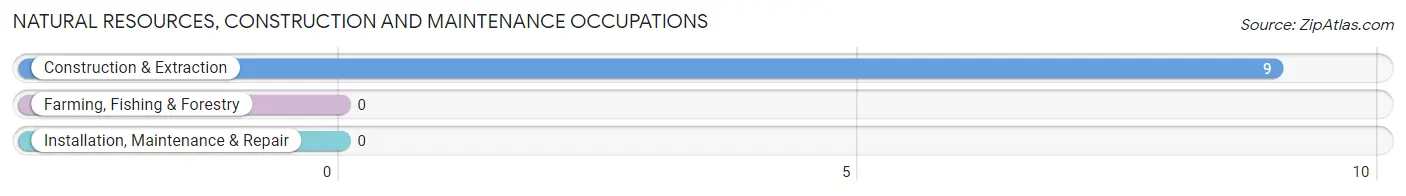
Natural Resources, Construction and Maintenance Occupations
The most common Natural Resources, Construction and Maintenance occupations in Walker are , and Construction & Extraction (9 | 2.7%).
Natural Resources, Construction and Maintenance Occupations by Sex
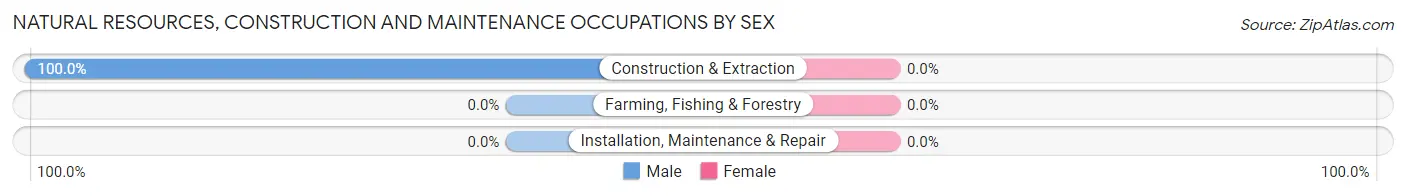
| Occupation | Male | Female |
| Farming, Fishing & Forestry | 0 (0.0%) | 0 (0.0%) |
| Construction & Extraction | 9 (100.0%) | 0 (0.0%) |
| Installation, Maintenance & Repair | 0 (0.0%) | 0 (0.0%) |
| Total (Category) | 9 (100.0%) | 0 (0.0%) |
| Total (Overall) | 121 (36.2%) | 213 (63.8%) |
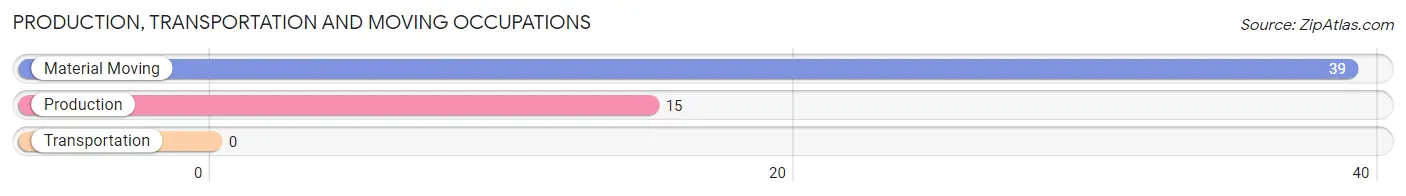
Production, Transportation and Moving Occupations
The most common Production, Transportation and Moving occupations in Walker are Material Moving (39 | 11.7%), and Production (15 | 4.5%).
Production, Transportation and Moving Occupations by Sex
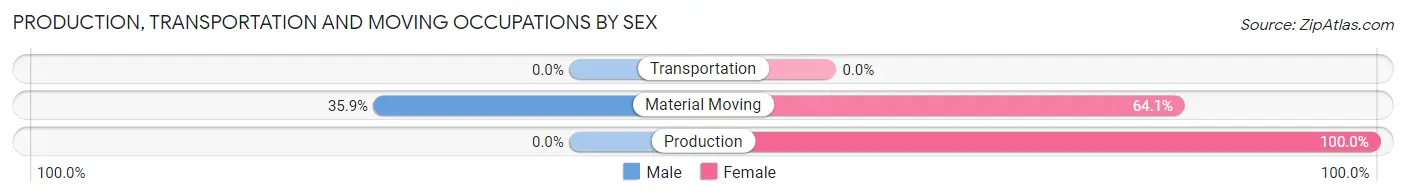
| Occupation | Male | Female |
| Production | 0 (0.0%) | 15 (100.0%) |
| Transportation | 0 (0.0%) | 0 (0.0%) |
| Material Moving | 14 (35.9%) | 25 (64.1%) |
| Total (Category) | 14 (25.9%) | 40 (74.1%) |
| Total (Overall) | 121 (36.2%) | 213 (63.8%) |
Employment Industries by Sex in Walker
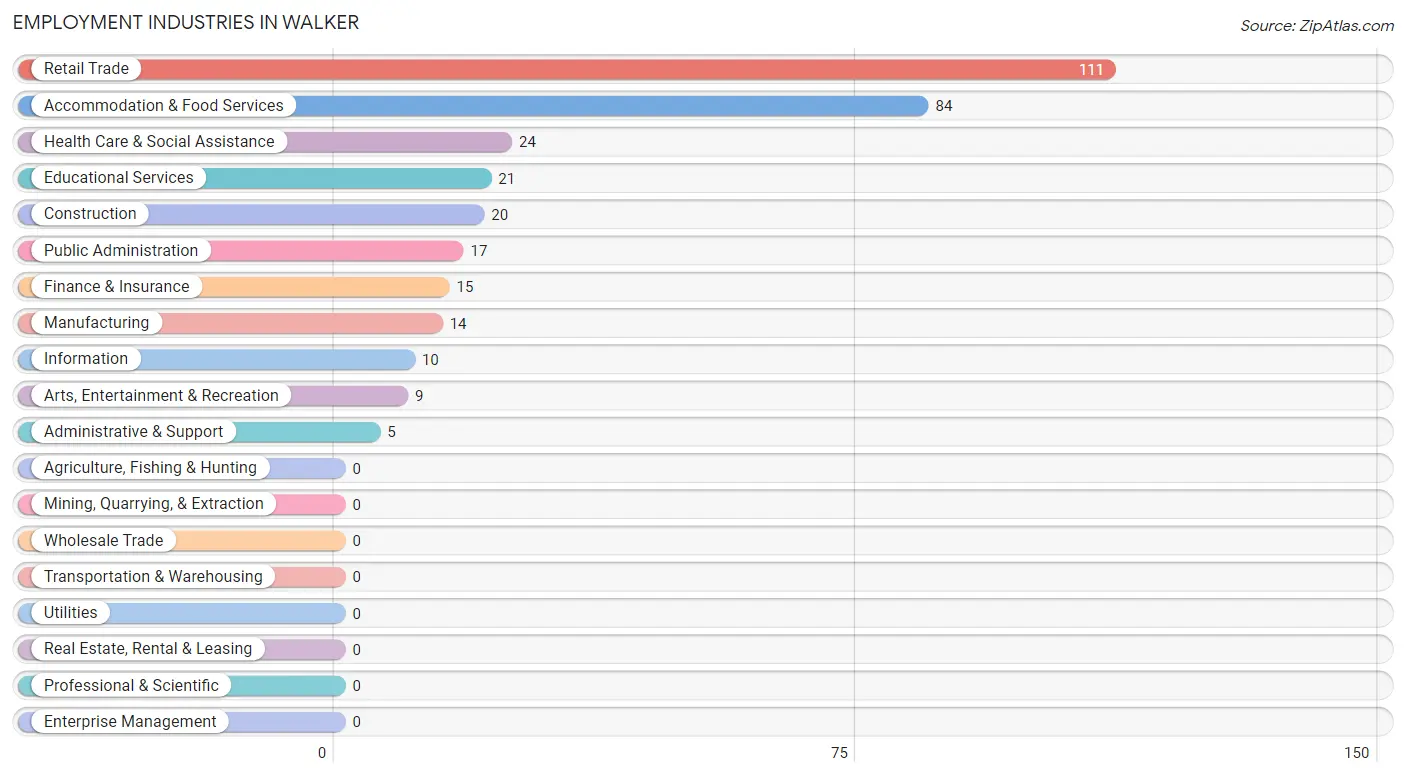
Employment Industries in Walker
The major employment industries in Walker include Retail Trade (111 | 33.2%), Accommodation & Food Services (84 | 25.2%), Health Care & Social Assistance (24 | 7.2%), Educational Services (21 | 6.3%), and Construction (20 | 6.0%).
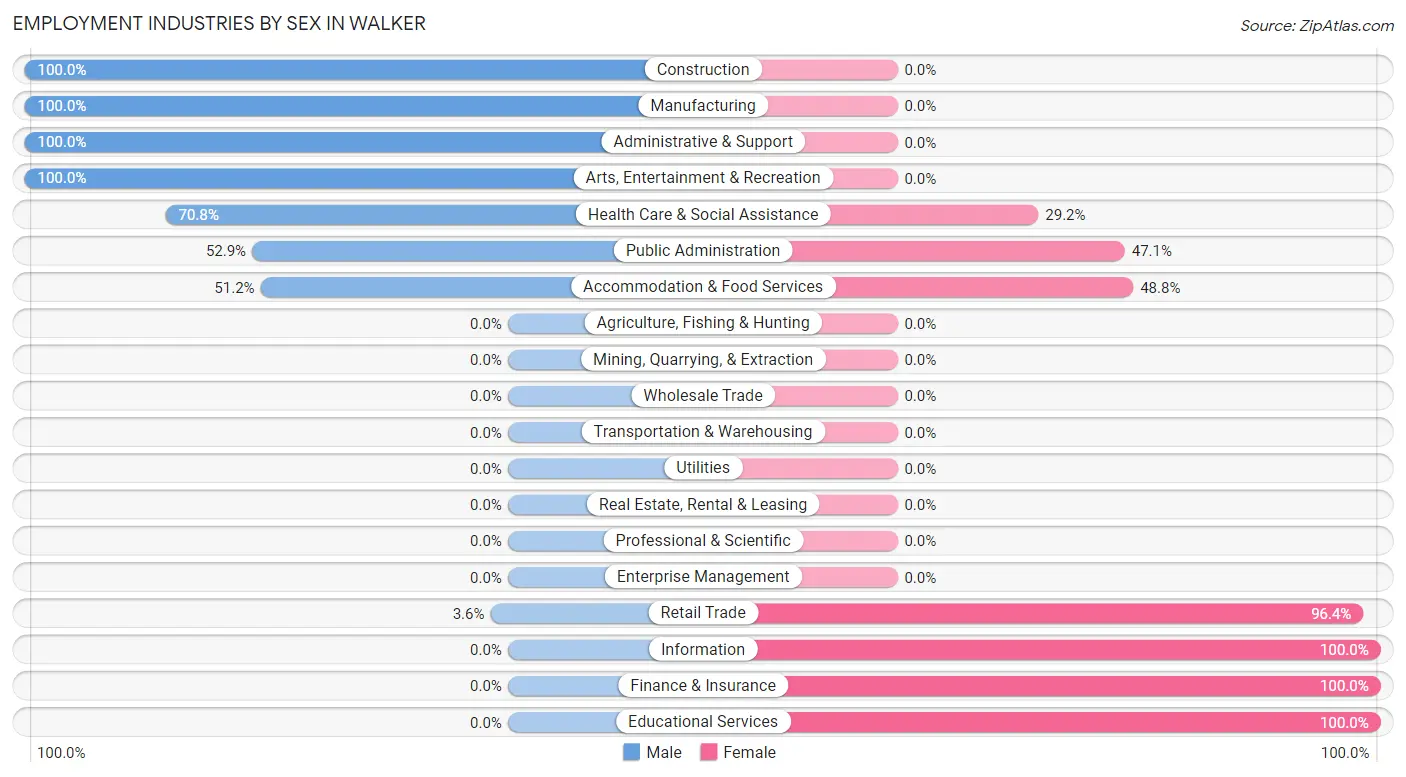
Employment Industries by Sex in Walker
The Walker industries that see more men than women are Construction (100.0%), Manufacturing (100.0%), and Administrative & Support (100.0%), whereas the industries that tend to have a higher number of women are Information (100.0%), Finance & Insurance (100.0%), and Educational Services (100.0%).
| Industry | Male | Female |
| Agriculture, Fishing & Hunting | 0 (0.0%) | 0 (0.0%) |
| Mining, Quarrying, & Extraction | 0 (0.0%) | 0 (0.0%) |
| Construction | 20 (100.0%) | 0 (0.0%) |
| Manufacturing | 14 (100.0%) | 0 (0.0%) |
| Wholesale Trade | 0 (0.0%) | 0 (0.0%) |
| Retail Trade | 4 (3.6%) | 107 (96.4%) |
| Transportation & Warehousing | 0 (0.0%) | 0 (0.0%) |
| Utilities | 0 (0.0%) | 0 (0.0%) |
| Information | 0 (0.0%) | 10 (100.0%) |
| Finance & Insurance | 0 (0.0%) | 15 (100.0%) |
| Real Estate, Rental & Leasing | 0 (0.0%) | 0 (0.0%) |
| Professional & Scientific | 0 (0.0%) | 0 (0.0%) |
| Enterprise Management | 0 (0.0%) | 0 (0.0%) |
| Administrative & Support | 5 (100.0%) | 0 (0.0%) |
| Educational Services | 0 (0.0%) | 21 (100.0%) |
| Health Care & Social Assistance | 17 (70.8%) | 7 (29.2%) |
| Arts, Entertainment & Recreation | 9 (100.0%) | 0 (0.0%) |
| Accommodation & Food Services | 43 (51.2%) | 41 (48.8%) |
| Public Administration | 9 (52.9%) | 8 (47.1%) |
| Total | 121 (36.2%) | 213 (63.8%) |
Education in Walker
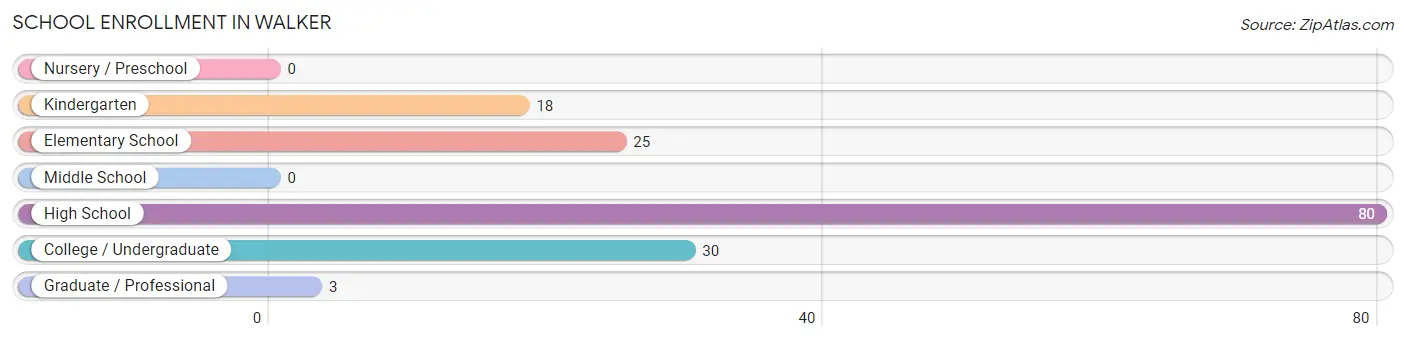
School Enrollment in Walker
The most common levels of schooling among the 156 students in Walker are high school (80 | 51.3%), college / undergraduate (30 | 19.2%), and elementary school (25 | 16.0%).
| School Level | # Students | % Students |
| Nursery / Preschool | 0 | 0.0% |
| Kindergarten | 18 | 11.5% |
| Elementary School | 25 | 16.0% |
| Middle School | 0 | 0.0% |
| High School | 80 | 51.3% |
| College / Undergraduate | 30 | 19.2% |
| Graduate / Professional | 3 | 1.9% |
| Total | 156 | 100.0% |
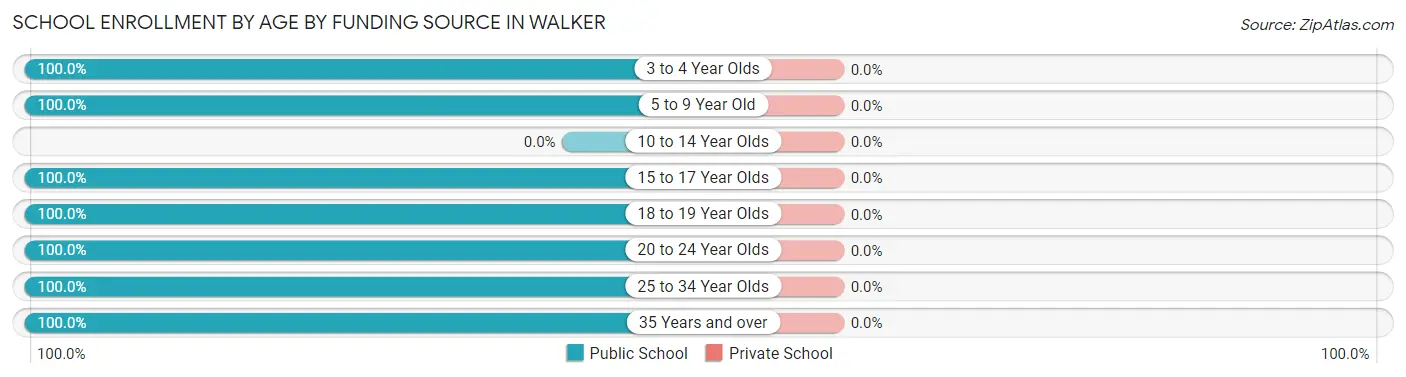
School Enrollment by Age by Funding Source in Walker
| Age Bracket | Public School | Private School |
| 3 to 4 Year Olds | 9 (100.0%) | 0 (0.0%) |
| 5 to 9 Year Old | 34 (100.0%) | 0 (0.0%) |
| 10 to 14 Year Olds | 0 (0.0%) | 0 (0.0%) |
| 15 to 17 Year Olds | 50 (100.0%) | 0 (0.0%) |
| 18 to 19 Year Olds | 30 (100.0%) | 0 (0.0%) |
| 20 to 24 Year Olds | 11 (100.0%) | 0 (0.0%) |
| 25 to 34 Year Olds | 19 (100.0%) | 0 (0.0%) |
| 35 Years and over | 3 (100.0%) | 0 (0.0%) |
| Total | 156 (100.0%) | 0 (0.0%) |
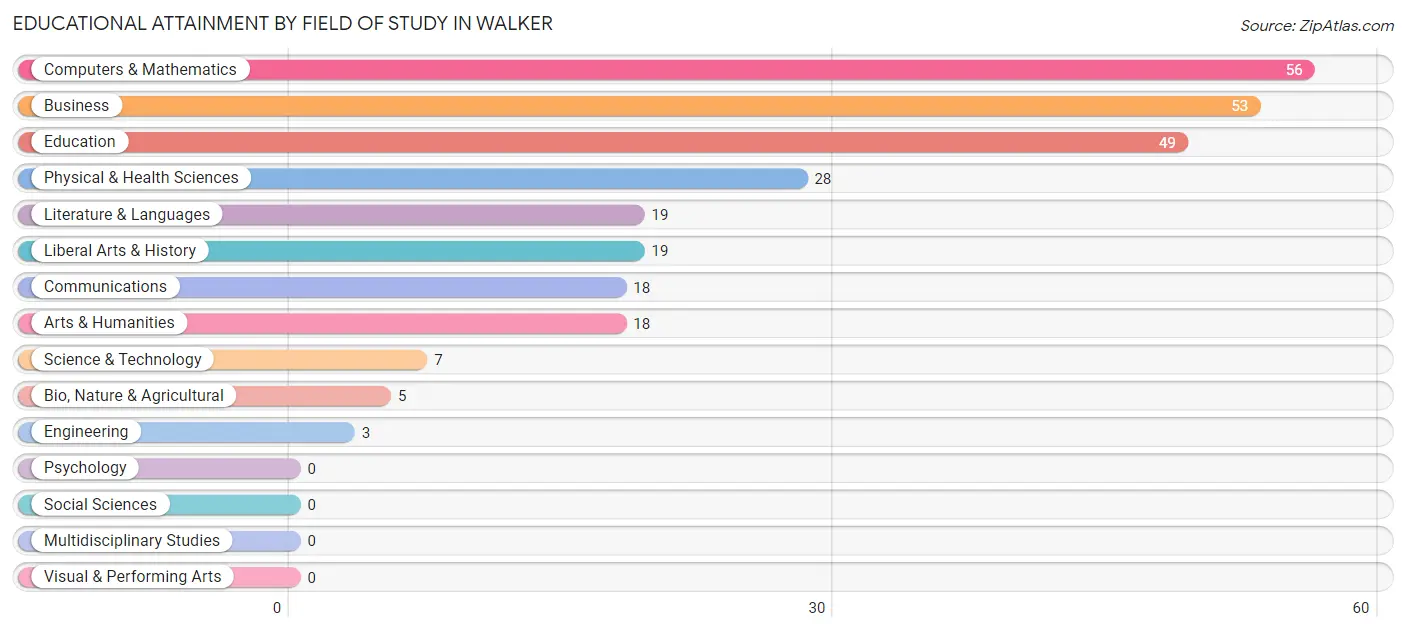
Educational Attainment by Field of Study in Walker
Computers & mathematics (56 | 20.4%), business (53 | 19.3%), education (49 | 17.8%), physical & health sciences (28 | 10.2%), and literature & languages (19 | 6.9%) are the most common fields of study among 275 individuals in Walker who have obtained a bachelor's degree or higher.
| Field of Study | # Graduates | % Graduates |
| Computers & Mathematics | 56 | 20.4% |
| Bio, Nature & Agricultural | 5 | 1.8% |
| Physical & Health Sciences | 28 | 10.2% |
| Psychology | 0 | 0.0% |
| Social Sciences | 0 | 0.0% |
| Engineering | 3 | 1.1% |
| Multidisciplinary Studies | 0 | 0.0% |
| Science & Technology | 7 | 2.5% |
| Business | 53 | 19.3% |
| Education | 49 | 17.8% |
| Literature & Languages | 19 | 6.9% |
| Liberal Arts & History | 19 | 6.9% |
| Visual & Performing Arts | 0 | 0.0% |
| Communications | 18 | 6.6% |
| Arts & Humanities | 18 | 6.6% |
| Total | 275 | 100.0% |
Transportation & Commute in Walker
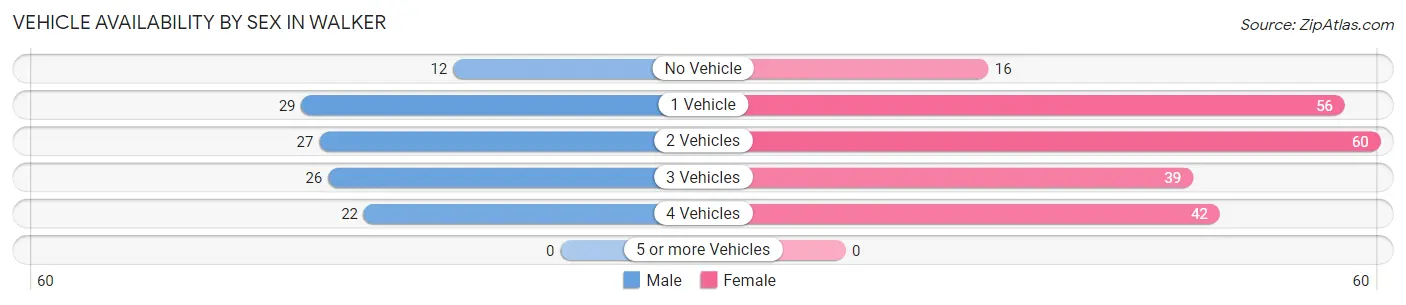
Vehicle Availability by Sex in Walker
The most prevalent vehicle ownership categories in Walker are males with 1 vehicle (29, accounting for 25.0%) and females with 1 vehicle (56, making up 13.6%).
| Vehicles Available | Male | Female |
| No Vehicle | 12 (10.3%) | 16 (7.5%) |
| 1 Vehicle | 29 (25.0%) | 56 (26.3%) |
| 2 Vehicles | 27 (23.3%) | 60 (28.2%) |
| 3 Vehicles | 26 (22.4%) | 39 (18.3%) |
| 4 Vehicles | 22 (19.0%) | 42 (19.7%) |
| 5 or more Vehicles | 0 (0.0%) | 0 (0.0%) |
| Total | 116 (100.0%) | 213 (100.0%) |
Commute Time in Walker
The most frequently occuring commute durations in Walker are 5 to 9 minutes (103 commuters, 30.8%), 10 to 14 minutes (82 commuters, 24.5%), and less than 5 minutes (62 commuters, 18.6%).
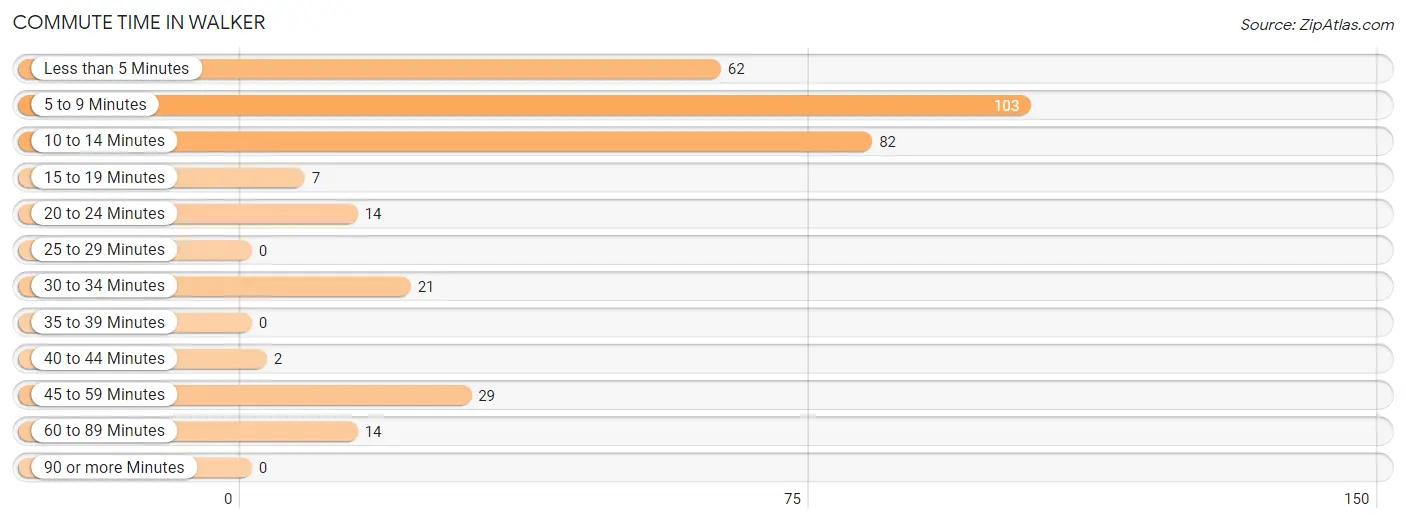
| Commute Time | # Commuters | % Commuters |
| Less than 5 Minutes | 62 | 18.6% |
| 5 to 9 Minutes | 103 | 30.8% |
| 10 to 14 Minutes | 82 | 24.5% |
| 15 to 19 Minutes | 7 | 2.1% |
| 20 to 24 Minutes | 14 | 4.2% |
| 25 to 29 Minutes | 0 | 0.0% |
| 30 to 34 Minutes | 21 | 6.3% |
| 35 to 39 Minutes | 0 | 0.0% |
| 40 to 44 Minutes | 2 | 0.6% |
| 45 to 59 Minutes | 29 | 8.7% |
| 60 to 89 Minutes | 14 | 4.2% |
| 90 or more Minutes | 0 | 0.0% |
Commute Time by Sex in Walker
The most common commute times in Walker are 10 to 14 minutes (35 commuters, 28.9%) for males and 5 to 9 minutes (90 commuters, 42.2%) for females.
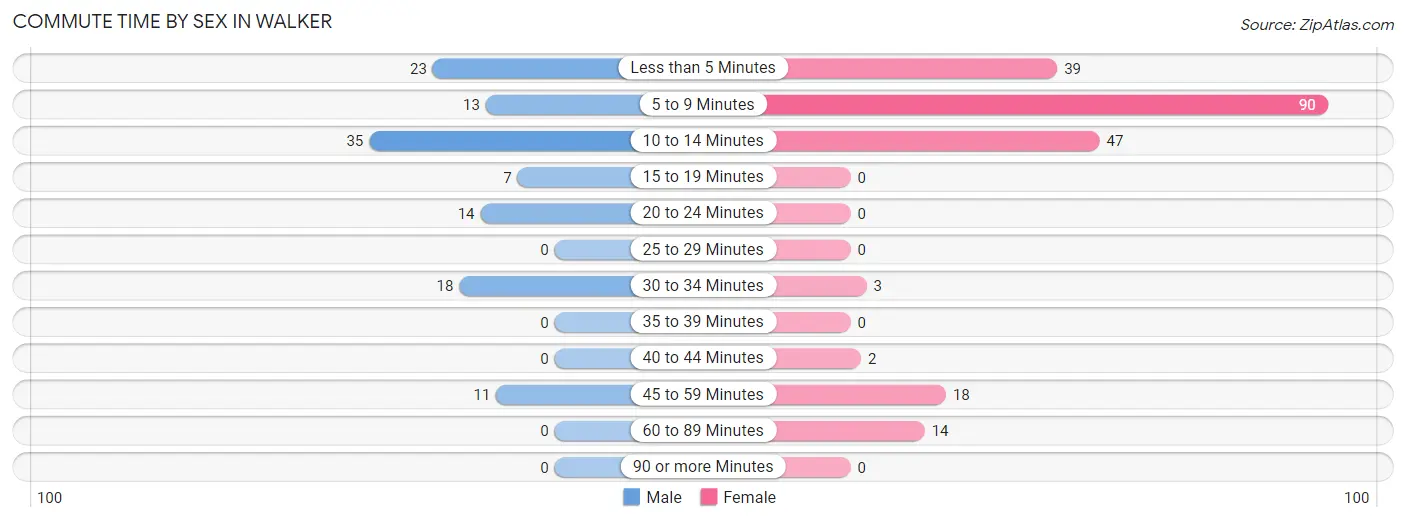
| Commute Time | Male | Female |
| Less than 5 Minutes | 23 (19.0%) | 39 (18.3%) |
| 5 to 9 Minutes | 13 (10.7%) | 90 (42.2%) |
| 10 to 14 Minutes | 35 (28.9%) | 47 (22.1%) |
| 15 to 19 Minutes | 7 (5.8%) | 0 (0.0%) |
| 20 to 24 Minutes | 14 (11.6%) | 0 (0.0%) |
| 25 to 29 Minutes | 0 (0.0%) | 0 (0.0%) |
| 30 to 34 Minutes | 18 (14.9%) | 3 (1.4%) |
| 35 to 39 Minutes | 0 (0.0%) | 0 (0.0%) |
| 40 to 44 Minutes | 0 (0.0%) | 2 (0.9%) |
| 45 to 59 Minutes | 11 (9.1%) | 18 (8.5%) |
| 60 to 89 Minutes | 0 (0.0%) | 14 (6.6%) |
| 90 or more Minutes | 0 (0.0%) | 0 (0.0%) |
Time of Departure to Work by Sex in Walker
The most frequent times of departure to work in Walker are 7:30 AM to 7:59 AM (27, 22.3%) for males and 7:30 AM to 7:59 AM (121, 56.8%) for females.
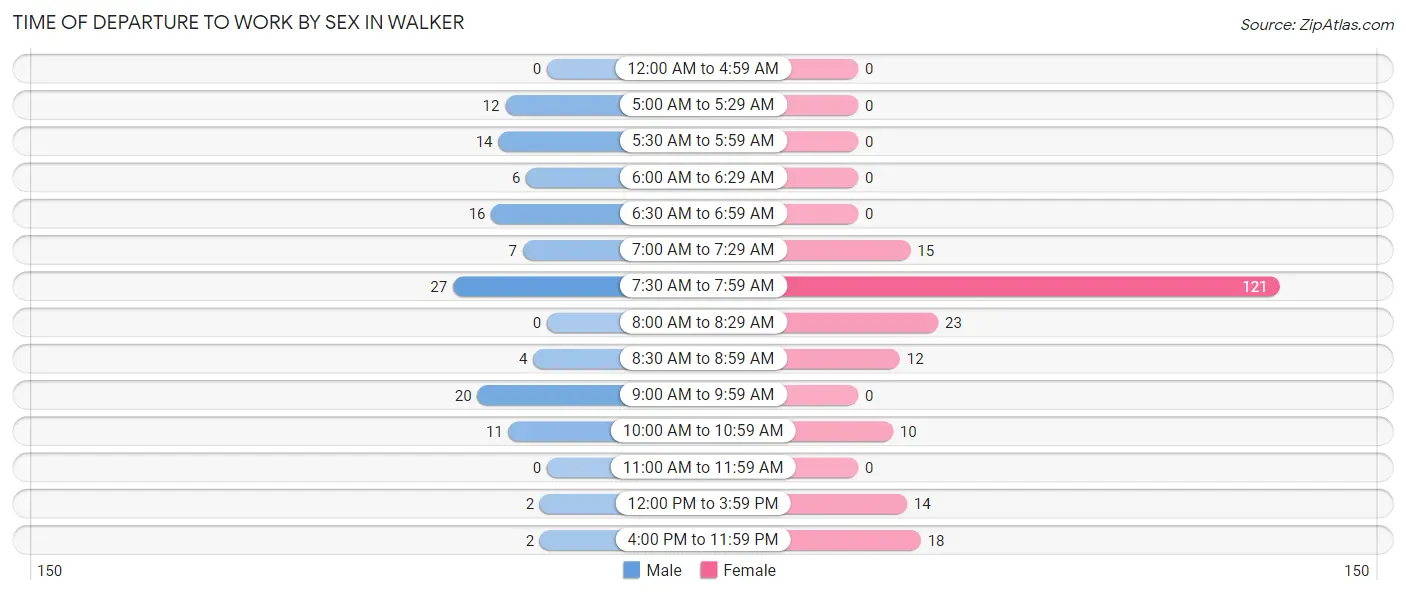
| Time of Departure | Male | Female |
| 12:00 AM to 4:59 AM | 0 (0.0%) | 0 (0.0%) |
| 5:00 AM to 5:29 AM | 12 (9.9%) | 0 (0.0%) |
| 5:30 AM to 5:59 AM | 14 (11.6%) | 0 (0.0%) |
| 6:00 AM to 6:29 AM | 6 (5.0%) | 0 (0.0%) |
| 6:30 AM to 6:59 AM | 16 (13.2%) | 0 (0.0%) |
| 7:00 AM to 7:29 AM | 7 (5.8%) | 15 (7.0%) |
| 7:30 AM to 7:59 AM | 27 (22.3%) | 121 (56.8%) |
| 8:00 AM to 8:29 AM | 0 (0.0%) | 23 (10.8%) |
| 8:30 AM to 8:59 AM | 4 (3.3%) | 12 (5.6%) |
| 9:00 AM to 9:59 AM | 20 (16.5%) | 0 (0.0%) |
| 10:00 AM to 10:59 AM | 11 (9.1%) | 10 (4.7%) |
| 11:00 AM to 11:59 AM | 0 (0.0%) | 0 (0.0%) |
| 12:00 PM to 3:59 PM | 2 (1.7%) | 14 (6.6%) |
| 4:00 PM to 11:59 PM | 2 (1.7%) | 18 (8.5%) |
| Total | 121 (100.0%) | 213 (100.0%) |
Housing Occupancy in Walker
Occupancy by Ownership in Walker
Of the total 438 dwellings in Walker, owner-occupied units account for 213 (48.6%), while renter-occupied units make up 225 (51.4%).
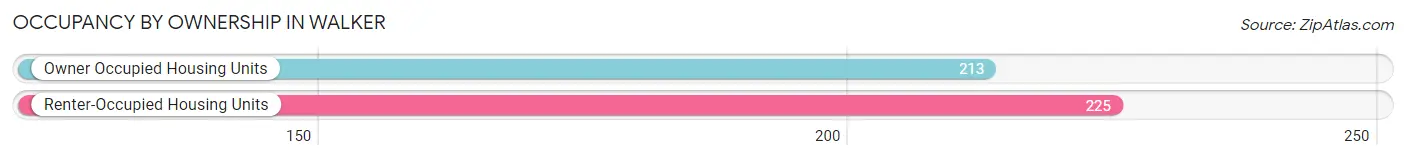
| Occupancy | # Housing Units | % Housing Units |
| Owner Occupied Housing Units | 213 | 48.6% |
| Renter-Occupied Housing Units | 225 | 51.4% |
| Total Occupied Housing Units | 438 | 100.0% |
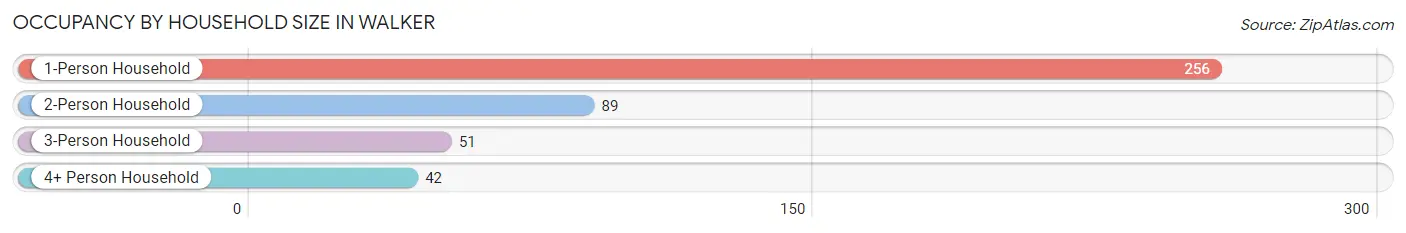
Occupancy by Household Size in Walker
| Household Size | # Housing Units | % Housing Units |
| 1-Person Household | 256 | 58.5% |
| 2-Person Household | 89 | 20.3% |
| 3-Person Household | 51 | 11.6% |
| 4+ Person Household | 42 | 9.6% |
| Total Housing Units | 438 | 100.0% |
Occupancy by Ownership by Household Size in Walker
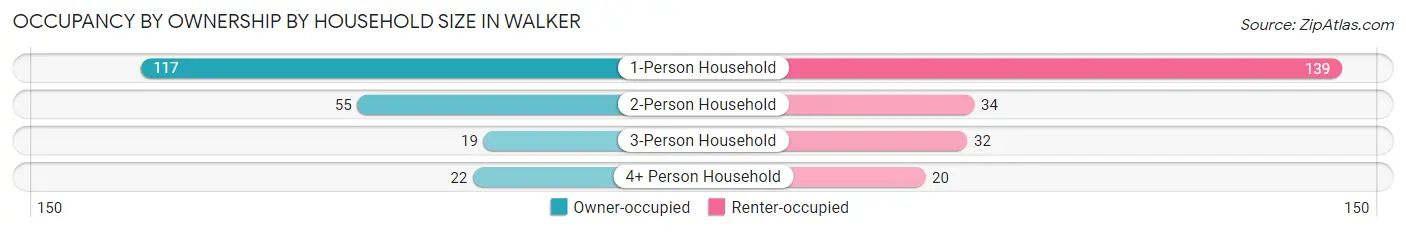
| Household Size | Owner-occupied | Renter-occupied |
| 1-Person Household | 117 (45.7%) | 139 (54.3%) |
| 2-Person Household | 55 (61.8%) | 34 (38.2%) |
| 3-Person Household | 19 (37.2%) | 32 (62.7%) |
| 4+ Person Household | 22 (52.4%) | 20 (47.6%) |
| Total Housing Units | 213 (48.6%) | 225 (51.4%) |
Occupancy by Educational Attainment in Walker
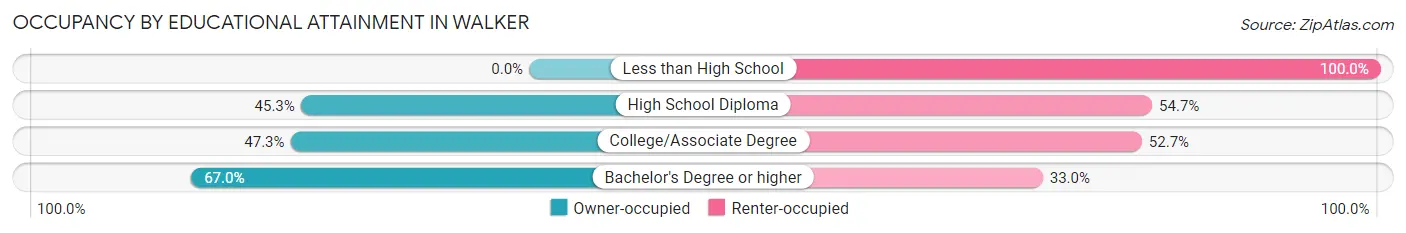
| Household Size | Owner-occupied | Renter-occupied |
| Less than High School | 0 (0.0%) | 31 (100.0%) |
| High School Diploma | 48 (45.3%) | 58 (54.7%) |
| College/Associate Degree | 88 (47.3%) | 98 (52.7%) |
| Bachelor's Degree or higher | 77 (67.0%) | 38 (33.0%) |
Occupancy by Age of Householder in Walker
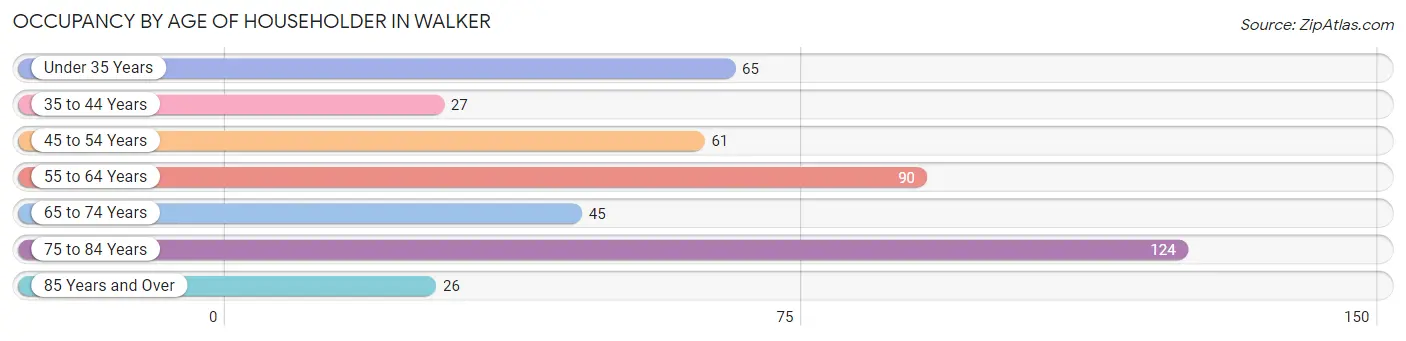
| Age Bracket | # Households | % Households |
| Under 35 Years | 65 | 14.8% |
| 35 to 44 Years | 27 | 6.2% |
| 45 to 54 Years | 61 | 13.9% |
| 55 to 64 Years | 90 | 20.5% |
| 65 to 74 Years | 45 | 10.3% |
| 75 to 84 Years | 124 | 28.3% |
| 85 Years and Over | 26 | 5.9% |
| Total | 438 | 100.0% |
Housing Finances in Walker
Median Income by Occupancy in Walker
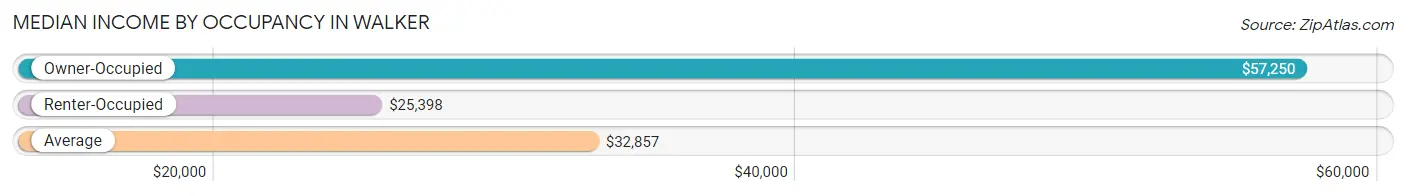
| Occupancy Type | # Households | Median Income |
| Owner-Occupied | 213 (48.6%) | $57,250 |
| Renter-Occupied | 225 (51.4%) | $25,398 |
| Average | 438 (100.0%) | $32,857 |
Occupancy by Householder Income Bracket in Walker
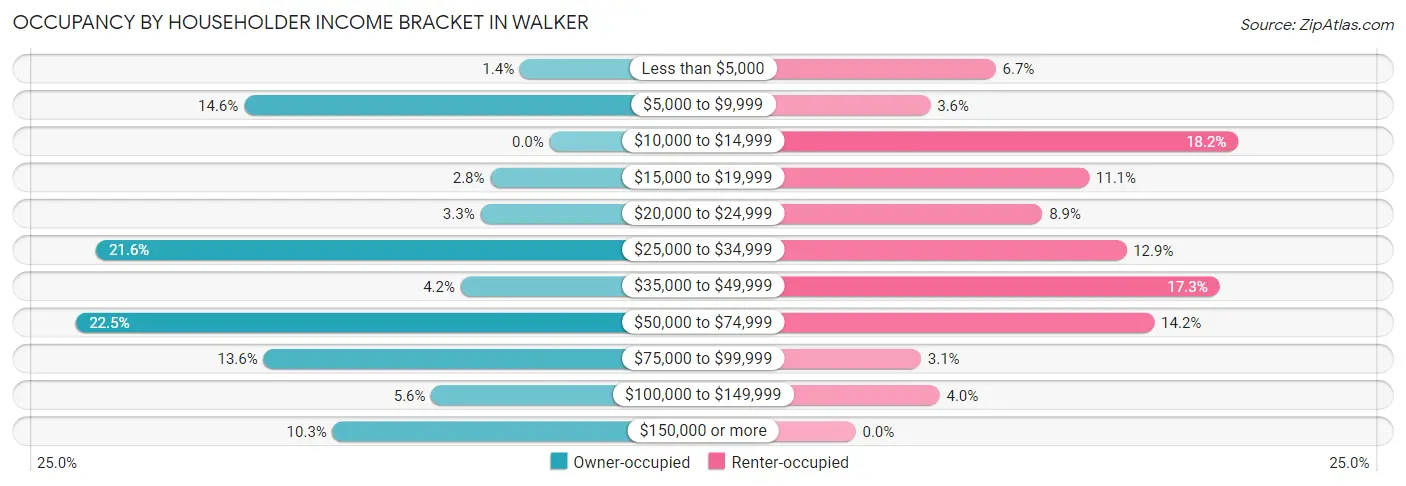
| Income Bracket | Owner-occupied | Renter-occupied |
| Less than $5,000 | 3 (1.4%) | 15 (6.7%) |
| $5,000 to $9,999 | 31 (14.5%) | 8 (3.6%) |
| $10,000 to $14,999 | 0 (0.0%) | 41 (18.2%) |
| $15,000 to $19,999 | 6 (2.8%) | 25 (11.1%) |
| $20,000 to $24,999 | 7 (3.3%) | 20 (8.9%) |
| $25,000 to $34,999 | 46 (21.6%) | 29 (12.9%) |
| $35,000 to $49,999 | 9 (4.2%) | 39 (17.3%) |
| $50,000 to $74,999 | 48 (22.5%) | 32 (14.2%) |
| $75,000 to $99,999 | 29 (13.6%) | 7 (3.1%) |
| $100,000 to $149,999 | 12 (5.6%) | 9 (4.0%) |
| $150,000 or more | 22 (10.3%) | 0 (0.0%) |
| Total | 213 (100.0%) | 225 (100.0%) |
Monthly Housing Cost Tiers in Walker
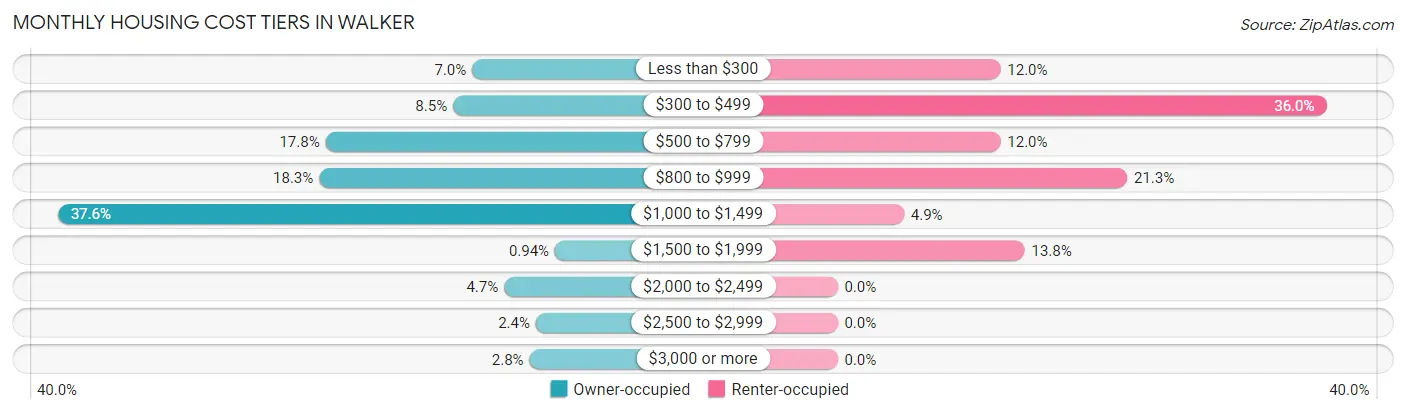
| Monthly Cost | Owner-occupied | Renter-occupied |
| Less than $300 | 15 (7.0%) | 27 (12.0%) |
| $300 to $499 | 18 (8.5%) | 81 (36.0%) |
| $500 to $799 | 38 (17.8%) | 27 (12.0%) |
| $800 to $999 | 39 (18.3%) | 48 (21.3%) |
| $1,000 to $1,499 | 80 (37.6%) | 11 (4.9%) |
| $1,500 to $1,999 | 2 (0.9%) | 31 (13.8%) |
| $2,000 to $2,499 | 10 (4.7%) | 0 (0.0%) |
| $2,500 to $2,999 | 5 (2.4%) | 0 (0.0%) |
| $3,000 or more | 6 (2.8%) | 0 (0.0%) |
| Total | 213 (100.0%) | 225 (100.0%) |
Physical Housing Characteristics in Walker
Housing Structures in Walker
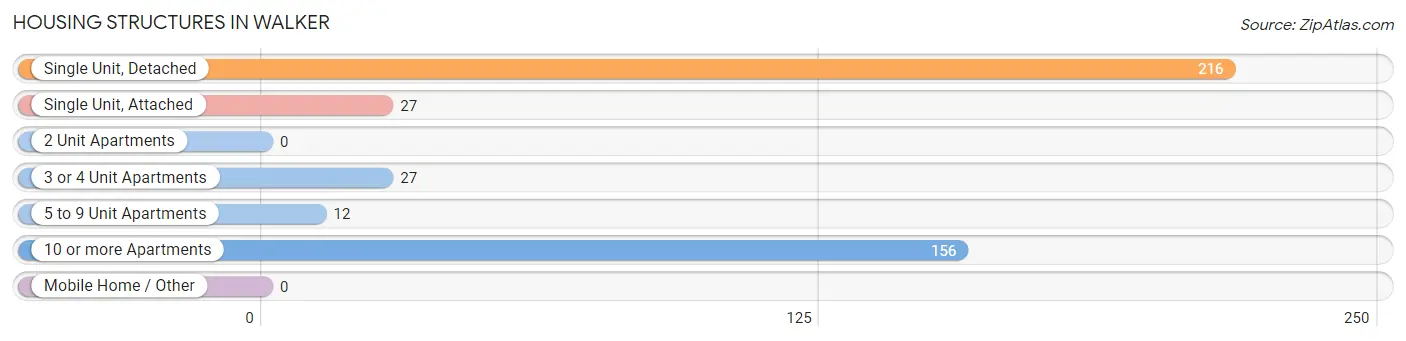
| Structure Type | # Housing Units | % Housing Units |
| Single Unit, Detached | 216 | 49.3% |
| Single Unit, Attached | 27 | 6.2% |
| 2 Unit Apartments | 0 | 0.0% |
| 3 or 4 Unit Apartments | 27 | 6.2% |
| 5 to 9 Unit Apartments | 12 | 2.7% |
| 10 or more Apartments | 156 | 35.6% |
| Mobile Home / Other | 0 | 0.0% |
| Total | 438 | 100.0% |
Housing Structures by Occupancy in Walker
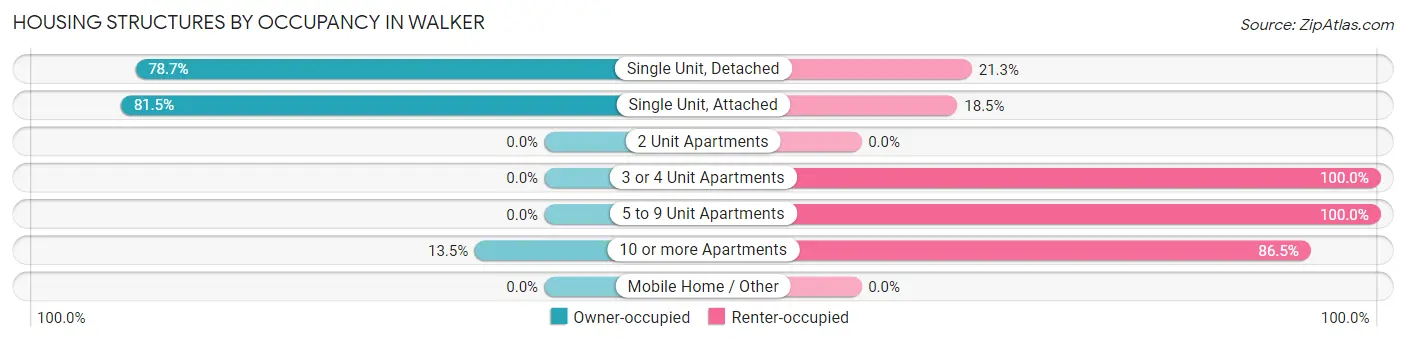
| Structure Type | Owner-occupied | Renter-occupied |
| Single Unit, Detached | 170 (78.7%) | 46 (21.3%) |
| Single Unit, Attached | 22 (81.5%) | 5 (18.5%) |
| 2 Unit Apartments | 0 (0.0%) | 0 (0.0%) |
| 3 or 4 Unit Apartments | 0 (0.0%) | 27 (100.0%) |
| 5 to 9 Unit Apartments | 0 (0.0%) | 12 (100.0%) |
| 10 or more Apartments | 21 (13.5%) | 135 (86.5%) |
| Mobile Home / Other | 0 (0.0%) | 0 (0.0%) |
| Total | 213 (48.6%) | 225 (51.4%) |
Housing Structures by Number of Rooms in Walker
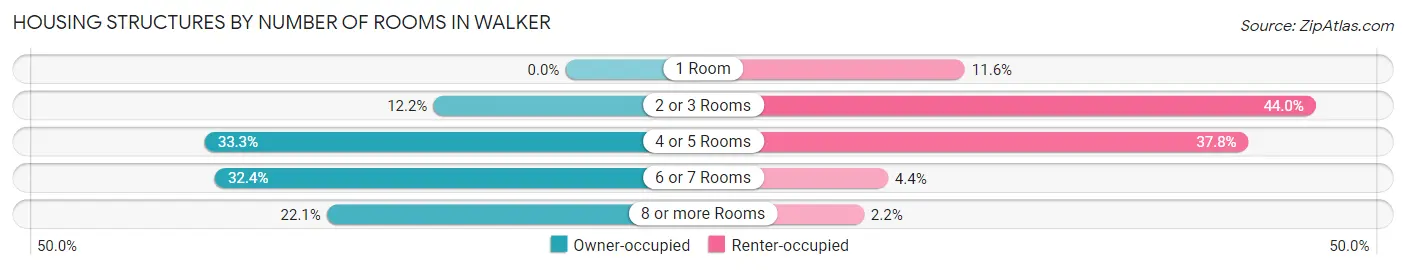
| Number of Rooms | Owner-occupied | Renter-occupied |
| 1 Room | 0 (0.0%) | 26 (11.6%) |
| 2 or 3 Rooms | 26 (12.2%) | 99 (44.0%) |
| 4 or 5 Rooms | 71 (33.3%) | 85 (37.8%) |
| 6 or 7 Rooms | 69 (32.4%) | 10 (4.4%) |
| 8 or more Rooms | 47 (22.1%) | 5 (2.2%) |
| Total | 213 (100.0%) | 225 (100.0%) |
Housing Structure by Heating Type in Walker
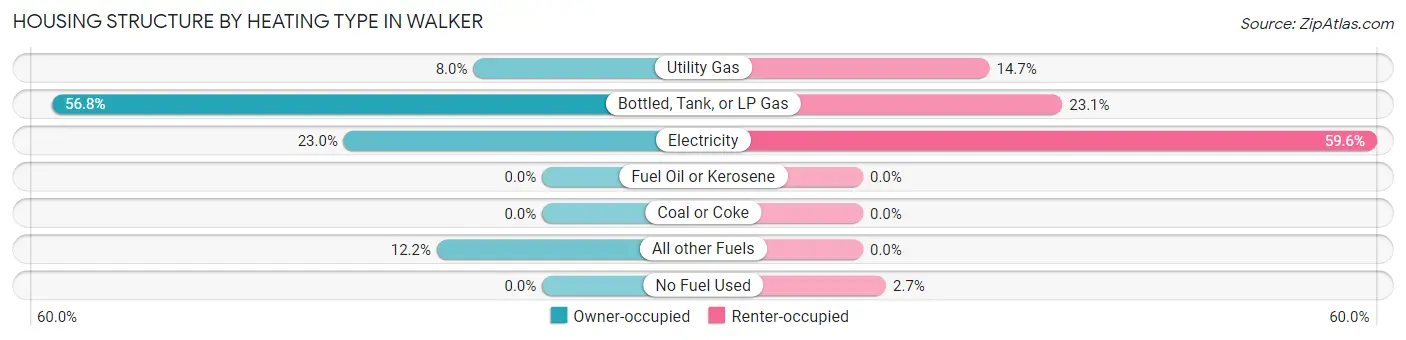
| Heating Type | Owner-occupied | Renter-occupied |
| Utility Gas | 17 (8.0%) | 33 (14.7%) |
| Bottled, Tank, or LP Gas | 121 (56.8%) | 52 (23.1%) |
| Electricity | 49 (23.0%) | 134 (59.6%) |
| Fuel Oil or Kerosene | 0 (0.0%) | 0 (0.0%) |
| Coal or Coke | 0 (0.0%) | 0 (0.0%) |
| All other Fuels | 26 (12.2%) | 0 (0.0%) |
| No Fuel Used | 0 (0.0%) | 6 (2.7%) |
| Total | 213 (100.0%) | 225 (100.0%) |
Household Vehicle Usage in Walker
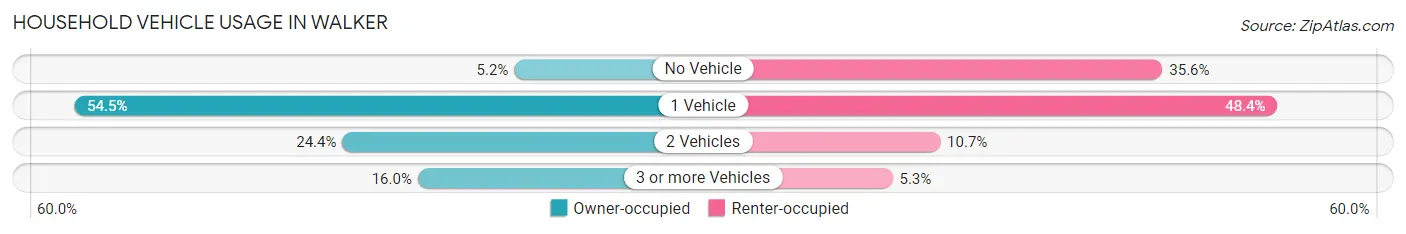
| Vehicles per Household | Owner-occupied | Renter-occupied |
| No Vehicle | 11 (5.2%) | 80 (35.6%) |
| 1 Vehicle | 116 (54.5%) | 109 (48.4%) |
| 2 Vehicles | 52 (24.4%) | 24 (10.7%) |
| 3 or more Vehicles | 34 (16.0%) | 12 (5.3%) |
| Total | 213 (100.0%) | 225 (100.0%) |
Real Estate & Mortgages in Walker
Real Estate and Mortgage Overview in Walker
| Characteristic | Without Mortgage | With Mortgage |
| Housing Units | 110 | 103 |
| Median Property Value | $231,300 | $172,300 |
| Median Household Income | $63,750 | $2 |
| Monthly Housing Costs | $767 | $6 |
| Real Estate Taxes | $3,023 | $0 |
Property Value by Mortgage Status in Walker
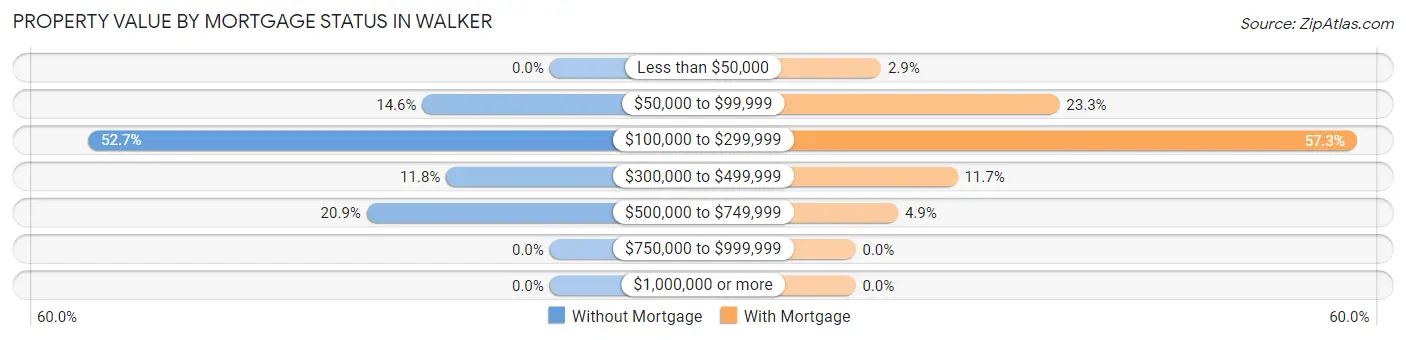
| Property Value | Without Mortgage | With Mortgage |
| Less than $50,000 | 0 (0.0%) | 3 (2.9%) |
| $50,000 to $99,999 | 16 (14.5%) | 24 (23.3%) |
| $100,000 to $299,999 | 58 (52.7%) | 59 (57.3%) |
| $300,000 to $499,999 | 13 (11.8%) | 12 (11.7%) |
| $500,000 to $749,999 | 23 (20.9%) | 5 (4.9%) |
| $750,000 to $999,999 | 0 (0.0%) | 0 (0.0%) |
| $1,000,000 or more | 0 (0.0%) | 0 (0.0%) |
| Total | 110 (100.0%) | 103 (100.0%) |
Household Income by Mortgage Status in Walker
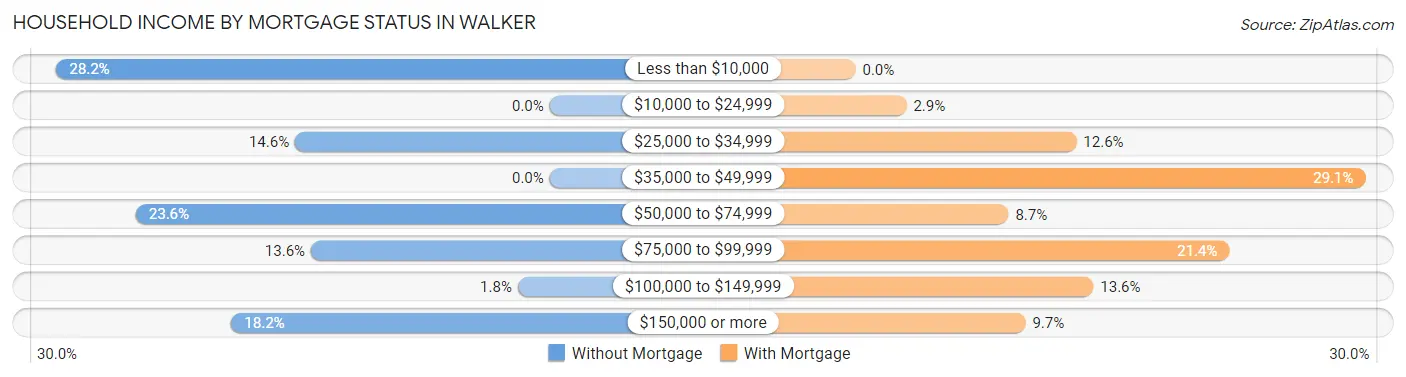
| Household Income | Without Mortgage | With Mortgage |
| Less than $10,000 | 31 (28.2%) | 0 (0.0%) |
| $10,000 to $24,999 | 0 (0.0%) | 3 (2.9%) |
| $25,000 to $34,999 | 16 (14.5%) | 13 (12.6%) |
| $35,000 to $49,999 | 0 (0.0%) | 30 (29.1%) |
| $50,000 to $74,999 | 26 (23.6%) | 9 (8.7%) |
| $75,000 to $99,999 | 15 (13.6%) | 22 (21.4%) |
| $100,000 to $149,999 | 2 (1.8%) | 14 (13.6%) |
| $150,000 or more | 20 (18.2%) | 10 (9.7%) |
| Total | 110 (100.0%) | 103 (100.0%) |
Property Value to Household Income Ratio in Walker
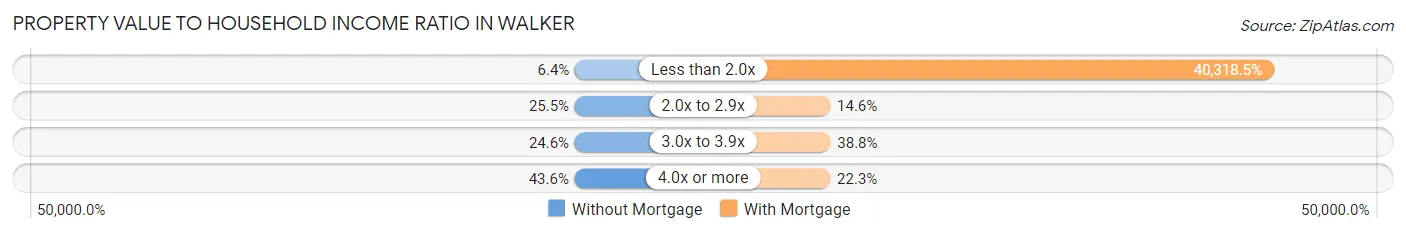
| Value-to-Income Ratio | Without Mortgage | With Mortgage |
| Less than 2.0x | 7 (6.4%) | 41,528 (40,318.5%) |
| 2.0x to 2.9x | 28 (25.5%) | 15 (14.6%) |
| 3.0x to 3.9x | 27 (24.5%) | 40 (38.8%) |
| 4.0x or more | 48 (43.6%) | 23 (22.3%) |
| Total | 110 (100.0%) | 103 (100.0%) |
Real Estate Taxes by Mortgage Status in Walker
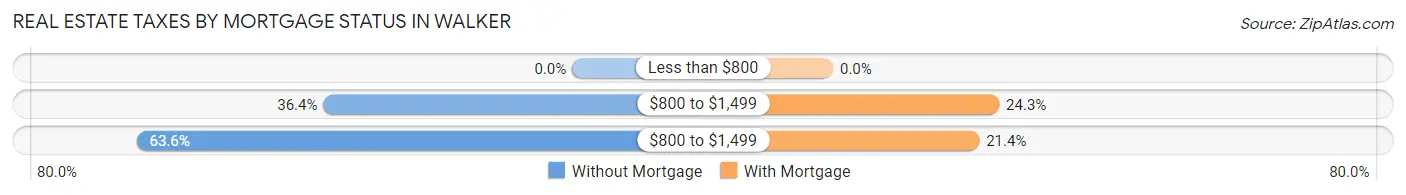
| Property Taxes | Without Mortgage | With Mortgage |
| Less than $800 | 0 (0.0%) | 0 (0.0%) |
| $800 to $1,499 | 40 (36.4%) | 25 (24.3%) |
| $800 to $1,499 | 70 (63.6%) | 22 (21.4%) |
| Total | 110 (100.0%) | 103 (100.0%) |
Health & Disability in Walker
Health Insurance Coverage by Age in Walker
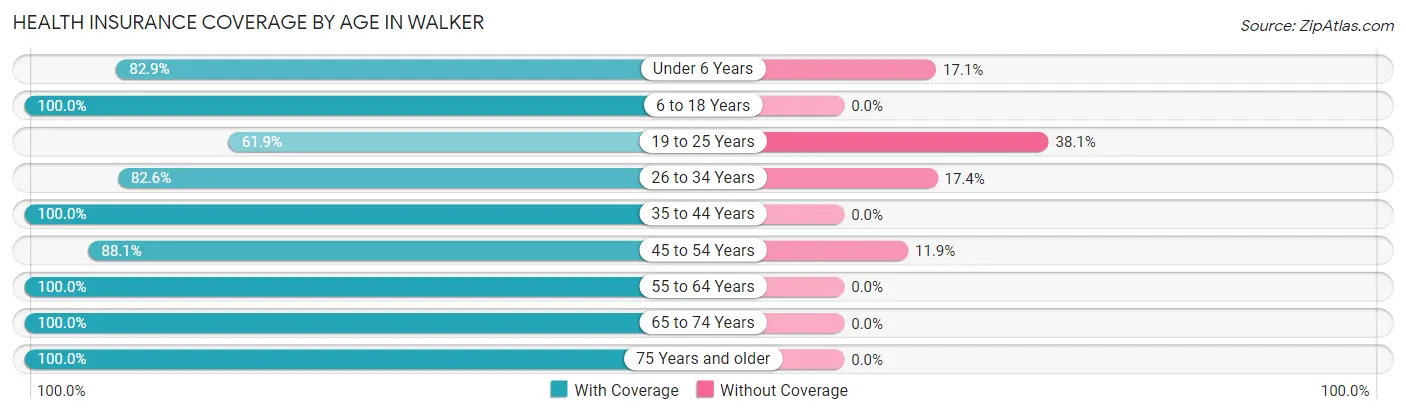
| Age Bracket | With Coverage | Without Coverage |
| Under 6 Years | 63 (82.9%) | 13 (17.1%) |
| 6 to 18 Years | 90 (100.0%) | 0 (0.0%) |
| 19 to 25 Years | 52 (61.9%) | 32 (38.1%) |
| 26 to 34 Years | 57 (82.6%) | 12 (17.4%) |
| 35 to 44 Years | 64 (100.0%) | 0 (0.0%) |
| 45 to 54 Years | 74 (88.1%) | 10 (11.9%) |
| 55 to 64 Years | 125 (100.0%) | 0 (0.0%) |
| 65 to 74 Years | 65 (100.0%) | 0 (0.0%) |
| 75 Years and older | 197 (100.0%) | 0 (0.0%) |
| Total | 787 (92.1%) | 67 (7.9%) |
Health Insurance Coverage by Citizenship Status in Walker
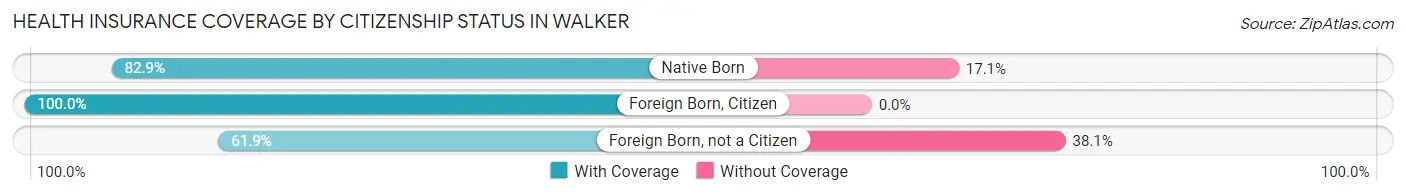
| Citizenship Status | With Coverage | Without Coverage |
| Native Born | 63 (82.9%) | 13 (17.1%) |
| Foreign Born, Citizen | 90 (100.0%) | 0 (0.0%) |
| Foreign Born, not a Citizen | 52 (61.9%) | 32 (38.1%) |
Health Insurance Coverage by Household Income in Walker
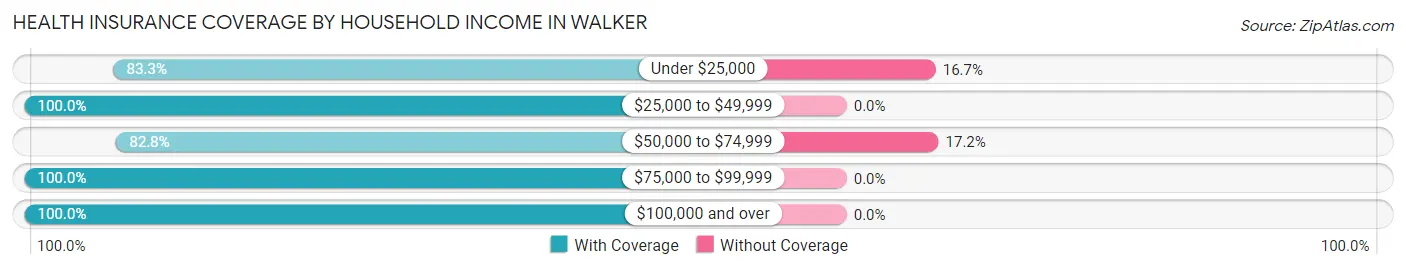
| Household Income | With Coverage | Without Coverage |
| Under $25,000 | 175 (83.3%) | 35 (16.7%) |
| $25,000 to $49,999 | 229 (100.0%) | 0 (0.0%) |
| $50,000 to $74,999 | 154 (82.8%) | 32 (17.2%) |
| $75,000 to $99,999 | 68 (100.0%) | 0 (0.0%) |
| $100,000 and over | 129 (100.0%) | 0 (0.0%) |
Public vs Private Health Insurance Coverage by Age in Walker
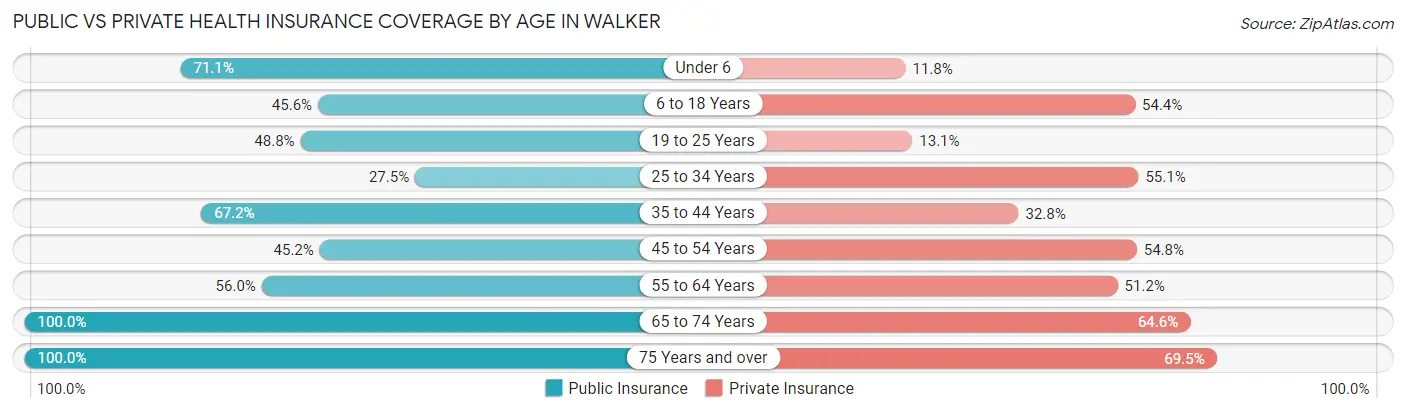
| Age Bracket | Public Insurance | Private Insurance |
| Under 6 | 54 (71.1%) | 9 (11.8%) |
| 6 to 18 Years | 41 (45.6%) | 49 (54.4%) |
| 19 to 25 Years | 41 (48.8%) | 11 (13.1%) |
| 25 to 34 Years | 19 (27.5%) | 38 (55.1%) |
| 35 to 44 Years | 43 (67.2%) | 21 (32.8%) |
| 45 to 54 Years | 38 (45.2%) | 46 (54.8%) |
| 55 to 64 Years | 70 (56.0%) | 64 (51.2%) |
| 65 to 74 Years | 65 (100.0%) | 42 (64.6%) |
| 75 Years and over | 197 (100.0%) | 137 (69.5%) |
| Total | 568 (66.5%) | 417 (48.8%) |
Disability Status by Sex by Age in Walker
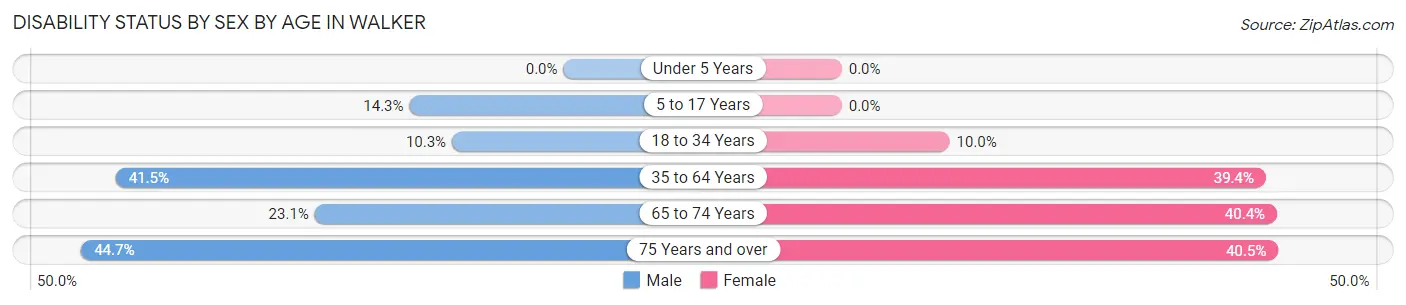
| Age Bracket | Male | Female |
| Under 5 Years | 0 (0.0%) | 0 (0.0%) |
| 5 to 17 Years | 6 (14.3%) | 0 (0.0%) |
| 18 to 34 Years | 6 (10.3%) | 11 (10.0%) |
| 35 to 64 Years | 49 (41.5%) | 61 (39.4%) |
| 65 to 74 Years | 3 (23.1%) | 21 (40.4%) |
| 75 Years and over | 34 (44.7%) | 49 (40.5%) |
Disability Class by Sex by Age in Walker
Disability Class: Hearing Difficulty
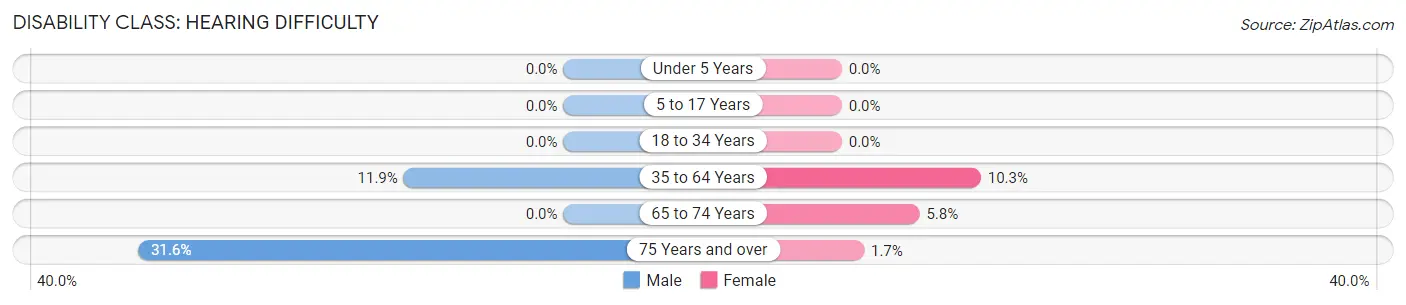
| Age Bracket | Male | Female |
| Under 5 Years | 0 (0.0%) | 0 (0.0%) |
| 5 to 17 Years | 0 (0.0%) | 0 (0.0%) |
| 18 to 34 Years | 0 (0.0%) | 0 (0.0%) |
| 35 to 64 Years | 14 (11.9%) | 16 (10.3%) |
| 65 to 74 Years | 0 (0.0%) | 3 (5.8%) |
| 75 Years and over | 24 (31.6%) | 2 (1.7%) |
Disability Class: Vision Difficulty
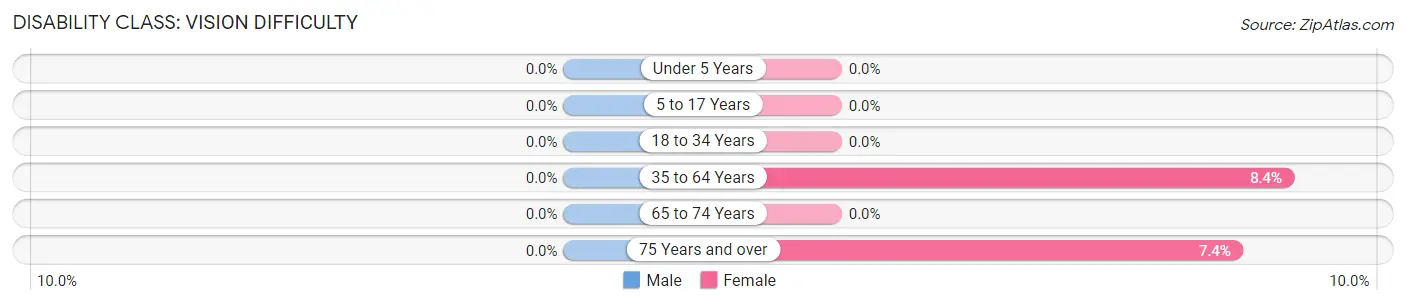
| Age Bracket | Male | Female |
| Under 5 Years | 0 (0.0%) | 0 (0.0%) |
| 5 to 17 Years | 0 (0.0%) | 0 (0.0%) |
| 18 to 34 Years | 0 (0.0%) | 0 (0.0%) |
| 35 to 64 Years | 0 (0.0%) | 13 (8.4%) |
| 65 to 74 Years | 0 (0.0%) | 0 (0.0%) |
| 75 Years and over | 0 (0.0%) | 9 (7.4%) |
Disability Class: Cognitive Difficulty
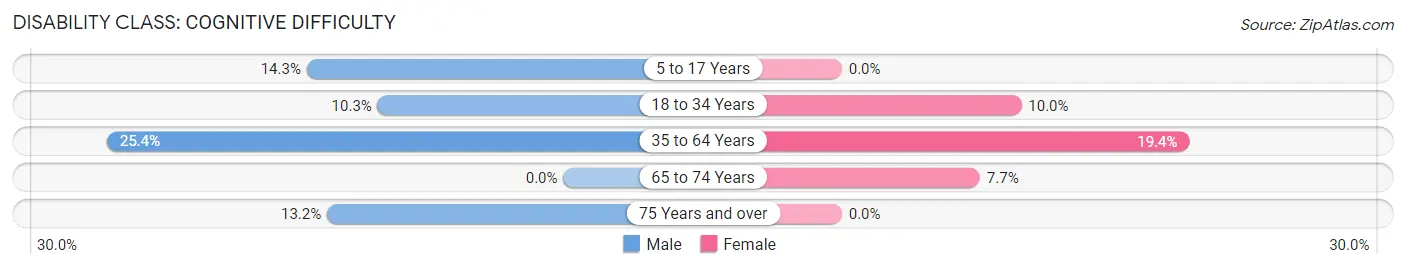
| Age Bracket | Male | Female |
| 5 to 17 Years | 6 (14.3%) | 0 (0.0%) |
| 18 to 34 Years | 6 (10.3%) | 11 (10.0%) |
| 35 to 64 Years | 30 (25.4%) | 30 (19.4%) |
| 65 to 74 Years | 0 (0.0%) | 4 (7.7%) |
| 75 Years and over | 10 (13.2%) | 0 (0.0%) |
Disability Class: Ambulatory Difficulty
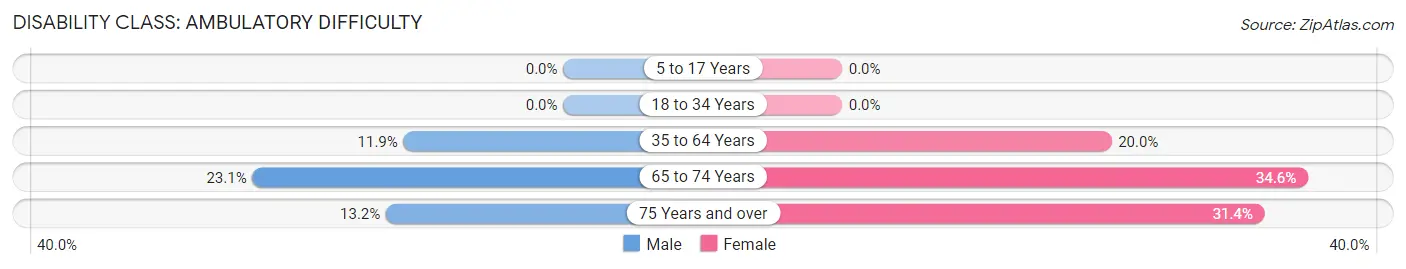
| Age Bracket | Male | Female |
| 5 to 17 Years | 0 (0.0%) | 0 (0.0%) |
| 18 to 34 Years | 0 (0.0%) | 0 (0.0%) |
| 35 to 64 Years | 14 (11.9%) | 31 (20.0%) |
| 65 to 74 Years | 3 (23.1%) | 18 (34.6%) |
| 75 Years and over | 10 (13.2%) | 38 (31.4%) |
Disability Class: Self-Care Difficulty
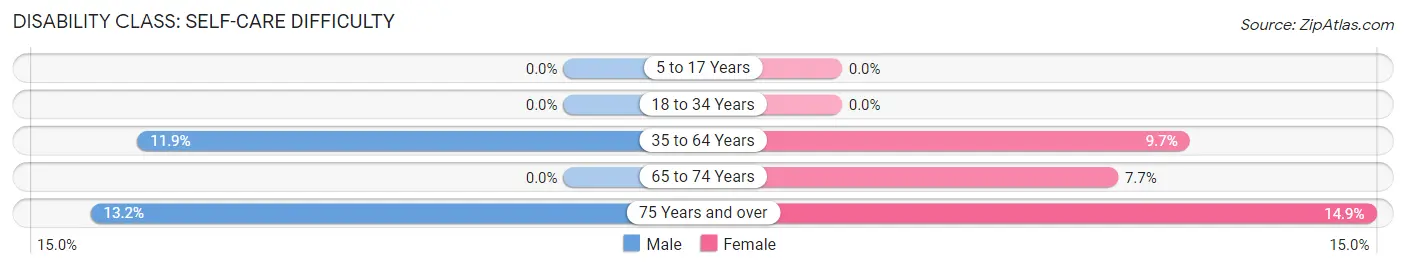
| Age Bracket | Male | Female |
| 5 to 17 Years | 0 (0.0%) | 0 (0.0%) |
| 18 to 34 Years | 0 (0.0%) | 0 (0.0%) |
| 35 to 64 Years | 14 (11.9%) | 15 (9.7%) |
| 65 to 74 Years | 0 (0.0%) | 4 (7.7%) |
| 75 Years and over | 10 (13.2%) | 18 (14.9%) |
Technology Access in Walker
Computing Device Access in Walker
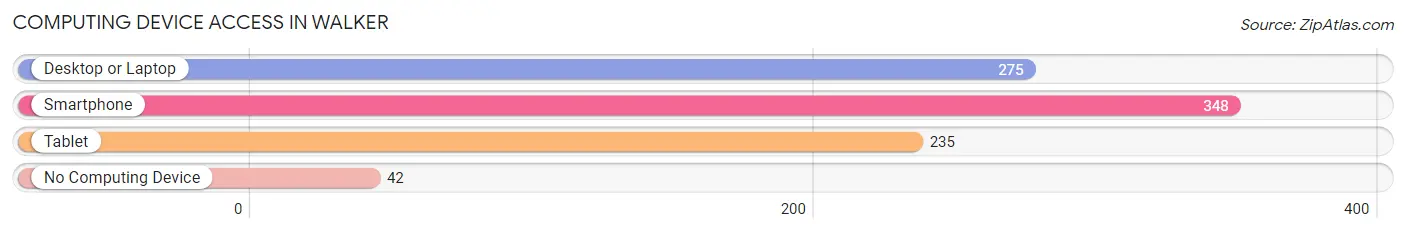
| Device Type | # Households | % Households |
| Desktop or Laptop | 275 | 62.8% |
| Smartphone | 348 | 79.4% |
| Tablet | 235 | 53.6% |
| No Computing Device | 42 | 9.6% |
| Total | 438 | 100.0% |
Internet Access in Walker
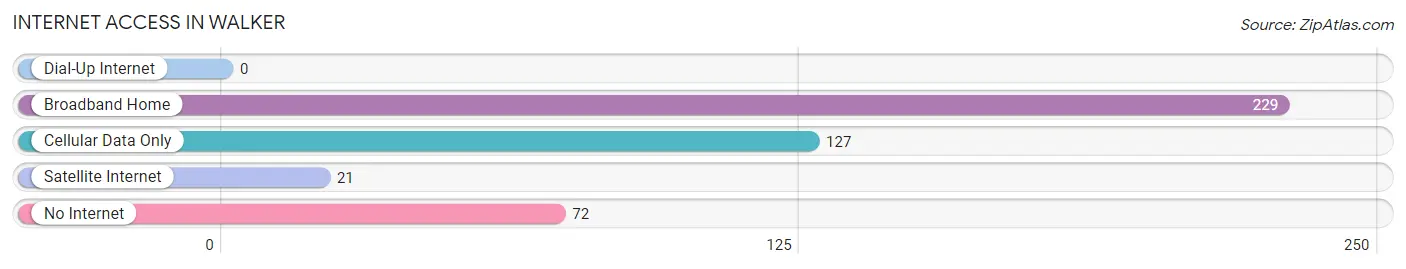
| Internet Type | # Households | % Households |
| Dial-Up Internet | 0 | 0.0% |
| Broadband Home | 229 | 52.3% |
| Cellular Data Only | 127 | 29.0% |
| Satellite Internet | 21 | 4.8% |
| No Internet | 72 | 16.4% |
| Total | 438 | 100.0% |
Walker Summary
Walker, Minnesota is a small city located in the north-central part of the state, in Cass County. It is situated on the south shore of Leech Lake, the third largest lake in Minnesota. The city is known for its natural beauty, outdoor recreation, and its vibrant arts and culture scene.
History
Walker was founded in 1882 by William A. and Mary Walker, who were looking for a place to settle and start a family. The Walkers purchased land from the Leech Lake Band of Ojibwe and built a log cabin on the shore of Leech Lake. The Walkers named the settlement after William Walker, and the city was incorporated in 1887.
In the early 1900s, Walker became a popular tourist destination, with visitors coming to enjoy the lake and the surrounding forests. The city was also home to a thriving logging industry, which provided jobs for many of the residents.
In the 1950s, Walker began to experience a decline in its economy, as the logging industry began to decline and tourism began to wane. In the 1970s, the city began to experience a resurgence, as the tourism industry began to rebound and the city began to attract new businesses.
Geography
Walker is located in the north-central part of Minnesota, in Cass County. It is situated on the south shore of Leech Lake, the third largest lake in Minnesota. The city is surrounded by forests and lakes, and is home to many parks and outdoor recreation areas.
The city has a total area of 4.2 square miles, of which 3.9 square miles is land and 0.3 square miles is water. The city is located at an elevation of 1,072 feet above sea level.
Economy
Walker’s economy is largely based on tourism and outdoor recreation. The city is home to several resorts and lodges, as well as a variety of outdoor activities such as fishing, hunting, boating, and camping. The city is also home to several businesses, including restaurants, retail stores, and service providers.
The city is also home to several manufacturing companies, including a paper mill and a wood products plant. The city is also home to a number of government offices, including the Cass County Courthouse and the Walker City Hall.
Demographics
As of the 2010 census, Walker had a population of 1,769. The racial makeup of the city was 94.2% White, 0.3% African American, 0.7% Native American, 0.3% Asian, 0.1% Pacific Islander, 2.3% from other races, and 2.3% from two or more races. Hispanic or Latino of any race were 4.2% of the population.
The median income for a household in the city was $37,917, and the median income for a family was $45,000. The per capita income for the city was $20,845. About 11.2% of families and 14.2% of the population were below the poverty line, including 18.2% of those under age 18 and 8.3% of those age 65 or over.
Common Questions
What is Per Capita Income in Walker?
Per Capita income in Walker is $27,056.
What is the Median Family Income in Walker?
Median Family Income in Walker is $68,750.
What is the Median Household income in Walker?
Median Household Income in Walker is $32,857.
What is Income or Wage Gap in Walker?
Income or Wage Gap in Walker is 47.9%.
Women in Walker earn 52.1 cents for every dollar earned by a man.
What is Inequality or Gini Index in Walker?
Inequality or Gini Index in Walker is 0.51.
What is the Total Population of Walker?
Total Population of Walker is 937.
What is the Total Male Population of Walker?
Total Male Population of Walker is 363.
What is the Total Female Population of Walker?
Total Female Population of Walker is 574.
What is the Ratio of Males per 100 Females in Walker?
There are 63.24 Males per 100 Females in Walker.
What is the Ratio of Females per 100 Males in Walker?
There are 158.13 Females per 100 Males in Walker.
What is the Median Population Age in Walker?
Median Population Age in Walker is 54.0 Years.
What is the Average Family Size in Walker
Average Family Size in Walker is 2.8 People.
What is the Average Household Size in Walker
Average Household Size in Walker is 1.9 People.
How Large is the Labor Force in Walker?
There are 361 People in the Labor Forcein in Walker.
What is the Percentage of People in the Labor Force in Walker?
44.7% of People are in the Labor Force in Walker.
What is the Unemployment Rate in Walker?
Unemployment Rate in Walker is 7.5%.