New Ulm, MN Map & Demographics
New Ulm Map
New Ulm Overview
$33,582
PER CAPITA INCOME
$86,861
AVG FAMILY INCOME
$59,985
AVG HOUSEHOLD INCOME
33.9%
WAGE / INCOME GAP [ % ]
66.1¢/ $1
WAGE / INCOME GAP [ $ ]
0.39
INEQUALITY / GINI INDEX
14,055
TOTAL POPULATION
6,806
MALE POPULATION
7,249
FEMALE POPULATION
93.89
MALES / 100 FEMALES
106.51
FEMALES / 100 MALES
38.9
MEDIAN AGE
2.8
AVG FAMILY SIZE
2.2
AVG HOUSEHOLD SIZE
7,487
LABOR FORCE [ PEOPLE ]
65.8%
PERCENT IN LABOR FORCE
2.8%
UNEMPLOYMENT RATE
New Ulm Zip Codes
New Ulm Area Codes
Income in New Ulm
Income Overview in New Ulm
Per Capita Income in New Ulm is $33,582, while median incomes of families and households are $86,861 and $59,985 respectively.
| Characteristic | Number | Measure |
| Per Capita Income | 14,055 | $33,582 |
| Median Family Income | 3,586 | $86,861 |
| Mean Family Income | 3,586 | $97,389 |
| Median Household Income | 5,938 | $59,985 |
| Mean Household Income | 5,938 | $78,266 |
| Income Deficit | 3,586 | $0 |
| Wage / Income Gap (%) | 14,055 | 33.89% |
| Wage / Income Gap ($) | 14,055 | 66.11¢ per $1 |
| Gini / Inequality Index | 14,055 | 0.39 |
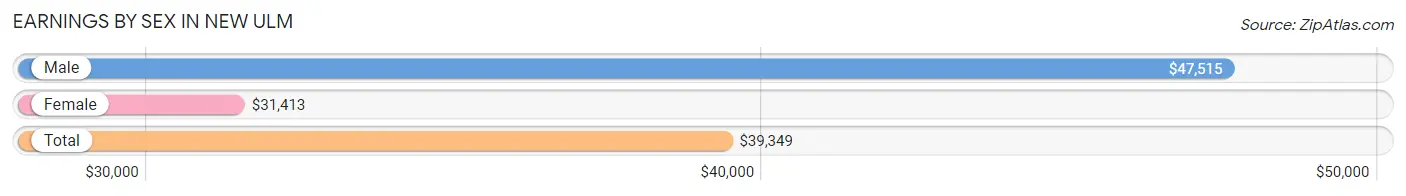
Earnings by Sex in New Ulm
Average Earnings in New Ulm are $39,349, $47,515 for men and $31,413 for women, a difference of 33.9%.
| Sex | Number | Average Earnings |
| Male | 4,047 (50.2%) | $47,515 |
| Female | 4,015 (49.8%) | $31,413 |
| Total | 8,062 (100.0%) | $39,349 |
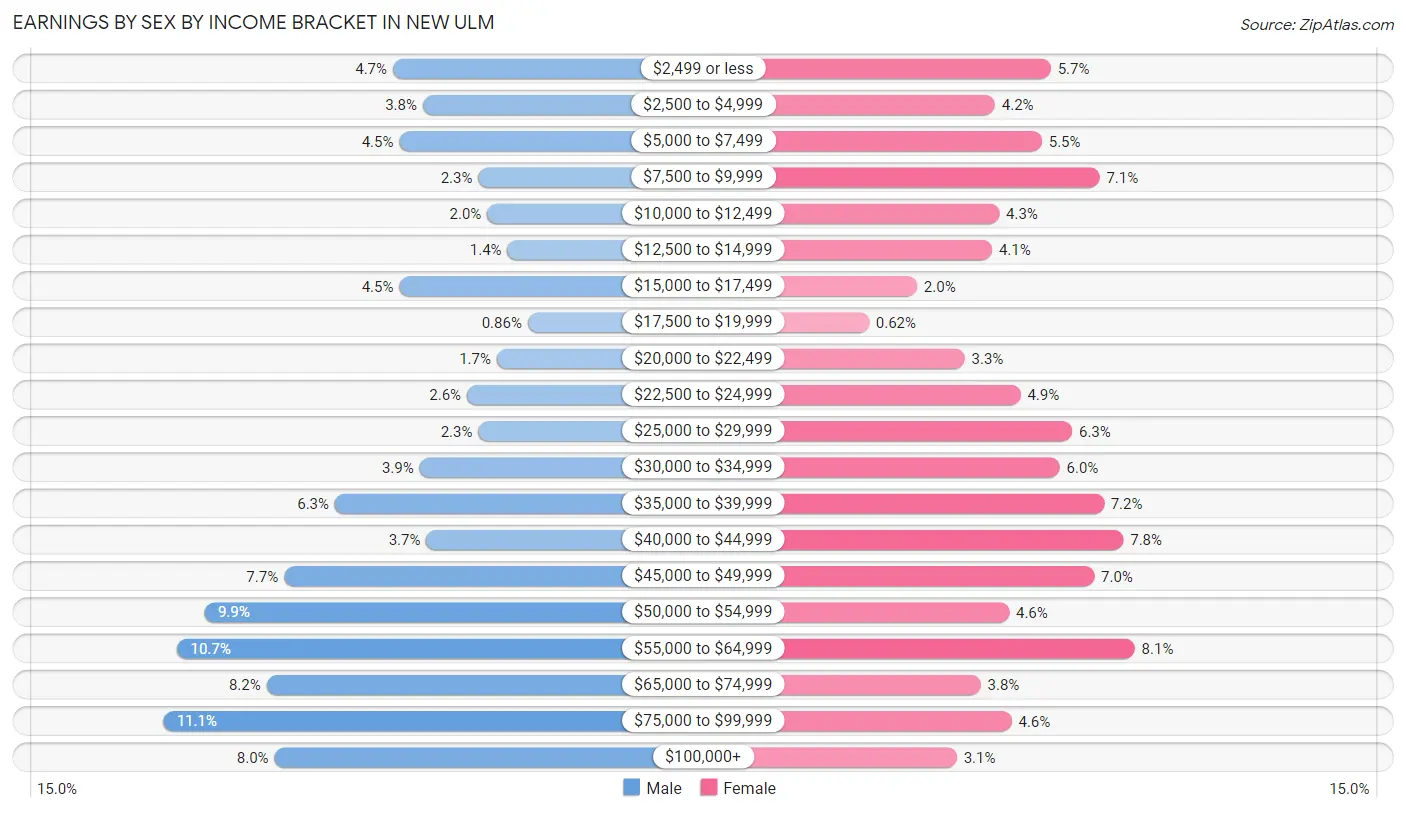
Earnings by Sex by Income Bracket in New Ulm
The most common earnings brackets in New Ulm are $75,000 to $99,999 for men (449 | 11.1%) and $55,000 to $64,999 for women (325 | 8.1%).
| Income | Male | Female |
| $2,499 or less | 188 (4.6%) | 230 (5.7%) |
| $2,500 to $4,999 | 154 (3.8%) | 167 (4.2%) |
| $5,000 to $7,499 | 181 (4.5%) | 220 (5.5%) |
| $7,500 to $9,999 | 91 (2.2%) | 285 (7.1%) |
| $10,000 to $12,499 | 81 (2.0%) | 172 (4.3%) |
| $12,500 to $14,999 | 58 (1.4%) | 164 (4.1%) |
| $15,000 to $17,499 | 181 (4.5%) | 79 (2.0%) |
| $17,500 to $19,999 | 35 (0.9%) | 25 (0.6%) |
| $20,000 to $22,499 | 70 (1.7%) | 133 (3.3%) |
| $22,500 to $24,999 | 104 (2.6%) | 196 (4.9%) |
| $25,000 to $29,999 | 91 (2.2%) | 254 (6.3%) |
| $30,000 to $34,999 | 158 (3.9%) | 240 (6.0%) |
| $35,000 to $39,999 | 254 (6.3%) | 290 (7.2%) |
| $40,000 to $44,999 | 150 (3.7%) | 312 (7.8%) |
| $45,000 to $49,999 | 312 (7.7%) | 279 (7.0%) |
| $50,000 to $54,999 | 402 (9.9%) | 183 (4.6%) |
| $55,000 to $64,999 | 433 (10.7%) | 325 (8.1%) |
| $65,000 to $74,999 | 332 (8.2%) | 151 (3.8%) |
| $75,000 to $99,999 | 449 (11.1%) | 186 (4.6%) |
| $100,000+ | 323 (8.0%) | 124 (3.1%) |
| Total | 4,047 (100.0%) | 4,015 (100.0%) |
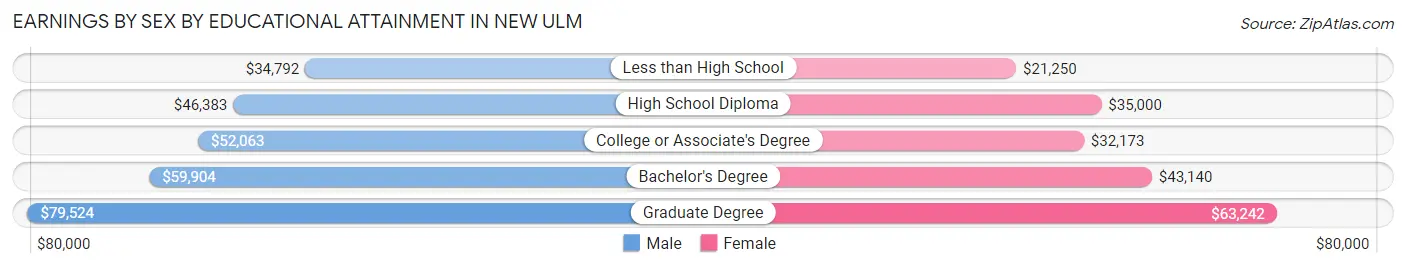
Earnings by Sex by Educational Attainment in New Ulm
Average earnings in New Ulm are $52,330 for men and $38,380 for women, a difference of 26.7%. Men with an educational attainment of graduate degree enjoy the highest average annual earnings of $79,524, while those with less than high school education earn the least with $34,792. Women with an educational attainment of graduate degree earn the most with the average annual earnings of $63,242, while those with less than high school education have the smallest earnings of $21,250.
| Educational Attainment | Male Income | Female Income |
| Less than High School | $34,792 | $21,250 |
| High School Diploma | $46,383 | $35,000 |
| College or Associate's Degree | $52,063 | $32,173 |
| Bachelor's Degree | $59,904 | $43,140 |
| Graduate Degree | $79,524 | $63,242 |
| Total | $52,330 | $38,380 |
Family Income in New Ulm
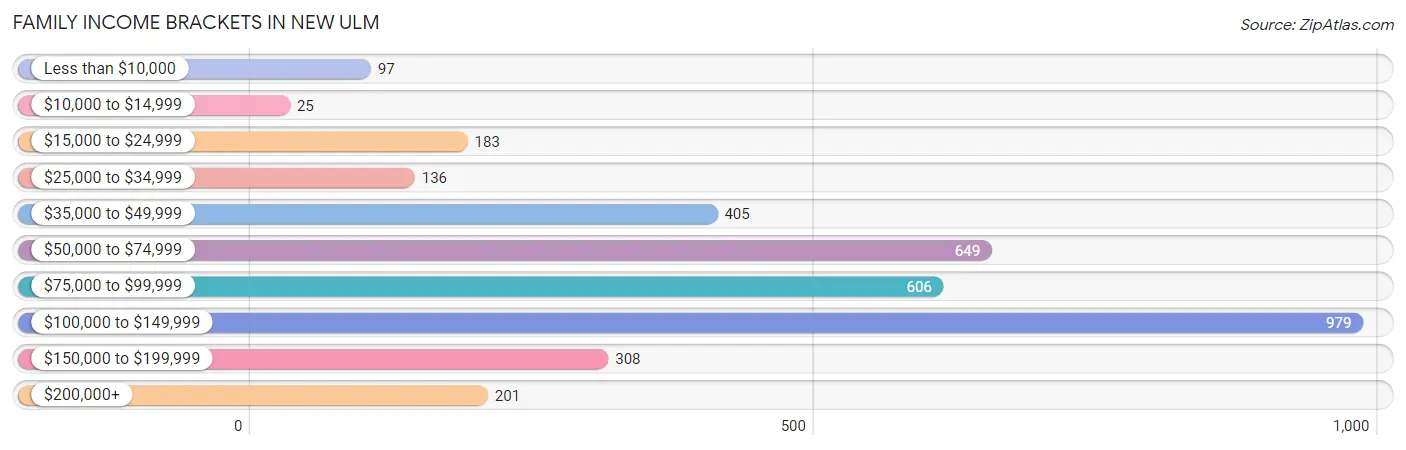
Family Income Brackets in New Ulm
According to the New Ulm family income data, there are 979 families falling into the $100,000 to $149,999 income range, which is the most common income bracket and makes up 27.3% of all families. Conversely, the $10,000 to $14,999 income bracket is the least frequent group with only 25 families (0.7%) belonging to this category.
| Income Bracket | # Families | % Families |
| Less than $10,000 | 97 | 2.7% |
| $10,000 to $14,999 | 25 | 0.7% |
| $15,000 to $24,999 | 183 | 5.1% |
| $25,000 to $34,999 | 136 | 3.8% |
| $35,000 to $49,999 | 405 | 11.3% |
| $50,000 to $74,999 | 649 | 18.1% |
| $75,000 to $99,999 | 606 | 16.9% |
| $100,000 to $149,999 | 979 | 27.3% |
| $150,000 to $199,999 | 308 | 8.6% |
| $200,000+ | 201 | 5.6% |
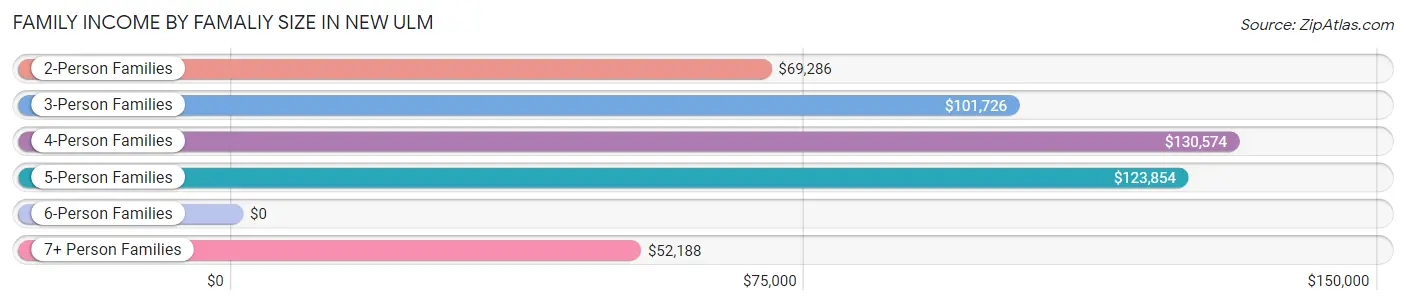
Family Income by Famaliy Size in New Ulm
4-person families (575 | 16.0%) account for the highest median family income in New Ulm with $130,574 per family, while 2-person families (2,014 | 56.2%) have the highest median income of $34,643 per family member.
| Income Bracket | # Families | Median Income |
| 2-Person Families | 2,014 (56.2%) | $69,286 |
| 3-Person Families | 593 (16.5%) | $101,726 |
| 4-Person Families | 575 (16.0%) | $130,574 |
| 5-Person Families | 270 (7.5%) | $123,854 |
| 6-Person Families | 22 (0.6%) | $0 |
| 7+ Person Families | 112 (3.1%) | $52,188 |
| Total | 3,586 (100.0%) | $86,861 |
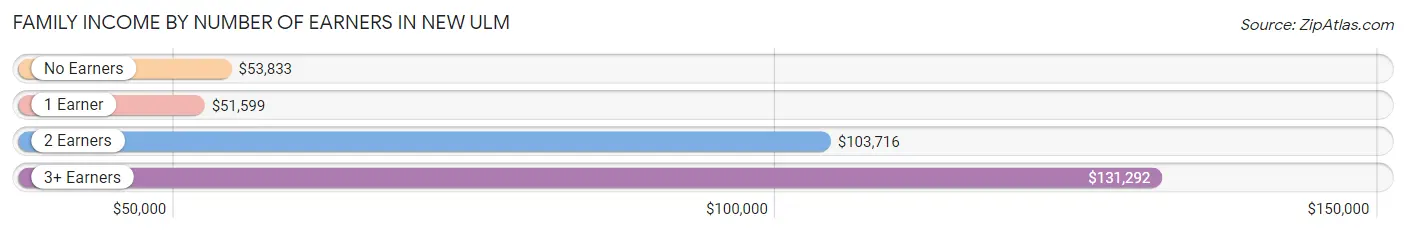
Family Income by Number of Earners in New Ulm
The median family income in New Ulm is $86,861, with families comprising 3+ earners (449) having the highest median family income of $131,292, while families with 1 earner (979) have the lowest median family income of $51,599, accounting for 12.5% and 27.3% of families, respectively.
| Number of Earners | # Families | Median Income |
| No Earners | 592 (16.5%) | $53,833 |
| 1 Earner | 979 (27.3%) | $51,599 |
| 2 Earners | 1,566 (43.7%) | $103,716 |
| 3+ Earners | 449 (12.5%) | $131,292 |
| Total | 3,586 (100.0%) | $86,861 |
Household Income in New Ulm
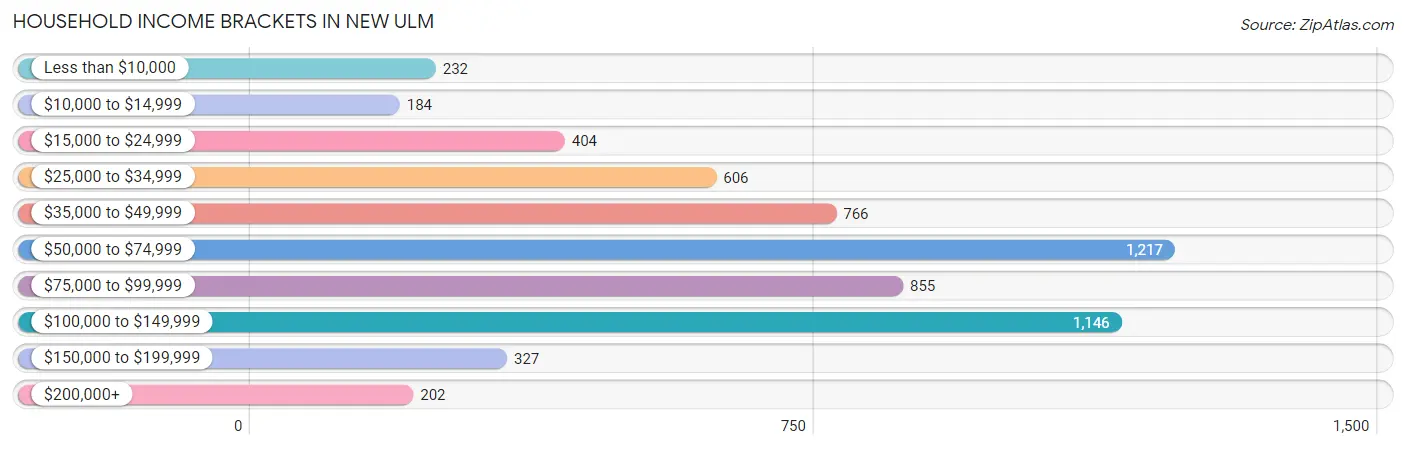
Household Income Brackets in New Ulm
With 1,217 households falling in the category, the $50,000 to $74,999 income range is the most frequent in New Ulm, accounting for 20.5% of all households. In contrast, only 184 households (3.1%) fall into the $10,000 to $14,999 income bracket, making it the least populous group.
| Income Bracket | # Households | % Households |
| Less than $10,000 | 232 | 3.9% |
| $10,000 to $14,999 | 184 | 3.1% |
| $15,000 to $24,999 | 404 | 6.8% |
| $25,000 to $34,999 | 606 | 10.2% |
| $35,000 to $49,999 | 766 | 12.9% |
| $50,000 to $74,999 | 1,217 | 20.5% |
| $75,000 to $99,999 | 855 | 14.4% |
| $100,000 to $149,999 | 1,146 | 19.3% |
| $150,000 to $199,999 | 327 | 5.5% |
| $200,000+ | 202 | 3.4% |
Household Income by Householder Age in New Ulm
The median household income in New Ulm is $59,985, with the highest median household income of $80,756 found in the 45 to 64 years age bracket for the primary householder. A total of 1,972 households (33.2%) fall into this category. Meanwhile, the 65+ years age bracket for the primary householder has the lowest median household income of $46,572, with 1,873 households (31.5%) in this group.
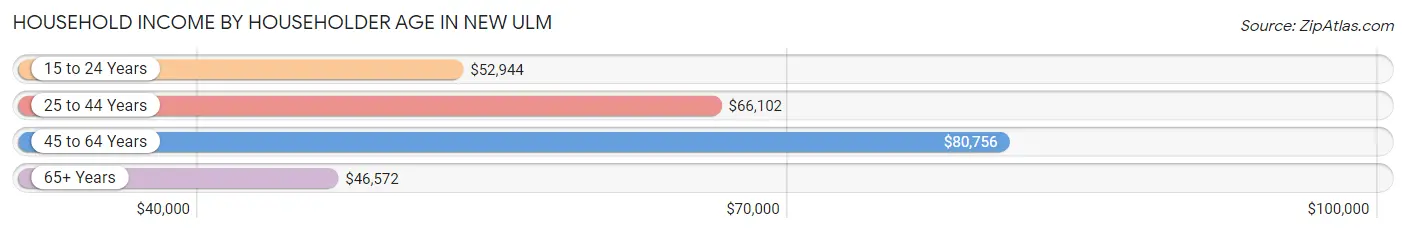
| Income Bracket | # Households | Median Income |
| 15 to 24 Years | 203 (3.4%) | $52,944 |
| 25 to 44 Years | 1,890 (31.8%) | $66,102 |
| 45 to 64 Years | 1,972 (33.2%) | $80,756 |
| 65+ Years | 1,873 (31.5%) | $46,572 |
| Total | 5,938 (100.0%) | $59,985 |
Poverty in New Ulm
Income Below Poverty by Sex and Age in New Ulm
With 7.2% poverty level for males and 9.4% for females among the residents of New Ulm, 5 year old males and 5 year old females are the most vulnerable to poverty, with 36 males (50.0%) and 20 females (40.0%) in their respective age groups living below the poverty level.
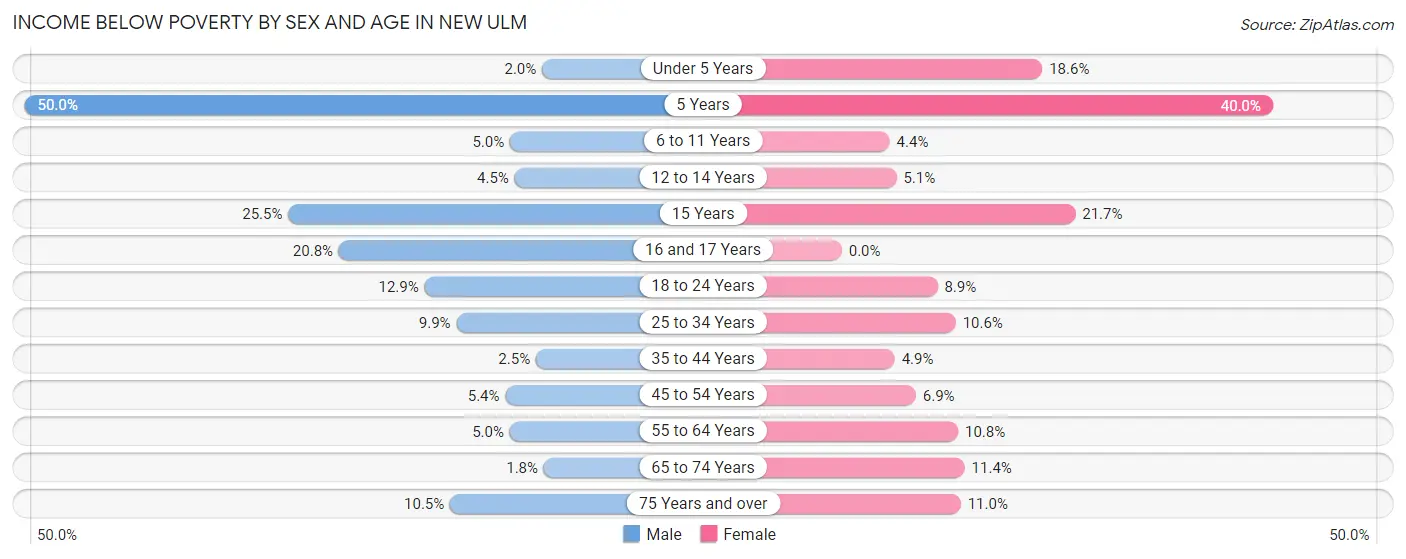
| Age Bracket | Male | Female |
| Under 5 Years | 7 (2.0%) | 64 (18.6%) |
| 5 Years | 36 (50.0%) | 20 (40.0%) |
| 6 to 11 Years | 22 (5.0%) | 23 (4.4%) |
| 12 to 14 Years | 17 (4.5%) | 14 (5.1%) |
| 15 Years | 24 (25.5%) | 26 (21.7%) |
| 16 and 17 Years | 45 (20.8%) | 0 (0.0%) |
| 18 to 24 Years | 63 (12.9%) | 46 (8.9%) |
| 25 to 34 Years | 75 (9.9%) | 82 (10.6%) |
| 35 to 44 Years | 22 (2.5%) | 42 (4.9%) |
| 45 to 54 Years | 36 (5.4%) | 53 (6.9%) |
| 55 to 64 Years | 42 (5.0%) | 96 (10.8%) |
| 65 to 74 Years | 12 (1.8%) | 87 (11.4%) |
| 75 Years and over | 60 (10.5%) | 83 (11.0%) |
| Total | 461 (7.2%) | 636 (9.4%) |
Income Above Poverty by Sex and Age in New Ulm
According to the poverty statistics in New Ulm, males aged 65 to 74 years and females aged 16 and 17 years are the age groups that are most secure financially, with 98.2% of males and 100.0% of females in these age groups living above the poverty line.
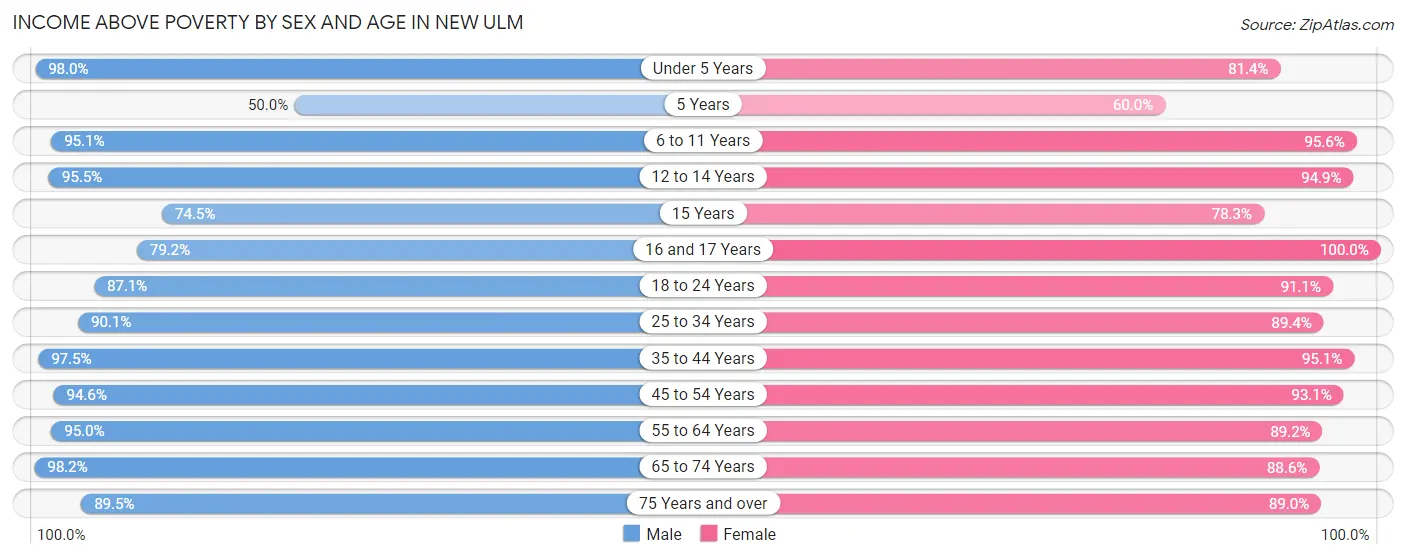
| Age Bracket | Male | Female |
| Under 5 Years | 348 (98.0%) | 280 (81.4%) |
| 5 Years | 36 (50.0%) | 30 (60.0%) |
| 6 to 11 Years | 422 (95.1%) | 495 (95.6%) |
| 12 to 14 Years | 359 (95.5%) | 262 (94.9%) |
| 15 Years | 70 (74.5%) | 94 (78.3%) |
| 16 and 17 Years | 171 (79.2%) | 146 (100.0%) |
| 18 to 24 Years | 426 (87.1%) | 472 (91.1%) |
| 25 to 34 Years | 681 (90.1%) | 694 (89.4%) |
| 35 to 44 Years | 845 (97.5%) | 814 (95.1%) |
| 45 to 54 Years | 633 (94.6%) | 718 (93.1%) |
| 55 to 64 Years | 803 (95.0%) | 794 (89.2%) |
| 65 to 74 Years | 651 (98.2%) | 676 (88.6%) |
| 75 Years and over | 511 (89.5%) | 669 (89.0%) |
| Total | 5,956 (92.8%) | 6,144 (90.6%) |
Income Below Poverty Among Married-Couple Families in New Ulm
The poverty statistics for married-couple families in New Ulm show that 2.8% or 73 of the total 2,645 families live below the poverty line. Families with no children have the highest poverty rate of 4.1%, comprising of 68 families. On the other hand, families with 1 or 2 children have the lowest poverty rate of 0.0%, which includes 0 families.
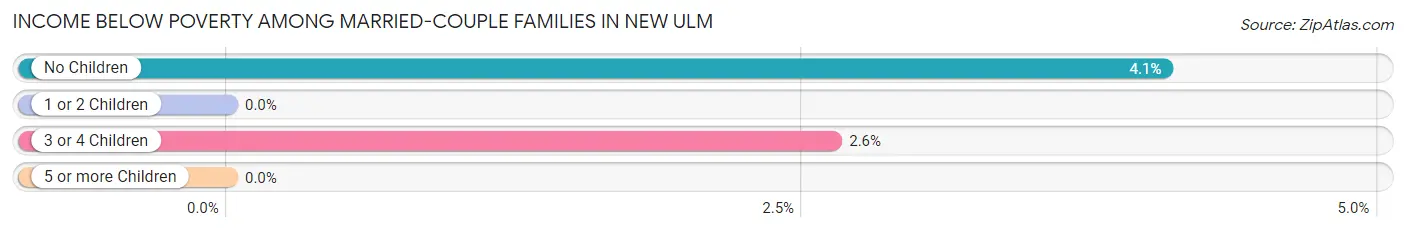
| Children | Above Poverty | Below Poverty |
| No Children | 1,603 (95.9%) | 68 (4.1%) |
| 1 or 2 Children | 672 (100.0%) | 0 (0.0%) |
| 3 or 4 Children | 185 (97.4%) | 5 (2.6%) |
| 5 or more Children | 112 (100.0%) | 0 (0.0%) |
| Total | 2,572 (97.2%) | 73 (2.8%) |
Income Below Poverty Among Single-Parent Households in New Ulm
According to the poverty data in New Ulm, 2.9% or 8 single-father households and 20.3% or 135 single-mother households are living below the poverty line. Among single-father households, those with 1 or 2 children have the highest poverty rate, with 8 households (4.7%) experiencing poverty. Likewise, among single-mother households, those with 3 or 4 children have the highest poverty rate, with 54 households (62.1%) falling below the poverty line.
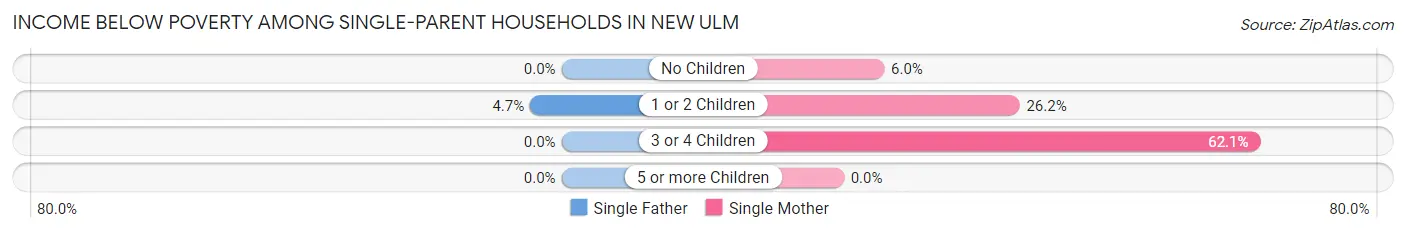
| Children | Single Father | Single Mother |
| No Children | 0 (0.0%) | 21 (6.0%) |
| 1 or 2 Children | 8 (4.7%) | 60 (26.2%) |
| 3 or 4 Children | 0 (0.0%) | 54 (62.1%) |
| 5 or more Children | 0 (0.0%) | 0 (0.0%) |
| Total | 8 (2.9%) | 135 (20.3%) |
Income Below Poverty Among Married-Couple vs Single-Parent Households in New Ulm
The poverty data for New Ulm shows that 73 of the married-couple family households (2.8%) and 143 of the single-parent households (15.2%) are living below the poverty level. Within the married-couple family households, those with no children have the highest poverty rate, with 68 households (4.1%) falling below the poverty line. Among the single-parent households, those with 3 or 4 children have the highest poverty rate, with 54 household (53.5%) living below poverty.
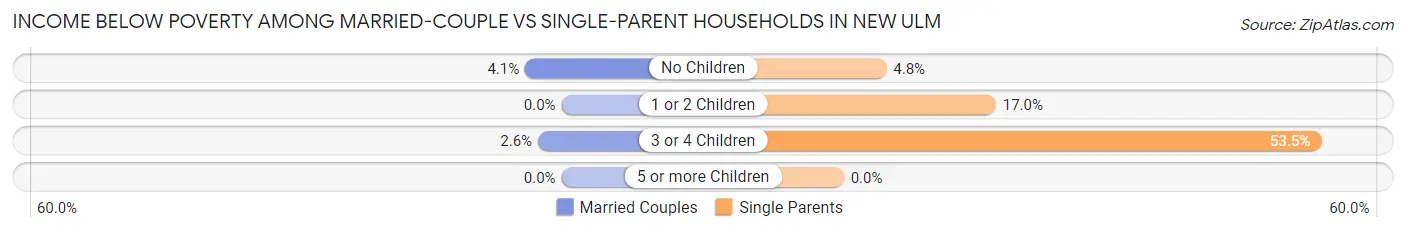
| Children | Married-Couple Families | Single-Parent Households |
| No Children | 68 (4.1%) | 21 (4.8%) |
| 1 or 2 Children | 0 (0.0%) | 68 (17.0%) |
| 3 or 4 Children | 5 (2.6%) | 54 (53.5%) |
| 5 or more Children | 0 (0.0%) | 0 (0.0%) |
| Total | 73 (2.8%) | 143 (15.2%) |
Race in New Ulm
The most populous races in New Ulm are White / Caucasian (13,249 | 94.3%), Hispanic or Latino (493 | 3.5%), and Two or more Races (252 | 1.8%).
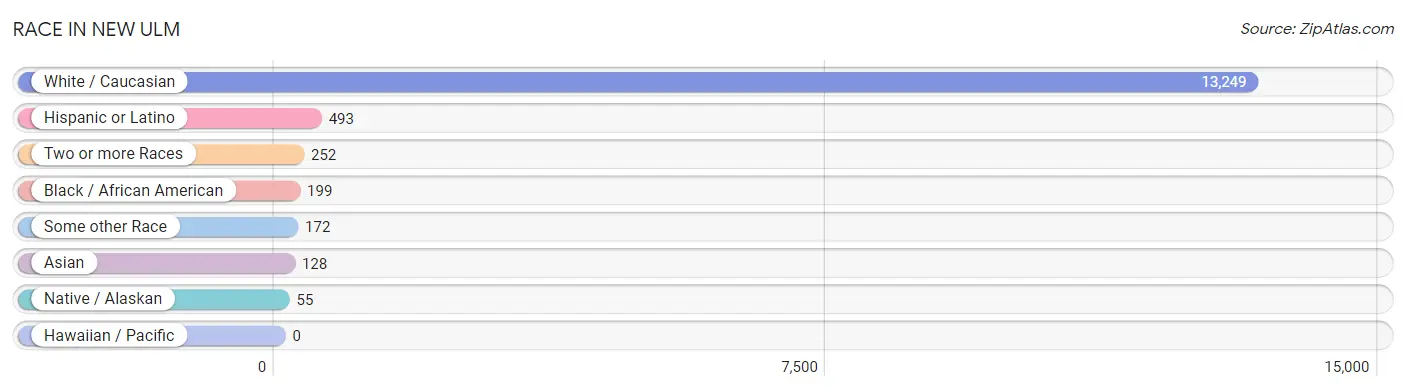
| Race | # Population | % Population |
| Asian | 128 | 0.9% |
| Black / African American | 199 | 1.4% |
| Hawaiian / Pacific | 0 | 0.0% |
| Hispanic or Latino | 493 | 3.5% |
| Native / Alaskan | 55 | 0.4% |
| White / Caucasian | 13,249 | 94.3% |
| Two or more Races | 252 | 1.8% |
| Some other Race | 172 | 1.2% |
| Total | 14,055 | 100.0% |
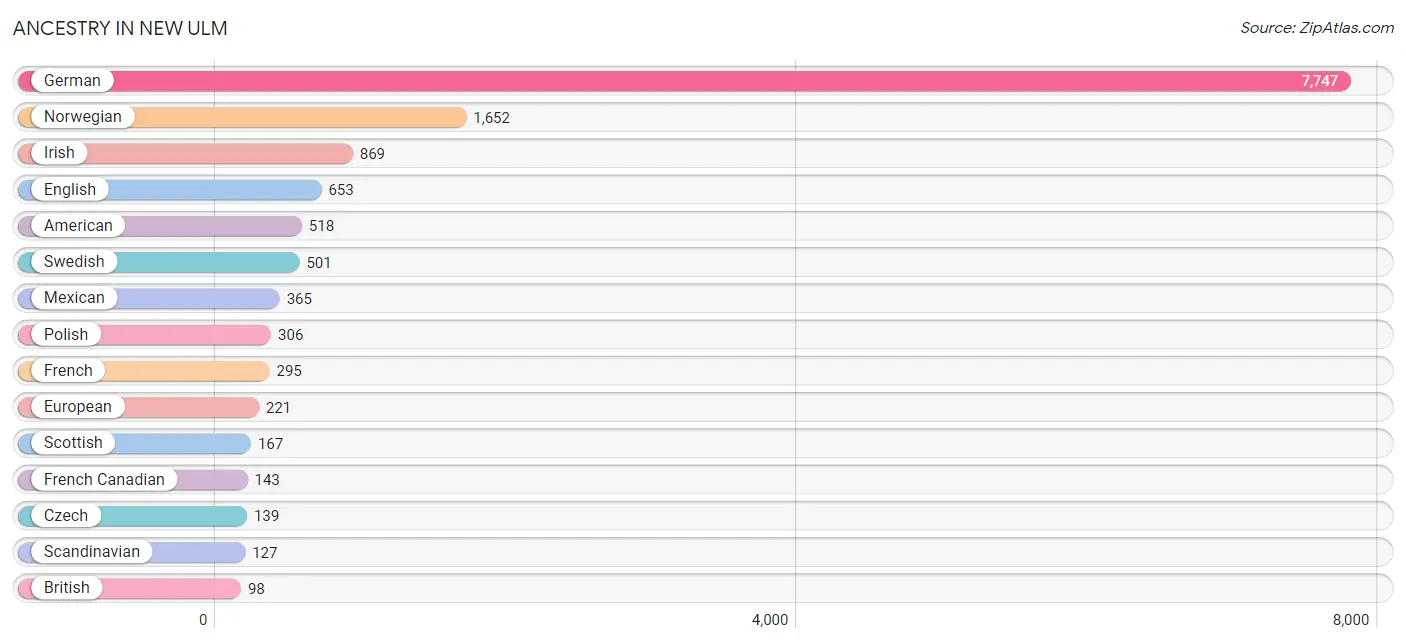
Ancestry in New Ulm
The most populous ancestries reported in New Ulm are German (7,747 | 55.1%), Norwegian (1,652 | 11.7%), Irish (869 | 6.2%), English (653 | 4.6%), and American (518 | 3.7%), together accounting for 81.4% of all New Ulm residents.
| Ancestry | # Population | % Population |
| American | 518 | 3.7% |
| Arab | 19 | 0.1% |
| Austrian | 46 | 0.3% |
| Bangladeshi | 8 | 0.1% |
| Belgian | 34 | 0.2% |
| Blackfeet | 1 | 0.0% |
| British | 98 | 0.7% |
| Burmese | 29 | 0.2% |
| Central American | 68 | 0.5% |
| Cherokee | 7 | 0.1% |
| Chippewa | 45 | 0.3% |
| Colombian | 6 | 0.0% |
| Croatian | 19 | 0.1% |
| Cuban | 3 | 0.0% |
| Czech | 139 | 1.0% |
| Czechoslovakian | 4 | 0.0% |
| Danish | 96 | 0.7% |
| Dutch | 96 | 0.7% |
| Eastern European | 6 | 0.0% |
| English | 653 | 4.6% |
| Ethiopian | 6 | 0.0% |
| European | 221 | 1.6% |
| Finnish | 79 | 0.6% |
| French | 295 | 2.1% |
| French Canadian | 143 | 1.0% |
| German | 7,747 | 55.1% |
| Greek | 12 | 0.1% |
| Honduran | 21 | 0.2% |
| Hungarian | 16 | 0.1% |
| Indian (Asian) | 28 | 0.2% |
| Irish | 869 | 6.2% |
| Iroquois | 6 | 0.0% |
| Italian | 89 | 0.6% |
| Japanese | 6 | 0.0% |
| Korean | 32 | 0.2% |
| Lebanese | 12 | 0.1% |
| Lithuanian | 6 | 0.0% |
| Malaysian | 16 | 0.1% |
| Mexican | 365 | 2.6% |
| Moroccan | 7 | 0.1% |
| Native Hawaiian | 3 | 0.0% |
| Nicaraguan | 40 | 0.3% |
| Nigerian | 5 | 0.0% |
| Norwegian | 1,652 | 11.7% |
| Panamanian | 7 | 0.1% |
| Pennsylvania German | 57 | 0.4% |
| Polish | 306 | 2.2% |
| Portuguese | 21 | 0.2% |
| Puerto Rican | 42 | 0.3% |
| Romanian | 24 | 0.2% |
| Russian | 94 | 0.7% |
| Scandinavian | 127 | 0.9% |
| Scotch-Irish | 40 | 0.3% |
| Scottish | 167 | 1.2% |
| Serbian | 5 | 0.0% |
| Sioux | 4 | 0.0% |
| Slavic | 1 | 0.0% |
| Slovak | 5 | 0.0% |
| Somali | 6 | 0.0% |
| South American | 6 | 0.0% |
| Spanish | 4 | 0.0% |
| Sri Lankan | 16 | 0.1% |
| Subsaharan African | 54 | 0.4% |
| Swedish | 501 | 3.6% |
| Swiss | 35 | 0.3% |
| Welsh | 64 | 0.5% |
| West Indian | 6 | 0.0% | View All 67 Rows |
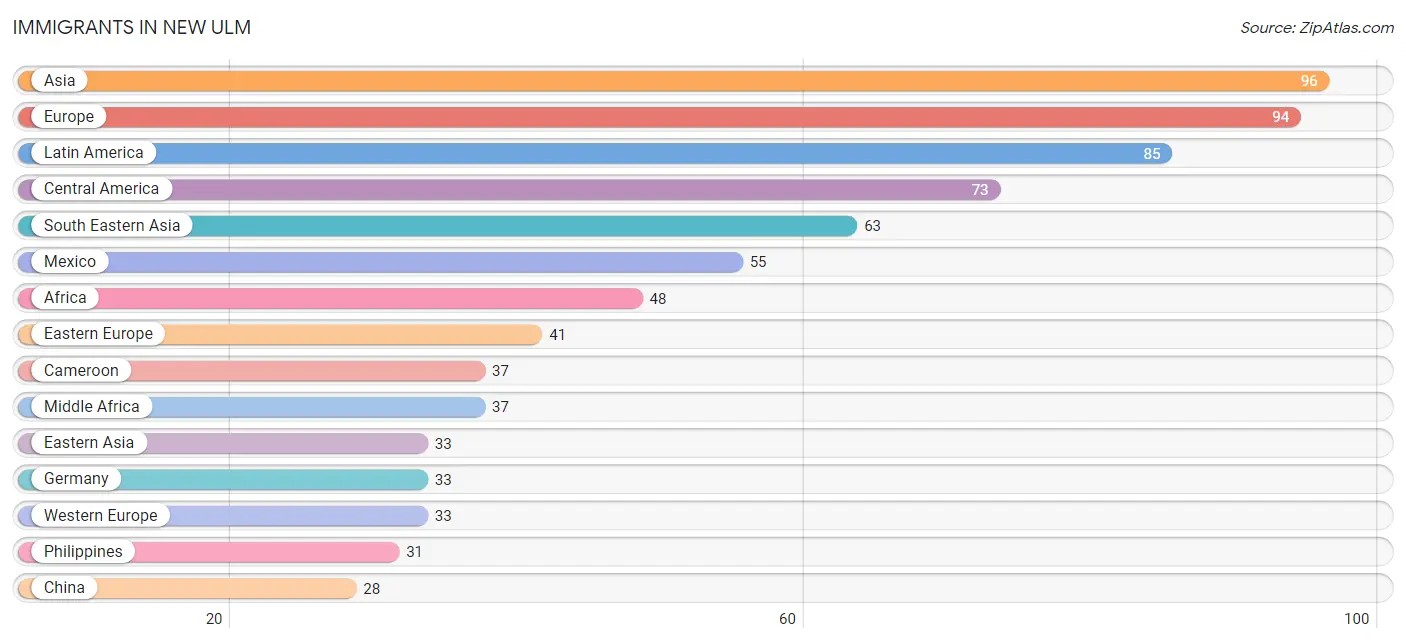
Immigrants in New Ulm
The most numerous immigrant groups reported in New Ulm came from Asia (96 | 0.7%), Europe (94 | 0.7%), Latin America (85 | 0.6%), Central America (73 | 0.5%), and South Eastern Asia (63 | 0.4%), together accounting for 2.9% of all New Ulm residents.
| Immigration Origin | # Population | % Population |
| Africa | 48 | 0.3% |
| Asia | 96 | 0.7% |
| Cameroon | 37 | 0.3% |
| Canada | 21 | 0.2% |
| Caribbean | 6 | 0.0% |
| Central America | 73 | 0.5% |
| China | 28 | 0.2% |
| Colombia | 6 | 0.0% |
| Czechoslovakia | 8 | 0.1% |
| Dominica | 6 | 0.0% |
| Eastern Africa | 11 | 0.1% |
| Eastern Asia | 33 | 0.2% |
| Eastern Europe | 41 | 0.3% |
| England | 14 | 0.1% |
| Ethiopia | 6 | 0.0% |
| Europe | 94 | 0.7% |
| Germany | 33 | 0.2% |
| Honduras | 11 | 0.1% |
| Hong Kong | 28 | 0.2% |
| Korea | 5 | 0.0% |
| Laos | 16 | 0.1% |
| Latin America | 85 | 0.6% |
| Mexico | 55 | 0.4% |
| Middle Africa | 37 | 0.3% |
| Northern Europe | 20 | 0.1% |
| Norway | 6 | 0.0% |
| Panama | 7 | 0.1% |
| Philippines | 31 | 0.2% |
| Poland | 14 | 0.1% |
| Russia | 19 | 0.1% |
| South America | 6 | 0.0% |
| South Eastern Asia | 63 | 0.4% |
| Vietnam | 16 | 0.1% |
| Western Europe | 33 | 0.2% | View All 34 Rows |
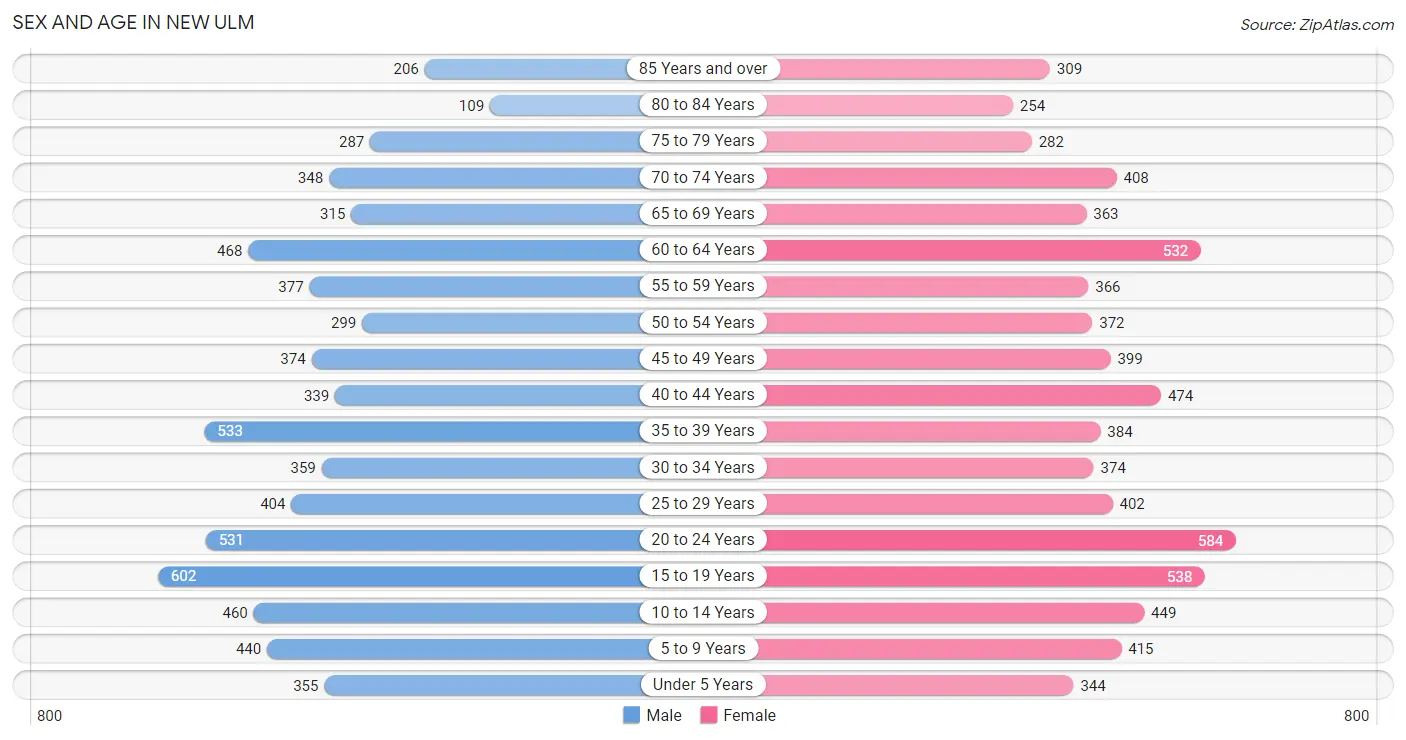
Sex and Age in New Ulm
Sex and Age in New Ulm
The most populous age groups in New Ulm are 15 to 19 Years (602 | 8.8%) for men and 20 to 24 Years (584 | 8.1%) for women.
| Age Bracket | Male | Female |
| Under 5 Years | 355 (5.2%) | 344 (4.8%) |
| 5 to 9 Years | 440 (6.5%) | 415 (5.7%) |
| 10 to 14 Years | 460 (6.8%) | 449 (6.2%) |
| 15 to 19 Years | 602 (8.8%) | 538 (7.4%) |
| 20 to 24 Years | 531 (7.8%) | 584 (8.1%) |
| 25 to 29 Years | 404 (5.9%) | 402 (5.6%) |
| 30 to 34 Years | 359 (5.3%) | 374 (5.2%) |
| 35 to 39 Years | 533 (7.8%) | 384 (5.3%) |
| 40 to 44 Years | 339 (5.0%) | 474 (6.5%) |
| 45 to 49 Years | 374 (5.5%) | 399 (5.5%) |
| 50 to 54 Years | 299 (4.4%) | 372 (5.1%) |
| 55 to 59 Years | 377 (5.5%) | 366 (5.1%) |
| 60 to 64 Years | 468 (6.9%) | 532 (7.3%) |
| 65 to 69 Years | 315 (4.6%) | 363 (5.0%) |
| 70 to 74 Years | 348 (5.1%) | 408 (5.6%) |
| 75 to 79 Years | 287 (4.2%) | 282 (3.9%) |
| 80 to 84 Years | 109 (1.6%) | 254 (3.5%) |
| 85 Years and over | 206 (3.0%) | 309 (4.3%) |
| Total | 6,806 (100.0%) | 7,249 (100.0%) |
Families and Households in New Ulm
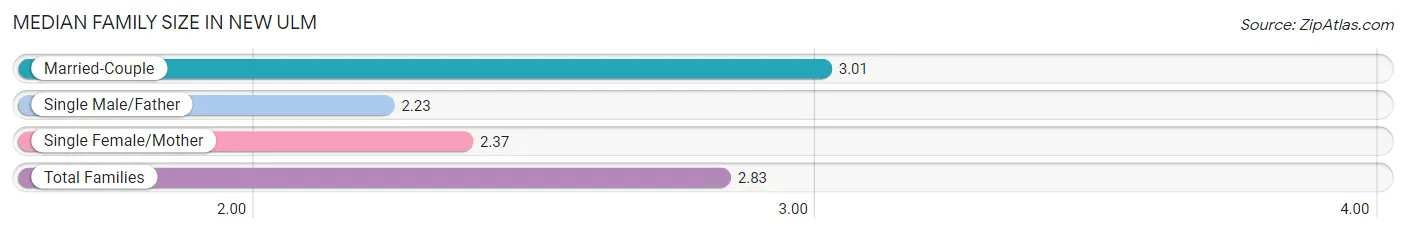
Median Family Size in New Ulm
The median family size in New Ulm is 2.83 persons per family, with married-couple families (2,645 | 73.8%) accounting for the largest median family size of 3.01 persons per family. On the other hand, single male/father families (277 | 7.7%) represent the smallest median family size with 2.23 persons per family.
| Family Type | # Families | Family Size |
| Married-Couple | 2,645 (73.8%) | 3.01 |
| Single Male/Father | 277 (7.7%) | 2.23 |
| Single Female/Mother | 664 (18.5%) | 2.37 |
| Total Families | 3,586 (100.0%) | 2.83 |
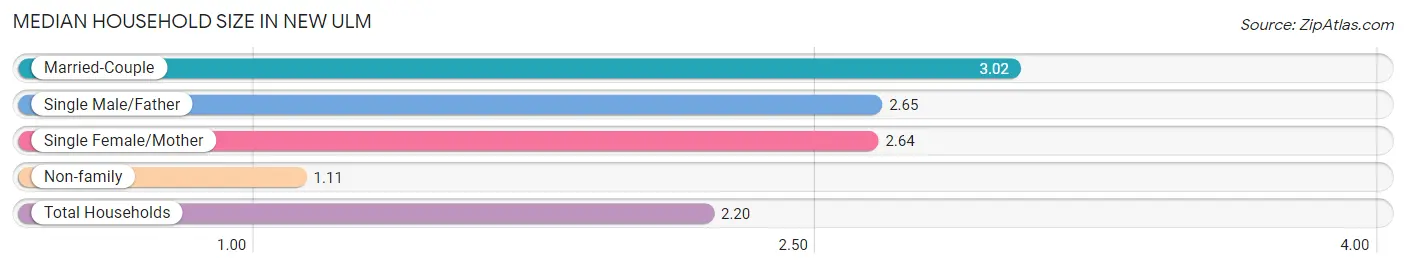
Median Household Size in New Ulm
The median household size in New Ulm is 2.20 persons per household, with married-couple households (2,645 | 44.5%) accounting for the largest median household size of 3.02 persons per household. non-family households (2,352 | 39.6%) represent the smallest median household size with 1.11 persons per household.
| Household Type | # Households | Household Size |
| Married-Couple | 2,645 (44.5%) | 3.02 |
| Single Male/Father | 277 (4.7%) | 2.65 |
| Single Female/Mother | 664 (11.2%) | 2.64 |
| Non-family | 2,352 (39.6%) | 1.11 |
| Total Households | 5,938 (100.0%) | 2.20 |
Household Size by Marriage Status in New Ulm
Out of a total of 5,938 households in New Ulm, 3,586 (60.4%) are family households, while 2,352 (39.6%) are nonfamily households. The most numerous type of family households are 2-person households, comprising 1,829, and the most common type of nonfamily households are 1-person households, comprising 2,117.
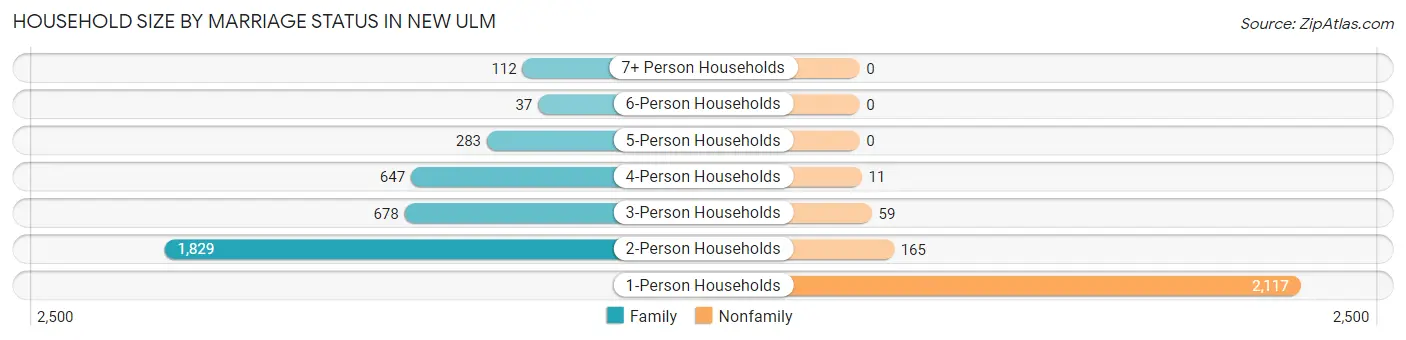
| Household Size | Family Households | Nonfamily Households |
| 1-Person Households | - | 2,117 (35.6%) |
| 2-Person Households | 1,829 (30.8%) | 165 (2.8%) |
| 3-Person Households | 678 (11.4%) | 59 (1.0%) |
| 4-Person Households | 647 (10.9%) | 11 (0.2%) |
| 5-Person Households | 283 (4.8%) | 0 (0.0%) |
| 6-Person Households | 37 (0.6%) | 0 (0.0%) |
| 7+ Person Households | 112 (1.9%) | 0 (0.0%) |
| Total | 3,586 (60.4%) | 2,352 (39.6%) |
Female Fertility in New Ulm
Fertility by Age in New Ulm
Average fertility rate in New Ulm is 59.0 births per 1,000 women. Women in the age bracket of 15 to 19 years have the highest fertility rate with 87.0 births per 1,000 women. Women in the age bracket of 20 to 34 years acount for 48.9% of all women with births.
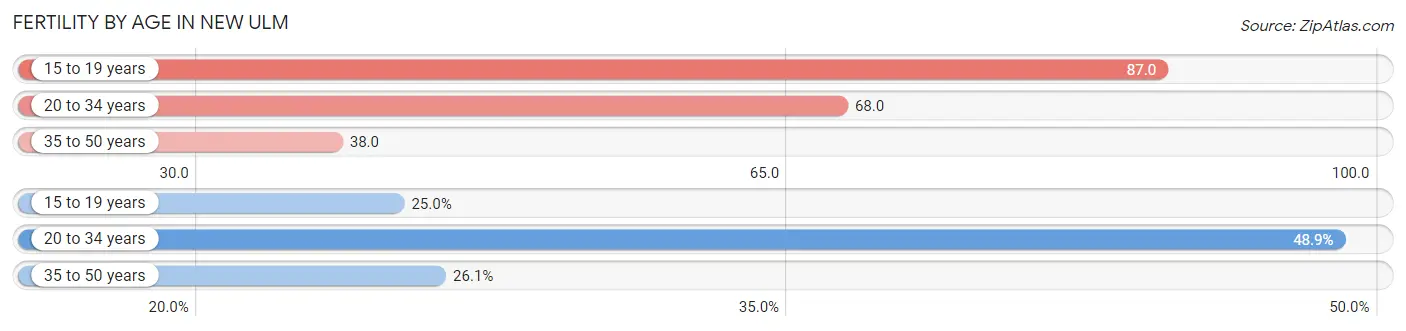
| Age Bracket | Women with Births | Births / 1,000 Women |
| 15 to 19 years | 47 (25.0%) | 87.0 |
| 20 to 34 years | 92 (48.9%) | 68.0 |
| 35 to 50 years | 49 (26.1%) | 38.0 |
| Total | 188 (100.0%) | 59.0 |
Fertility by Age by Marriage Status in New Ulm
61.7% of women with births (188) in New Ulm are married. The highest percentage of unmarried women with births falls into 15 to 19 years age bracket with 100.0% of them unmarried at the time of birth, while the lowest percentage of unmarried women with births belong to 35 to 50 years age bracket with 12.2% of them unmarried.
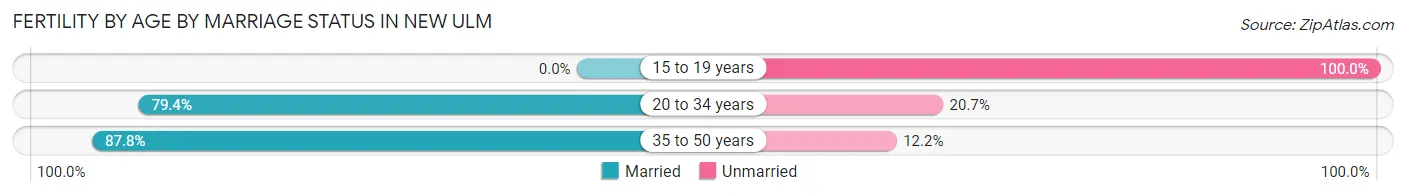
| Age Bracket | Married | Unmarried |
| 15 to 19 years | 0 (0.0%) | 47 (100.0%) |
| 20 to 34 years | 73 (79.3%) | 19 (20.6%) |
| 35 to 50 years | 43 (87.8%) | 6 (12.2%) |
| Total | 116 (61.7%) | 72 (38.3%) |
Fertility by Education in New Ulm
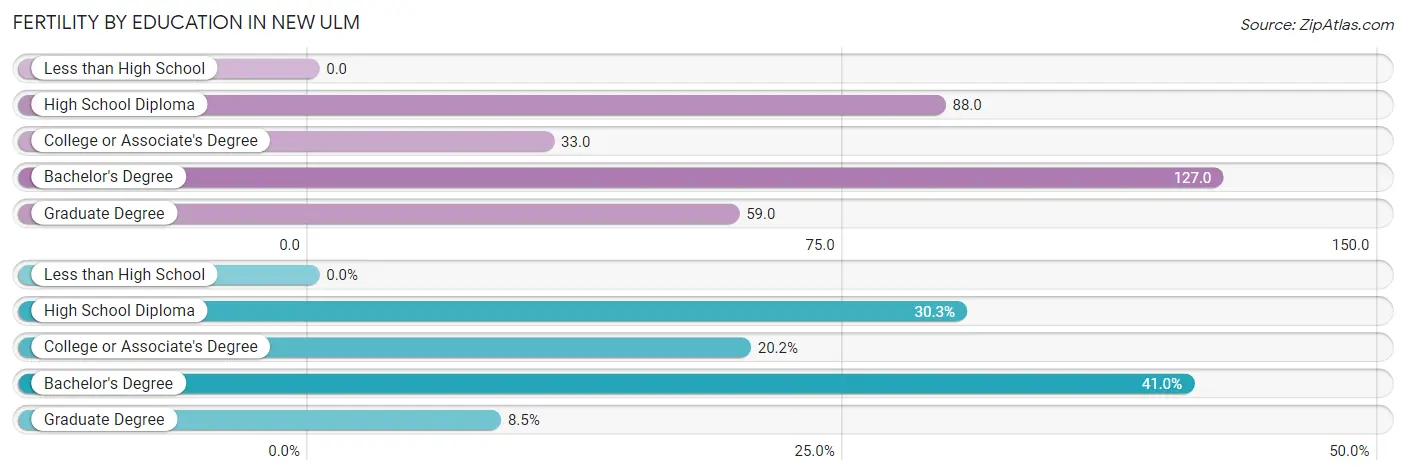
| Educational Attainment | Women with Births | Births / 1,000 Women |
| Less than High School | 0 (0.0%) | 0.0 |
| High School Diploma | 57 (30.3%) | 88.0 |
| College or Associate's Degree | 38 (20.2%) | 33.0 |
| Bachelor's Degree | 77 (41.0%) | 127.0 |
| Graduate Degree | 16 (8.5%) | 59.0 |
| Total | 188 (100.0%) | 59.0 |
Fertility by Education by Marriage Status in New Ulm
38.3% of women with births in New Ulm are unmarried. Women with the educational attainment of bachelor's degree are most likely to be married with 100.0% of them married at childbirth, while women with the educational attainment of high school diploma are least likely to be married with 100.0% of them unmarried at childbirth.
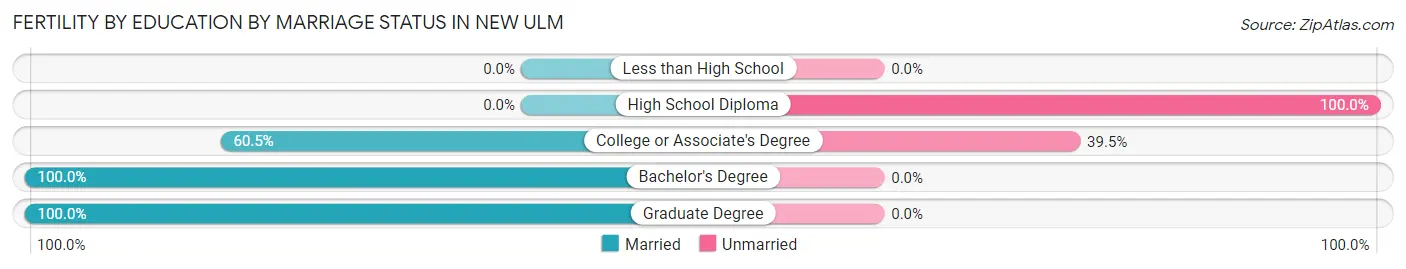
| Educational Attainment | Married | Unmarried |
| Less than High School | 0 (0.0%) | 0 (0.0%) |
| High School Diploma | 0 (0.0%) | 57 (100.0%) |
| College or Associate's Degree | 23 (60.5%) | 15 (39.5%) |
| Bachelor's Degree | 77 (100.0%) | 0 (0.0%) |
| Graduate Degree | 16 (100.0%) | 0 (0.0%) |
| Total | 116 (61.7%) | 72 (38.3%) |
Employment Characteristics in New Ulm
Employment by Class of Employer in New Ulm
Among the 7,147 employed individuals in New Ulm, private company employees (4,754 | 66.5%), not-for-profit organizations (944 | 13.2%), and local government employees (596 | 8.3%) make up the most common classes of employment.
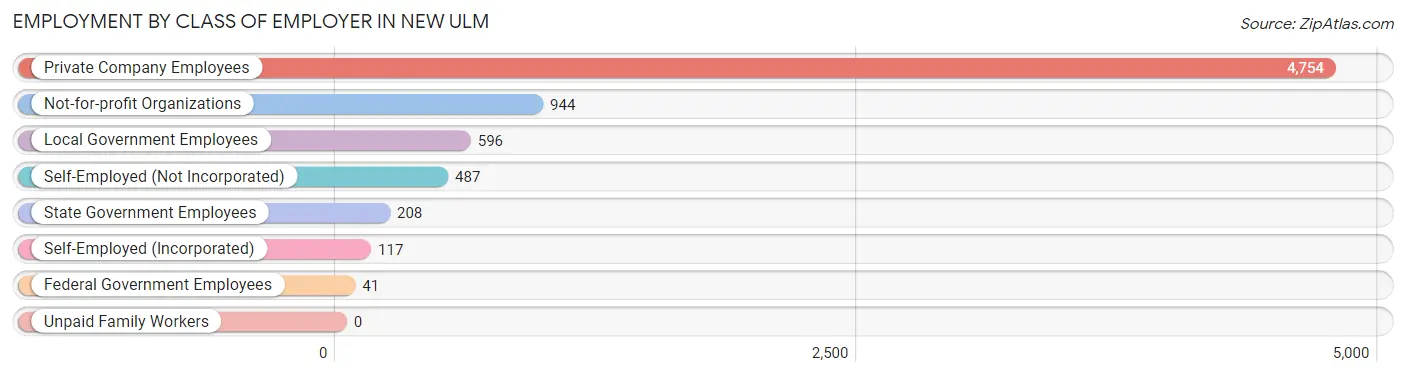
| Employer Class | # Employees | % Employees |
| Private Company Employees | 4,754 | 66.5% |
| Self-Employed (Incorporated) | 117 | 1.6% |
| Self-Employed (Not Incorporated) | 487 | 6.8% |
| Not-for-profit Organizations | 944 | 13.2% |
| Local Government Employees | 596 | 8.3% |
| State Government Employees | 208 | 2.9% |
| Federal Government Employees | 41 | 0.6% |
| Unpaid Family Workers | 0 | 0.0% |
| Total | 7,147 | 100.0% |
Employment Status by Age in New Ulm
According to the labor force statistics for New Ulm, out of the total population over 16 years of age (11,378), 65.8% or 7,487 individuals are in the labor force, with 2.8% or 210 of them unemployed. The age group with the highest labor force participation rate is 45 to 54 years, with 92.1% or 1,330 individuals in the labor force. Within the labor force, the 60 to 64 years age range has the highest percentage of unemployed individuals, with 12.3% or 74 of them being unemployed.
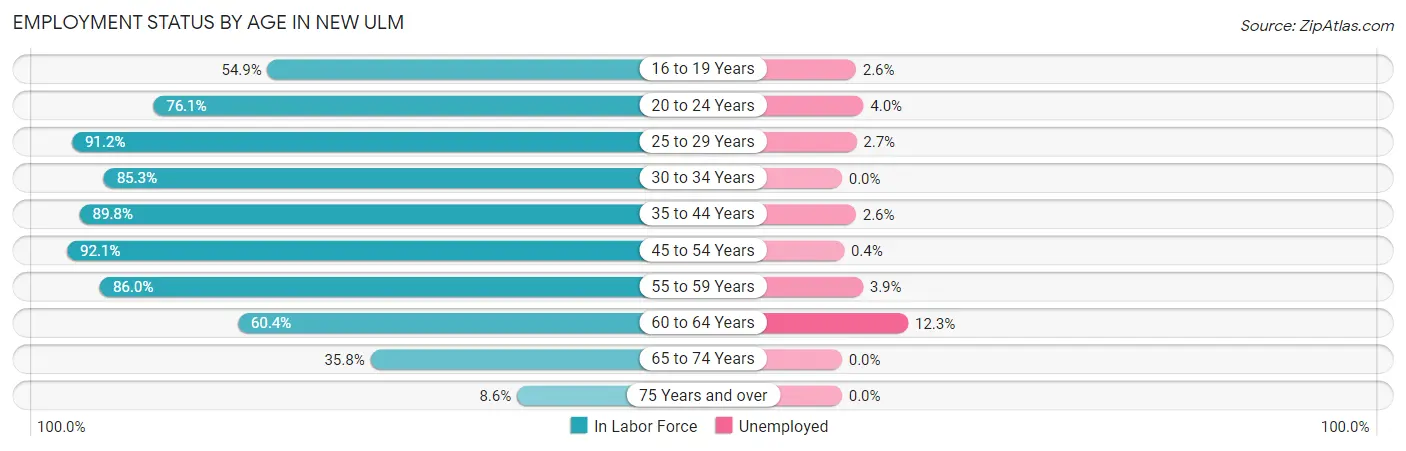
| Age Bracket | In Labor Force | Unemployed |
| 16 to 19 Years | 508 (54.9%) | 13 (2.6%) |
| 20 to 24 Years | 849 (76.1%) | 34 (4.0%) |
| 25 to 29 Years | 735 (91.2%) | 20 (2.7%) |
| 30 to 34 Years | 625 (85.3%) | 0 (0.0%) |
| 35 to 44 Years | 1,554 (89.8%) | 40 (2.6%) |
| 45 to 54 Years | 1,330 (92.1%) | 5 (0.4%) |
| 55 to 59 Years | 639 (86.0%) | 25 (3.9%) |
| 60 to 64 Years | 604 (60.4%) | 74 (12.3%) |
| 65 to 74 Years | 513 (35.8%) | 0 (0.0%) |
| 75 Years and over | 124 (8.6%) | 0 (0.0%) |
| Total | 7,487 (65.8%) | 210 (2.8%) |
Employment Status by Educational Attainment in New Ulm
According to labor force statistics for New Ulm, 85.0% of individuals (5,488) out of the total population between 25 and 64 years of age (6,456) are in the labor force, with 3.0% or 165 of them being unemployed. The group with the highest labor force participation rate are those with the educational attainment of bachelor's degree or higher, with 91.4% or 1,918 individuals in the labor force. Within the labor force, individuals with college / associate degree education have the highest percentage of unemployment, with 5.5% or 104 of them being unemployed.
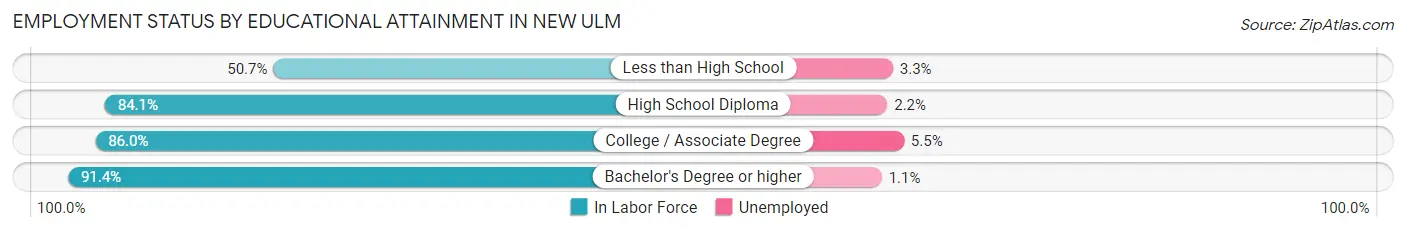
| Educational Attainment | In Labor Force | Unemployed |
| Less than High School | 209 (50.7%) | 14 (3.3%) |
| High School Diploma | 1,478 (84.1%) | 39 (2.2%) |
| College / Associate Degree | 1,882 (86.0%) | 120 (5.5%) |
| Bachelor's Degree or higher | 1,918 (91.4%) | 23 (1.1%) |
| Total | 5,488 (85.0%) | 194 (3.0%) |
Employment Occupations by Sex in New Ulm
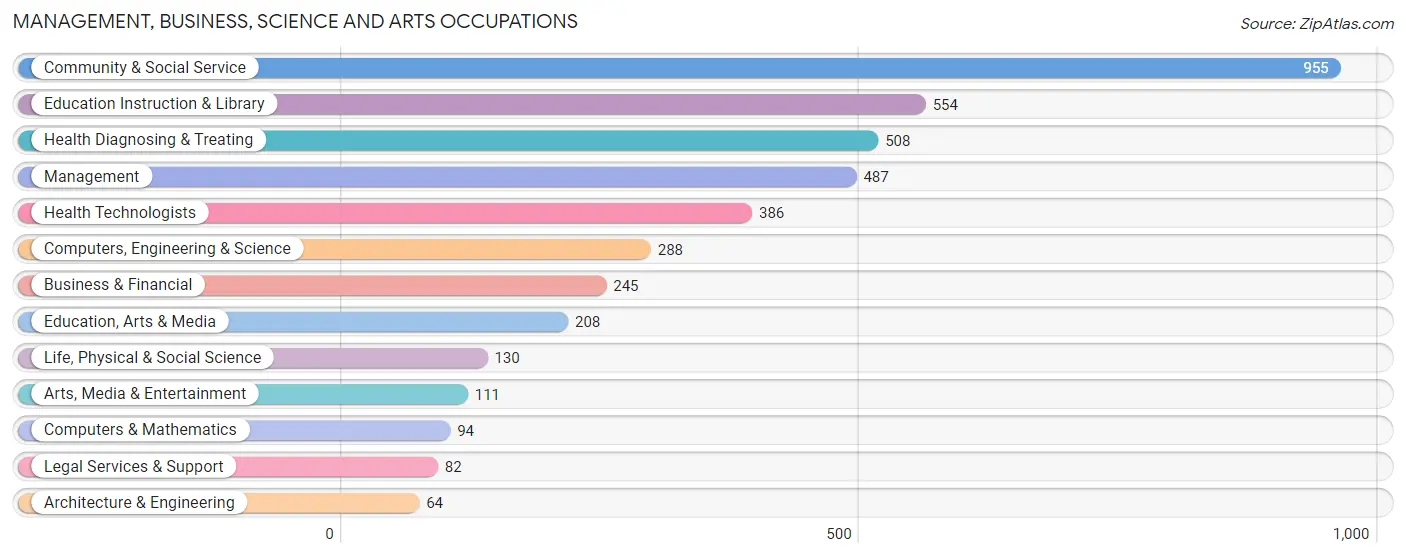
Management, Business, Science and Arts Occupations
The most common Management, Business, Science and Arts occupations in New Ulm are Community & Social Service (955 | 13.1%), Education Instruction & Library (554 | 7.6%), Health Diagnosing & Treating (508 | 7.0%), Management (487 | 6.7%), and Health Technologists (386 | 5.3%).
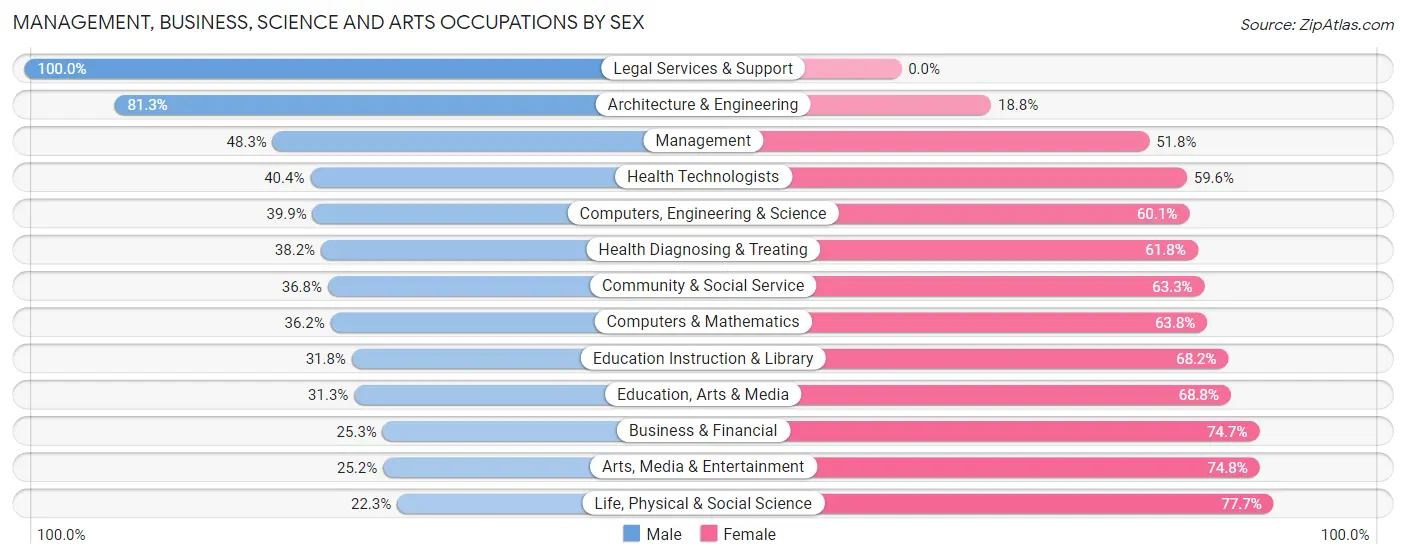
Management, Business, Science and Arts Occupations by Sex
Within the Management, Business, Science and Arts occupations in New Ulm, the most male-oriented occupations are Legal Services & Support (100.0%), Architecture & Engineering (81.2%), and Management (48.2%), while the most female-oriented occupations are Life, Physical & Social Science (77.7%), Arts, Media & Entertainment (74.8%), and Business & Financial (74.7%).
| Occupation | Male | Female |
| Management | 235 (48.2%) | 252 (51.7%) |
| Business & Financial | 62 (25.3%) | 183 (74.7%) |
| Computers, Engineering & Science | 115 (39.9%) | 173 (60.1%) |
| Computers & Mathematics | 34 (36.2%) | 60 (63.8%) |
| Architecture & Engineering | 52 (81.2%) | 12 (18.8%) |
| Life, Physical & Social Science | 29 (22.3%) | 101 (77.7%) |
| Community & Social Service | 351 (36.7%) | 604 (63.2%) |
| Education, Arts & Media | 65 (31.2%) | 143 (68.8%) |
| Legal Services & Support | 82 (100.0%) | 0 (0.0%) |
| Education Instruction & Library | 176 (31.8%) | 378 (68.2%) |
| Arts, Media & Entertainment | 28 (25.2%) | 83 (74.8%) |
| Health Diagnosing & Treating | 194 (38.2%) | 314 (61.8%) |
| Health Technologists | 156 (40.4%) | 230 (59.6%) |
| Total (Category) | 957 (38.5%) | 1,526 (61.5%) |
| Total (Overall) | 3,670 (50.5%) | 3,600 (49.5%) |
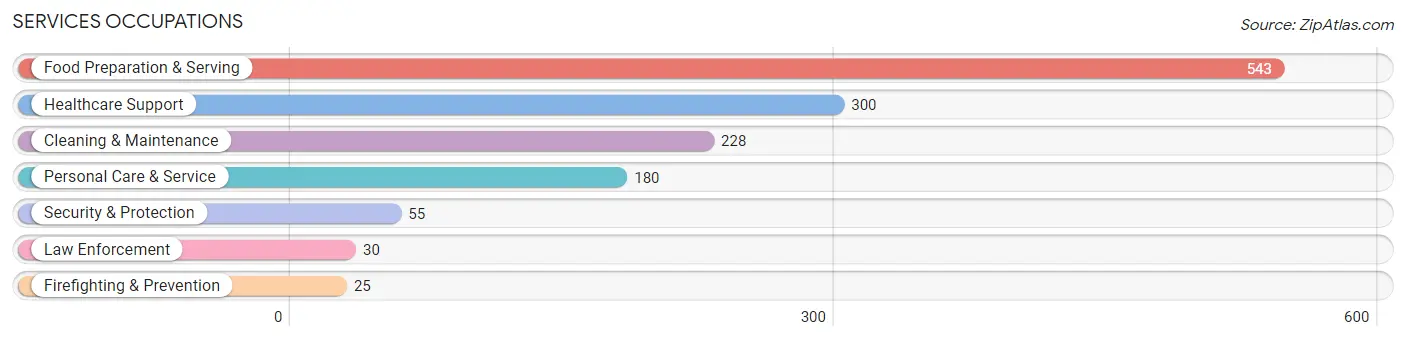
Services Occupations
The most common Services occupations in New Ulm are Food Preparation & Serving (543 | 7.5%), Healthcare Support (300 | 4.1%), Cleaning & Maintenance (228 | 3.1%), Personal Care & Service (180 | 2.5%), and Security & Protection (55 | 0.8%).
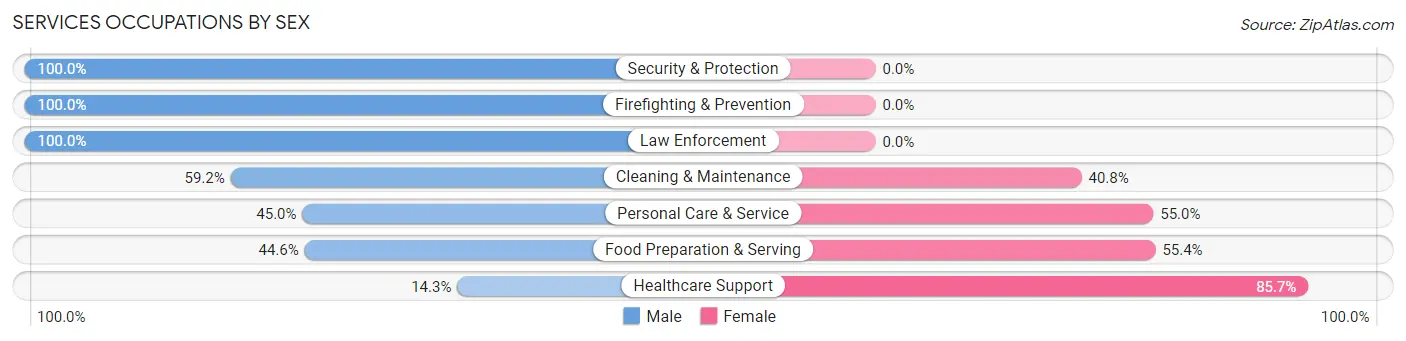
Services Occupations by Sex
Within the Services occupations in New Ulm, the most male-oriented occupations are Security & Protection (100.0%), Firefighting & Prevention (100.0%), and Law Enforcement (100.0%), while the most female-oriented occupations are Healthcare Support (85.7%), Food Preparation & Serving (55.4%), and Personal Care & Service (55.0%).
| Occupation | Male | Female |
| Healthcare Support | 43 (14.3%) | 257 (85.7%) |
| Security & Protection | 55 (100.0%) | 0 (0.0%) |
| Firefighting & Prevention | 25 (100.0%) | 0 (0.0%) |
| Law Enforcement | 30 (100.0%) | 0 (0.0%) |
| Food Preparation & Serving | 242 (44.6%) | 301 (55.4%) |
| Cleaning & Maintenance | 135 (59.2%) | 93 (40.8%) |
| Personal Care & Service | 81 (45.0%) | 99 (55.0%) |
| Total (Category) | 556 (42.6%) | 750 (57.4%) |
| Total (Overall) | 3,670 (50.5%) | 3,600 (49.5%) |
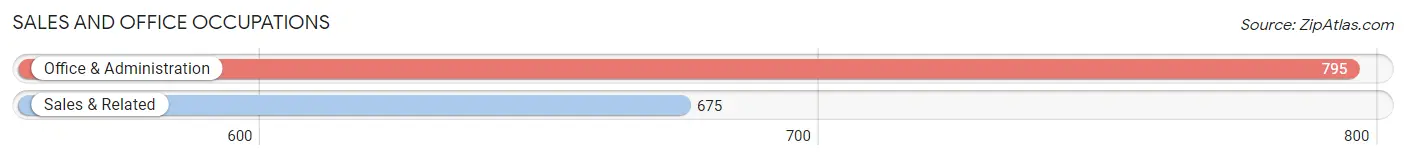
Sales and Office Occupations
The most common Sales and Office occupations in New Ulm are Office & Administration (795 | 10.9%), and Sales & Related (675 | 9.3%).
Sales and Office Occupations by Sex

| Occupation | Male | Female |
| Sales & Related | 335 (49.6%) | 340 (50.4%) |
| Office & Administration | 238 (29.9%) | 557 (70.1%) |
| Total (Category) | 573 (39.0%) | 897 (61.0%) |
| Total (Overall) | 3,670 (50.5%) | 3,600 (49.5%) |
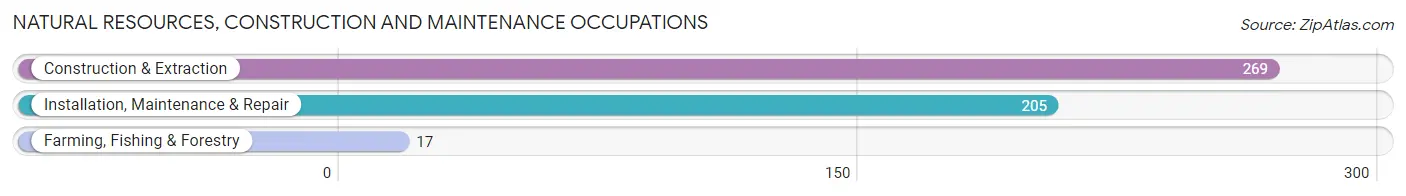
Natural Resources, Construction and Maintenance Occupations
The most common Natural Resources, Construction and Maintenance occupations in New Ulm are Construction & Extraction (269 | 3.7%), Installation, Maintenance & Repair (205 | 2.8%), and Farming, Fishing & Forestry (17 | 0.2%).
Natural Resources, Construction and Maintenance Occupations by Sex
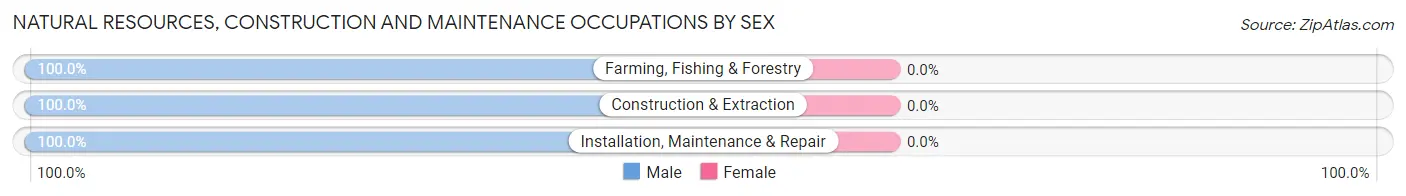
| Occupation | Male | Female |
| Farming, Fishing & Forestry | 17 (100.0%) | 0 (0.0%) |
| Construction & Extraction | 269 (100.0%) | 0 (0.0%) |
| Installation, Maintenance & Repair | 205 (100.0%) | 0 (0.0%) |
| Total (Category) | 491 (100.0%) | 0 (0.0%) |
| Total (Overall) | 3,670 (50.5%) | 3,600 (49.5%) |
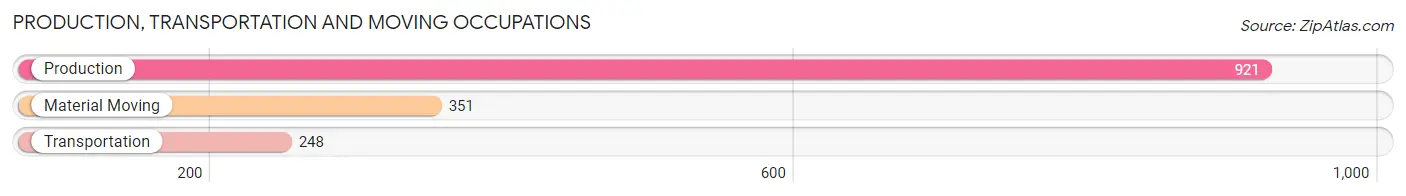
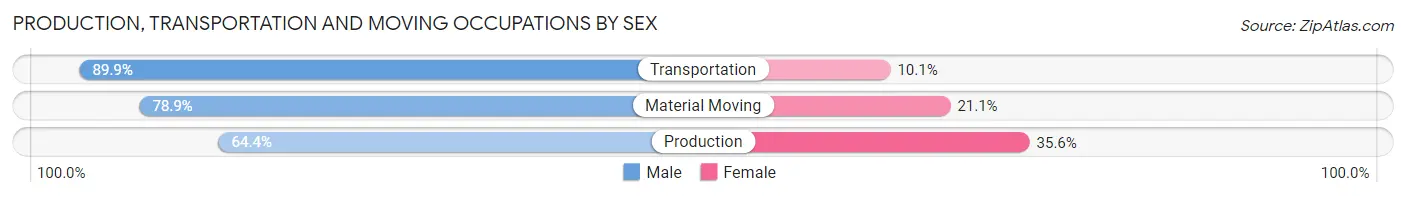
Production, Transportation and Moving Occupations
The most common Production, Transportation and Moving occupations in New Ulm are Production (921 | 12.7%), Material Moving (351 | 4.8%), and Transportation (248 | 3.4%).
Production, Transportation and Moving Occupations by Sex
| Occupation | Male | Female |
| Production | 593 (64.4%) | 328 (35.6%) |
| Transportation | 223 (89.9%) | 25 (10.1%) |
| Material Moving | 277 (78.9%) | 74 (21.1%) |
| Total (Category) | 1,093 (71.9%) | 427 (28.1%) |
| Total (Overall) | 3,670 (50.5%) | 3,600 (49.5%) |
Employment Industries by Sex in New Ulm
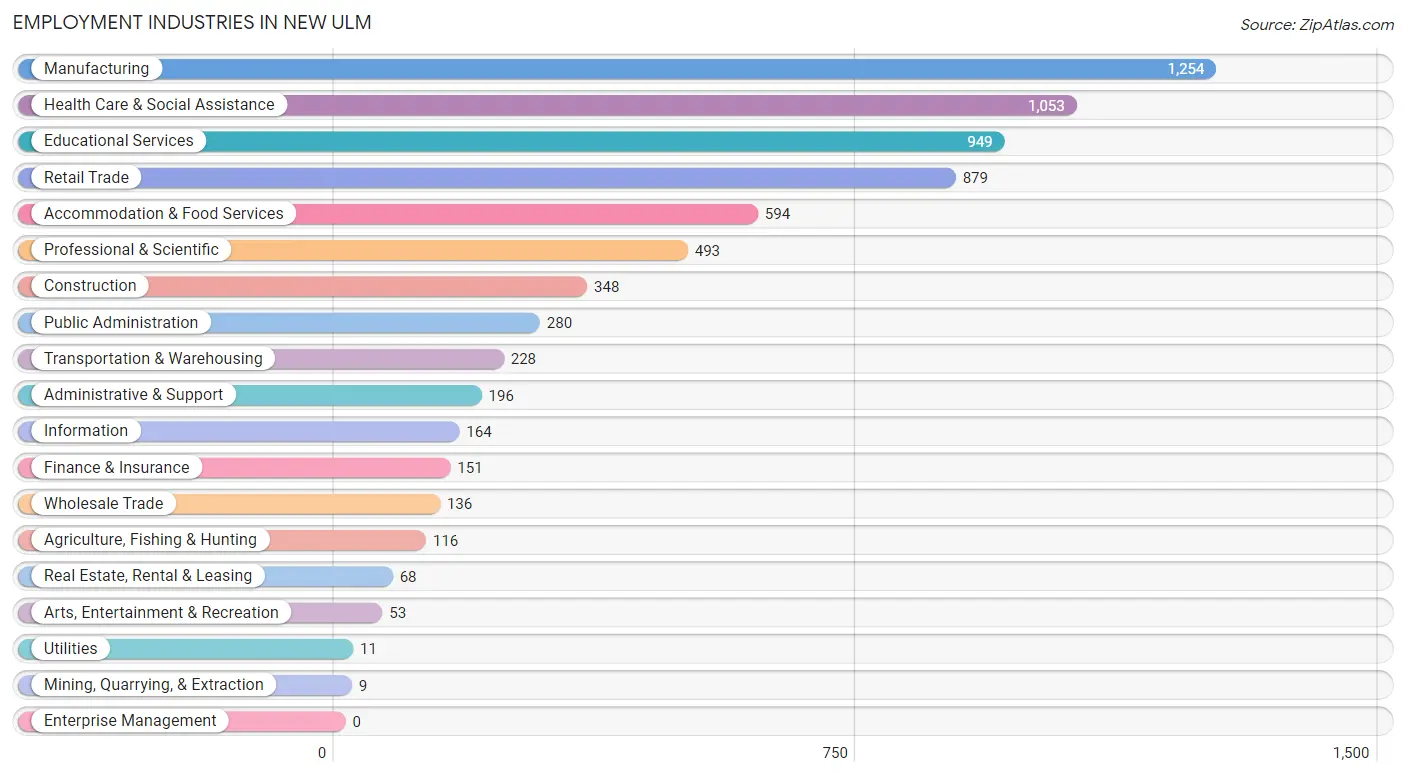
Employment Industries in New Ulm
The major employment industries in New Ulm include Manufacturing (1,254 | 17.2%), Health Care & Social Assistance (1,053 | 14.5%), Educational Services (949 | 13.1%), Retail Trade (879 | 12.1%), and Accommodation & Food Services (594 | 8.2%).
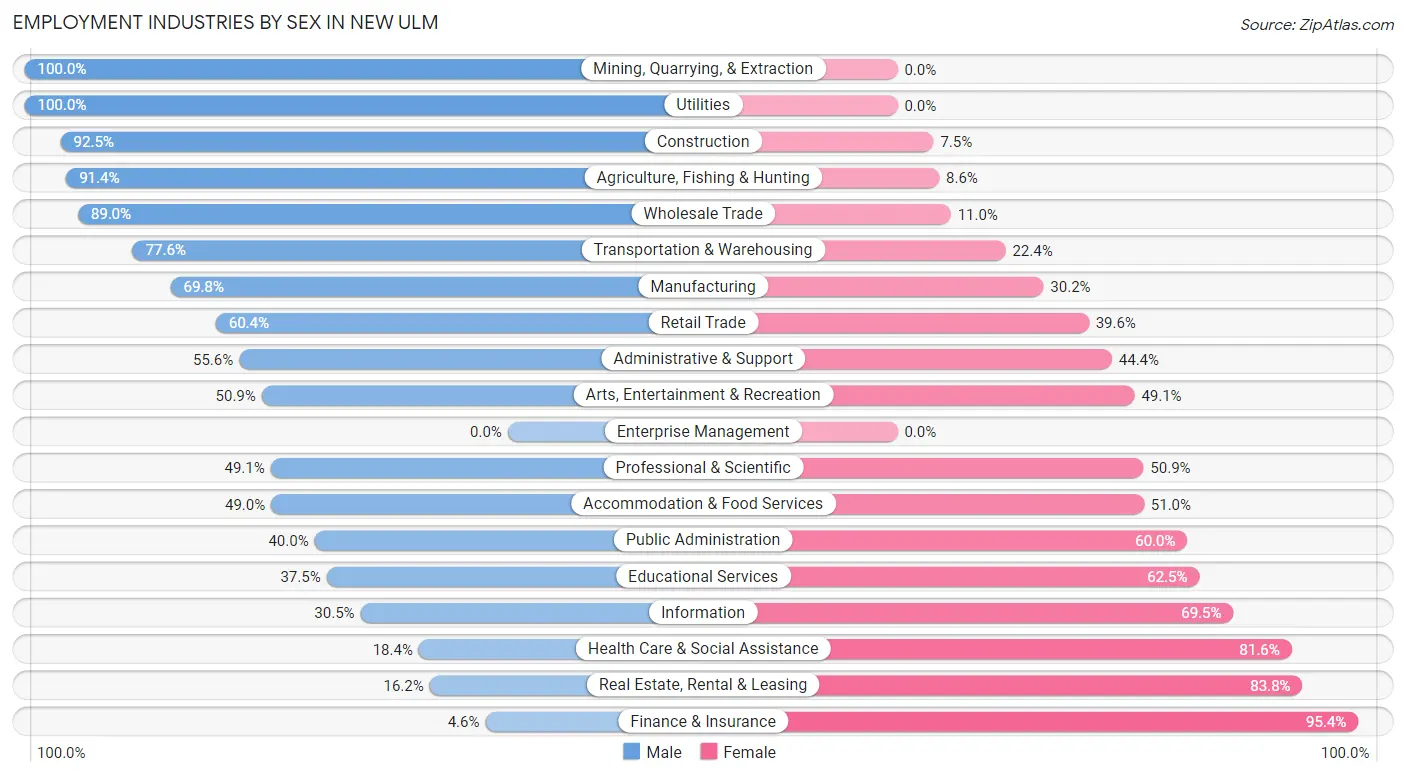
Employment Industries by Sex in New Ulm
The New Ulm industries that see more men than women are Mining, Quarrying, & Extraction (100.0%), Utilities (100.0%), and Construction (92.5%), whereas the industries that tend to have a higher number of women are Finance & Insurance (95.4%), Real Estate, Rental & Leasing (83.8%), and Health Care & Social Assistance (81.6%).
| Industry | Male | Female |
| Agriculture, Fishing & Hunting | 106 (91.4%) | 10 (8.6%) |
| Mining, Quarrying, & Extraction | 9 (100.0%) | 0 (0.0%) |
| Construction | 322 (92.5%) | 26 (7.5%) |
| Manufacturing | 875 (69.8%) | 379 (30.2%) |
| Wholesale Trade | 121 (89.0%) | 15 (11.0%) |
| Retail Trade | 531 (60.4%) | 348 (39.6%) |
| Transportation & Warehousing | 177 (77.6%) | 51 (22.4%) |
| Utilities | 11 (100.0%) | 0 (0.0%) |
| Information | 50 (30.5%) | 114 (69.5%) |
| Finance & Insurance | 7 (4.6%) | 144 (95.4%) |
| Real Estate, Rental & Leasing | 11 (16.2%) | 57 (83.8%) |
| Professional & Scientific | 242 (49.1%) | 251 (50.9%) |
| Enterprise Management | 0 (0.0%) | 0 (0.0%) |
| Administrative & Support | 109 (55.6%) | 87 (44.4%) |
| Educational Services | 356 (37.5%) | 593 (62.5%) |
| Health Care & Social Assistance | 194 (18.4%) | 859 (81.6%) |
| Arts, Entertainment & Recreation | 27 (50.9%) | 26 (49.1%) |
| Accommodation & Food Services | 291 (49.0%) | 303 (51.0%) |
| Public Administration | 112 (40.0%) | 168 (60.0%) |
| Total | 3,670 (50.5%) | 3,600 (49.5%) |
Education in New Ulm
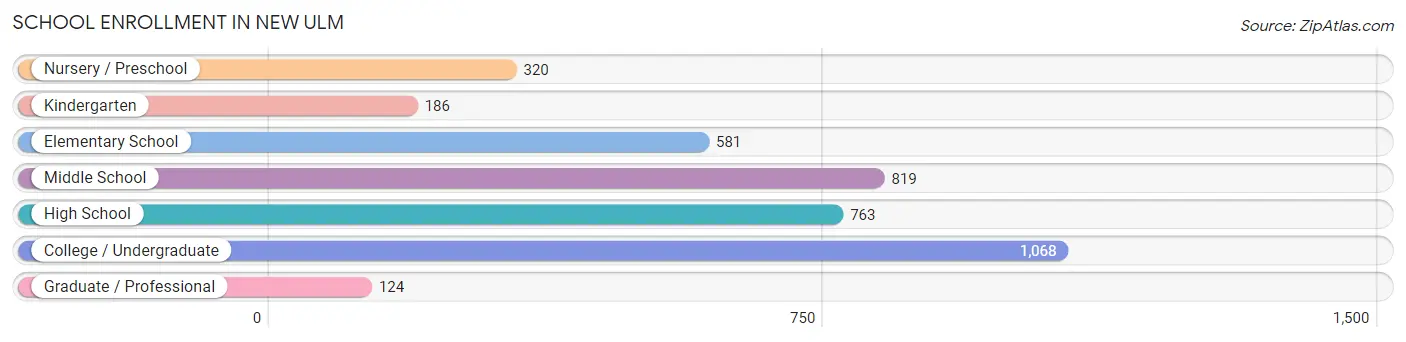
School Enrollment in New Ulm
The most common levels of schooling among the 3,861 students in New Ulm are college / undergraduate (1,068 | 27.7%), middle school (819 | 21.2%), and high school (763 | 19.8%).
| School Level | # Students | % Students |
| Nursery / Preschool | 320 | 8.3% |
| Kindergarten | 186 | 4.8% |
| Elementary School | 581 | 15.0% |
| Middle School | 819 | 21.2% |
| High School | 763 | 19.8% |
| College / Undergraduate | 1,068 | 27.7% |
| Graduate / Professional | 124 | 3.2% |
| Total | 3,861 | 100.0% |
School Enrollment by Age by Funding Source in New Ulm
Out of a total of 3,861 students who are enrolled in schools in New Ulm, 1,378 (35.7%) attend a private institution, while the remaining 2,483 (64.3%) are enrolled in public schools. The age group of 20 to 24 year olds has the highest likelihood of being enrolled in private schools, with 402 (70.7% in the age bracket) enrolled. Conversely, the age group of 15 to 17 year olds has the lowest likelihood of being enrolled in a private school, with 515 (89.2% in the age bracket) attending a public institution.
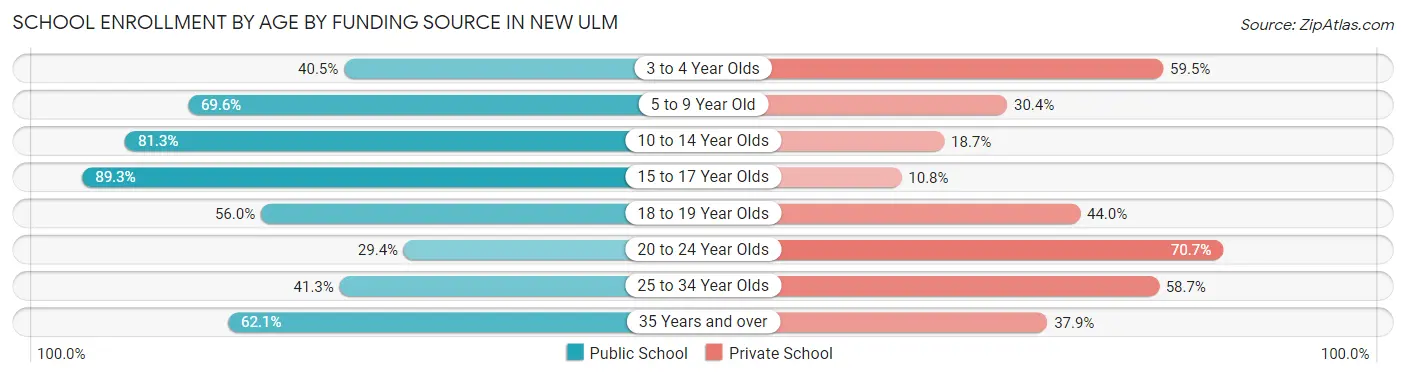
| Age Bracket | Public School | Private School |
| 3 to 4 Year Olds | 100 (40.5%) | 147 (59.5%) |
| 5 to 9 Year Old | 560 (69.6%) | 245 (30.4%) |
| 10 to 14 Year Olds | 721 (81.3%) | 166 (18.7%) |
| 15 to 17 Year Olds | 515 (89.2%) | 62 (10.7%) |
| 18 to 19 Year Olds | 239 (56.0%) | 188 (44.0%) |
| 20 to 24 Year Olds | 167 (29.3%) | 402 (70.7%) |
| 25 to 34 Year Olds | 69 (41.3%) | 98 (58.7%) |
| 35 Years and over | 113 (62.1%) | 69 (37.9%) |
| Total | 2,483 (64.3%) | 1,378 (35.7%) |
Educational Attainment by Field of Study in New Ulm
Education (751 | 26.1%), science & technology (372 | 12.9%), business (307 | 10.7%), arts & humanities (255 | 8.9%), and bio, nature & agricultural (233 | 8.1%) are the most common fields of study among 2,879 individuals in New Ulm who have obtained a bachelor's degree or higher.
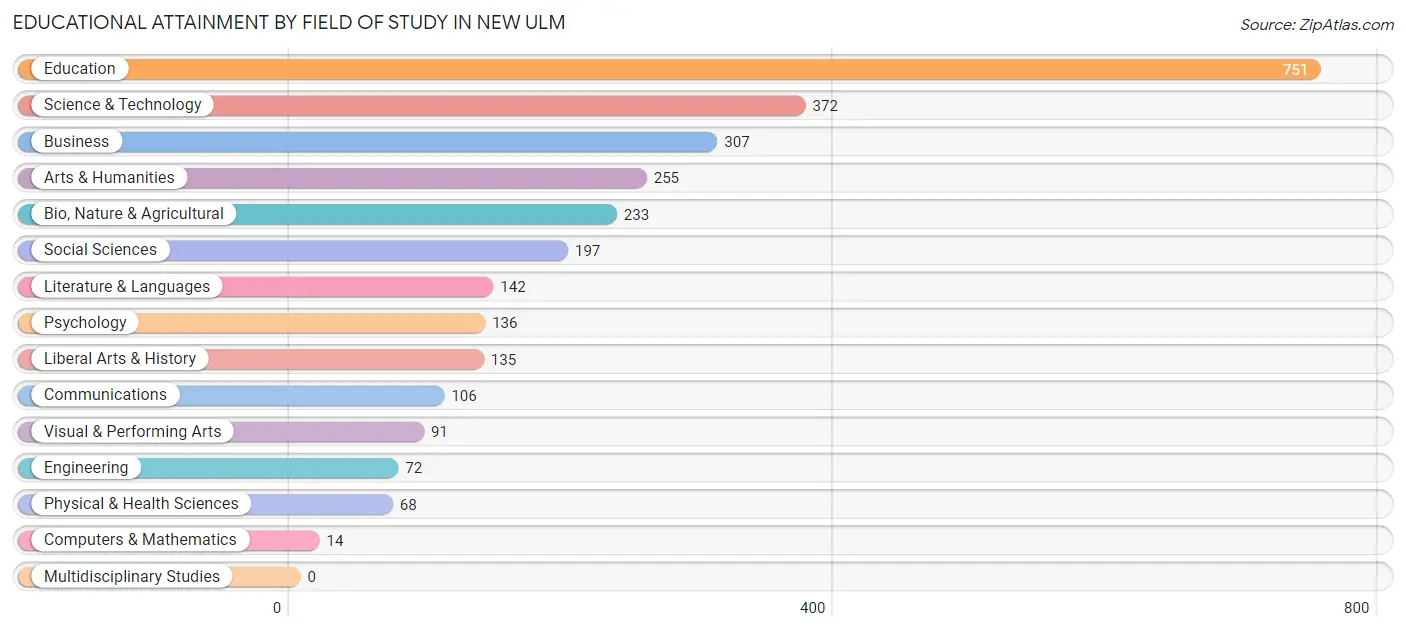
| Field of Study | # Graduates | % Graduates |
| Computers & Mathematics | 14 | 0.5% |
| Bio, Nature & Agricultural | 233 | 8.1% |
| Physical & Health Sciences | 68 | 2.4% |
| Psychology | 136 | 4.7% |
| Social Sciences | 197 | 6.8% |
| Engineering | 72 | 2.5% |
| Multidisciplinary Studies | 0 | 0.0% |
| Science & Technology | 372 | 12.9% |
| Business | 307 | 10.7% |
| Education | 751 | 26.1% |
| Literature & Languages | 142 | 4.9% |
| Liberal Arts & History | 135 | 4.7% |
| Visual & Performing Arts | 91 | 3.2% |
| Communications | 106 | 3.7% |
| Arts & Humanities | 255 | 8.9% |
| Total | 2,879 | 100.0% |
Transportation & Commute in New Ulm
Vehicle Availability by Sex in New Ulm
The most prevalent vehicle ownership categories in New Ulm are males with 2 vehicles (1,484, accounting for 43.1%) and females with 2 vehicles (1,421, making up 45.7%).
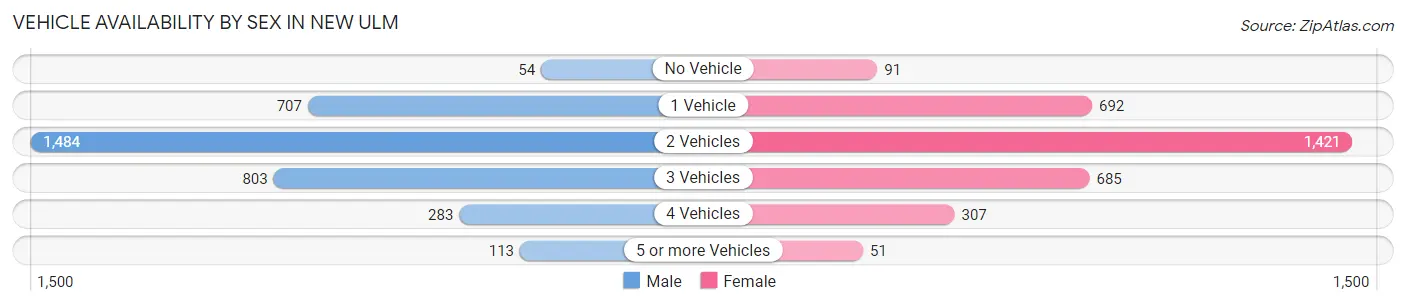
| Vehicles Available | Male | Female |
| No Vehicle | 54 (1.6%) | 91 (2.8%) |
| 1 Vehicle | 707 (20.5%) | 692 (21.3%) |
| 2 Vehicles | 1,484 (43.1%) | 1,421 (43.8%) |
| 3 Vehicles | 803 (23.3%) | 685 (21.1%) |
| 4 Vehicles | 283 (8.2%) | 307 (9.5%) |
| 5 or more Vehicles | 113 (3.3%) | 51 (1.6%) |
| Total | 3,444 (100.0%) | 3,247 (100.0%) |
Commute Time in New Ulm
The most frequently occuring commute durations in New Ulm are 5 to 9 minutes (2,984 commuters, 44.7%), 10 to 14 minutes (1,331 commuters, 20.0%), and less than 5 minutes (635 commuters, 9.5%).
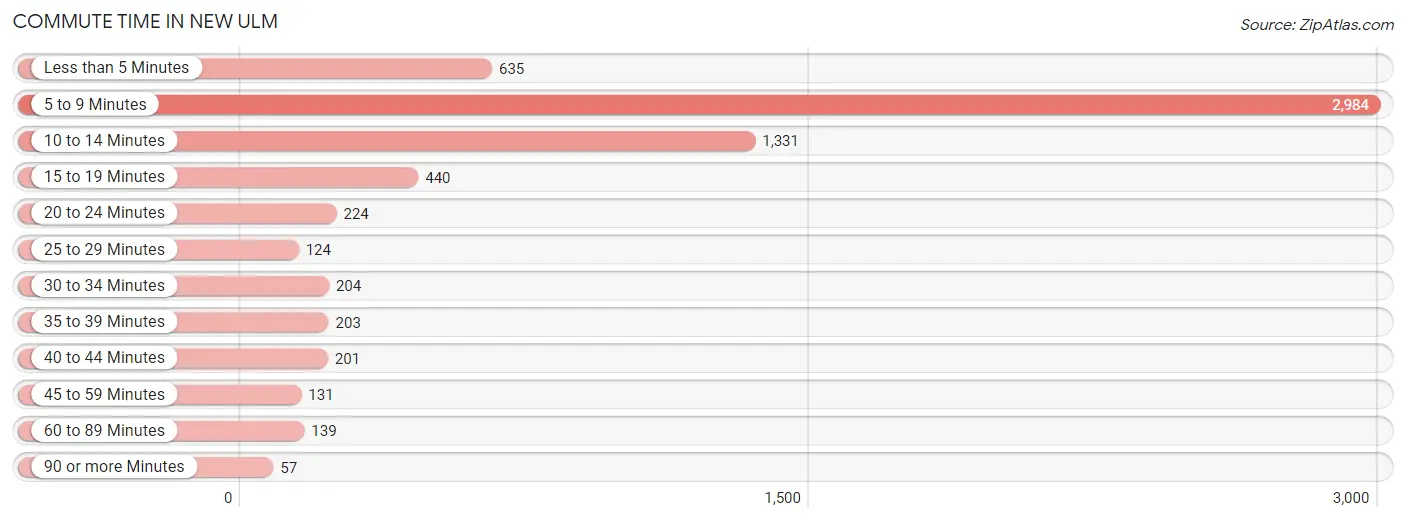
| Commute Time | # Commuters | % Commuters |
| Less than 5 Minutes | 635 | 9.5% |
| 5 to 9 Minutes | 2,984 | 44.7% |
| 10 to 14 Minutes | 1,331 | 20.0% |
| 15 to 19 Minutes | 440 | 6.6% |
| 20 to 24 Minutes | 224 | 3.4% |
| 25 to 29 Minutes | 124 | 1.9% |
| 30 to 34 Minutes | 204 | 3.1% |
| 35 to 39 Minutes | 203 | 3.0% |
| 40 to 44 Minutes | 201 | 3.0% |
| 45 to 59 Minutes | 131 | 2.0% |
| 60 to 89 Minutes | 139 | 2.1% |
| 90 or more Minutes | 57 | 0.9% |
Commute Time by Sex in New Ulm
The most common commute times in New Ulm are 5 to 9 minutes (1,564 commuters, 45.2%) for males and 5 to 9 minutes (1,420 commuters, 44.2%) for females.
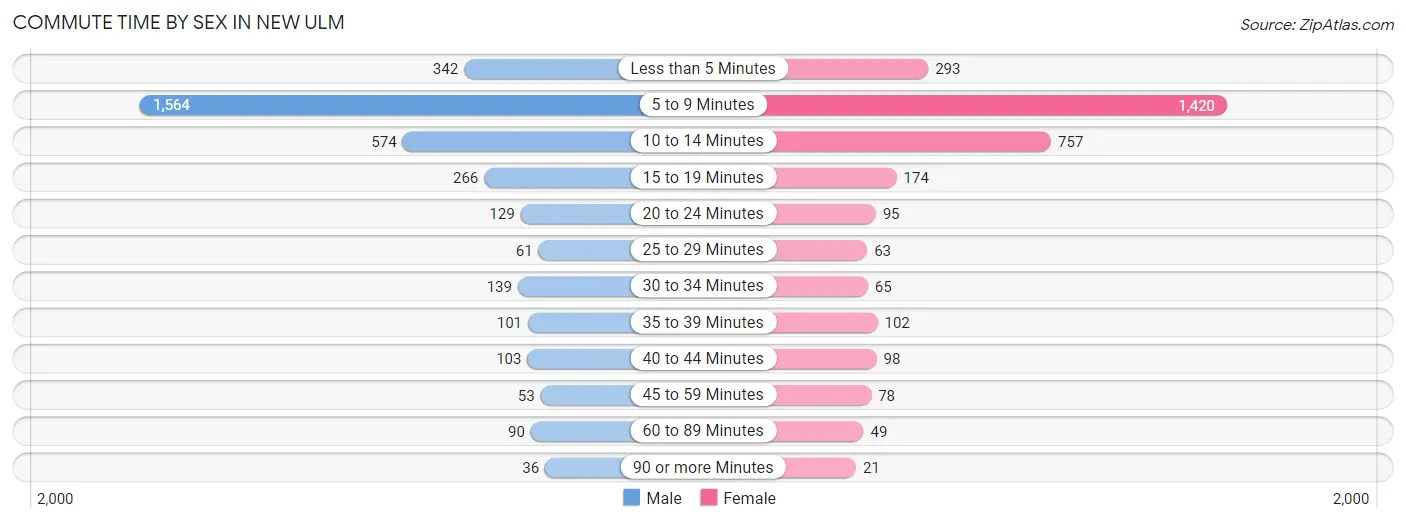
| Commute Time | Male | Female |
| Less than 5 Minutes | 342 (9.9%) | 293 (9.1%) |
| 5 to 9 Minutes | 1,564 (45.2%) | 1,420 (44.2%) |
| 10 to 14 Minutes | 574 (16.6%) | 757 (23.5%) |
| 15 to 19 Minutes | 266 (7.7%) | 174 (5.4%) |
| 20 to 24 Minutes | 129 (3.7%) | 95 (2.9%) |
| 25 to 29 Minutes | 61 (1.8%) | 63 (2.0%) |
| 30 to 34 Minutes | 139 (4.0%) | 65 (2.0%) |
| 35 to 39 Minutes | 101 (2.9%) | 102 (3.2%) |
| 40 to 44 Minutes | 103 (3.0%) | 98 (3.0%) |
| 45 to 59 Minutes | 53 (1.5%) | 78 (2.4%) |
| 60 to 89 Minutes | 90 (2.6%) | 49 (1.5%) |
| 90 or more Minutes | 36 (1.0%) | 21 (0.6%) |
Time of Departure to Work by Sex in New Ulm
The most frequent times of departure to work in New Ulm are 7:30 AM to 7:59 AM (644, 18.6%) for males and 7:00 AM to 7:29 AM (662, 20.6%) for females.
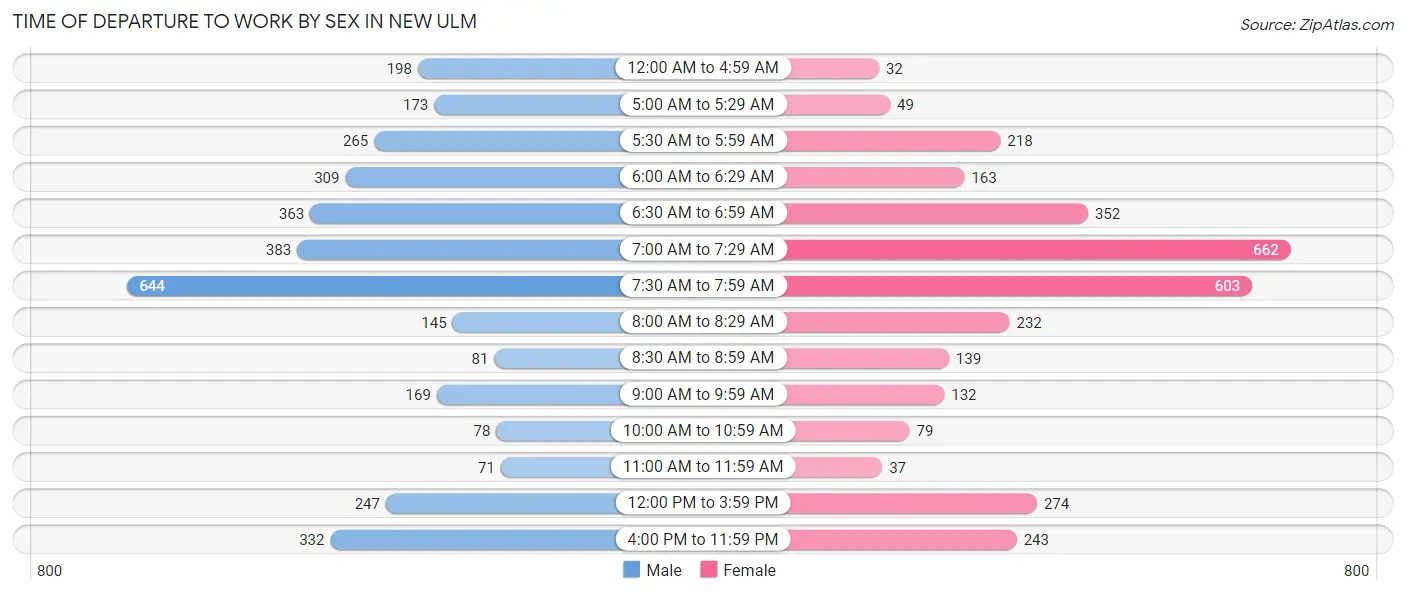
| Time of Departure | Male | Female |
| 12:00 AM to 4:59 AM | 198 (5.7%) | 32 (1.0%) |
| 5:00 AM to 5:29 AM | 173 (5.0%) | 49 (1.5%) |
| 5:30 AM to 5:59 AM | 265 (7.7%) | 218 (6.8%) |
| 6:00 AM to 6:29 AM | 309 (8.9%) | 163 (5.1%) |
| 6:30 AM to 6:59 AM | 363 (10.5%) | 352 (11.0%) |
| 7:00 AM to 7:29 AM | 383 (11.1%) | 662 (20.6%) |
| 7:30 AM to 7:59 AM | 644 (18.6%) | 603 (18.8%) |
| 8:00 AM to 8:29 AM | 145 (4.2%) | 232 (7.2%) |
| 8:30 AM to 8:59 AM | 81 (2.3%) | 139 (4.3%) |
| 9:00 AM to 9:59 AM | 169 (4.9%) | 132 (4.1%) |
| 10:00 AM to 10:59 AM | 78 (2.3%) | 79 (2.5%) |
| 11:00 AM to 11:59 AM | 71 (2.1%) | 37 (1.1%) |
| 12:00 PM to 3:59 PM | 247 (7.1%) | 274 (8.5%) |
| 4:00 PM to 11:59 PM | 332 (9.6%) | 243 (7.6%) |
| Total | 3,458 (100.0%) | 3,215 (100.0%) |
Housing Occupancy in New Ulm
Occupancy by Ownership in New Ulm
Of the total 5,938 dwellings in New Ulm, owner-occupied units account for 4,360 (73.4%), while renter-occupied units make up 1,578 (26.6%).
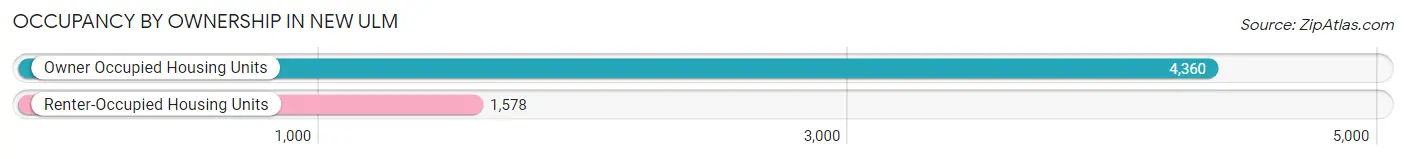
| Occupancy | # Housing Units | % Housing Units |
| Owner Occupied Housing Units | 4,360 | 73.4% |
| Renter-Occupied Housing Units | 1,578 | 26.6% |
| Total Occupied Housing Units | 5,938 | 100.0% |
Occupancy by Household Size in New Ulm
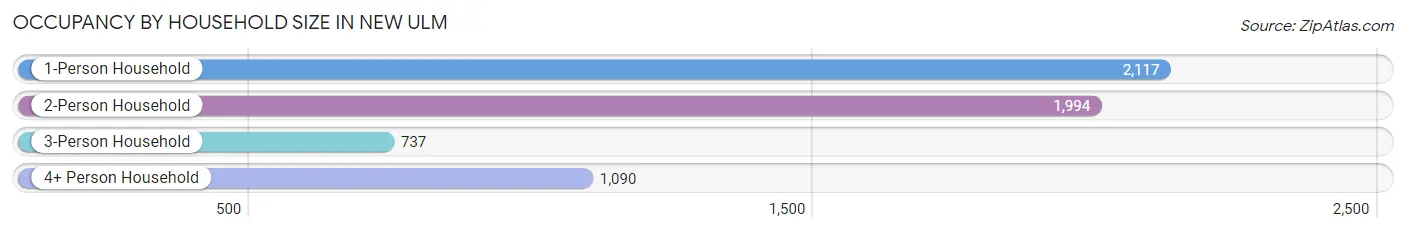
| Household Size | # Housing Units | % Housing Units |
| 1-Person Household | 2,117 | 35.6% |
| 2-Person Household | 1,994 | 33.6% |
| 3-Person Household | 737 | 12.4% |
| 4+ Person Household | 1,090 | 18.4% |
| Total Housing Units | 5,938 | 100.0% |
Occupancy by Ownership by Household Size in New Ulm
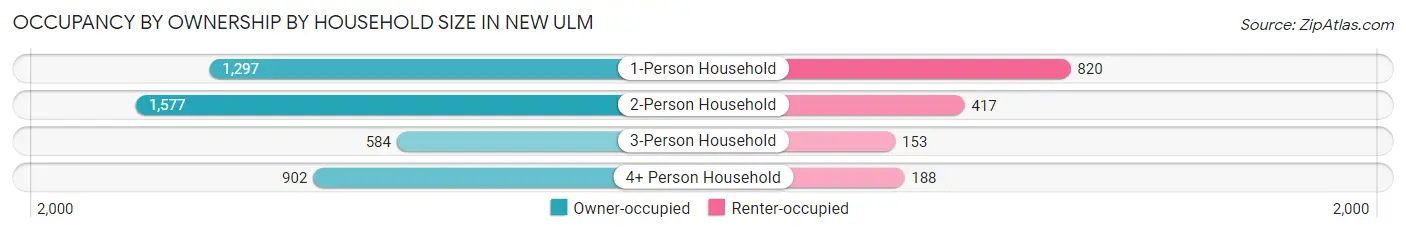
| Household Size | Owner-occupied | Renter-occupied |
| 1-Person Household | 1,297 (61.3%) | 820 (38.7%) |
| 2-Person Household | 1,577 (79.1%) | 417 (20.9%) |
| 3-Person Household | 584 (79.2%) | 153 (20.8%) |
| 4+ Person Household | 902 (82.8%) | 188 (17.2%) |
| Total Housing Units | 4,360 (73.4%) | 1,578 (26.6%) |
Occupancy by Educational Attainment in New Ulm
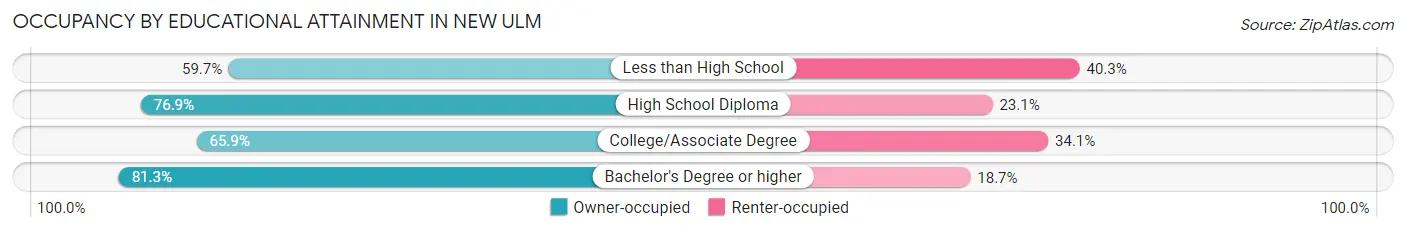
| Household Size | Owner-occupied | Renter-occupied |
| Less than High School | 253 (59.7%) | 171 (40.3%) |
| High School Diploma | 1,518 (76.9%) | 455 (23.1%) |
| College/Associate Degree | 1,243 (65.9%) | 643 (34.1%) |
| Bachelor's Degree or higher | 1,346 (81.3%) | 309 (18.7%) |
Occupancy by Age of Householder in New Ulm
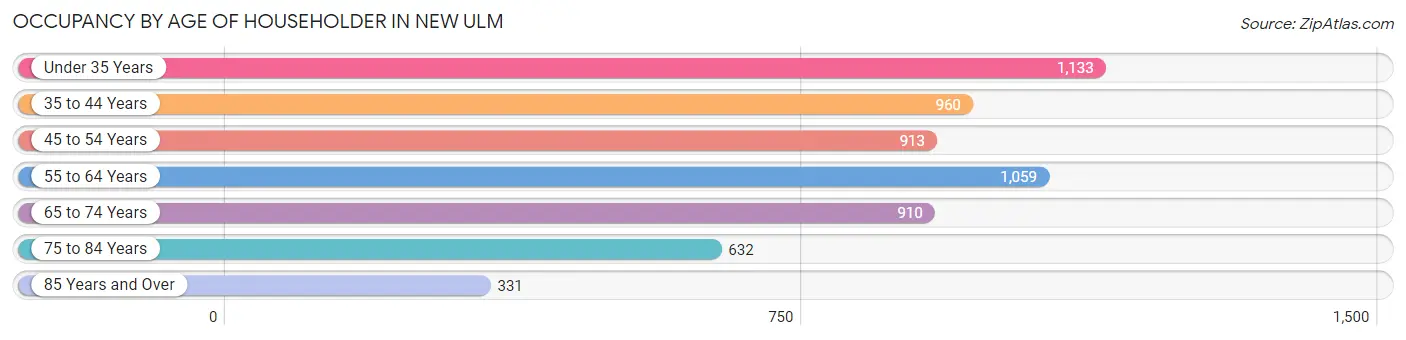
| Age Bracket | # Households | % Households |
| Under 35 Years | 1,133 | 19.1% |
| 35 to 44 Years | 960 | 16.2% |
| 45 to 54 Years | 913 | 15.4% |
| 55 to 64 Years | 1,059 | 17.8% |
| 65 to 74 Years | 910 | 15.3% |
| 75 to 84 Years | 632 | 10.6% |
| 85 Years and Over | 331 | 5.6% |
| Total | 5,938 | 100.0% |
Housing Finances in New Ulm
Median Income by Occupancy in New Ulm
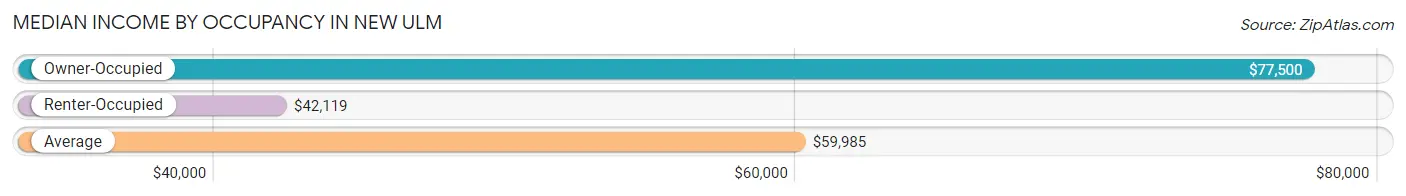
| Occupancy Type | # Households | Median Income |
| Owner-Occupied | 4,360 (73.4%) | $77,500 |
| Renter-Occupied | 1,578 (26.6%) | $42,119 |
| Average | 5,938 (100.0%) | $59,985 |
Occupancy by Householder Income Bracket in New Ulm
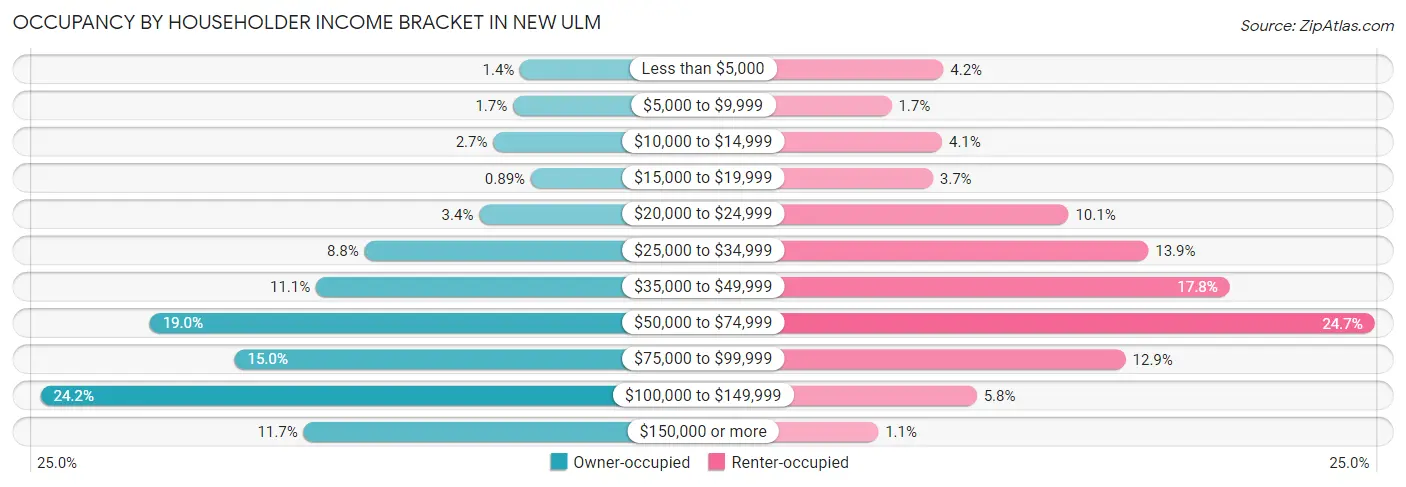
| Income Bracket | Owner-occupied | Renter-occupied |
| Less than $5,000 | 61 (1.4%) | 66 (4.2%) |
| $5,000 to $9,999 | 76 (1.7%) | 27 (1.7%) |
| $10,000 to $14,999 | 117 (2.7%) | 65 (4.1%) |
| $15,000 to $19,999 | 39 (0.9%) | 58 (3.7%) |
| $20,000 to $24,999 | 146 (3.4%) | 160 (10.1%) |
| $25,000 to $34,999 | 384 (8.8%) | 220 (13.9%) |
| $35,000 to $49,999 | 485 (11.1%) | 281 (17.8%) |
| $50,000 to $74,999 | 830 (19.0%) | 390 (24.7%) |
| $75,000 to $99,999 | 654 (15.0%) | 203 (12.9%) |
| $100,000 to $149,999 | 1,057 (24.2%) | 91 (5.8%) |
| $150,000 or more | 511 (11.7%) | 17 (1.1%) |
| Total | 4,360 (100.0%) | 1,578 (100.0%) |
Monthly Housing Cost Tiers in New Ulm
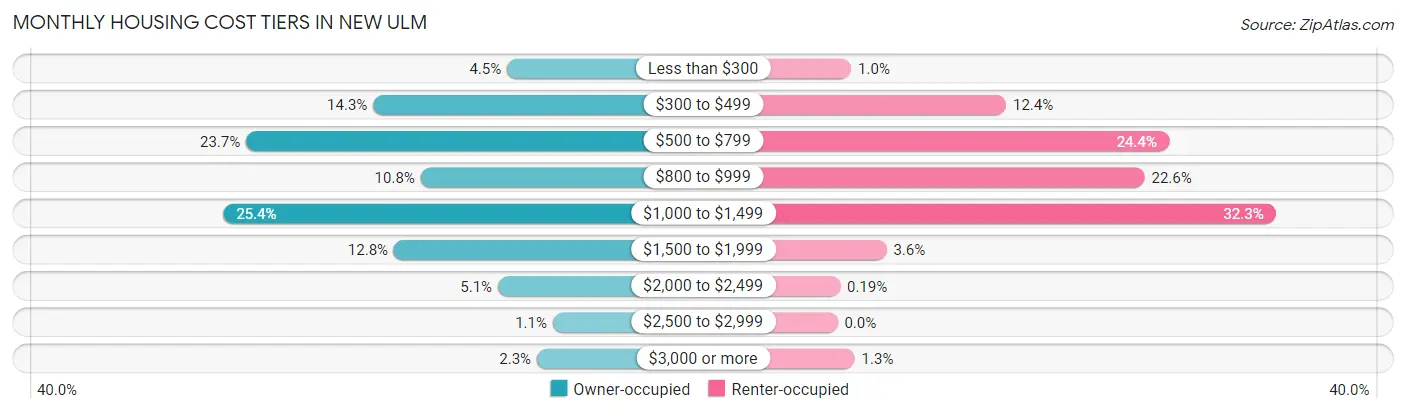
| Monthly Cost | Owner-occupied | Renter-occupied |
| Less than $300 | 195 (4.5%) | 16 (1.0%) |
| $300 to $499 | 625 (14.3%) | 196 (12.4%) |
| $500 to $799 | 1,033 (23.7%) | 385 (24.4%) |
| $800 to $999 | 472 (10.8%) | 357 (22.6%) |
| $1,000 to $1,499 | 1,106 (25.4%) | 509 (32.3%) |
| $1,500 to $1,999 | 558 (12.8%) | 57 (3.6%) |
| $2,000 to $2,499 | 224 (5.1%) | 3 (0.2%) |
| $2,500 to $2,999 | 48 (1.1%) | 0 (0.0%) |
| $3,000 or more | 99 (2.3%) | 20 (1.3%) |
| Total | 4,360 (100.0%) | 1,578 (100.0%) |
Physical Housing Characteristics in New Ulm
Housing Structures in New Ulm
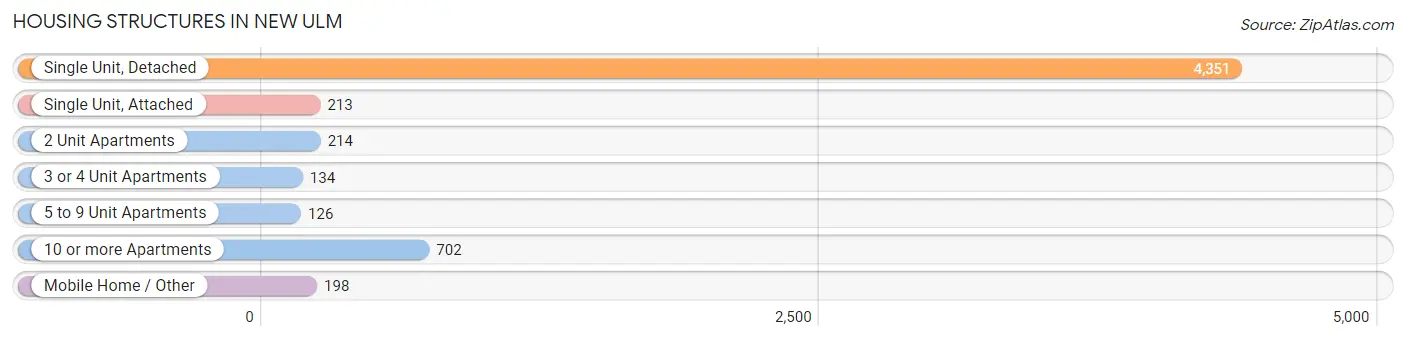
| Structure Type | # Housing Units | % Housing Units |
| Single Unit, Detached | 4,351 | 73.3% |
| Single Unit, Attached | 213 | 3.6% |
| 2 Unit Apartments | 214 | 3.6% |
| 3 or 4 Unit Apartments | 134 | 2.3% |
| 5 to 9 Unit Apartments | 126 | 2.1% |
| 10 or more Apartments | 702 | 11.8% |
| Mobile Home / Other | 198 | 3.3% |
| Total | 5,938 | 100.0% |
Housing Structures by Occupancy in New Ulm
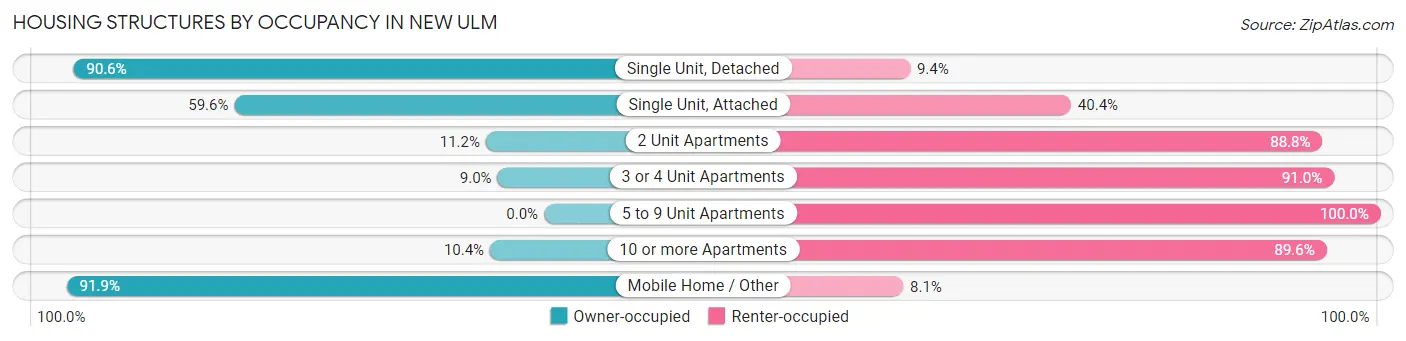
| Structure Type | Owner-occupied | Renter-occupied |
| Single Unit, Detached | 3,942 (90.6%) | 409 (9.4%) |
| Single Unit, Attached | 127 (59.6%) | 86 (40.4%) |
| 2 Unit Apartments | 24 (11.2%) | 190 (88.8%) |
| 3 or 4 Unit Apartments | 12 (9.0%) | 122 (91.0%) |
| 5 to 9 Unit Apartments | 0 (0.0%) | 126 (100.0%) |
| 10 or more Apartments | 73 (10.4%) | 629 (89.6%) |
| Mobile Home / Other | 182 (91.9%) | 16 (8.1%) |
| Total | 4,360 (73.4%) | 1,578 (26.6%) |
Housing Structures by Number of Rooms in New Ulm
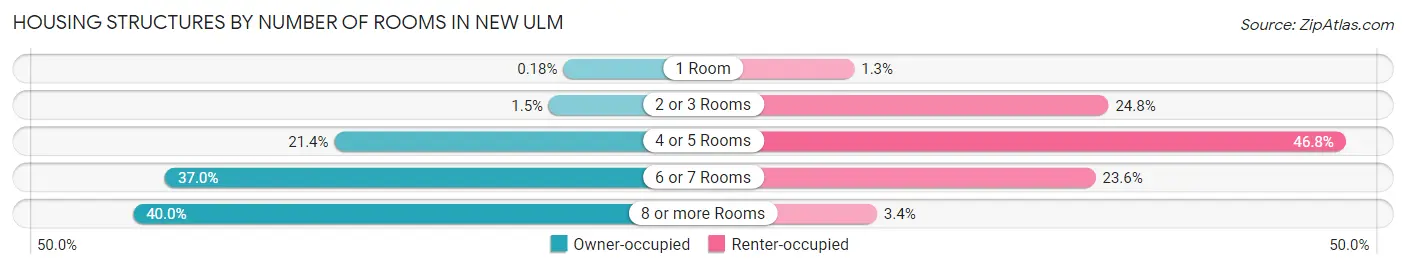
| Number of Rooms | Owner-occupied | Renter-occupied |
| 1 Room | 8 (0.2%) | 21 (1.3%) |
| 2 or 3 Rooms | 66 (1.5%) | 392 (24.8%) |
| 4 or 5 Rooms | 931 (21.3%) | 738 (46.8%) |
| 6 or 7 Rooms | 1,613 (37.0%) | 373 (23.6%) |
| 8 or more Rooms | 1,742 (40.0%) | 54 (3.4%) |
| Total | 4,360 (100.0%) | 1,578 (100.0%) |
Housing Structure by Heating Type in New Ulm
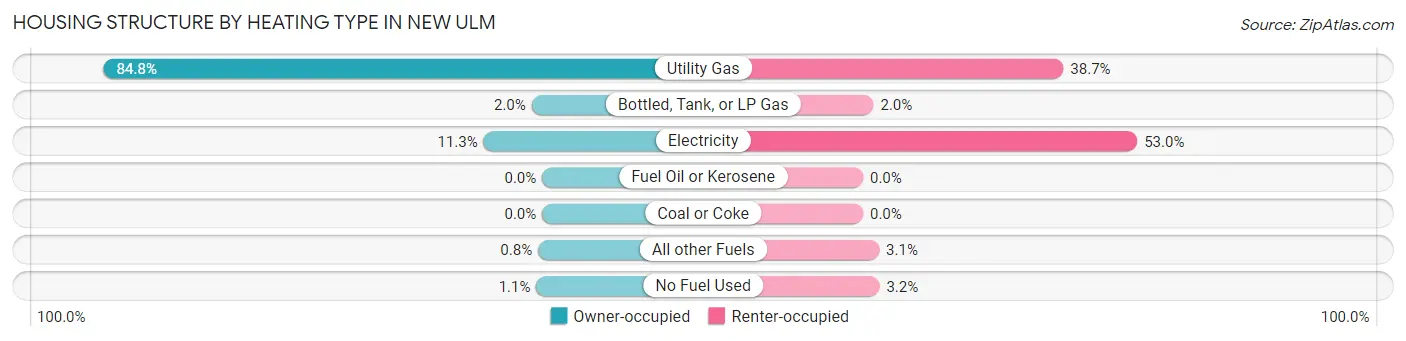
| Heating Type | Owner-occupied | Renter-occupied |
| Utility Gas | 3,695 (84.8%) | 611 (38.7%) |
| Bottled, Tank, or LP Gas | 88 (2.0%) | 32 (2.0%) |
| Electricity | 493 (11.3%) | 836 (53.0%) |
| Fuel Oil or Kerosene | 0 (0.0%) | 0 (0.0%) |
| Coal or Coke | 0 (0.0%) | 0 (0.0%) |
| All other Fuels | 35 (0.8%) | 49 (3.1%) |
| No Fuel Used | 49 (1.1%) | 50 (3.2%) |
| Total | 4,360 (100.0%) | 1,578 (100.0%) |
Household Vehicle Usage in New Ulm
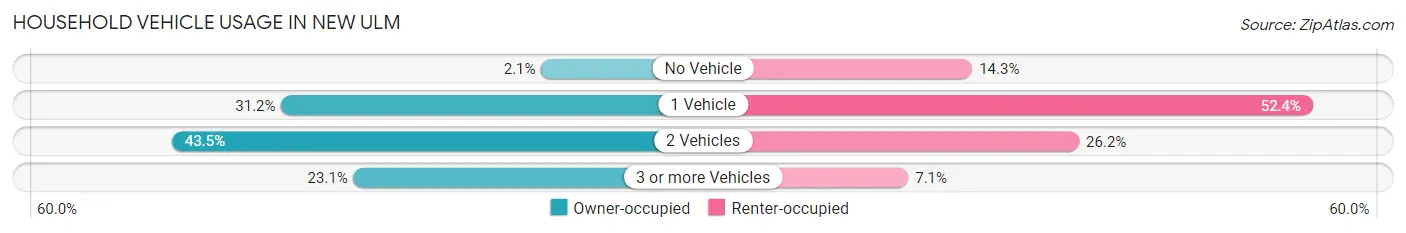
| Vehicles per Household | Owner-occupied | Renter-occupied |
| No Vehicle | 92 (2.1%) | 225 (14.3%) |
| 1 Vehicle | 1,362 (31.2%) | 827 (52.4%) |
| 2 Vehicles | 1,897 (43.5%) | 414 (26.2%) |
| 3 or more Vehicles | 1,009 (23.1%) | 112 (7.1%) |
| Total | 4,360 (100.0%) | 1,578 (100.0%) |
Real Estate & Mortgages in New Ulm
Real Estate and Mortgage Overview in New Ulm
| Characteristic | Without Mortgage | With Mortgage |
| Housing Units | 1,873 | 2,487 |
| Median Property Value | $167,800 | $172,100 |
| Median Household Income | $53,031 | $364 |
| Monthly Housing Costs | $537 | $99 |
| Real Estate Taxes | $2,141 | $44 |
Property Value by Mortgage Status in New Ulm
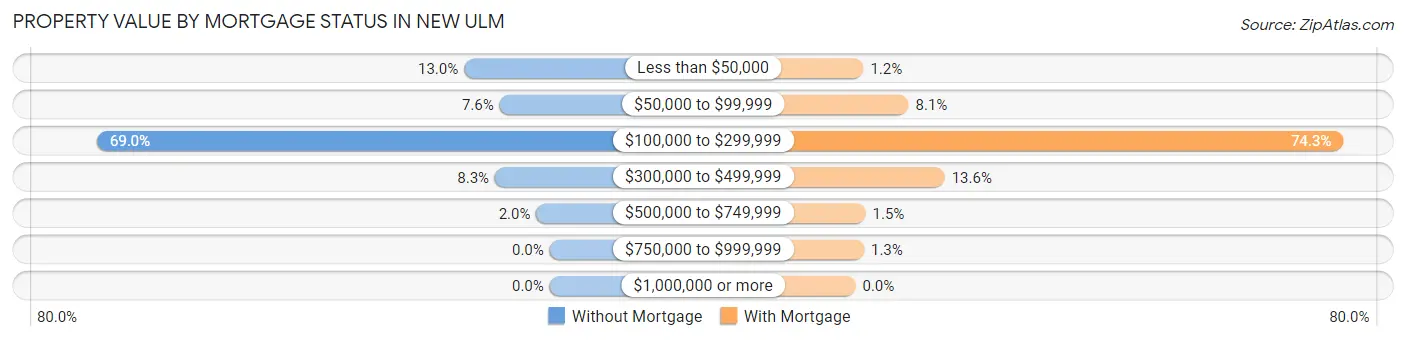
| Property Value | Without Mortgage | With Mortgage |
| Less than $50,000 | 244 (13.0%) | 30 (1.2%) |
| $50,000 to $99,999 | 143 (7.6%) | 201 (8.1%) |
| $100,000 to $299,999 | 1,292 (69.0%) | 1,848 (74.3%) |
| $300,000 to $499,999 | 156 (8.3%) | 338 (13.6%) |
| $500,000 to $749,999 | 38 (2.0%) | 38 (1.5%) |
| $750,000 to $999,999 | 0 (0.0%) | 32 (1.3%) |
| $1,000,000 or more | 0 (0.0%) | 0 (0.0%) |
| Total | 1,873 (100.0%) | 2,487 (100.0%) |
Household Income by Mortgage Status in New Ulm
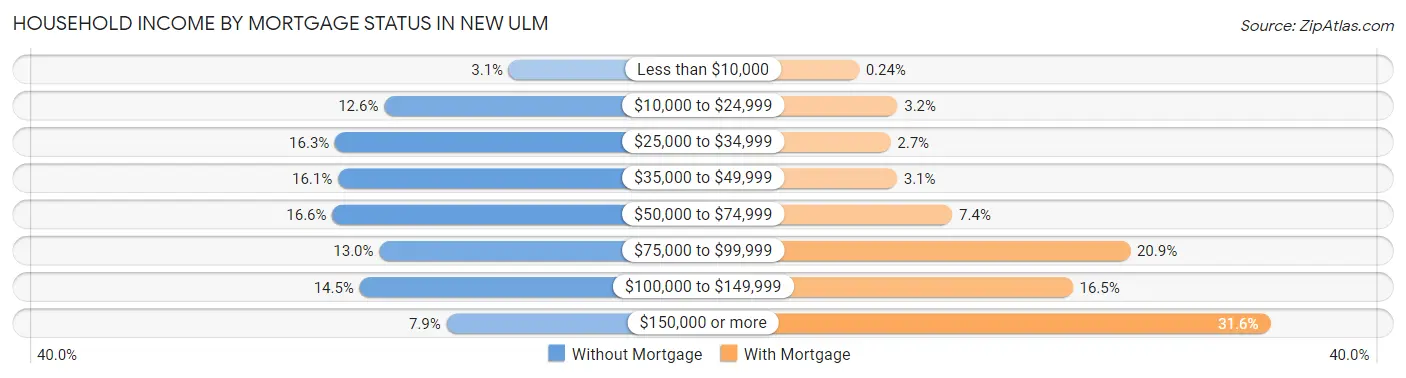
| Household Income | Without Mortgage | With Mortgage |
| Less than $10,000 | 58 (3.1%) | 6 (0.2%) |
| $10,000 to $24,999 | 236 (12.6%) | 79 (3.2%) |
| $25,000 to $34,999 | 306 (16.3%) | 66 (2.6%) |
| $35,000 to $49,999 | 302 (16.1%) | 78 (3.1%) |
| $50,000 to $74,999 | 310 (16.6%) | 183 (7.4%) |
| $75,000 to $99,999 | 243 (13.0%) | 520 (20.9%) |
| $100,000 to $149,999 | 271 (14.5%) | 411 (16.5%) |
| $150,000 or more | 147 (7.9%) | 786 (31.6%) |
| Total | 1,873 (100.0%) | 2,487 (100.0%) |
Property Value to Household Income Ratio in New Ulm
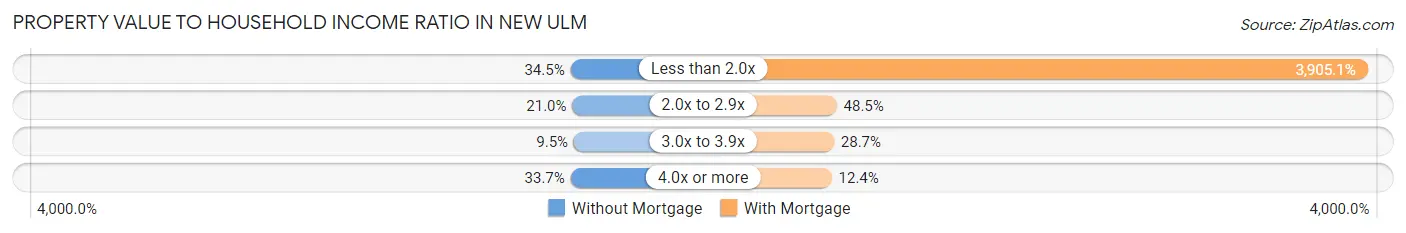
| Value-to-Income Ratio | Without Mortgage | With Mortgage |
| Less than 2.0x | 647 (34.5%) | 97,120 (3,905.1%) |
| 2.0x to 2.9x | 393 (21.0%) | 1,207 (48.5%) |
| 3.0x to 3.9x | 177 (9.5%) | 714 (28.7%) |
| 4.0x or more | 631 (33.7%) | 308 (12.4%) |
| Total | 1,873 (100.0%) | 2,487 (100.0%) |
Real Estate Taxes by Mortgage Status in New Ulm
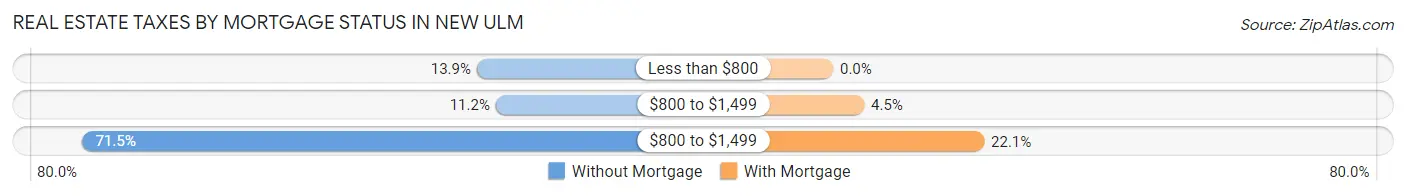
| Property Taxes | Without Mortgage | With Mortgage |
| Less than $800 | 261 (13.9%) | 0 (0.0%) |
| $800 to $1,499 | 209 (11.2%) | 113 (4.5%) |
| $800 to $1,499 | 1,340 (71.5%) | 549 (22.1%) |
| Total | 1,873 (100.0%) | 2,487 (100.0%) |
Health & Disability in New Ulm
Health Insurance Coverage by Age in New Ulm
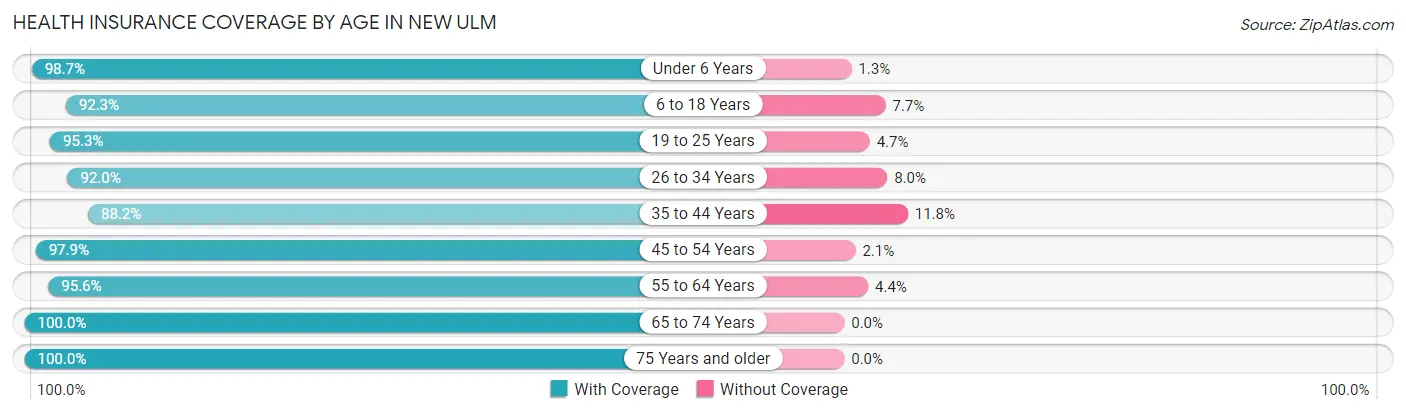
| Age Bracket | With Coverage | Without Coverage |
| Under 6 Years | 810 (98.7%) | 11 (1.3%) |
| 6 to 18 Years | 2,317 (92.3%) | 193 (7.7%) |
| 19 to 25 Years | 1,426 (95.3%) | 71 (4.7%) |
| 26 to 34 Years | 1,299 (92.0%) | 113 (8.0%) |
| 35 to 44 Years | 1,519 (88.2%) | 204 (11.8%) |
| 45 to 54 Years | 1,410 (97.9%) | 30 (2.1%) |
| 55 to 64 Years | 1,658 (95.6%) | 77 (4.4%) |
| 65 to 74 Years | 1,426 (100.0%) | 0 (0.0%) |
| 75 Years and older | 1,323 (100.0%) | 0 (0.0%) |
| Total | 13,188 (95.0%) | 699 (5.0%) |
Health Insurance Coverage by Citizenship Status in New Ulm
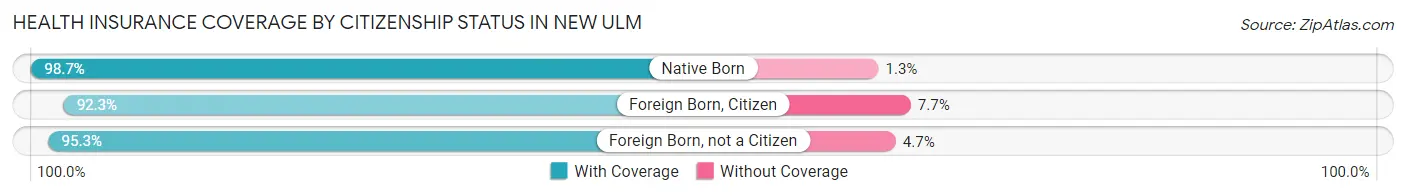
| Citizenship Status | With Coverage | Without Coverage |
| Native Born | 810 (98.7%) | 11 (1.3%) |
| Foreign Born, Citizen | 2,317 (92.3%) | 193 (7.7%) |
| Foreign Born, not a Citizen | 1,426 (95.3%) | 71 (4.7%) |
Health Insurance Coverage by Household Income in New Ulm
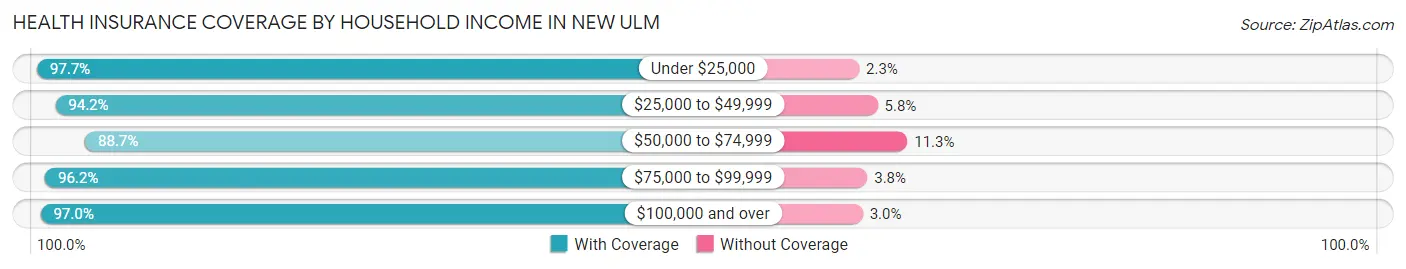
| Household Income | With Coverage | Without Coverage |
| Under $25,000 | 1,182 (97.7%) | 28 (2.3%) |
| $25,000 to $49,999 | 1,847 (94.2%) | 113 (5.8%) |
| $50,000 to $74,999 | 2,478 (88.7%) | 317 (11.3%) |
| $75,000 to $99,999 | 1,777 (96.2%) | 71 (3.8%) |
| $100,000 and over | 5,112 (97.0%) | 157 (3.0%) |
Public vs Private Health Insurance Coverage by Age in New Ulm
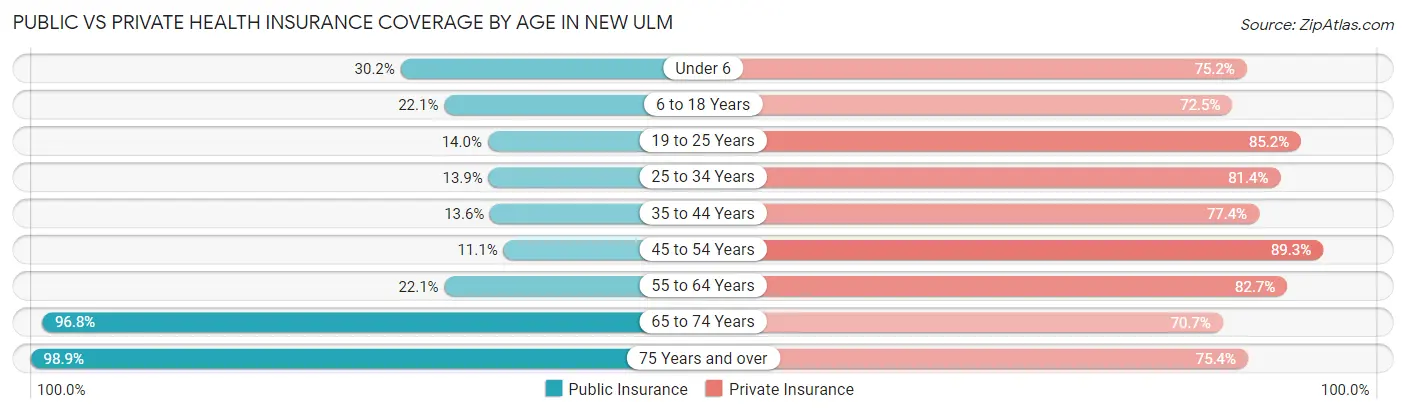
| Age Bracket | Public Insurance | Private Insurance |
| Under 6 | 248 (30.2%) | 617 (75.1%) |
| 6 to 18 Years | 555 (22.1%) | 1,819 (72.5%) |
| 19 to 25 Years | 210 (14.0%) | 1,276 (85.2%) |
| 25 to 34 Years | 196 (13.9%) | 1,149 (81.4%) |
| 35 to 44 Years | 234 (13.6%) | 1,334 (77.4%) |
| 45 to 54 Years | 160 (11.1%) | 1,286 (89.3%) |
| 55 to 64 Years | 383 (22.1%) | 1,434 (82.7%) |
| 65 to 74 Years | 1,380 (96.8%) | 1,008 (70.7%) |
| 75 Years and over | 1,308 (98.9%) | 997 (75.4%) |
| Total | 4,674 (33.7%) | 10,920 (78.6%) |
Disability Status by Sex by Age in New Ulm
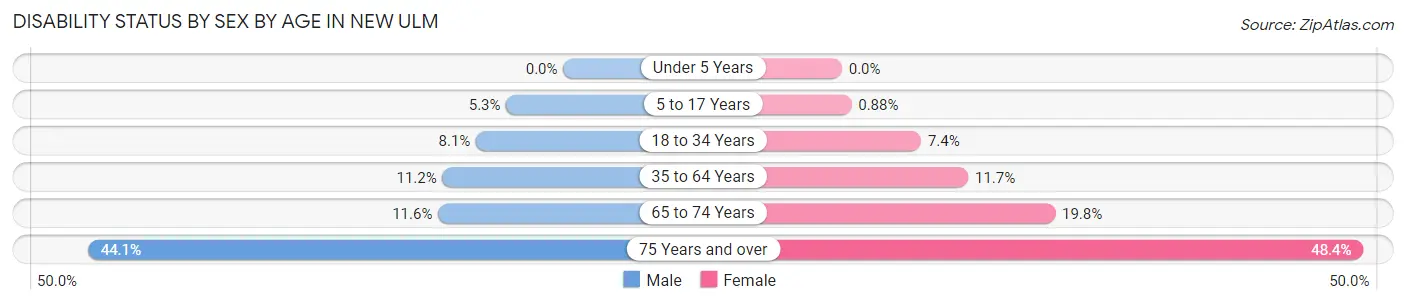
| Age Bracket | Male | Female |
| Under 5 Years | 0 (0.0%) | 0 (0.0%) |
| 5 to 17 Years | 64 (5.3%) | 10 (0.9%) |
| 18 to 34 Years | 127 (8.1%) | 120 (7.3%) |
| 35 to 64 Years | 267 (11.2%) | 295 (11.7%) |
| 65 to 74 Years | 77 (11.6%) | 151 (19.8%) |
| 75 Years and over | 252 (44.1%) | 364 (48.4%) |
Disability Class by Sex by Age in New Ulm
Disability Class: Hearing Difficulty
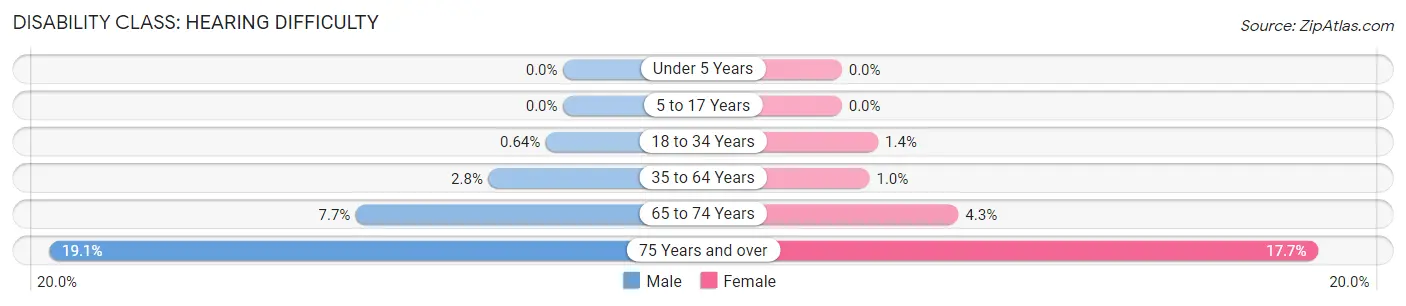
| Age Bracket | Male | Female |
| Under 5 Years | 0 (0.0%) | 0 (0.0%) |
| 5 to 17 Years | 0 (0.0%) | 0 (0.0%) |
| 18 to 34 Years | 10 (0.6%) | 22 (1.3%) |
| 35 to 64 Years | 66 (2.8%) | 26 (1.0%) |
| 65 to 74 Years | 51 (7.7%) | 33 (4.3%) |
| 75 Years and over | 109 (19.1%) | 133 (17.7%) |
Disability Class: Vision Difficulty
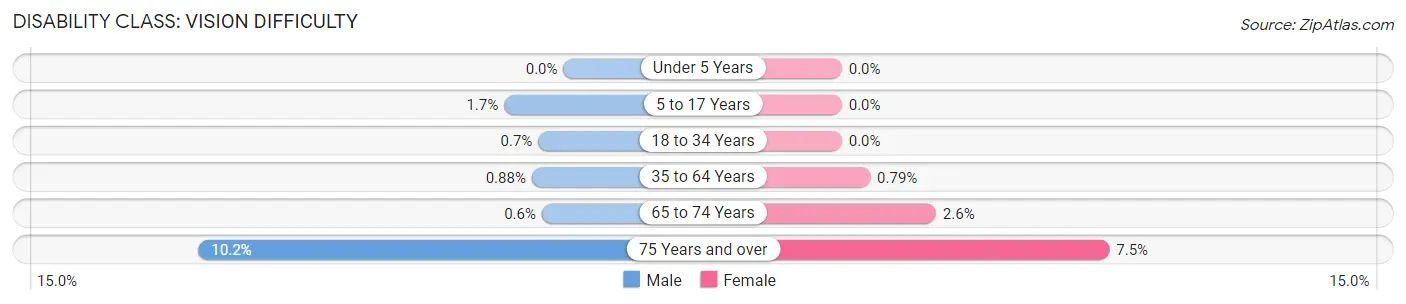
| Age Bracket | Male | Female |
| Under 5 Years | 0 (0.0%) | 0 (0.0%) |
| 5 to 17 Years | 20 (1.7%) | 0 (0.0%) |
| 18 to 34 Years | 11 (0.7%) | 0 (0.0%) |
| 35 to 64 Years | 21 (0.9%) | 20 (0.8%) |
| 65 to 74 Years | 4 (0.6%) | 20 (2.6%) |
| 75 Years and over | 58 (10.2%) | 56 (7.4%) |
Disability Class: Cognitive Difficulty
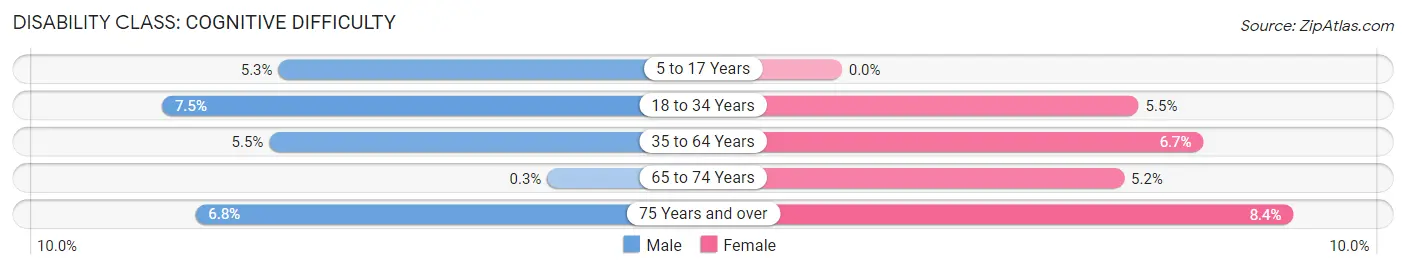
| Age Bracket | Male | Female |
| 5 to 17 Years | 64 (5.3%) | 0 (0.0%) |
| 18 to 34 Years | 117 (7.4%) | 90 (5.5%) |
| 35 to 64 Years | 130 (5.5%) | 169 (6.7%) |
| 65 to 74 Years | 2 (0.3%) | 40 (5.2%) |
| 75 Years and over | 39 (6.8%) | 63 (8.4%) |
Disability Class: Ambulatory Difficulty
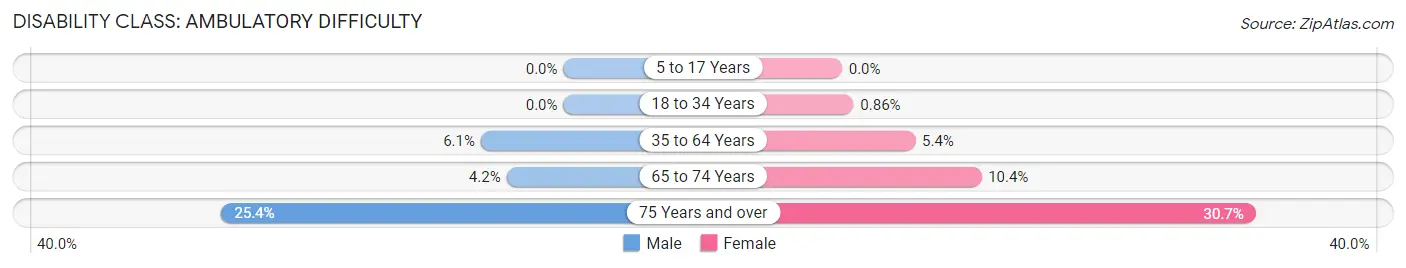
| Age Bracket | Male | Female |
| 5 to 17 Years | 0 (0.0%) | 0 (0.0%) |
| 18 to 34 Years | 0 (0.0%) | 14 (0.9%) |
| 35 to 64 Years | 146 (6.1%) | 137 (5.4%) |
| 65 to 74 Years | 28 (4.2%) | 79 (10.3%) |
| 75 Years and over | 145 (25.4%) | 231 (30.7%) |
Disability Class: Self-Care Difficulty
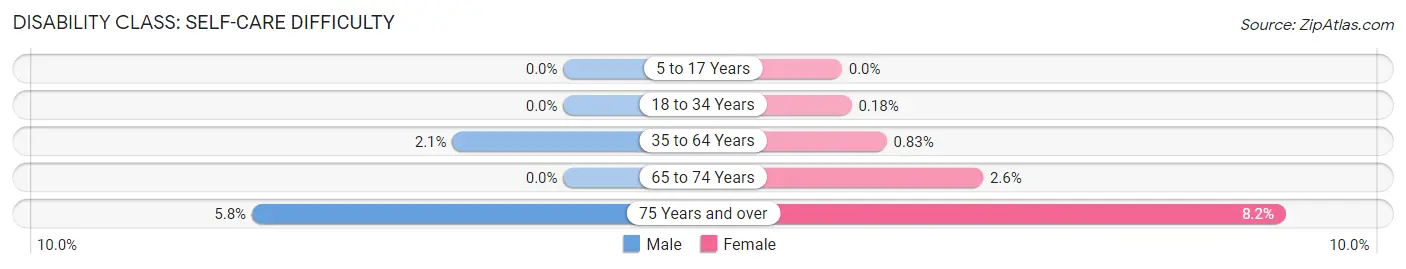
| Age Bracket | Male | Female |
| 5 to 17 Years | 0 (0.0%) | 0 (0.0%) |
| 18 to 34 Years | 0 (0.0%) | 3 (0.2%) |
| 35 to 64 Years | 49 (2.1%) | 21 (0.8%) |
| 65 to 74 Years | 0 (0.0%) | 20 (2.6%) |
| 75 Years and over | 33 (5.8%) | 62 (8.2%) |
Technology Access in New Ulm
Computing Device Access in New Ulm
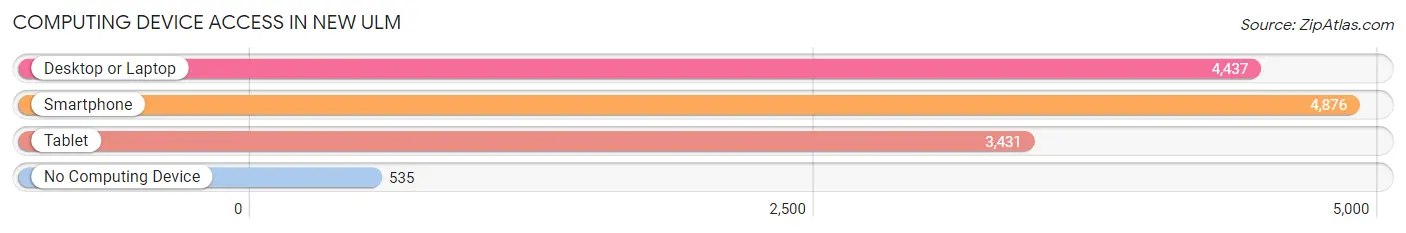
| Device Type | # Households | % Households |
| Desktop or Laptop | 4,437 | 74.7% |
| Smartphone | 4,876 | 82.1% |
| Tablet | 3,431 | 57.8% |
| No Computing Device | 535 | 9.0% |
| Total | 5,938 | 100.0% |
Internet Access in New Ulm
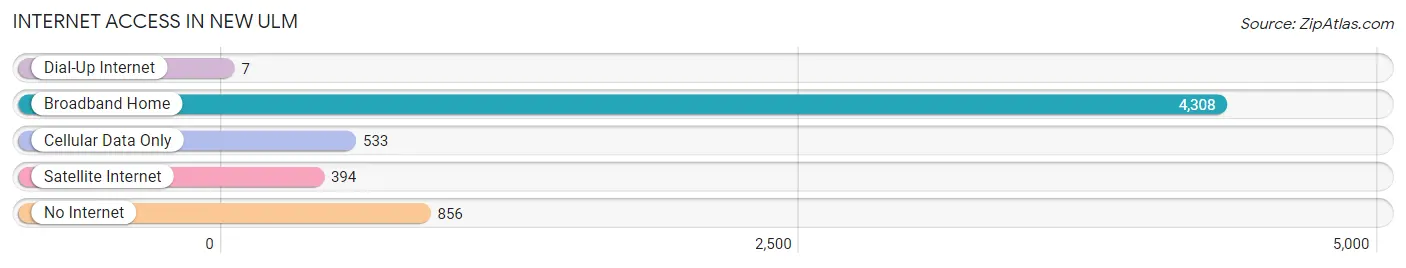
| Internet Type | # Households | % Households |
| Dial-Up Internet | 7 | 0.1% |
| Broadband Home | 4,308 | 72.6% |
| Cellular Data Only | 533 | 9.0% |
| Satellite Internet | 394 | 6.6% |
| No Internet | 856 | 14.4% |
| Total | 5,938 | 100.0% |
New Ulm Summary
New Ulm, Minnesota is a city located in Brown County in the south-central part of the state. It is situated along the Minnesota River and is the county seat of Brown County. The city has a population of approximately 13,500 people and is the home of the August Schell Brewing Company, the second-oldest family-owned brewery in the United States.
History
The area that is now New Ulm was first settled by German immigrants in 1854. The city was founded by the German Land Company of Chicago, which was formed by a group of German-American businessmen. The city was named after the city of Neu-Ulm in Bavaria, Germany. The city was incorporated in 1856 and was the site of the Battle of New Ulm during the Dakota War of 1862. The city was destroyed by fire in 1881, but was quickly rebuilt.
Geography
New Ulm is located in south-central Minnesota, along the Minnesota River. The city has a total area of 8.2 square miles, of which 8.1 square miles is land and 0.1 square miles is water. The city is located in the Minnesota River Valley and is surrounded by rolling hills and bluffs.
Economy
New Ulm’s economy is largely based on manufacturing and agriculture. The city is home to several large manufacturing companies, including the August Schell Brewing Company, the second-oldest family-owned brewery in the United States. The city is also home to several agricultural businesses, including dairy farms, grain elevators, and feed mills.
Demographics
As of the 2010 census, New Ulm had a population of 13,522 people. The racial makeup of the city was 95.2% White, 0.7% African American, 0.3% Native American, 0.7% Asian, 0.1% Pacific Islander, 1.7% from other races, and 1.3% from two or more races. Hispanic or Latino of any race were 3.2% of the population.
The median income for a household in the city was $45,813, and the median income for a family was $54,945. The per capita income for the city was $22,845. About 6.2% of families and 8.7% of the population were below the poverty line, including 11.2% of those under age 18 and 8.2% of those age 65 or over.
New Ulm is a diverse city with a rich history and a strong economy. The city is home to several large manufacturing companies and agricultural businesses, and has a population of approximately 13,500 people. The city is located in the Minnesota River Valley and is surrounded by rolling hills and bluffs. New Ulm is a great place to live, work, and visit.
Common Questions
What is Per Capita Income in New Ulm?
Per Capita income in New Ulm is $33,582.
What is the Median Family Income in New Ulm?
Median Family Income in New Ulm is $86,861.
What is the Median Household income in New Ulm?
Median Household Income in New Ulm is $59,985.
What is Income or Wage Gap in New Ulm?
Income or Wage Gap in New Ulm is 33.9%.
Women in New Ulm earn 66.1 cents for every dollar earned by a man.
What is Inequality or Gini Index in New Ulm?
Inequality or Gini Index in New Ulm is 0.39.
What is the Total Population of New Ulm?
Total Population of New Ulm is 14,055.
What is the Total Male Population of New Ulm?
Total Male Population of New Ulm is 6,806.
What is the Total Female Population of New Ulm?
Total Female Population of New Ulm is 7,249.
What is the Ratio of Males per 100 Females in New Ulm?
There are 93.89 Males per 100 Females in New Ulm.
What is the Ratio of Females per 100 Males in New Ulm?
There are 106.51 Females per 100 Males in New Ulm.
What is the Median Population Age in New Ulm?
Median Population Age in New Ulm is 38.9 Years.
What is the Average Family Size in New Ulm
Average Family Size in New Ulm is 2.8 People.
What is the Average Household Size in New Ulm
Average Household Size in New Ulm is 2.2 People.
How Large is the Labor Force in New Ulm?
There are 7,487 People in the Labor Forcein in New Ulm.
What is the Percentage of People in the Labor Force in New Ulm?
65.8% of People are in the Labor Force in New Ulm.
What is the Unemployment Rate in New Ulm?
Unemployment Rate in New Ulm is 2.8%.