St Francis, MN Map & Demographics
St Francis Map
St Francis Overview
$36,568
PER CAPITA INCOME
$99,028
AVG FAMILY INCOME
$98,390
AVG HOUSEHOLD INCOME
34.9%
WAGE / INCOME GAP [ % ]
65.1¢/ $1
WAGE / INCOME GAP [ $ ]
0.32
INEQUALITY / GINI INDEX
8,198
TOTAL POPULATION
4,249
MALE POPULATION
3,949
FEMALE POPULATION
107.60
MALES / 100 FEMALES
92.94
FEMALES / 100 MALES
34.4
MEDIAN AGE
3.3
AVG FAMILY SIZE
3.0
AVG HOUSEHOLD SIZE
4,439
LABOR FORCE [ PEOPLE ]
74.1%
PERCENT IN LABOR FORCE
2.7%
UNEMPLOYMENT RATE
Income in St Francis
Income Overview in St Francis
Per Capita Income in St Francis is $36,568, while median incomes of families and households are $99,028 and $98,390 respectively.
| Characteristic | Number | Measure |
| Per Capita Income | 8,198 | $36,568 |
| Median Family Income | 2,102 | $99,028 |
| Mean Family Income | 2,102 | $107,416 |
| Median Household Income | 2,780 | $98,390 |
| Mean Household Income | 2,780 | $105,635 |
| Income Deficit | 2,102 | $0 |
| Wage / Income Gap (%) | 8,198 | 34.94% |
| Wage / Income Gap ($) | 8,198 | 65.06¢ per $1 |
| Gini / Inequality Index | 8,198 | 0.32 |
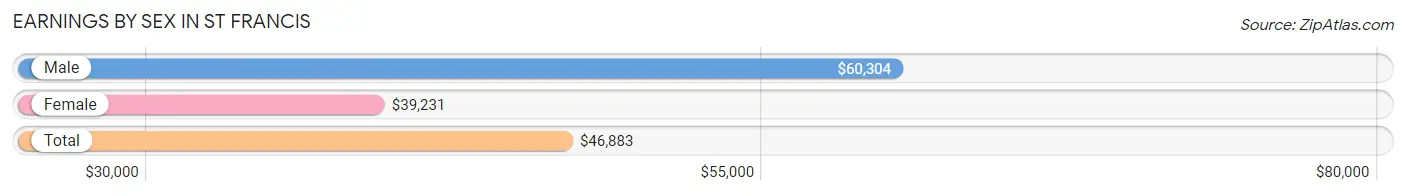
Earnings by Sex in St Francis
Average Earnings in St Francis are $46,883, $60,304 for men and $39,231 for women, a difference of 34.9%.
| Sex | Number | Average Earnings |
| Male | 2,401 (51.1%) | $60,304 |
| Female | 2,299 (48.9%) | $39,231 |
| Total | 4,700 (100.0%) | $46,883 |
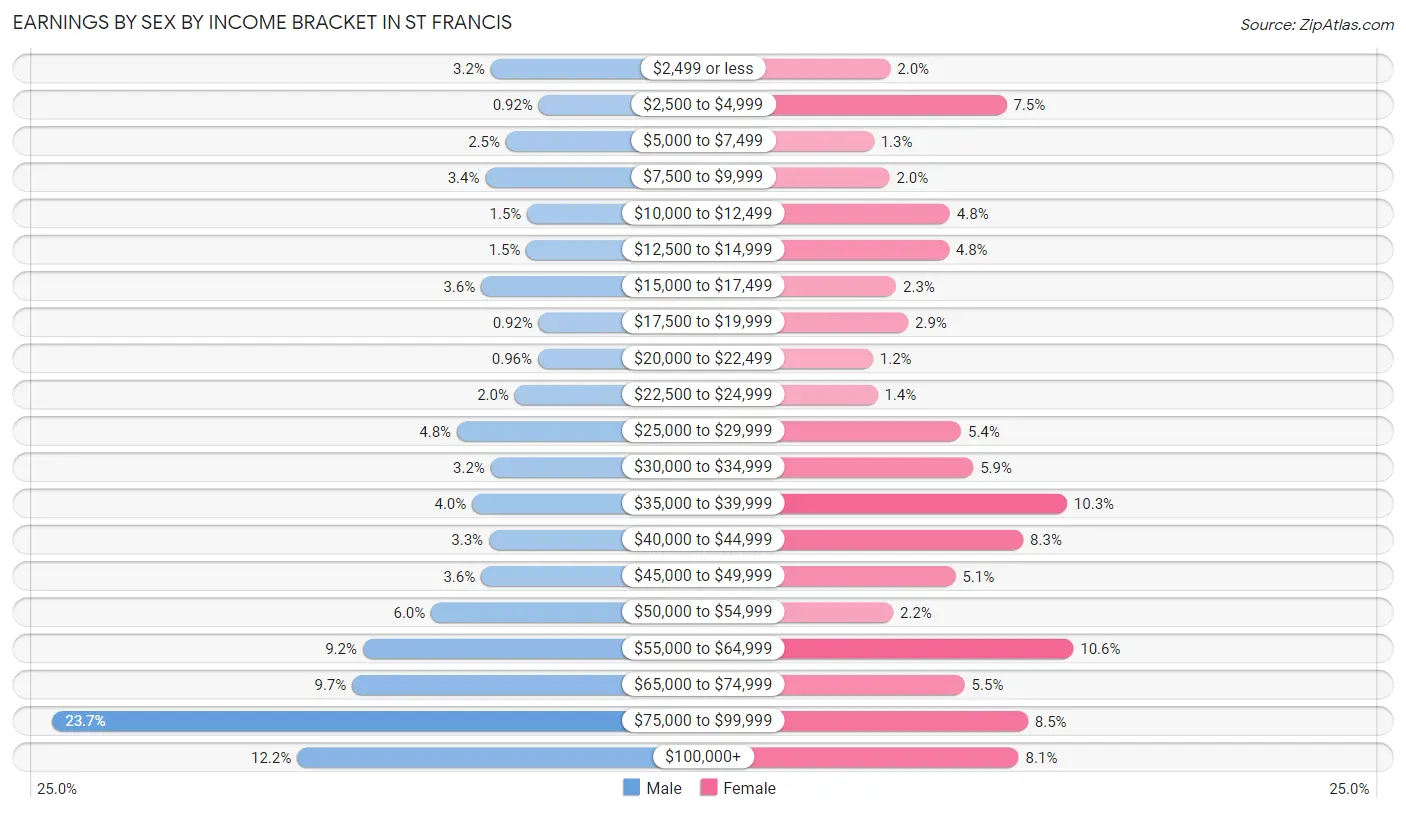
Earnings by Sex by Income Bracket in St Francis
The most common earnings brackets in St Francis are $75,000 to $99,999 for men (569 | 23.7%) and $55,000 to $64,999 for women (244 | 10.6%).
| Income | Male | Female |
| $2,499 or less | 76 (3.2%) | 47 (2.0%) |
| $2,500 to $4,999 | 22 (0.9%) | 172 (7.5%) |
| $5,000 to $7,499 | 59 (2.5%) | 29 (1.3%) |
| $7,500 to $9,999 | 82 (3.4%) | 46 (2.0%) |
| $10,000 to $12,499 | 35 (1.5%) | 111 (4.8%) |
| $12,500 to $14,999 | 36 (1.5%) | 110 (4.8%) |
| $15,000 to $17,499 | 87 (3.6%) | 53 (2.3%) |
| $17,500 to $19,999 | 22 (0.9%) | 66 (2.9%) |
| $20,000 to $22,499 | 23 (1.0%) | 28 (1.2%) |
| $22,500 to $24,999 | 49 (2.0%) | 33 (1.4%) |
| $25,000 to $29,999 | 114 (4.8%) | 123 (5.3%) |
| $30,000 to $34,999 | 76 (3.2%) | 136 (5.9%) |
| $35,000 to $39,999 | 97 (4.0%) | 237 (10.3%) |
| $40,000 to $44,999 | 78 (3.3%) | 190 (8.3%) |
| $45,000 to $49,999 | 87 (3.6%) | 117 (5.1%) |
| $50,000 to $54,999 | 143 (6.0%) | 50 (2.2%) |
| $55,000 to $64,999 | 220 (9.2%) | 244 (10.6%) |
| $65,000 to $74,999 | 232 (9.7%) | 127 (5.5%) |
| $75,000 to $99,999 | 569 (23.7%) | 195 (8.5%) |
| $100,000+ | 294 (12.2%) | 185 (8.1%) |
| Total | 2,401 (100.0%) | 2,299 (100.0%) |
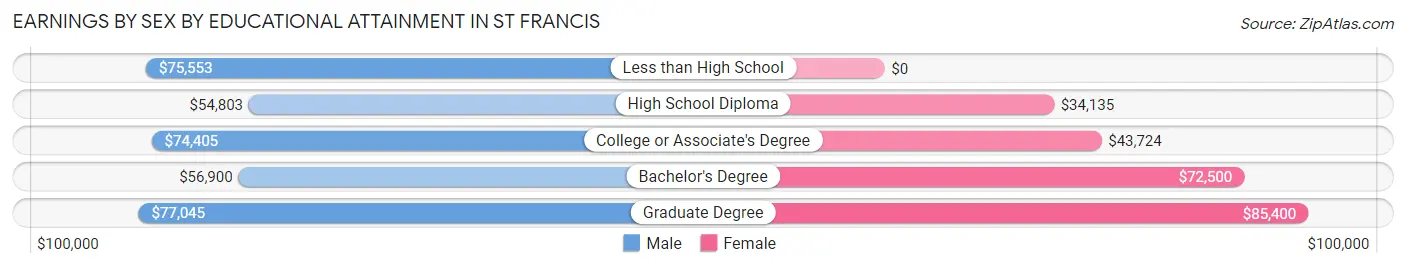
Earnings by Sex by Educational Attainment in St Francis
Average earnings in St Francis are $67,036 for men and $44,281 for women, a difference of 33.9%. Men with an educational attainment of graduate degree enjoy the highest average annual earnings of $77,045, while those with high school diploma education earn the least with $54,803. Women with an educational attainment of graduate degree earn the most with the average annual earnings of $85,400, while those with high school diploma education have the smallest earnings of $34,135.
| Educational Attainment | Male Income | Female Income |
| Less than High School | $75,553 | $0 |
| High School Diploma | $54,803 | $34,135 |
| College or Associate's Degree | $74,405 | $43,724 |
| Bachelor's Degree | $56,900 | $72,500 |
| Graduate Degree | $77,045 | $85,400 |
| Total | $67,036 | $44,281 |
Family Income in St Francis
Family Income Brackets in St Francis
According to the St Francis family income data, there are 641 families falling into the $100,000 to $149,999 income range, which is the most common income bracket and makes up 30.5% of all families.
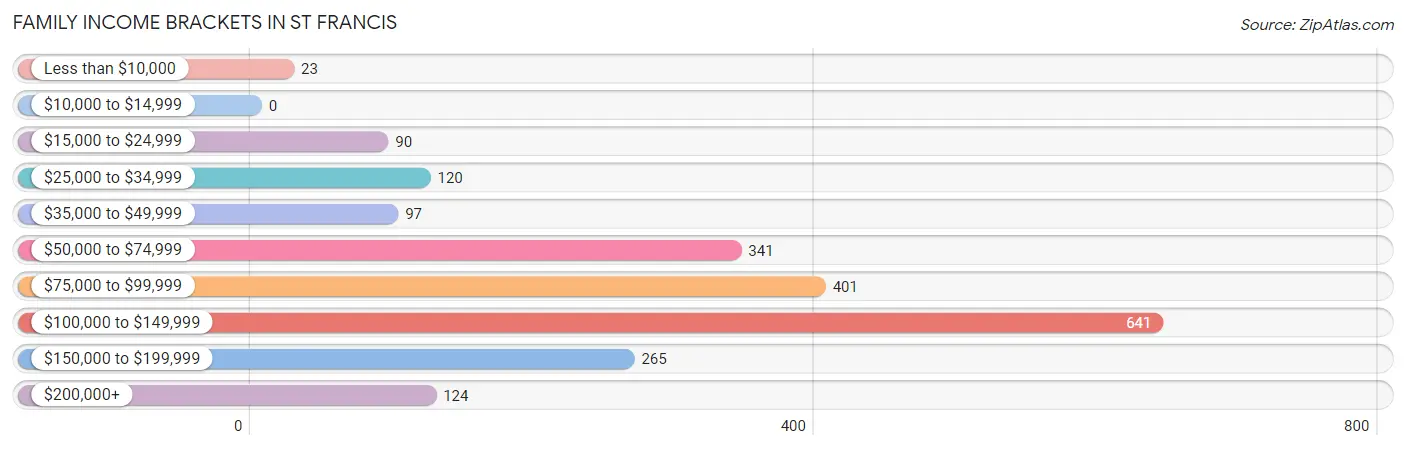
| Income Bracket | # Families | % Families |
| Less than $10,000 | 23 | 1.1% |
| $10,000 to $14,999 | 0 | 0.0% |
| $15,000 to $24,999 | 90 | 4.3% |
| $25,000 to $34,999 | 120 | 5.7% |
| $35,000 to $49,999 | 97 | 4.6% |
| $50,000 to $74,999 | 341 | 16.2% |
| $75,000 to $99,999 | 401 | 19.1% |
| $100,000 to $149,999 | 641 | 30.5% |
| $150,000 to $199,999 | 265 | 12.6% |
| $200,000+ | 124 | 5.9% |
Family Income by Famaliy Size in St Francis
7+ person families (49 | 2.3%) account for the highest median family income in St Francis with $138,958 per family, while 2-person families (864 | 41.1%) have the highest median income of $39,130 per family member.
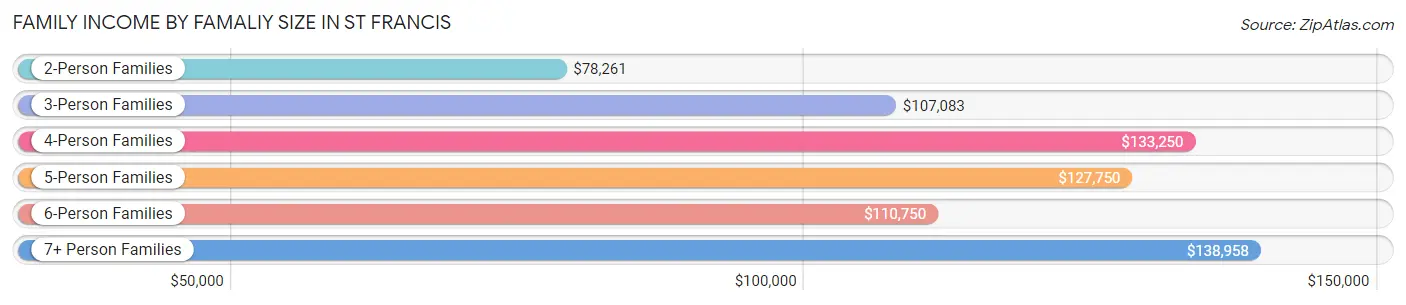
| Income Bracket | # Families | Median Income |
| 2-Person Families | 864 (41.1%) | $78,261 |
| 3-Person Families | 566 (26.9%) | $107,083 |
| 4-Person Families | 370 (17.6%) | $133,250 |
| 5-Person Families | 187 (8.9%) | $127,750 |
| 6-Person Families | 66 (3.1%) | $110,750 |
| 7+ Person Families | 49 (2.3%) | $138,958 |
| Total | 2,102 (100.0%) | $99,028 |
Family Income by Number of Earners in St Francis
The median family income in St Francis is $99,028, with families comprising 3+ earners (232) having the highest median family income of $160,833, while families with no earners (251) have the lowest median family income of $54,053, accounting for 11.0% and 11.9% of families, respectively.
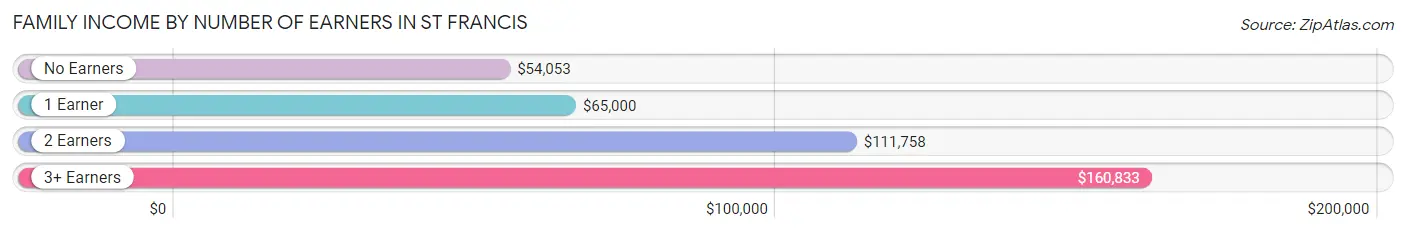
| Number of Earners | # Families | Median Income |
| No Earners | 251 (11.9%) | $54,053 |
| 1 Earner | 452 (21.5%) | $65,000 |
| 2 Earners | 1,167 (55.5%) | $111,758 |
| 3+ Earners | 232 (11.0%) | $160,833 |
| Total | 2,102 (100.0%) | $99,028 |
Household Income in St Francis
Household Income Brackets in St Francis
With 834 households falling in the category, the $100,000 to $149,999 income range is the most frequent in St Francis, accounting for 30.0% of all households. In contrast, only 17 households (0.6%) fall into the $10,000 to $14,999 income bracket, making it the least populous group.
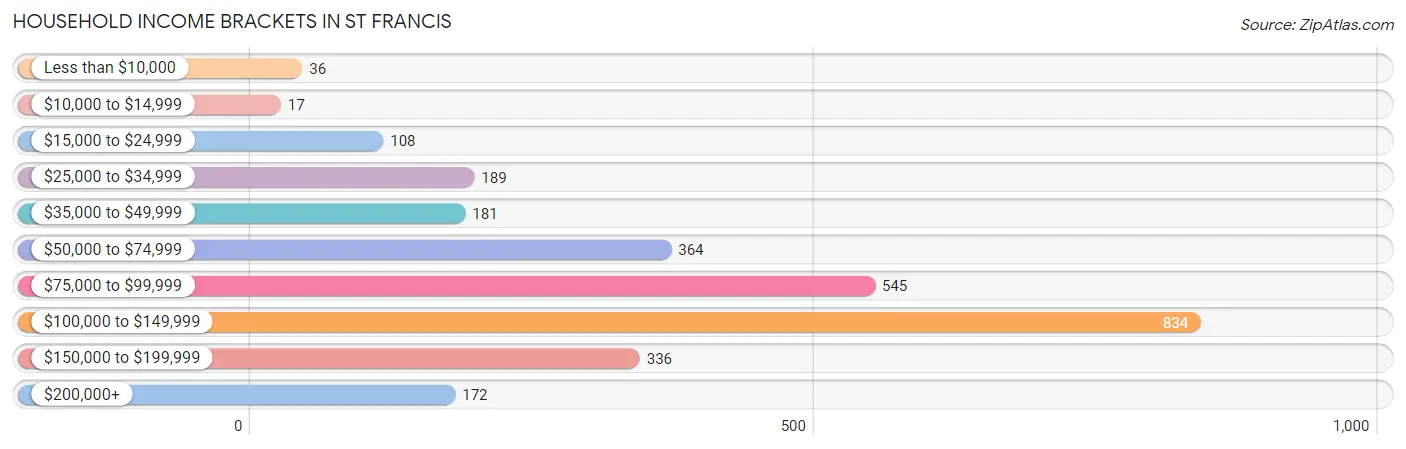
| Income Bracket | # Households | % Households |
| Less than $10,000 | 36 | 1.3% |
| $10,000 to $14,999 | 17 | 0.6% |
| $15,000 to $24,999 | 108 | 3.9% |
| $25,000 to $34,999 | 189 | 6.8% |
| $35,000 to $49,999 | 181 | 6.5% |
| $50,000 to $74,999 | 364 | 13.1% |
| $75,000 to $99,999 | 545 | 19.6% |
| $100,000 to $149,999 | 834 | 30.0% |
| $150,000 to $199,999 | 336 | 12.1% |
| $200,000+ | 172 | 6.2% |
Household Income by Householder Age in St Francis
The median household income in St Francis is $98,390, with the highest median household income of $123,438 found in the 45 to 64 years age bracket for the primary householder. A total of 1,046 households (37.6%) fall into this category. Meanwhile, the 15 to 24 years age bracket for the primary householder has the lowest median household income of $0, with 86 households (3.1%) in this group.
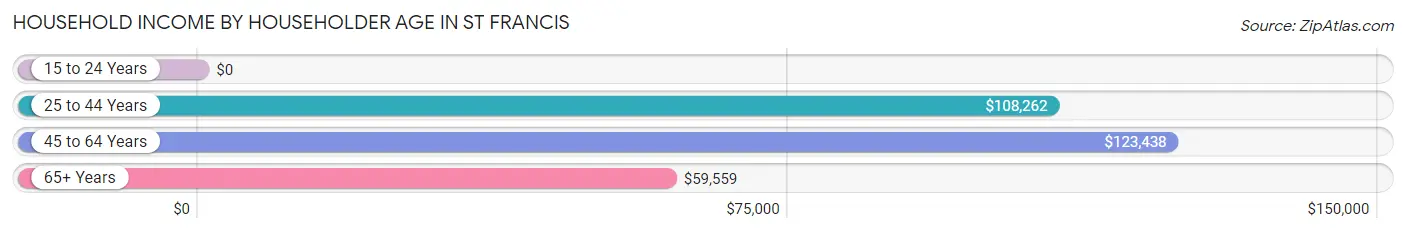
| Income Bracket | # Households | Median Income |
| 15 to 24 Years | 86 (3.1%) | $0 |
| 25 to 44 Years | 1,142 (41.1%) | $108,262 |
| 45 to 64 Years | 1,046 (37.6%) | $123,438 |
| 65+ Years | 506 (18.2%) | $59,559 |
| Total | 2,780 (100.0%) | $98,390 |
Poverty in St Francis
Income Below Poverty by Sex and Age in St Francis
With 4.2% poverty level for males and 8.0% for females among the residents of St Francis, 5 year old males and 12 to 14 year old females are the most vulnerable to poverty, with 10 males (19.2%) and 48 females (27.1%) in their respective age groups living below the poverty level.
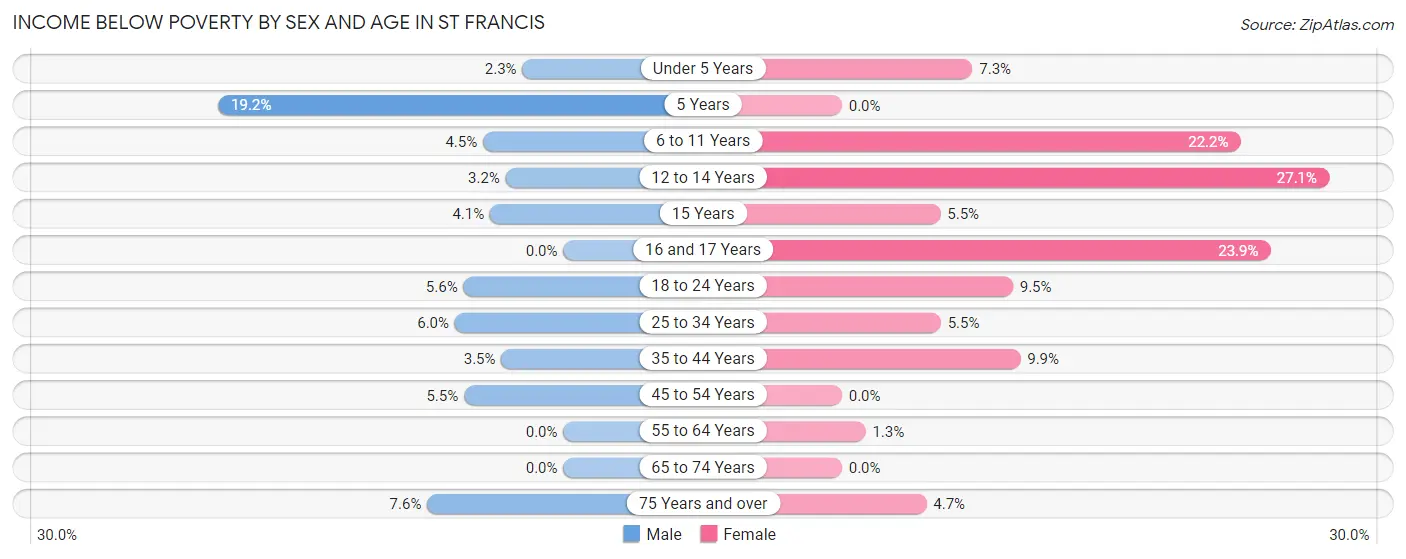
| Age Bracket | Male | Female |
| Under 5 Years | 8 (2.3%) | 16 (7.3%) |
| 5 Years | 10 (19.2%) | 0 (0.0%) |
| 6 to 11 Years | 25 (4.5%) | 79 (22.2%) |
| 12 to 14 Years | 6 (3.2%) | 48 (27.1%) |
| 15 Years | 4 (4.1%) | 5 (5.5%) |
| 16 and 17 Years | 0 (0.0%) | 21 (23.9%) |
| 18 to 24 Years | 17 (5.6%) | 34 (9.5%) |
| 25 to 34 Years | 35 (6.0%) | 31 (5.5%) |
| 35 to 44 Years | 23 (3.5%) | 62 (9.9%) |
| 45 to 54 Years | 32 (5.5%) | 0 (0.0%) |
| 55 to 64 Years | 0 (0.0%) | 6 (1.3%) |
| 65 to 74 Years | 0 (0.0%) | 0 (0.0%) |
| 75 Years and over | 16 (7.6%) | 12 (4.7%) |
| Total | 176 (4.2%) | 314 (8.0%) |
Income Above Poverty by Sex and Age in St Francis
According to the poverty statistics in St Francis, males aged 16 and 17 years and females aged 5 years are the age groups that are most secure financially, with 100.0% of males and 100.0% of females in these age groups living above the poverty line.
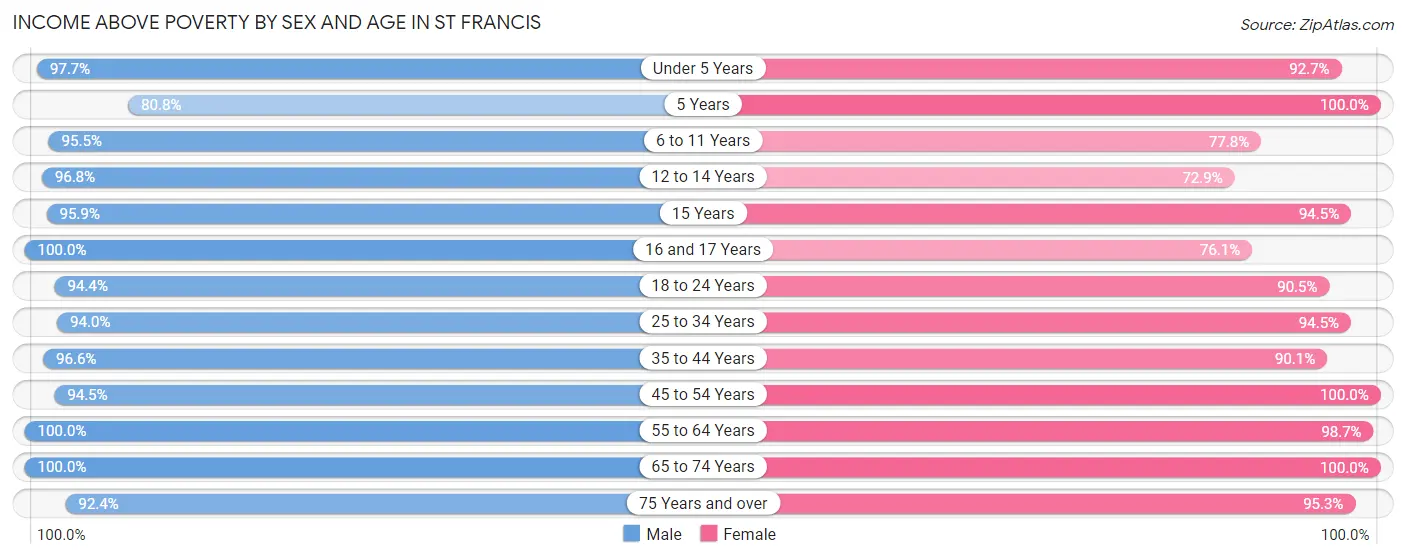
| Age Bracket | Male | Female |
| Under 5 Years | 343 (97.7%) | 204 (92.7%) |
| 5 Years | 42 (80.8%) | 43 (100.0%) |
| 6 to 11 Years | 534 (95.5%) | 277 (77.8%) |
| 12 to 14 Years | 181 (96.8%) | 129 (72.9%) |
| 15 Years | 94 (95.9%) | 86 (94.5%) |
| 16 and 17 Years | 56 (100.0%) | 67 (76.1%) |
| 18 to 24 Years | 289 (94.4%) | 323 (90.5%) |
| 25 to 34 Years | 544 (94.0%) | 532 (94.5%) |
| 35 to 44 Years | 644 (96.6%) | 562 (90.1%) |
| 45 to 54 Years | 547 (94.5%) | 514 (100.0%) |
| 55 to 64 Years | 319 (100.0%) | 448 (98.7%) |
| 65 to 74 Years | 212 (100.0%) | 207 (100.0%) |
| 75 Years and over | 195 (92.4%) | 243 (95.3%) |
| Total | 4,000 (95.8%) | 3,635 (92.0%) |
Income Below Poverty Among Married-Couple Families in St Francis
The poverty statistics for married-couple families in St Francis show that 1.4% or 20 of the total 1,472 families live below the poverty line. Families with 3 or 4 children have the highest poverty rate of 9.9%, comprising of 20 families. On the other hand, families with no children have the lowest poverty rate of 0.0%, which includes 0 families.
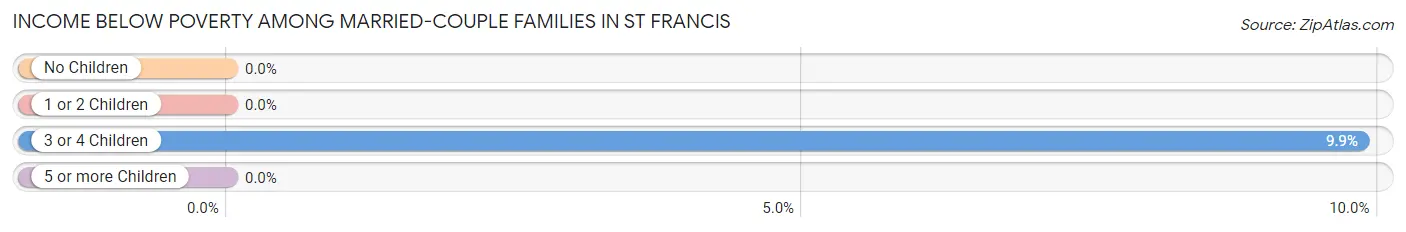
| Children | Above Poverty | Below Poverty |
| No Children | 667 (100.0%) | 0 (0.0%) |
| 1 or 2 Children | 585 (100.0%) | 0 (0.0%) |
| 3 or 4 Children | 183 (90.1%) | 20 (9.9%) |
| 5 or more Children | 17 (100.0%) | 0 (0.0%) |
| Total | 1,452 (98.6%) | 20 (1.4%) |
Income Below Poverty Among Single-Parent Households in St Francis
According to the poverty data in St Francis, 11.5% or 33 single-father households and 14.0% or 48 single-mother households are living below the poverty line. Among single-father households, those with no children have the highest poverty rate, with 17 households (13.9%) experiencing poverty. Likewise, among single-mother households, those with 3 or 4 children have the highest poverty rate, with 30 households (100.0%) falling below the poverty line.
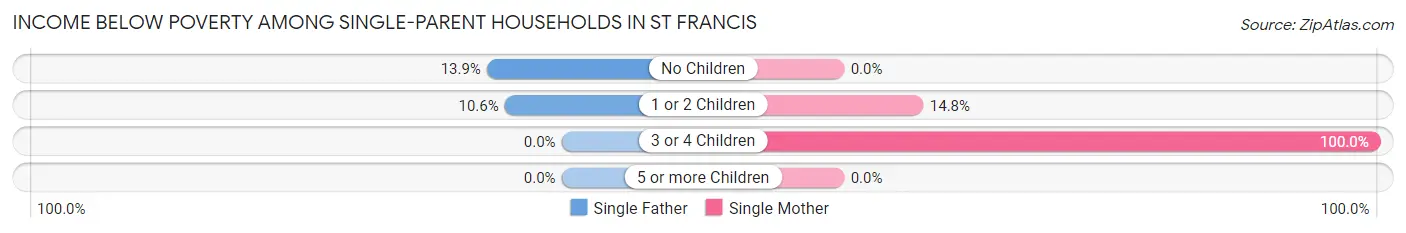
| Children | Single Father | Single Mother |
| No Children | 17 (13.9%) | 0 (0.0%) |
| 1 or 2 Children | 16 (10.6%) | 18 (14.7%) |
| 3 or 4 Children | 0 (0.0%) | 30 (100.0%) |
| 5 or more Children | 0 (0.0%) | 0 (0.0%) |
| Total | 33 (11.5%) | 48 (14.0%) |
Income Below Poverty Among Married-Couple vs Single-Parent Households in St Francis
The poverty data for St Francis shows that 20 of the married-couple family households (1.4%) and 81 of the single-parent households (12.9%) are living below the poverty level. Within the married-couple family households, those with 3 or 4 children have the highest poverty rate, with 20 households (9.9%) falling below the poverty line. Among the single-parent households, those with 3 or 4 children have the highest poverty rate, with 30 household (100.0%) living below poverty.
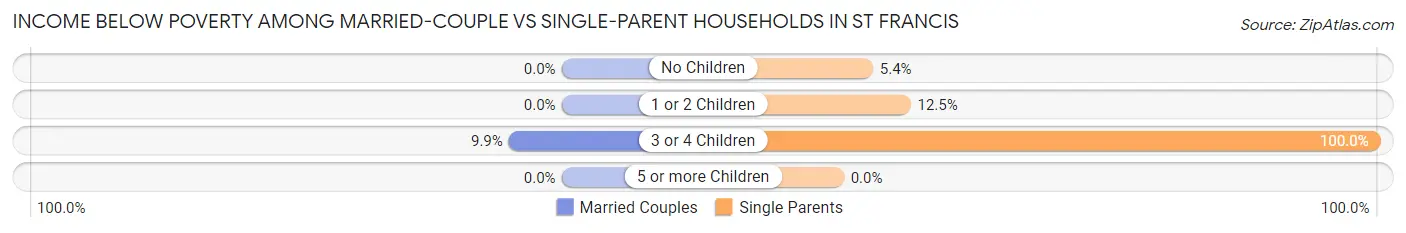
| Children | Married-Couple Families | Single-Parent Households |
| No Children | 0 (0.0%) | 17 (5.4%) |
| 1 or 2 Children | 0 (0.0%) | 34 (12.4%) |
| 3 or 4 Children | 20 (9.9%) | 30 (100.0%) |
| 5 or more Children | 0 (0.0%) | 0 (0.0%) |
| Total | 20 (1.4%) | 81 (12.9%) |
Race in St Francis
The most populous races in St Francis are White / Caucasian (7,674 | 93.6%), Two or more Races (371 | 4.5%), and Hispanic or Latino (262 | 3.2%).
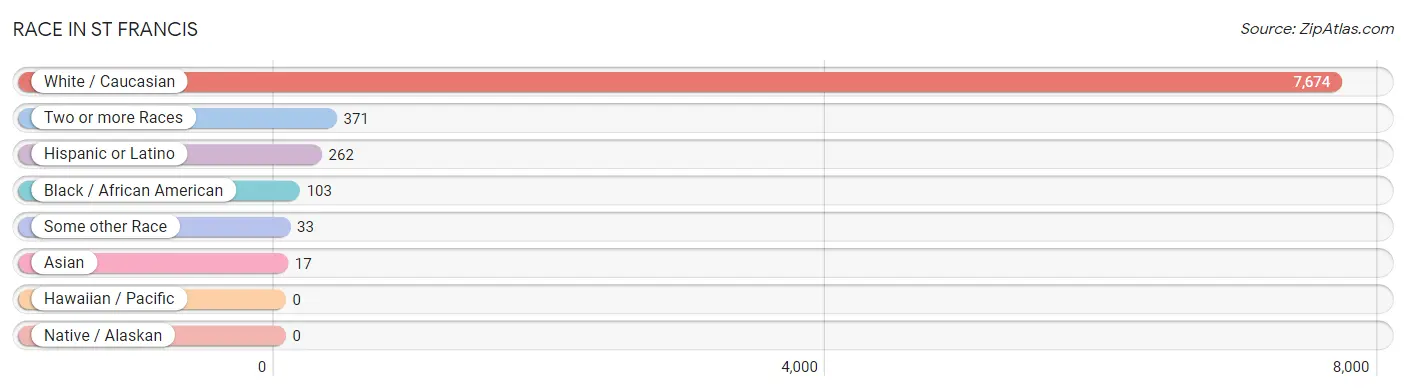
| Race | # Population | % Population |
| Asian | 17 | 0.2% |
| Black / African American | 103 | 1.3% |
| Hawaiian / Pacific | 0 | 0.0% |
| Hispanic or Latino | 262 | 3.2% |
| Native / Alaskan | 0 | 0.0% |
| White / Caucasian | 7,674 | 93.6% |
| Two or more Races | 371 | 4.5% |
| Some other Race | 33 | 0.4% |
| Total | 8,198 | 100.0% |
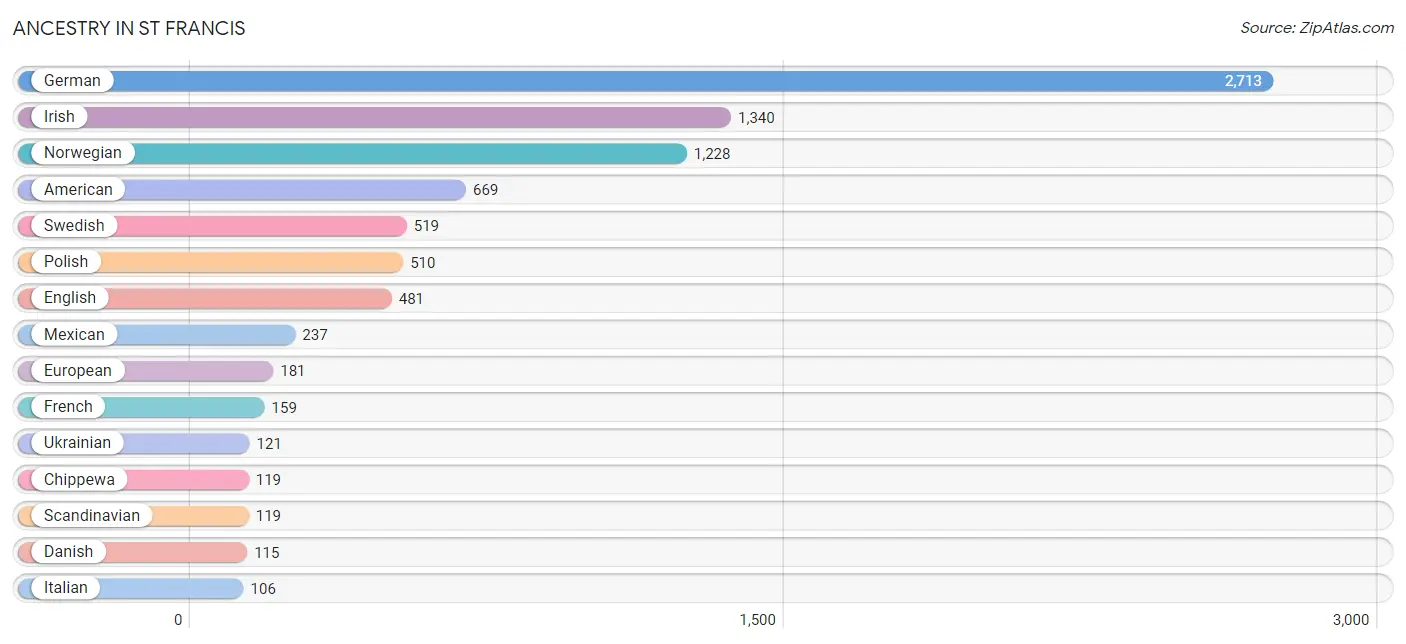
Ancestry in St Francis
The most populous ancestries reported in St Francis are German (2,713 | 33.1%), Irish (1,340 | 16.4%), Norwegian (1,228 | 15.0%), American (669 | 8.2%), and Swedish (519 | 6.3%), together accounting for 78.9% of all St Francis residents.
| Ancestry | # Population | % Population |
| American | 669 | 8.2% |
| Arab | 55 | 0.7% |
| Austrian | 41 | 0.5% |
| Basque | 11 | 0.1% |
| Bhutanese | 8 | 0.1% |
| British | 9 | 0.1% |
| Canadian | 12 | 0.2% |
| Central American | 21 | 0.3% |
| Chippewa | 119 | 1.5% |
| Czech | 57 | 0.7% |
| Czechoslovakian | 10 | 0.1% |
| Danish | 115 | 1.4% |
| Dutch | 78 | 0.9% |
| English | 481 | 5.9% |
| Ethiopian | 2 | 0.0% |
| European | 181 | 2.2% |
| Finnish | 90 | 1.1% |
| French | 159 | 1.9% |
| French Canadian | 98 | 1.2% |
| German | 2,713 | 33.1% |
| Greek | 47 | 0.6% |
| Irish | 1,340 | 16.4% |
| Italian | 106 | 1.3% |
| Korean | 101 | 1.2% |
| Lebanese | 51 | 0.6% |
| Liberian | 17 | 0.2% |
| Luxembourger | 12 | 0.2% |
| Malaysian | 12 | 0.2% |
| Mexican | 237 | 2.9% |
| Nigerian | 9 | 0.1% |
| Northern European | 17 | 0.2% |
| Norwegian | 1,228 | 15.0% |
| Pakistani | 12 | 0.2% |
| Polish | 510 | 6.2% |
| Russian | 13 | 0.2% |
| Salvadoran | 21 | 0.3% |
| Scandinavian | 119 | 1.5% |
| Scotch-Irish | 42 | 0.5% |
| Scottish | 57 | 0.7% |
| Sioux | 27 | 0.3% |
| Slovak | 11 | 0.1% |
| Subsaharan African | 28 | 0.3% |
| Swedish | 519 | 6.3% |
| Swiss | 76 | 0.9% |
| Thai | 10 | 0.1% |
| Ukrainian | 121 | 1.5% |
| Welsh | 51 | 0.6% | View All 47 Rows |
Immigrants in St Francis
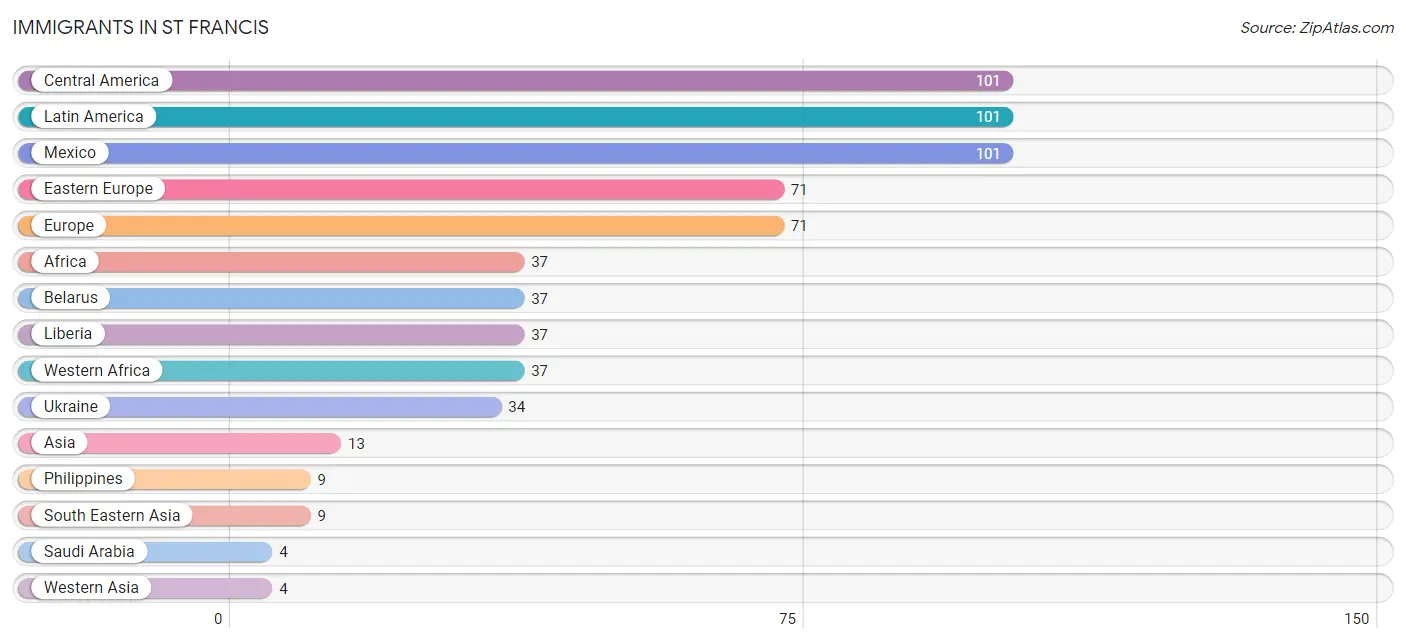
The most numerous immigrant groups reported in St Francis came from Central America (101 | 1.2%), Latin America (101 | 1.2%), Mexico (101 | 1.2%), Eastern Europe (71 | 0.9%), and Europe (71 | 0.9%), together accounting for 5.4% of all St Francis residents.
| Immigration Origin | # Population | % Population |
| Africa | 37 | 0.4% |
| Asia | 13 | 0.2% |
| Belarus | 37 | 0.4% |
| Central America | 101 | 1.2% |
| Eastern Europe | 71 | 0.9% |
| Europe | 71 | 0.9% |
| Latin America | 101 | 1.2% |
| Liberia | 37 | 0.4% |
| Mexico | 101 | 1.2% |
| Philippines | 9 | 0.1% |
| Saudi Arabia | 4 | 0.1% |
| South Eastern Asia | 9 | 0.1% |
| Ukraine | 34 | 0.4% |
| Western Africa | 37 | 0.4% |
| Western Asia | 4 | 0.1% | View All 15 Rows |
Sex and Age in St Francis
Sex and Age in St Francis
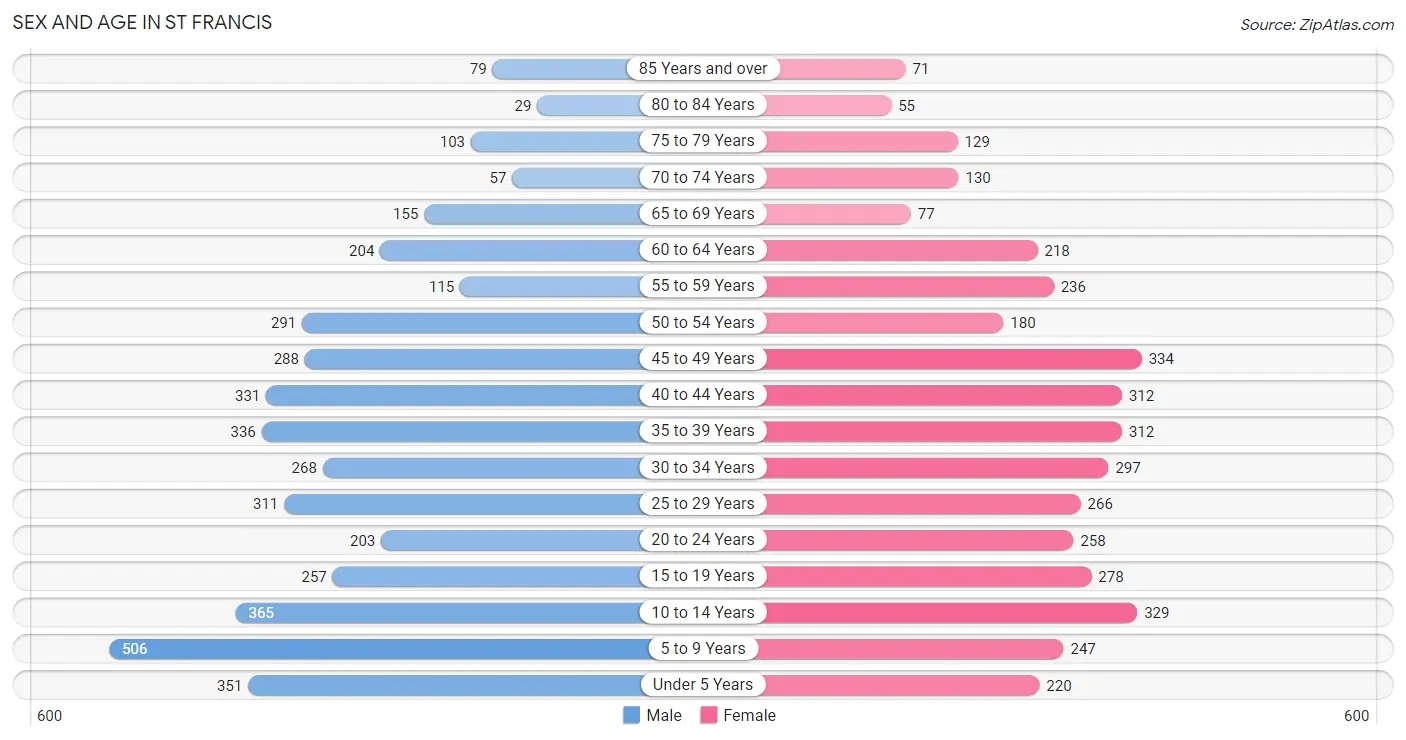
The most populous age groups in St Francis are 5 to 9 Years (506 | 11.9%) for men and 45 to 49 Years (334 | 8.5%) for women.
| Age Bracket | Male | Female |
| Under 5 Years | 351 (8.3%) | 220 (5.6%) |
| 5 to 9 Years | 506 (11.9%) | 247 (6.2%) |
| 10 to 14 Years | 365 (8.6%) | 329 (8.3%) |
| 15 to 19 Years | 257 (6.0%) | 278 (7.0%) |
| 20 to 24 Years | 203 (4.8%) | 258 (6.5%) |
| 25 to 29 Years | 311 (7.3%) | 266 (6.7%) |
| 30 to 34 Years | 268 (6.3%) | 297 (7.5%) |
| 35 to 39 Years | 336 (7.9%) | 312 (7.9%) |
| 40 to 44 Years | 331 (7.8%) | 312 (7.9%) |
| 45 to 49 Years | 288 (6.8%) | 334 (8.5%) |
| 50 to 54 Years | 291 (6.9%) | 180 (4.6%) |
| 55 to 59 Years | 115 (2.7%) | 236 (6.0%) |
| 60 to 64 Years | 204 (4.8%) | 218 (5.5%) |
| 65 to 69 Years | 155 (3.6%) | 77 (1.9%) |
| 70 to 74 Years | 57 (1.3%) | 130 (3.3%) |
| 75 to 79 Years | 103 (2.4%) | 129 (3.3%) |
| 80 to 84 Years | 29 (0.7%) | 55 (1.4%) |
| 85 Years and over | 79 (1.9%) | 71 (1.8%) |
| Total | 4,249 (100.0%) | 3,949 (100.0%) |
Families and Households in St Francis
Median Family Size in St Francis
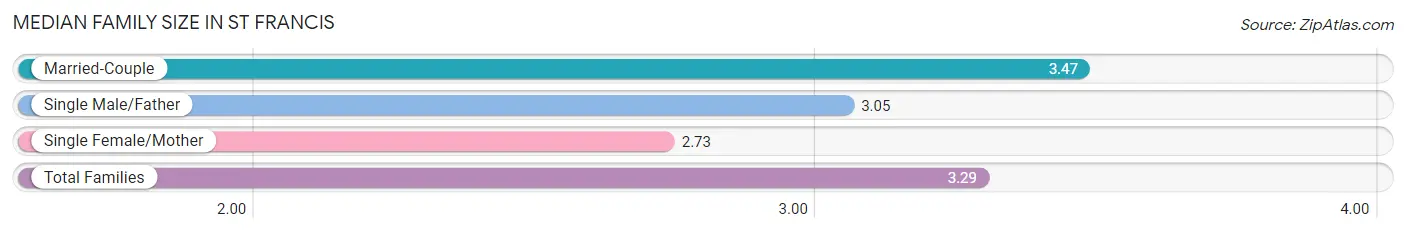
The median family size in St Francis is 3.29 persons per family, with married-couple families (1,472 | 70.0%) accounting for the largest median family size of 3.47 persons per family. On the other hand, single female/mother families (343 | 16.3%) represent the smallest median family size with 2.73 persons per family.
| Family Type | # Families | Family Size |
| Married-Couple | 1,472 (70.0%) | 3.47 |
| Single Male/Father | 287 (13.7%) | 3.05 |
| Single Female/Mother | 343 (16.3%) | 2.73 |
| Total Families | 2,102 (100.0%) | 3.29 |
Median Household Size in St Francis
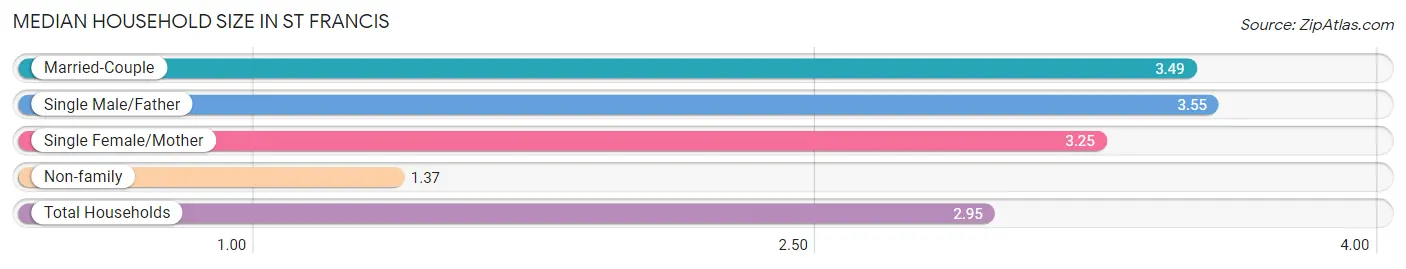
The median household size in St Francis is 2.95 persons per household, with single male/father households (287 | 10.3%) accounting for the largest median household size of 3.55 persons per household. non-family households (678 | 24.4%) represent the smallest median household size with 1.37 persons per household.
| Household Type | # Households | Household Size |
| Married-Couple | 1,472 (52.9%) | 3.49 |
| Single Male/Father | 287 (10.3%) | 3.55 |
| Single Female/Mother | 343 (12.3%) | 3.25 |
| Non-family | 678 (24.4%) | 1.37 |
| Total Households | 2,780 (100.0%) | 2.95 |
Household Size by Marriage Status in St Francis
Out of a total of 2,780 households in St Francis, 2,102 (75.6%) are family households, while 678 (24.4%) are nonfamily households. The most numerous type of family households are 2-person households, comprising 753, and the most common type of nonfamily households are 1-person households, comprising 438.
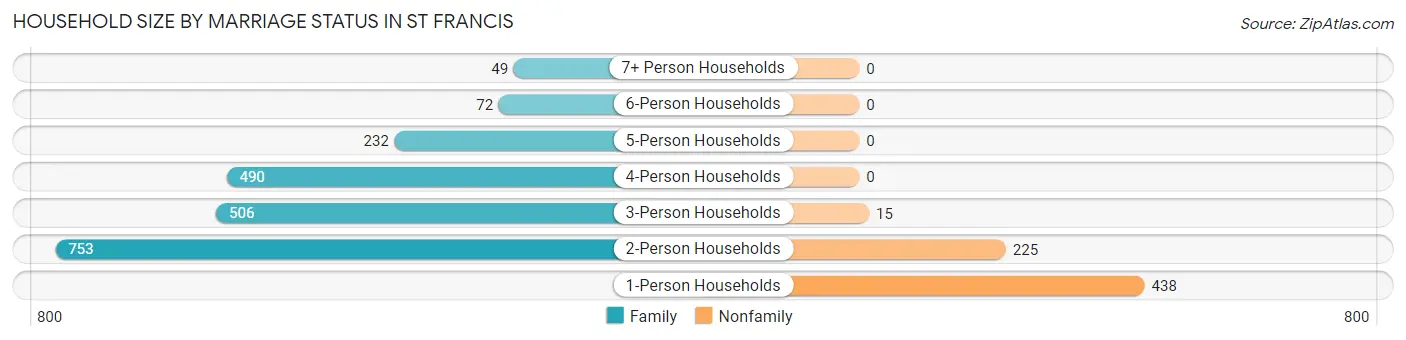
| Household Size | Family Households | Nonfamily Households |
| 1-Person Households | - | 438 (15.8%) |
| 2-Person Households | 753 (27.1%) | 225 (8.1%) |
| 3-Person Households | 506 (18.2%) | 15 (0.5%) |
| 4-Person Households | 490 (17.6%) | 0 (0.0%) |
| 5-Person Households | 232 (8.4%) | 0 (0.0%) |
| 6-Person Households | 72 (2.6%) | 0 (0.0%) |
| 7+ Person Households | 49 (1.8%) | 0 (0.0%) |
| Total | 2,102 (75.6%) | 678 (24.4%) |
Female Fertility in St Francis
Fertility by Age in St Francis
Average fertility rate in St Francis is 62.0 births per 1,000 women. Women in the age bracket of 20 to 34 years have the highest fertility rate with 100.0 births per 1,000 women. Women in the age bracket of 20 to 34 years acount for 61.7% of all women with births.
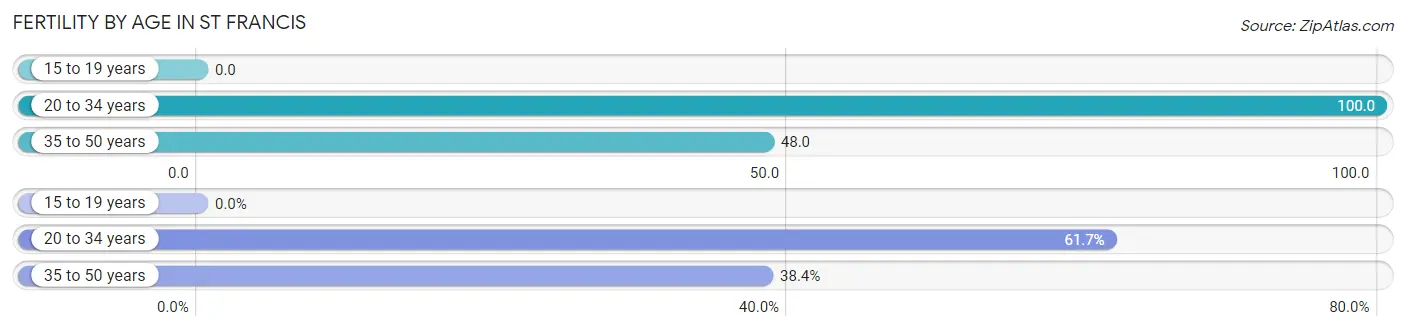
| Age Bracket | Women with Births | Births / 1,000 Women |
| 15 to 19 years | 0 (0.0%) | 0.0 |
| 20 to 34 years | 82 (61.7%) | 100.0 |
| 35 to 50 years | 51 (38.4%) | 48.0 |
| Total | 133 (100.0%) | 62.0 |
Fertility by Age by Marriage Status in St Francis
70.7% of women with births (133) in St Francis are married. The highest percentage of unmarried women with births falls into 35 to 50 years age bracket with 64.7% of them unmarried at the time of birth, while the lowest percentage of unmarried women with births belong to 20 to 34 years age bracket with 7.3% of them unmarried.
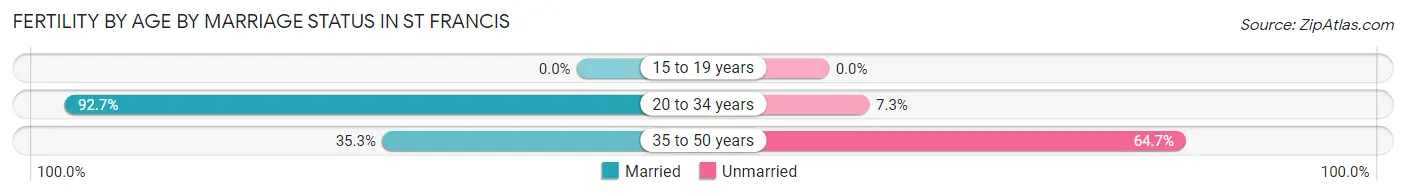
| Age Bracket | Married | Unmarried |
| 15 to 19 years | 0 (0.0%) | 0 (0.0%) |
| 20 to 34 years | 76 (92.7%) | 6 (7.3%) |
| 35 to 50 years | 18 (35.3%) | 33 (64.7%) |
| Total | 94 (70.7%) | 39 (29.3%) |
Fertility by Education in St Francis
Average fertility rate in St Francis is 62.0 births per 1,000 women. Women with the education attainment of bachelor's degree have the highest fertility rate of 151.0 births per 1,000 women, while women with the education attainment of less than high school have the lowest fertility at 20.0 births per 1,000 women. Women with the education attainment of college or associate's degree represent 50.4% of all women with births.
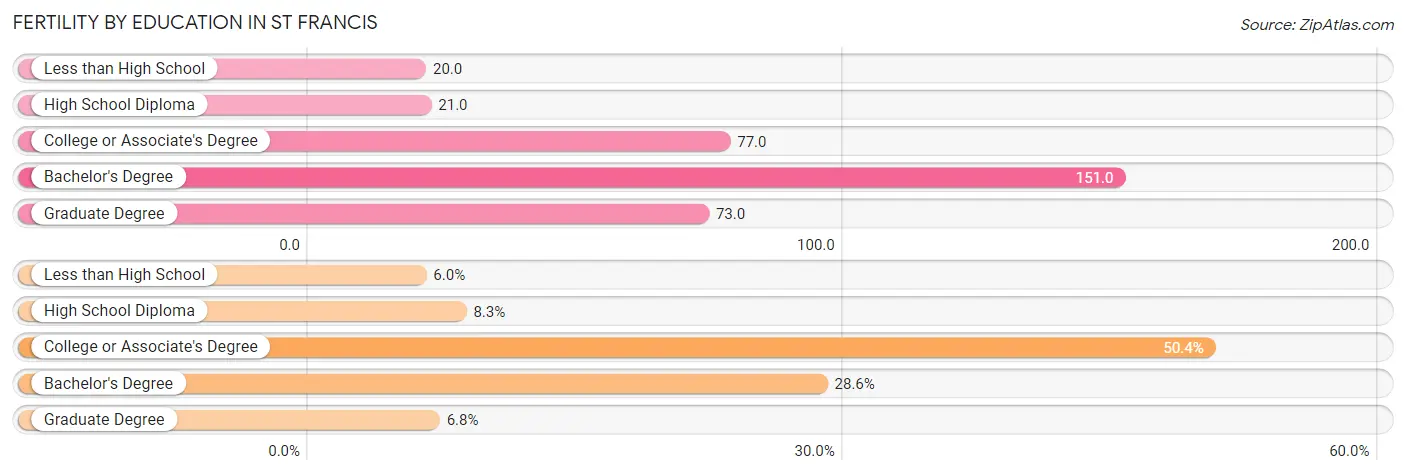
| Educational Attainment | Women with Births | Births / 1,000 Women |
| Less than High School | 8 (6.0%) | 20.0 |
| High School Diploma | 11 (8.3%) | 21.0 |
| College or Associate's Degree | 67 (50.4%) | 77.0 |
| Bachelor's Degree | 38 (28.6%) | 151.0 |
| Graduate Degree | 9 (6.8%) | 73.0 |
| Total | 133 (100.0%) | 62.0 |
Fertility by Education by Marriage Status in St Francis
29.3% of women with births in St Francis are unmarried. Women with the educational attainment of less than high school are most likely to be married with 100.0% of them married at childbirth, while women with the educational attainment of college or associate's degree are least likely to be married with 58.2% of them unmarried at childbirth.
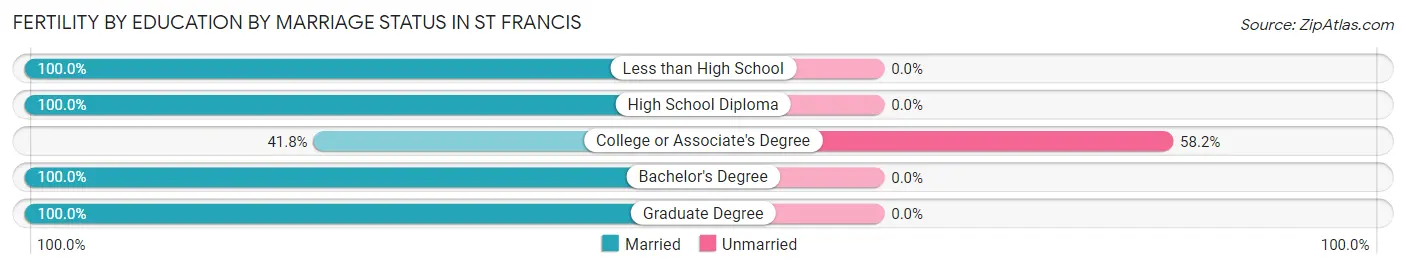
| Educational Attainment | Married | Unmarried |
| Less than High School | 8 (100.0%) | 0 (0.0%) |
| High School Diploma | 11 (100.0%) | 0 (0.0%) |
| College or Associate's Degree | 28 (41.8%) | 39 (58.2%) |
| Bachelor's Degree | 38 (100.0%) | 0 (0.0%) |
| Graduate Degree | 9 (100.0%) | 0 (0.0%) |
| Total | 94 (70.7%) | 39 (29.3%) |
Employment Characteristics in St Francis
Employment by Class of Employer in St Francis
Among the 4,213 employed individuals in St Francis, private company employees (3,178 | 75.4%), not-for-profit organizations (250 | 5.9%), and self-employed (not incorporated) (238 | 5.7%) make up the most common classes of employment.
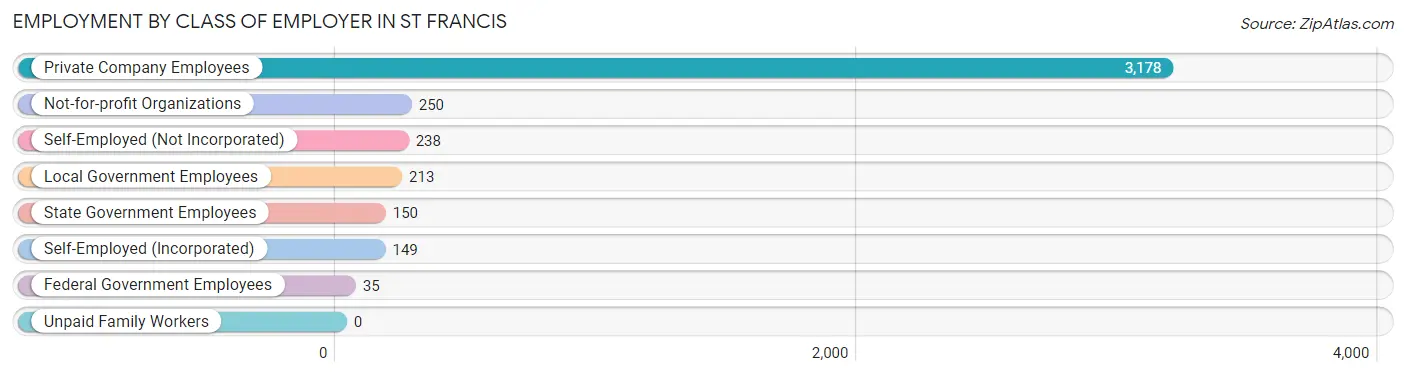
| Employer Class | # Employees | % Employees |
| Private Company Employees | 3,178 | 75.4% |
| Self-Employed (Incorporated) | 149 | 3.5% |
| Self-Employed (Not Incorporated) | 238 | 5.7% |
| Not-for-profit Organizations | 250 | 5.9% |
| Local Government Employees | 213 | 5.1% |
| State Government Employees | 150 | 3.6% |
| Federal Government Employees | 35 | 0.8% |
| Unpaid Family Workers | 0 | 0.0% |
| Total | 4,213 | 100.0% |
Employment Status by Age in St Francis
According to the labor force statistics for St Francis, out of the total population over 16 years of age (5,991), 74.1% or 4,439 individuals are in the labor force, with 2.7% or 120 of them unemployed. The age group with the highest labor force participation rate is 45 to 54 years, with 96.0% or 1,049 individuals in the labor force. Within the labor force, the 20 to 24 years age range has the highest percentage of unemployed individuals, with 13.1% or 57 of them being unemployed.
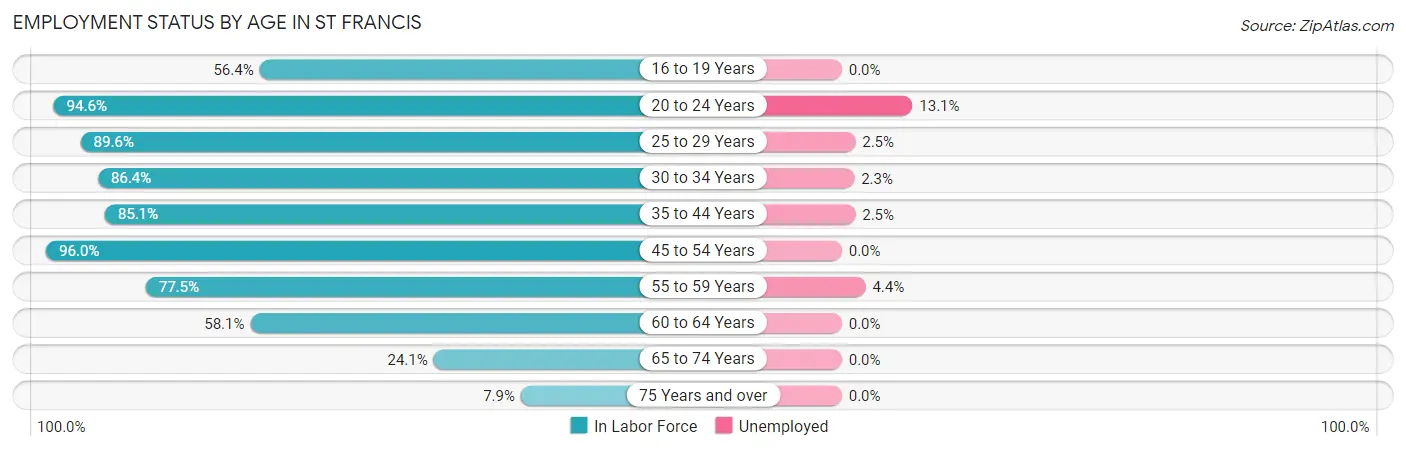
| Age Bracket | In Labor Force | Unemployed |
| 16 to 19 Years | 195 (56.4%) | 0 (0.0%) |
| 20 to 24 Years | 436 (94.6%) | 57 (13.1%) |
| 25 to 29 Years | 517 (89.6%) | 13 (2.5%) |
| 30 to 34 Years | 488 (86.4%) | 11 (2.3%) |
| 35 to 44 Years | 1,099 (85.1%) | 27 (2.5%) |
| 45 to 54 Years | 1,049 (96.0%) | 0 (0.0%) |
| 55 to 59 Years | 272 (77.5%) | 12 (4.4%) |
| 60 to 64 Years | 245 (58.1%) | 0 (0.0%) |
| 65 to 74 Years | 101 (24.1%) | 0 (0.0%) |
| 75 Years and over | 37 (7.9%) | 0 (0.0%) |
| Total | 4,439 (74.1%) | 120 (2.7%) |
Employment Status by Educational Attainment in St Francis
According to labor force statistics for St Francis, 85.4% of individuals (3,671) out of the total population between 25 and 64 years of age (4,299) are in the labor force, with 1.7% or 62 of them being unemployed. The group with the highest labor force participation rate are those with the educational attainment of bachelor's degree or higher, with 91.4% or 656 individuals in the labor force. Within the labor force, individuals with less than high school education have the highest percentage of unemployment, with 9.1% or 24 of them being unemployed.
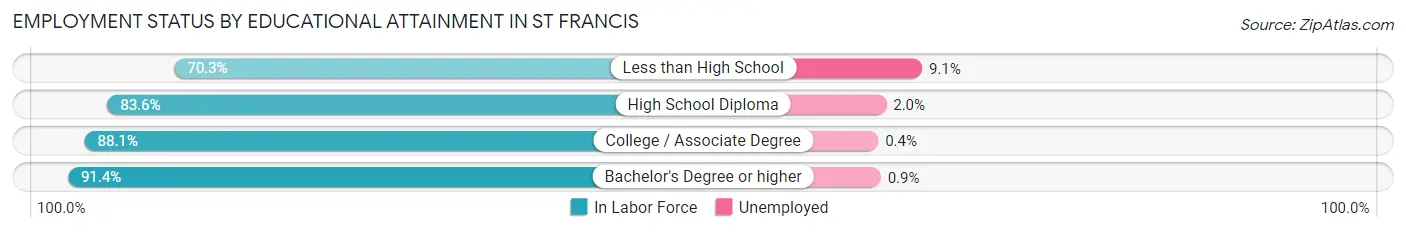
| Educational Attainment | In Labor Force | Unemployed |
| Less than High School | 263 (70.3%) | 34 (9.1%) |
| High School Diploma | 1,358 (83.6%) | 32 (2.0%) |
| College / Associate Degree | 1,394 (88.1%) | 6 (0.4%) |
| Bachelor's Degree or higher | 656 (91.4%) | 6 (0.9%) |
| Total | 3,671 (85.4%) | 73 (1.7%) |
Employment Occupations by Sex in St Francis
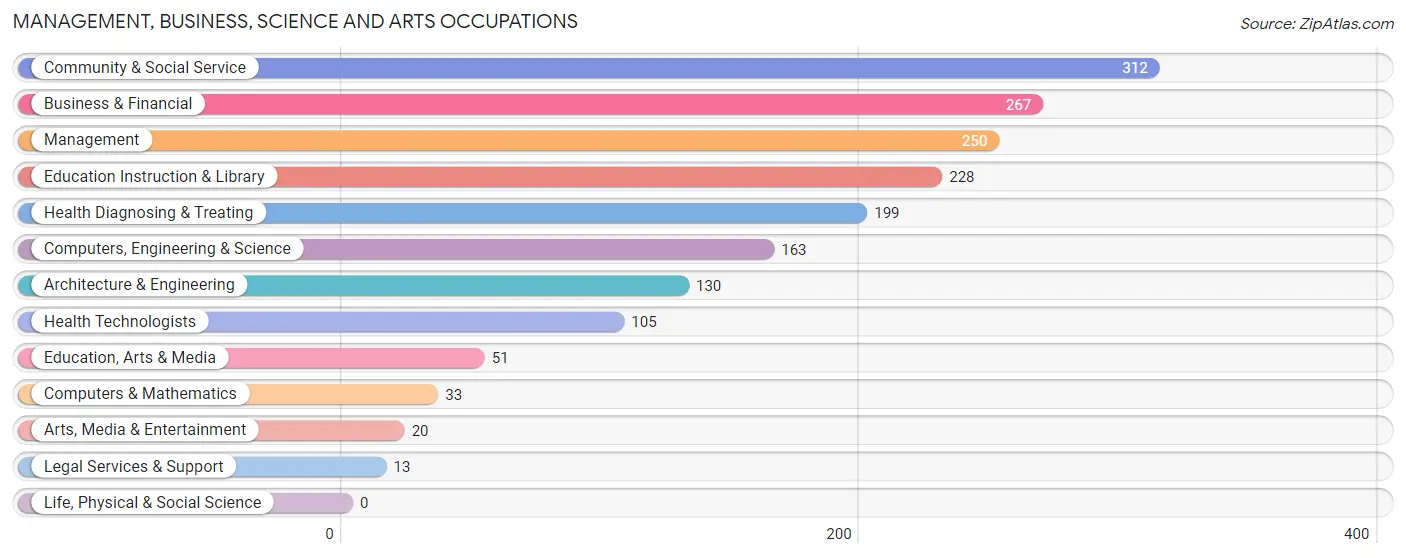
Management, Business, Science and Arts Occupations
The most common Management, Business, Science and Arts occupations in St Francis are Community & Social Service (312 | 7.2%), Business & Financial (267 | 6.2%), Management (250 | 5.8%), Education Instruction & Library (228 | 5.3%), and Health Diagnosing & Treating (199 | 4.6%).
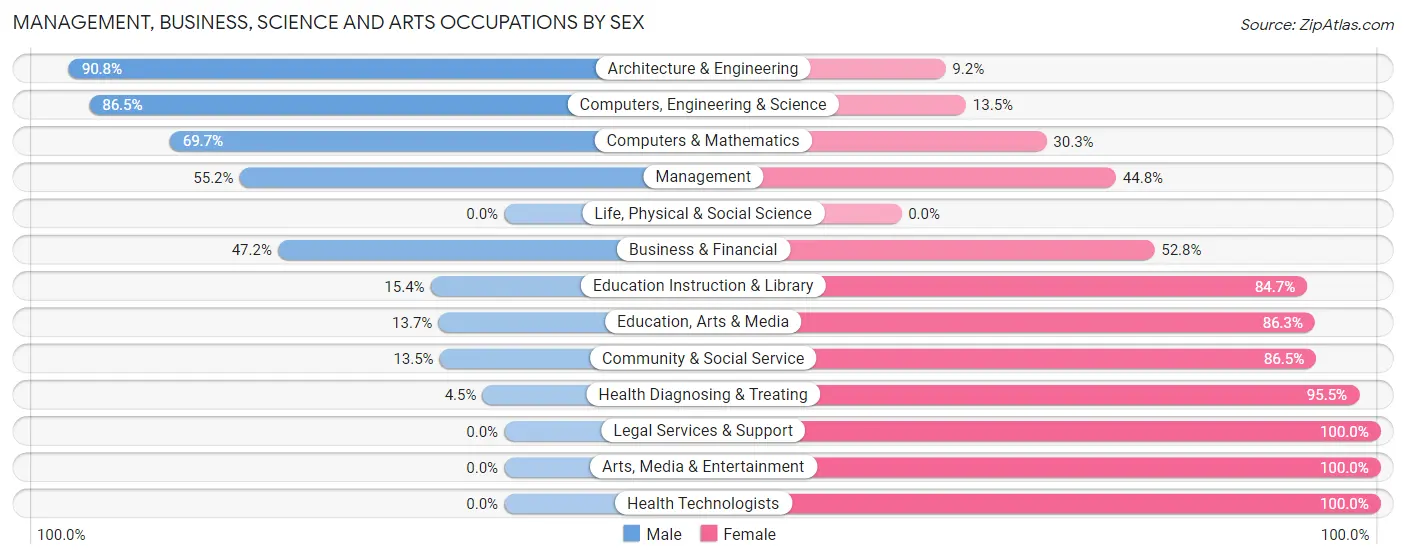
Management, Business, Science and Arts Occupations by Sex
Within the Management, Business, Science and Arts occupations in St Francis, the most male-oriented occupations are Architecture & Engineering (90.8%), Computers, Engineering & Science (86.5%), and Computers & Mathematics (69.7%), while the most female-oriented occupations are Legal Services & Support (100.0%), Arts, Media & Entertainment (100.0%), and Health Technologists (100.0%).
| Occupation | Male | Female |
| Management | 138 (55.2%) | 112 (44.8%) |
| Business & Financial | 126 (47.2%) | 141 (52.8%) |
| Computers, Engineering & Science | 141 (86.5%) | 22 (13.5%) |
| Computers & Mathematics | 23 (69.7%) | 10 (30.3%) |
| Architecture & Engineering | 118 (90.8%) | 12 (9.2%) |
| Life, Physical & Social Science | 0 (0.0%) | 0 (0.0%) |
| Community & Social Service | 42 (13.5%) | 270 (86.5%) |
| Education, Arts & Media | 7 (13.7%) | 44 (86.3%) |
| Legal Services & Support | 0 (0.0%) | 13 (100.0%) |
| Education Instruction & Library | 35 (15.3%) | 193 (84.7%) |
| Arts, Media & Entertainment | 0 (0.0%) | 20 (100.0%) |
| Health Diagnosing & Treating | 9 (4.5%) | 190 (95.5%) |
| Health Technologists | 0 (0.0%) | 105 (100.0%) |
| Total (Category) | 456 (38.3%) | 735 (61.7%) |
| Total (Overall) | 2,218 (51.3%) | 2,101 (48.6%) |
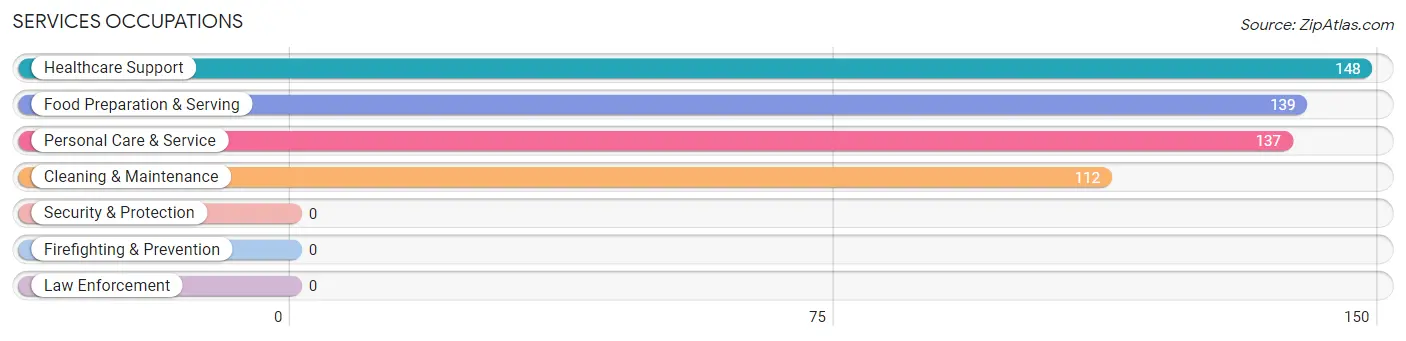
Services Occupations
The most common Services occupations in St Francis are Healthcare Support (148 | 3.4%), Food Preparation & Serving (139 | 3.2%), Personal Care & Service (137 | 3.2%), and Cleaning & Maintenance (112 | 2.6%).
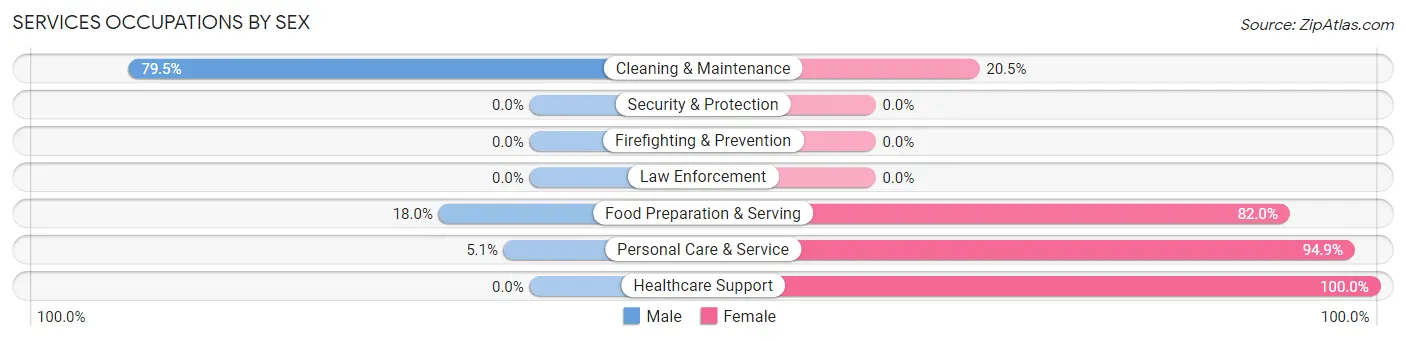
Services Occupations by Sex
Within the Services occupations in St Francis, the most male-oriented occupations are Cleaning & Maintenance (79.5%), Food Preparation & Serving (18.0%), and Personal Care & Service (5.1%), while the most female-oriented occupations are Healthcare Support (100.0%), Personal Care & Service (94.9%), and Food Preparation & Serving (82.0%).
| Occupation | Male | Female |
| Healthcare Support | 0 (0.0%) | 148 (100.0%) |
| Security & Protection | 0 (0.0%) | 0 (0.0%) |
| Firefighting & Prevention | 0 (0.0%) | 0 (0.0%) |
| Law Enforcement | 0 (0.0%) | 0 (0.0%) |
| Food Preparation & Serving | 25 (18.0%) | 114 (82.0%) |
| Cleaning & Maintenance | 89 (79.5%) | 23 (20.5%) |
| Personal Care & Service | 7 (5.1%) | 130 (94.9%) |
| Total (Category) | 121 (22.6%) | 415 (77.4%) |
| Total (Overall) | 2,218 (51.3%) | 2,101 (48.6%) |
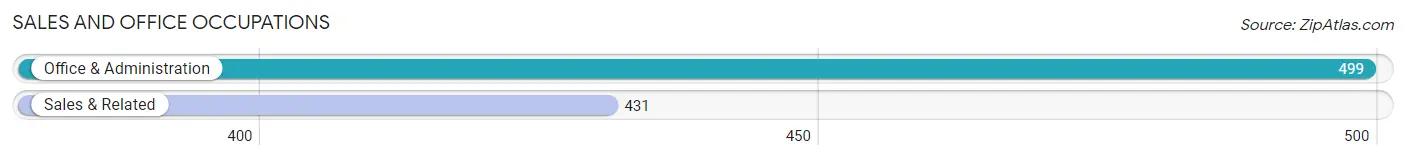
Sales and Office Occupations
The most common Sales and Office occupations in St Francis are Office & Administration (499 | 11.6%), and Sales & Related (431 | 10.0%).
Sales and Office Occupations by Sex
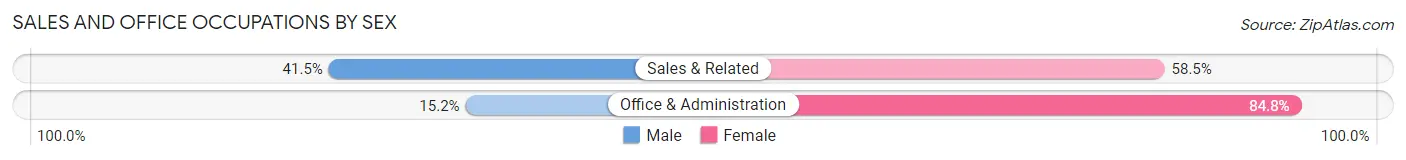
| Occupation | Male | Female |
| Sales & Related | 179 (41.5%) | 252 (58.5%) |
| Office & Administration | 76 (15.2%) | 423 (84.8%) |
| Total (Category) | 255 (27.4%) | 675 (72.6%) |
| Total (Overall) | 2,218 (51.3%) | 2,101 (48.6%) |
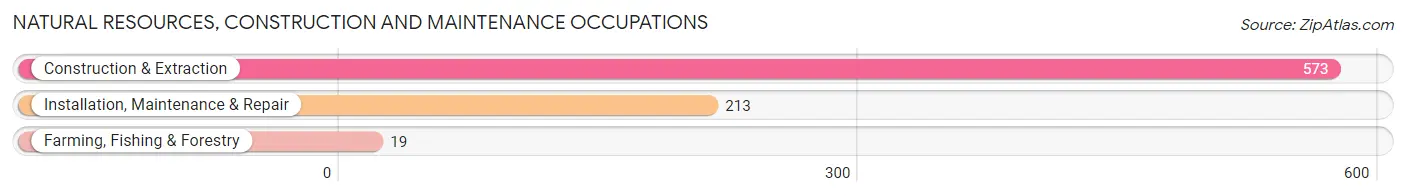
Natural Resources, Construction and Maintenance Occupations
The most common Natural Resources, Construction and Maintenance occupations in St Francis are Construction & Extraction (573 | 13.3%), Installation, Maintenance & Repair (213 | 4.9%), and Farming, Fishing & Forestry (19 | 0.4%).
Natural Resources, Construction and Maintenance Occupations by Sex
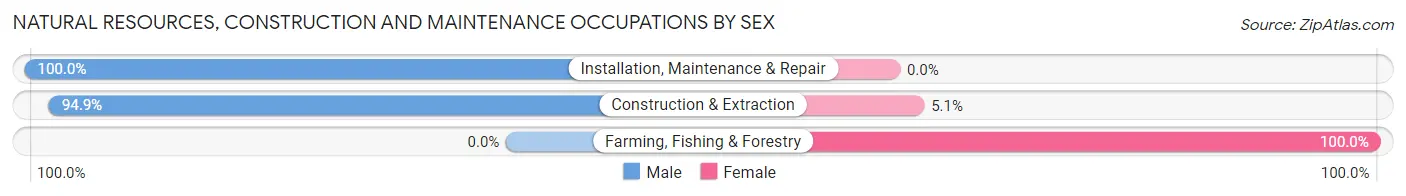
| Occupation | Male | Female |
| Farming, Fishing & Forestry | 0 (0.0%) | 19 (100.0%) |
| Construction & Extraction | 544 (94.9%) | 29 (5.1%) |
| Installation, Maintenance & Repair | 213 (100.0%) | 0 (0.0%) |
| Total (Category) | 757 (94.0%) | 48 (6.0%) |
| Total (Overall) | 2,218 (51.3%) | 2,101 (48.6%) |
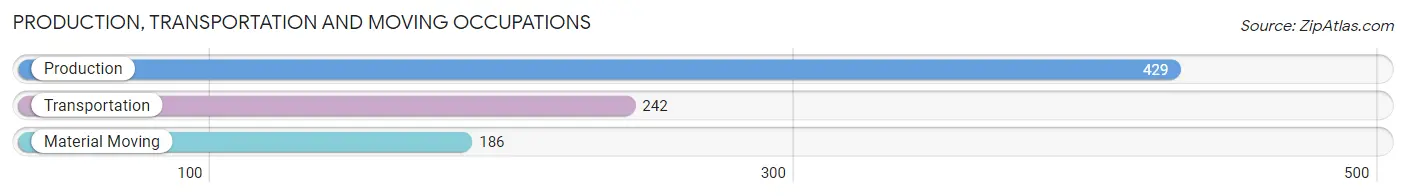
Production, Transportation and Moving Occupations
The most common Production, Transportation and Moving occupations in St Francis are Production (429 | 9.9%), Transportation (242 | 5.6%), and Material Moving (186 | 4.3%).
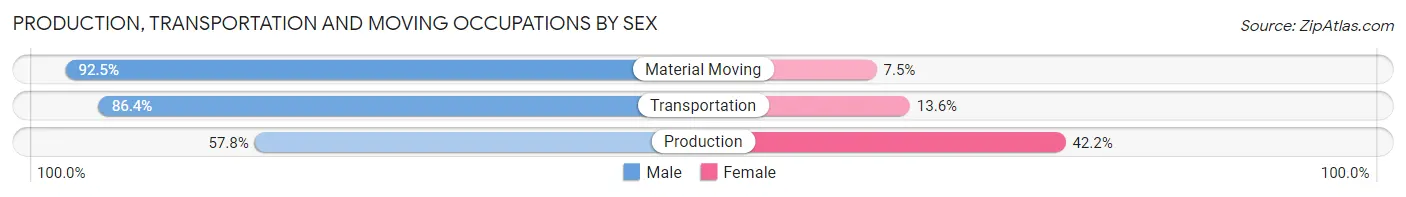
Production, Transportation and Moving Occupations by Sex
| Occupation | Male | Female |
| Production | 248 (57.8%) | 181 (42.2%) |
| Transportation | 209 (86.4%) | 33 (13.6%) |
| Material Moving | 172 (92.5%) | 14 (7.5%) |
| Total (Category) | 629 (73.4%) | 228 (26.6%) |
| Total (Overall) | 2,218 (51.3%) | 2,101 (48.6%) |
Employment Industries by Sex in St Francis
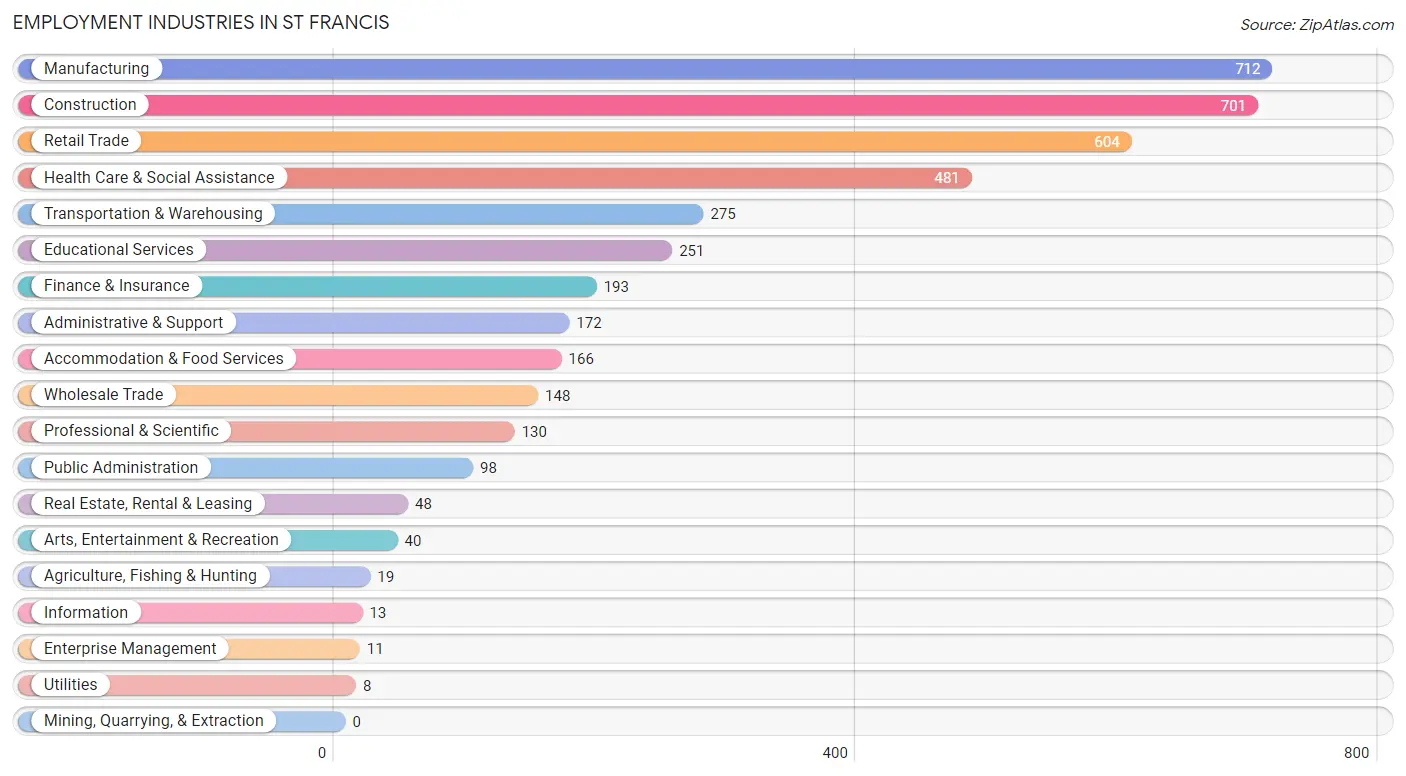
Employment Industries in St Francis
The major employment industries in St Francis include Manufacturing (712 | 16.5%), Construction (701 | 16.2%), Retail Trade (604 | 14.0%), Health Care & Social Assistance (481 | 11.1%), and Transportation & Warehousing (275 | 6.4%).
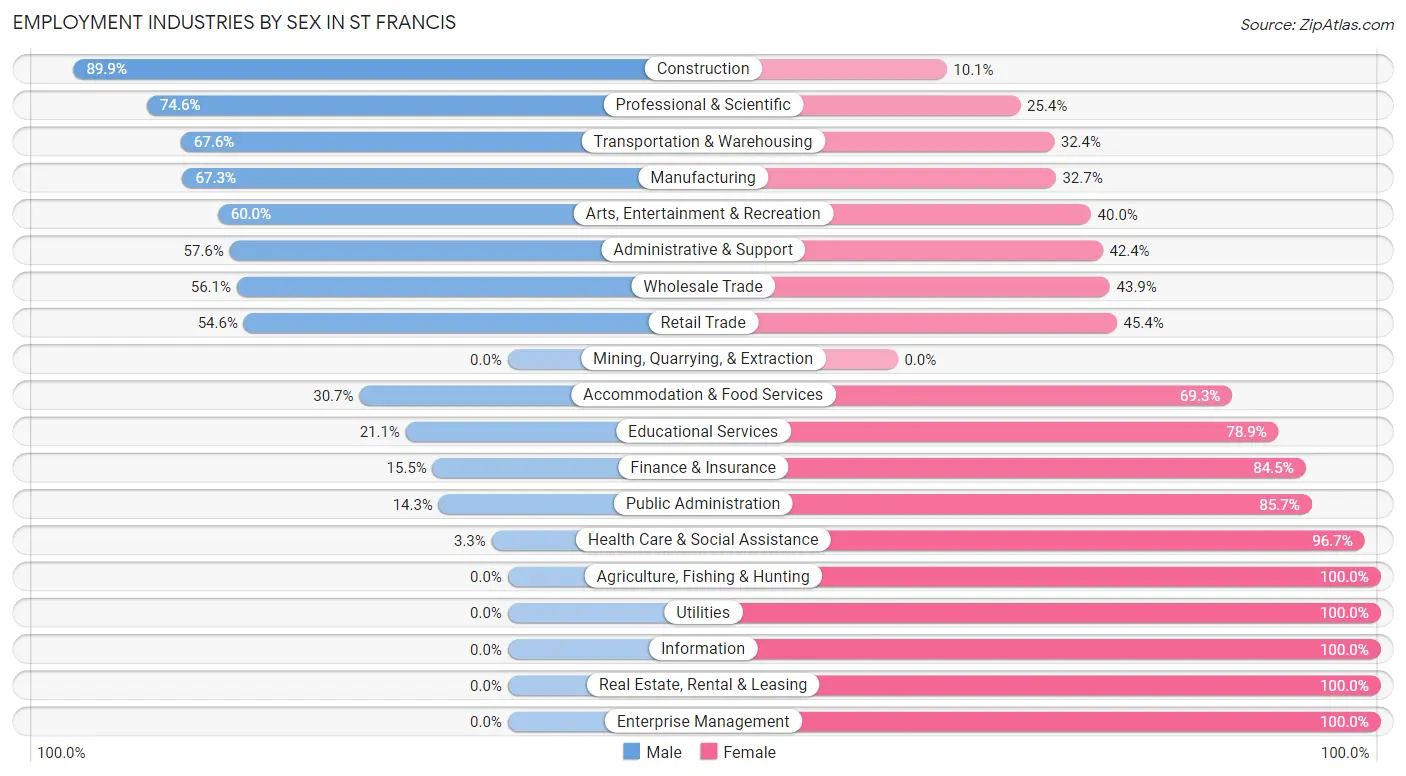
Employment Industries by Sex in St Francis
The St Francis industries that see more men than women are Construction (89.9%), Professional & Scientific (74.6%), and Transportation & Warehousing (67.6%), whereas the industries that tend to have a higher number of women are Agriculture, Fishing & Hunting (100.0%), Utilities (100.0%), and Information (100.0%).
| Industry | Male | Female |
| Agriculture, Fishing & Hunting | 0 (0.0%) | 19 (100.0%) |
| Mining, Quarrying, & Extraction | 0 (0.0%) | 0 (0.0%) |
| Construction | 630 (89.9%) | 71 (10.1%) |
| Manufacturing | 479 (67.3%) | 233 (32.7%) |
| Wholesale Trade | 83 (56.1%) | 65 (43.9%) |
| Retail Trade | 330 (54.6%) | 274 (45.4%) |
| Transportation & Warehousing | 186 (67.6%) | 89 (32.4%) |
| Utilities | 0 (0.0%) | 8 (100.0%) |
| Information | 0 (0.0%) | 13 (100.0%) |
| Finance & Insurance | 30 (15.5%) | 163 (84.5%) |
| Real Estate, Rental & Leasing | 0 (0.0%) | 48 (100.0%) |
| Professional & Scientific | 97 (74.6%) | 33 (25.4%) |
| Enterprise Management | 0 (0.0%) | 11 (100.0%) |
| Administrative & Support | 99 (57.6%) | 73 (42.4%) |
| Educational Services | 53 (21.1%) | 198 (78.9%) |
| Health Care & Social Assistance | 16 (3.3%) | 465 (96.7%) |
| Arts, Entertainment & Recreation | 24 (60.0%) | 16 (40.0%) |
| Accommodation & Food Services | 51 (30.7%) | 115 (69.3%) |
| Public Administration | 14 (14.3%) | 84 (85.7%) |
| Total | 2,218 (51.3%) | 2,101 (48.6%) |
Education in St Francis
School Enrollment in St Francis
The most common levels of schooling among the 2,253 students in St Francis are elementary school (595 | 26.4%), middle school (572 | 25.4%), and high school (479 | 21.3%).
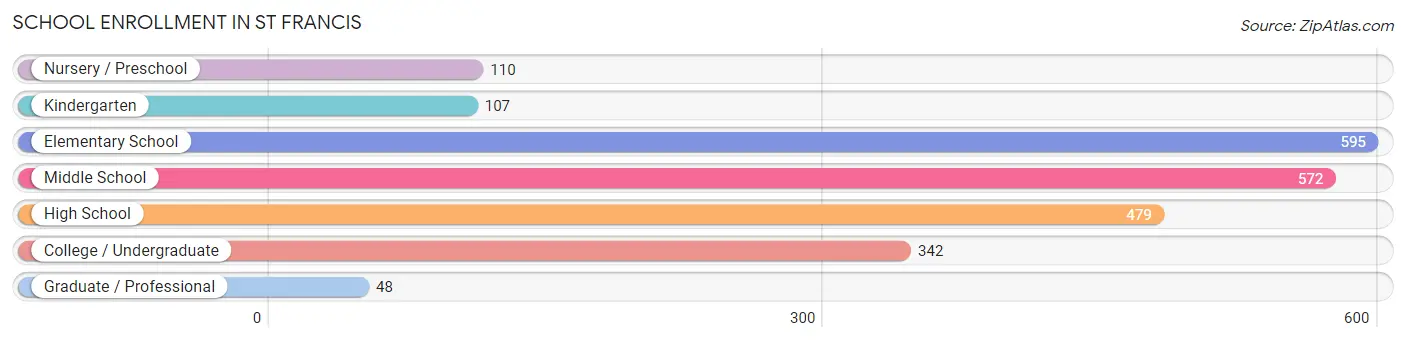
| School Level | # Students | % Students |
| Nursery / Preschool | 110 | 4.9% |
| Kindergarten | 107 | 4.8% |
| Elementary School | 595 | 26.4% |
| Middle School | 572 | 25.4% |
| High School | 479 | 21.3% |
| College / Undergraduate | 342 | 15.2% |
| Graduate / Professional | 48 | 2.1% |
| Total | 2,253 | 100.0% |
School Enrollment by Age by Funding Source in St Francis
Out of a total of 2,253 students who are enrolled in schools in St Francis, 259 (11.5%) attend a private institution, while the remaining 1,994 (88.5%) are enrolled in public schools. The age group of 25 to 34 year olds has the highest likelihood of being enrolled in private schools, with 43 (68.2% in the age bracket) enrolled. Conversely, the age group of 18 to 19 year olds has the lowest likelihood of being enrolled in a private school, with 145 (100.0% in the age bracket) attending a public institution.
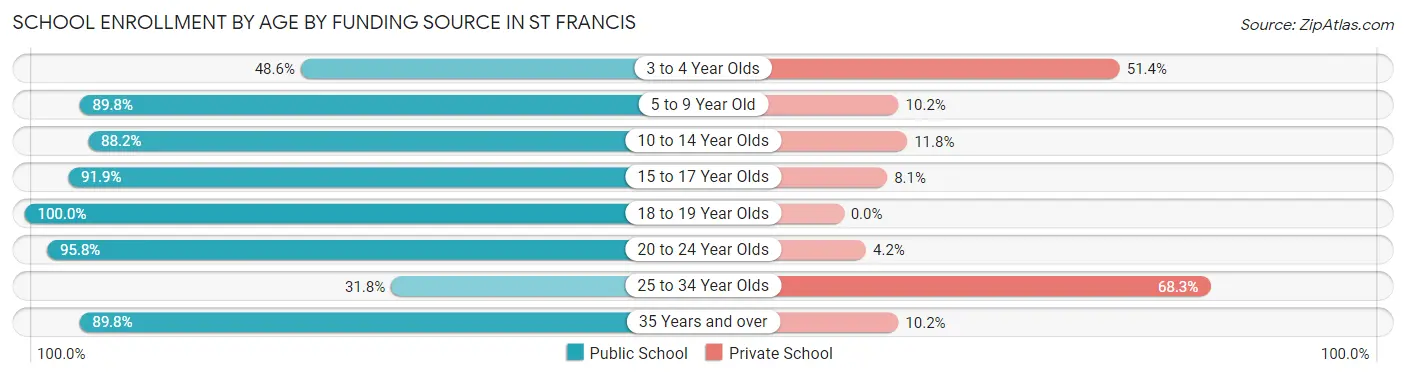
| Age Bracket | Public School | Private School |
| 3 to 4 Year Olds | 17 (48.6%) | 18 (51.4%) |
| 5 to 9 Year Old | 631 (89.8%) | 72 (10.2%) |
| 10 to 14 Year Olds | 603 (88.2%) | 81 (11.8%) |
| 15 to 17 Year Olds | 306 (91.9%) | 27 (8.1%) |
| 18 to 19 Year Olds | 145 (100.0%) | 0 (0.0%) |
| 20 to 24 Year Olds | 184 (95.8%) | 8 (4.2%) |
| 25 to 34 Year Olds | 20 (31.8%) | 43 (68.2%) |
| 35 Years and over | 88 (89.8%) | 10 (10.2%) |
| Total | 1,994 (88.5%) | 259 (11.5%) |
Educational Attainment by Field of Study in St Francis
Business (239 | 27.2%), education (186 | 21.2%), engineering (101 | 11.5%), science & technology (101 | 11.5%), and psychology (35 | 4.0%) are the most common fields of study among 878 individuals in St Francis who have obtained a bachelor's degree or higher.
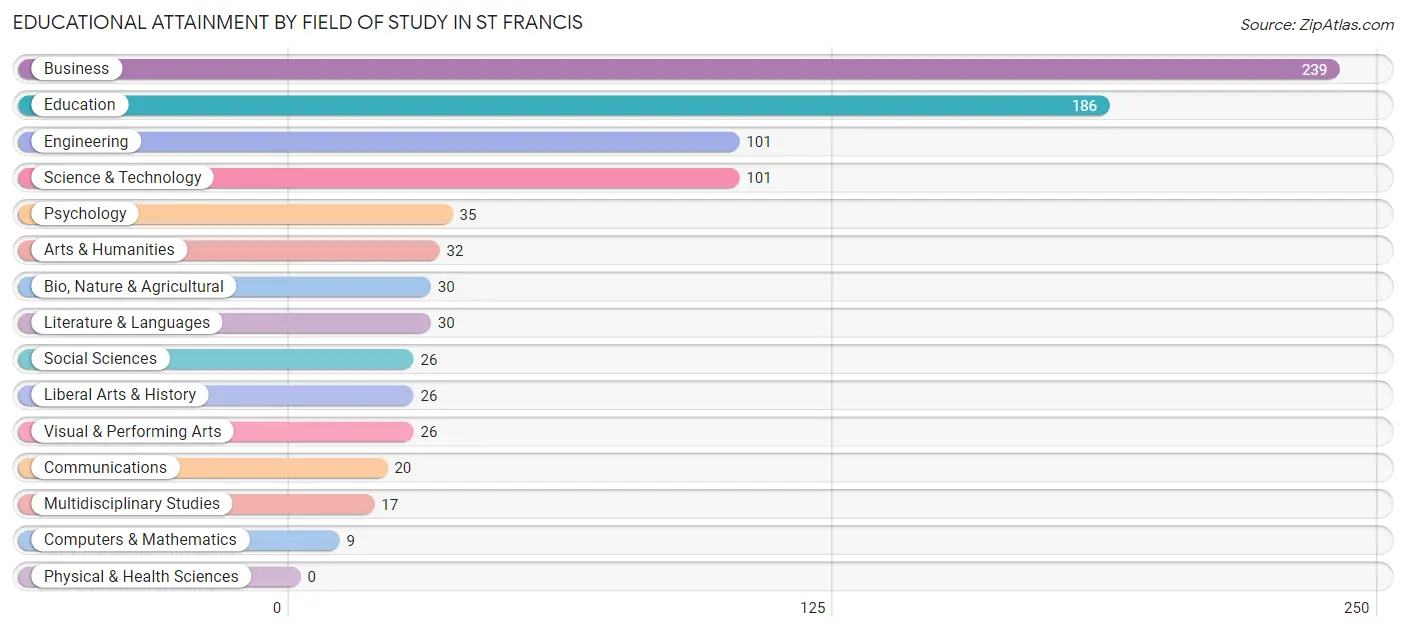
| Field of Study | # Graduates | % Graduates |
| Computers & Mathematics | 9 | 1.0% |
| Bio, Nature & Agricultural | 30 | 3.4% |
| Physical & Health Sciences | 0 | 0.0% |
| Psychology | 35 | 4.0% |
| Social Sciences | 26 | 3.0% |
| Engineering | 101 | 11.5% |
| Multidisciplinary Studies | 17 | 1.9% |
| Science & Technology | 101 | 11.5% |
| Business | 239 | 27.2% |
| Education | 186 | 21.2% |
| Literature & Languages | 30 | 3.4% |
| Liberal Arts & History | 26 | 3.0% |
| Visual & Performing Arts | 26 | 3.0% |
| Communications | 20 | 2.3% |
| Arts & Humanities | 32 | 3.6% |
| Total | 878 | 100.0% |
Transportation & Commute in St Francis
Vehicle Availability by Sex in St Francis
The most prevalent vehicle ownership categories in St Francis are males with 2 vehicles (889, accounting for 41.0%) and females with 2 vehicles (816, making up 43.4%).
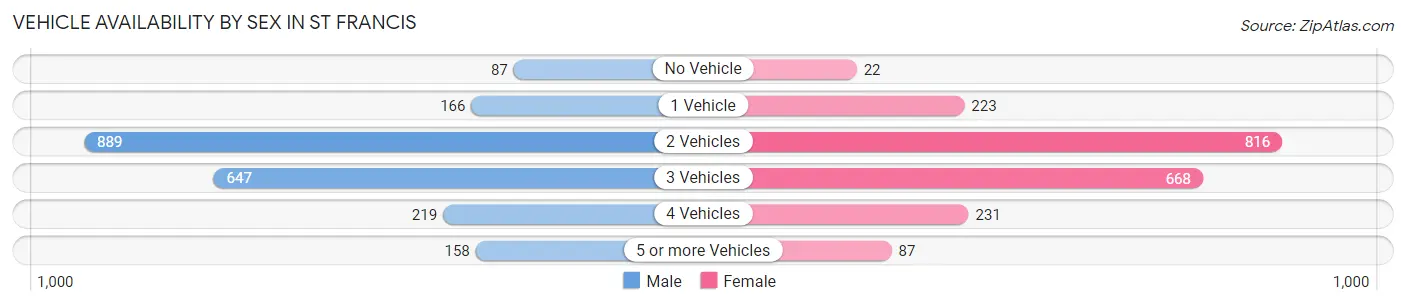
| Vehicles Available | Male | Female |
| No Vehicle | 87 (4.0%) | 22 (1.1%) |
| 1 Vehicle | 166 (7.7%) | 223 (10.9%) |
| 2 Vehicles | 889 (41.0%) | 816 (39.9%) |
| 3 Vehicles | 647 (29.9%) | 668 (32.6%) |
| 4 Vehicles | 219 (10.1%) | 231 (11.3%) |
| 5 or more Vehicles | 158 (7.3%) | 87 (4.3%) |
| Total | 2,166 (100.0%) | 2,047 (100.0%) |
Commute Time in St Francis
The most frequently occuring commute durations in St Francis are 30 to 34 minutes (857 commuters, 22.5%), 45 to 59 minutes (492 commuters, 12.9%), and 20 to 24 minutes (450 commuters, 11.8%).
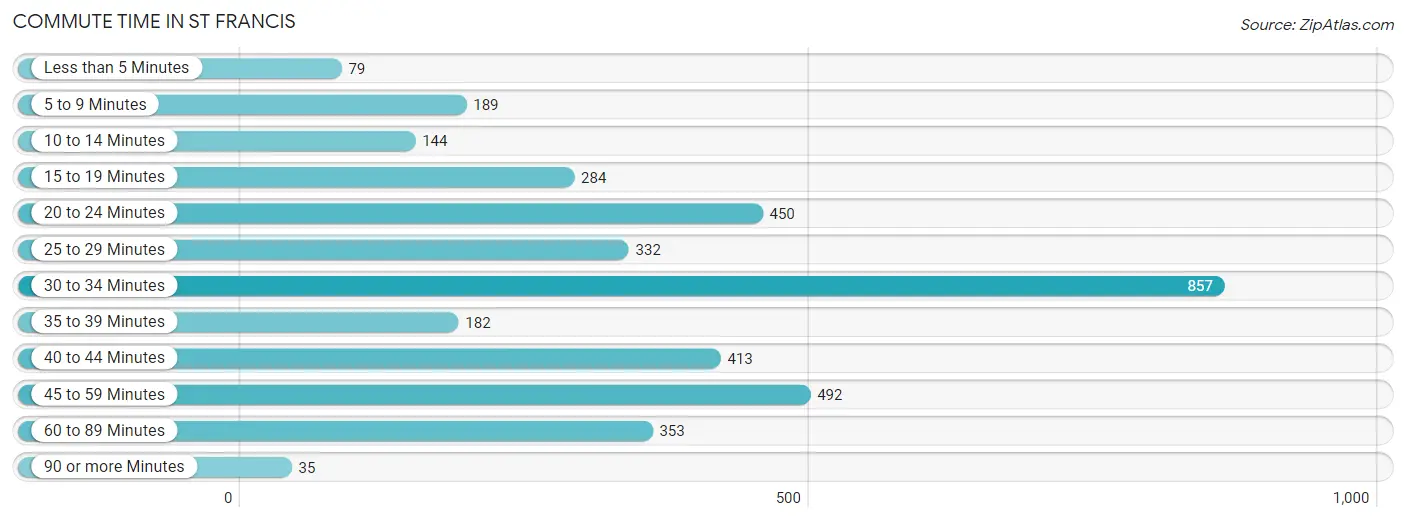
| Commute Time | # Commuters | % Commuters |
| Less than 5 Minutes | 79 | 2.1% |
| 5 to 9 Minutes | 189 | 5.0% |
| 10 to 14 Minutes | 144 | 3.8% |
| 15 to 19 Minutes | 284 | 7.4% |
| 20 to 24 Minutes | 450 | 11.8% |
| 25 to 29 Minutes | 332 | 8.7% |
| 30 to 34 Minutes | 857 | 22.5% |
| 35 to 39 Minutes | 182 | 4.8% |
| 40 to 44 Minutes | 413 | 10.8% |
| 45 to 59 Minutes | 492 | 12.9% |
| 60 to 89 Minutes | 353 | 9.3% |
| 90 or more Minutes | 35 | 0.9% |
Commute Time by Sex in St Francis
The most common commute times in St Francis are 30 to 34 minutes (405 commuters, 20.3%) for males and 30 to 34 minutes (452 commuters, 24.8%) for females.
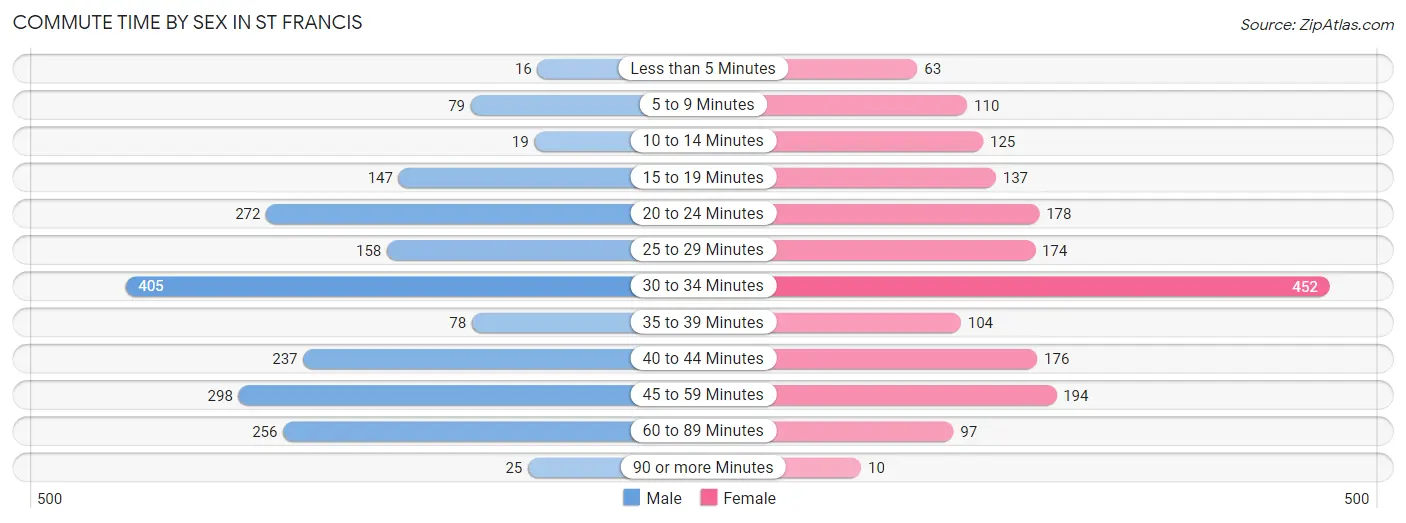
| Commute Time | Male | Female |
| Less than 5 Minutes | 16 (0.8%) | 63 (3.5%) |
| 5 to 9 Minutes | 79 (4.0%) | 110 (6.0%) |
| 10 to 14 Minutes | 19 (0.9%) | 125 (6.9%) |
| 15 to 19 Minutes | 147 (7.4%) | 137 (7.5%) |
| 20 to 24 Minutes | 272 (13.7%) | 178 (9.8%) |
| 25 to 29 Minutes | 158 (7.9%) | 174 (9.6%) |
| 30 to 34 Minutes | 405 (20.3%) | 452 (24.8%) |
| 35 to 39 Minutes | 78 (3.9%) | 104 (5.7%) |
| 40 to 44 Minutes | 237 (11.9%) | 176 (9.7%) |
| 45 to 59 Minutes | 298 (15.0%) | 194 (10.7%) |
| 60 to 89 Minutes | 256 (12.9%) | 97 (5.3%) |
| 90 or more Minutes | 25 (1.3%) | 10 (0.5%) |
Time of Departure to Work by Sex in St Francis
The most frequent times of departure to work in St Francis are 6:00 AM to 6:29 AM (370, 18.6%) for males and 7:00 AM to 7:29 AM (393, 21.6%) for females.
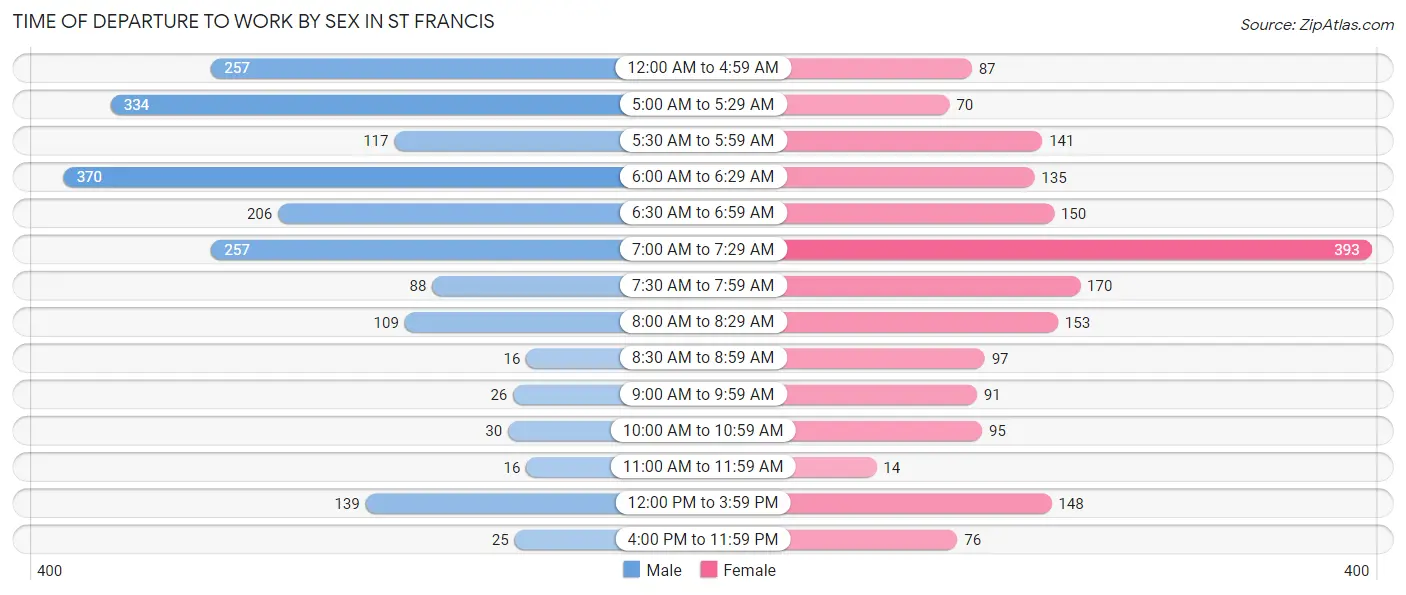
| Time of Departure | Male | Female |
| 12:00 AM to 4:59 AM | 257 (12.9%) | 87 (4.8%) |
| 5:00 AM to 5:29 AM | 334 (16.8%) | 70 (3.8%) |
| 5:30 AM to 5:59 AM | 117 (5.9%) | 141 (7.7%) |
| 6:00 AM to 6:29 AM | 370 (18.6%) | 135 (7.4%) |
| 6:30 AM to 6:59 AM | 206 (10.3%) | 150 (8.2%) |
| 7:00 AM to 7:29 AM | 257 (12.9%) | 393 (21.6%) |
| 7:30 AM to 7:59 AM | 88 (4.4%) | 170 (9.3%) |
| 8:00 AM to 8:29 AM | 109 (5.5%) | 153 (8.4%) |
| 8:30 AM to 8:59 AM | 16 (0.8%) | 97 (5.3%) |
| 9:00 AM to 9:59 AM | 26 (1.3%) | 91 (5.0%) |
| 10:00 AM to 10:59 AM | 30 (1.5%) | 95 (5.2%) |
| 11:00 AM to 11:59 AM | 16 (0.8%) | 14 (0.8%) |
| 12:00 PM to 3:59 PM | 139 (7.0%) | 148 (8.1%) |
| 4:00 PM to 11:59 PM | 25 (1.3%) | 76 (4.2%) |
| Total | 1,990 (100.0%) | 1,820 (100.0%) |
Housing Occupancy in St Francis
Occupancy by Ownership in St Francis
Of the total 2,780 dwellings in St Francis, owner-occupied units account for 2,398 (86.3%), while renter-occupied units make up 382 (13.7%).
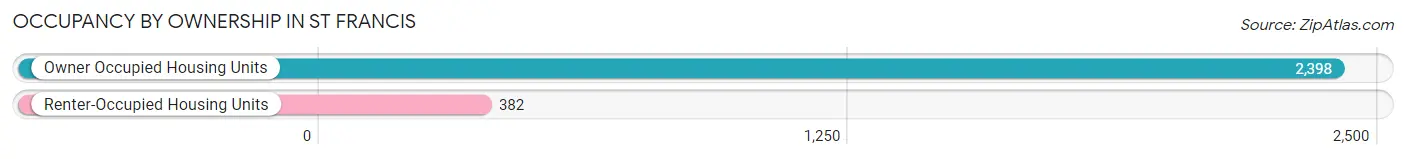
| Occupancy | # Housing Units | % Housing Units |
| Owner Occupied Housing Units | 2,398 | 86.3% |
| Renter-Occupied Housing Units | 382 | 13.7% |
| Total Occupied Housing Units | 2,780 | 100.0% |
Occupancy by Household Size in St Francis
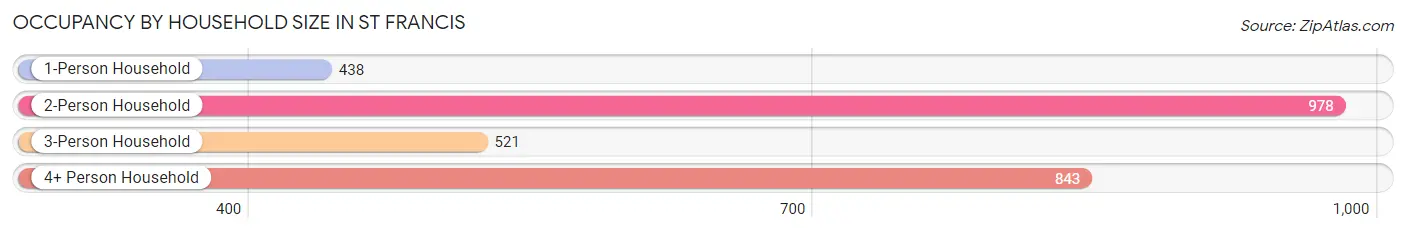
| Household Size | # Housing Units | % Housing Units |
| 1-Person Household | 438 | 15.8% |
| 2-Person Household | 978 | 35.2% |
| 3-Person Household | 521 | 18.7% |
| 4+ Person Household | 843 | 30.3% |
| Total Housing Units | 2,780 | 100.0% |
Occupancy by Ownership by Household Size in St Francis
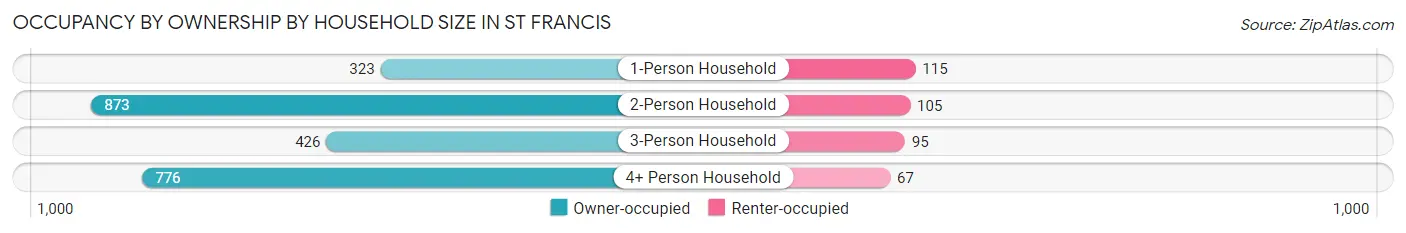
| Household Size | Owner-occupied | Renter-occupied |
| 1-Person Household | 323 (73.7%) | 115 (26.3%) |
| 2-Person Household | 873 (89.3%) | 105 (10.7%) |
| 3-Person Household | 426 (81.8%) | 95 (18.2%) |
| 4+ Person Household | 776 (92.0%) | 67 (8.0%) |
| Total Housing Units | 2,398 (86.3%) | 382 (13.7%) |
Occupancy by Educational Attainment in St Francis
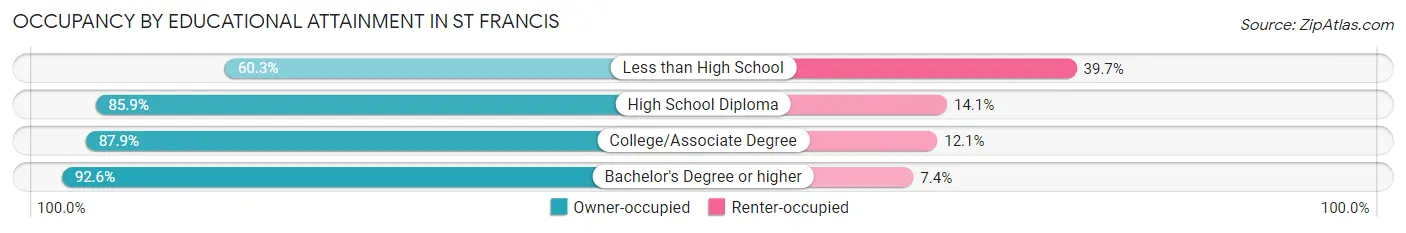
| Household Size | Owner-occupied | Renter-occupied |
| Less than High School | 94 (60.3%) | 62 (39.7%) |
| High School Diploma | 972 (85.9%) | 159 (14.1%) |
| College/Associate Degree | 943 (87.9%) | 130 (12.1%) |
| Bachelor's Degree or higher | 389 (92.6%) | 31 (7.4%) |
Occupancy by Age of Householder in St Francis
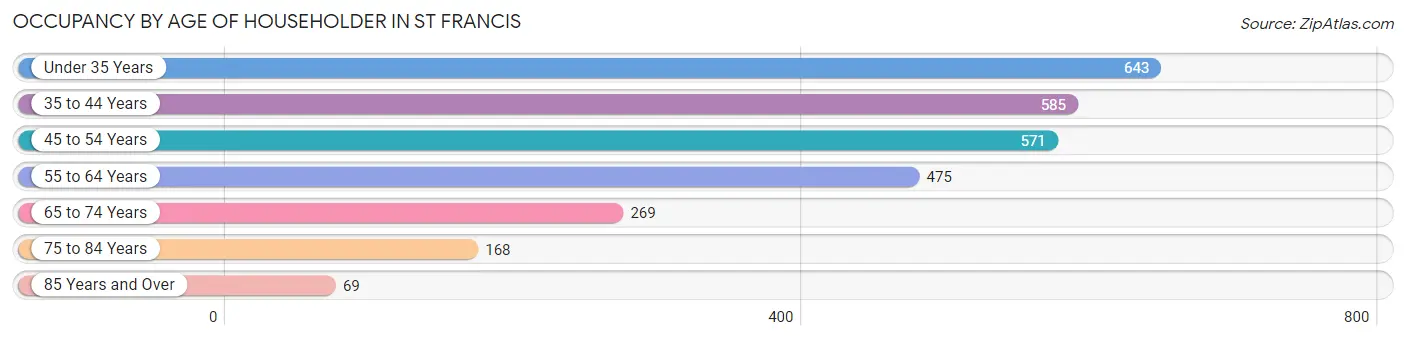
| Age Bracket | # Households | % Households |
| Under 35 Years | 643 | 23.1% |
| 35 to 44 Years | 585 | 21.0% |
| 45 to 54 Years | 571 | 20.5% |
| 55 to 64 Years | 475 | 17.1% |
| 65 to 74 Years | 269 | 9.7% |
| 75 to 84 Years | 168 | 6.0% |
| 85 Years and Over | 69 | 2.5% |
| Total | 2,780 | 100.0% |
Housing Finances in St Francis
Median Income by Occupancy in St Francis
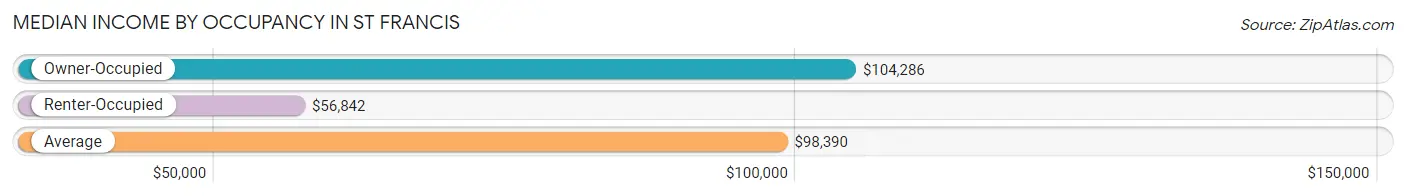
| Occupancy Type | # Households | Median Income |
| Owner-Occupied | 2,398 (86.3%) | $104,286 |
| Renter-Occupied | 382 (13.7%) | $56,842 |
| Average | 2,780 (100.0%) | $98,390 |
Occupancy by Householder Income Bracket in St Francis
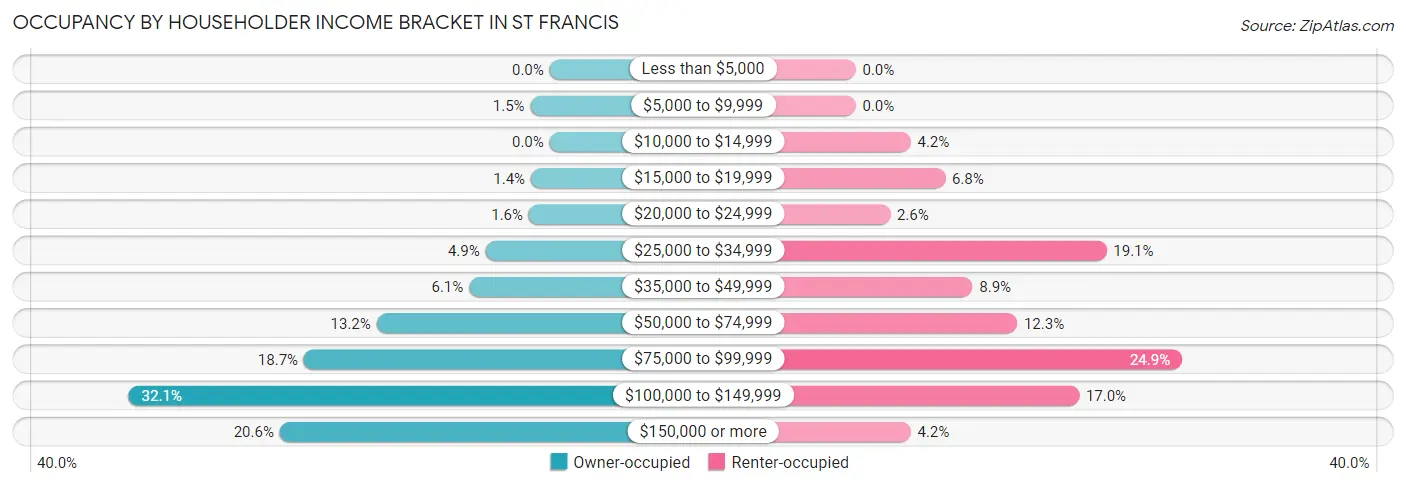
| Income Bracket | Owner-occupied | Renter-occupied |
| Less than $5,000 | 0 (0.0%) | 0 (0.0%) |
| $5,000 to $9,999 | 35 (1.5%) | 0 (0.0%) |
| $10,000 to $14,999 | 0 (0.0%) | 16 (4.2%) |
| $15,000 to $19,999 | 34 (1.4%) | 26 (6.8%) |
| $20,000 to $24,999 | 38 (1.6%) | 10 (2.6%) |
| $25,000 to $34,999 | 117 (4.9%) | 73 (19.1%) |
| $35,000 to $49,999 | 147 (6.1%) | 34 (8.9%) |
| $50,000 to $74,999 | 316 (13.2%) | 47 (12.3%) |
| $75,000 to $99,999 | 449 (18.7%) | 95 (24.9%) |
| $100,000 to $149,999 | 769 (32.1%) | 65 (17.0%) |
| $150,000 or more | 493 (20.6%) | 16 (4.2%) |
| Total | 2,398 (100.0%) | 382 (100.0%) |
Monthly Housing Cost Tiers in St Francis
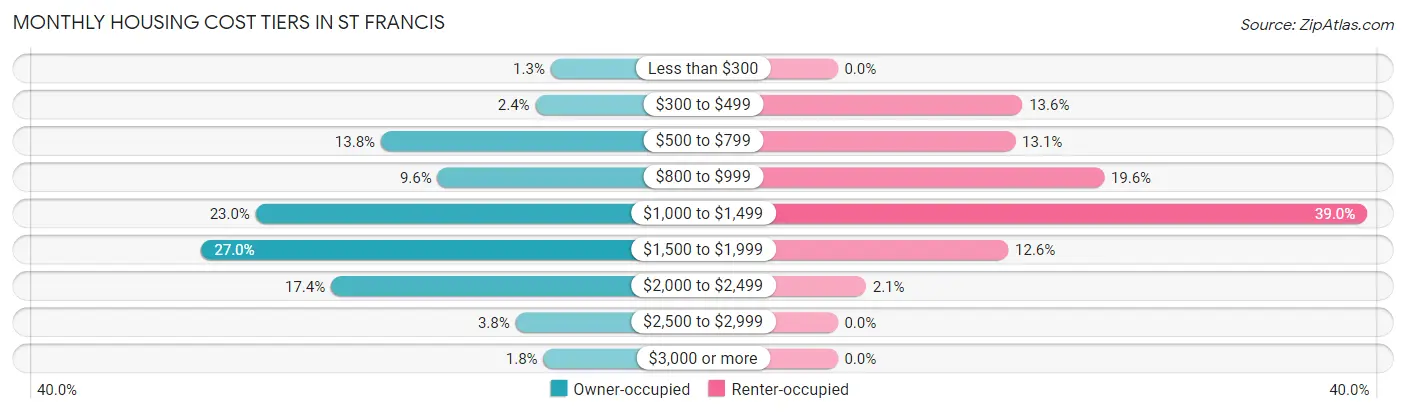
| Monthly Cost | Owner-occupied | Renter-occupied |
| Less than $300 | 30 (1.3%) | 0 (0.0%) |
| $300 to $499 | 57 (2.4%) | 52 (13.6%) |
| $500 to $799 | 330 (13.8%) | 50 (13.1%) |
| $800 to $999 | 230 (9.6%) | 75 (19.6%) |
| $1,000 to $1,499 | 551 (23.0%) | 149 (39.0%) |
| $1,500 to $1,999 | 647 (27.0%) | 48 (12.6%) |
| $2,000 to $2,499 | 418 (17.4%) | 8 (2.1%) |
| $2,500 to $2,999 | 92 (3.8%) | 0 (0.0%) |
| $3,000 or more | 43 (1.8%) | 0 (0.0%) |
| Total | 2,398 (100.0%) | 382 (100.0%) |
Physical Housing Characteristics in St Francis
Housing Structures in St Francis
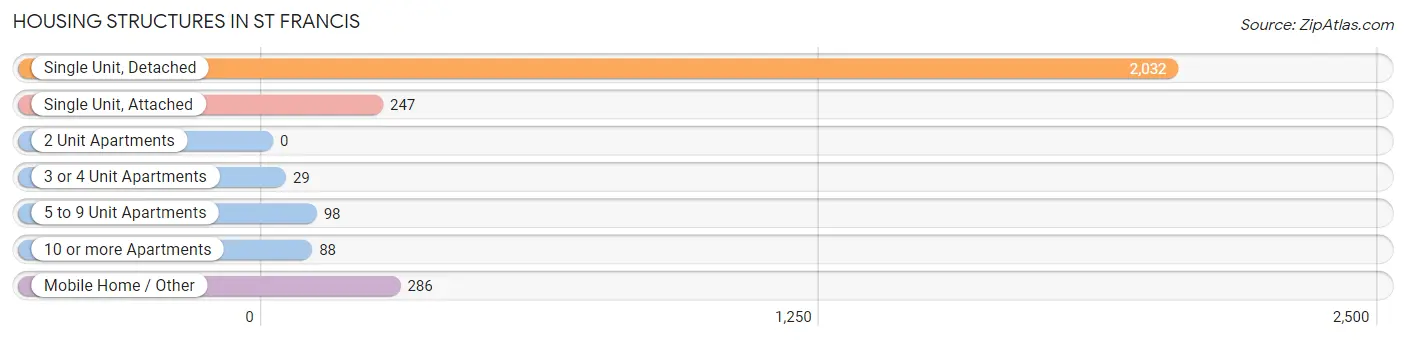
| Structure Type | # Housing Units | % Housing Units |
| Single Unit, Detached | 2,032 | 73.1% |
| Single Unit, Attached | 247 | 8.9% |
| 2 Unit Apartments | 0 | 0.0% |
| 3 or 4 Unit Apartments | 29 | 1.0% |
| 5 to 9 Unit Apartments | 98 | 3.5% |
| 10 or more Apartments | 88 | 3.2% |
| Mobile Home / Other | 286 | 10.3% |
| Total | 2,780 | 100.0% |
Housing Structures by Occupancy in St Francis
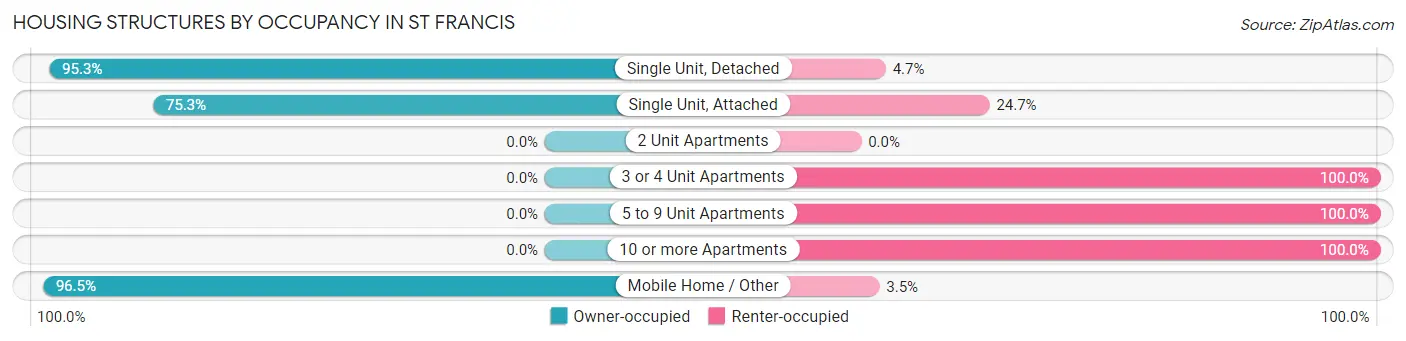
| Structure Type | Owner-occupied | Renter-occupied |
| Single Unit, Detached | 1,936 (95.3%) | 96 (4.7%) |
| Single Unit, Attached | 186 (75.3%) | 61 (24.7%) |
| 2 Unit Apartments | 0 (0.0%) | 0 (0.0%) |
| 3 or 4 Unit Apartments | 0 (0.0%) | 29 (100.0%) |
| 5 to 9 Unit Apartments | 0 (0.0%) | 98 (100.0%) |
| 10 or more Apartments | 0 (0.0%) | 88 (100.0%) |
| Mobile Home / Other | 276 (96.5%) | 10 (3.5%) |
| Total | 2,398 (86.3%) | 382 (13.7%) |
Housing Structures by Number of Rooms in St Francis
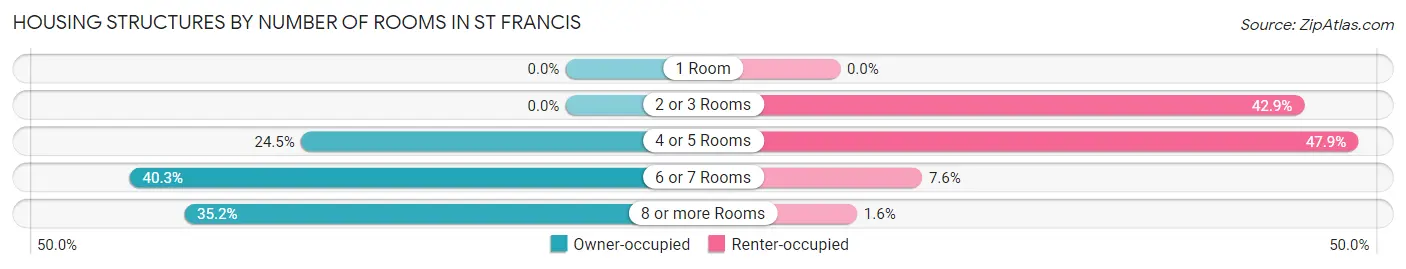
| Number of Rooms | Owner-occupied | Renter-occupied |
| 1 Room | 0 (0.0%) | 0 (0.0%) |
| 2 or 3 Rooms | 0 (0.0%) | 164 (42.9%) |
| 4 or 5 Rooms | 587 (24.5%) | 183 (47.9%) |
| 6 or 7 Rooms | 966 (40.3%) | 29 (7.6%) |
| 8 or more Rooms | 845 (35.2%) | 6 (1.6%) |
| Total | 2,398 (100.0%) | 382 (100.0%) |
Housing Structure by Heating Type in St Francis
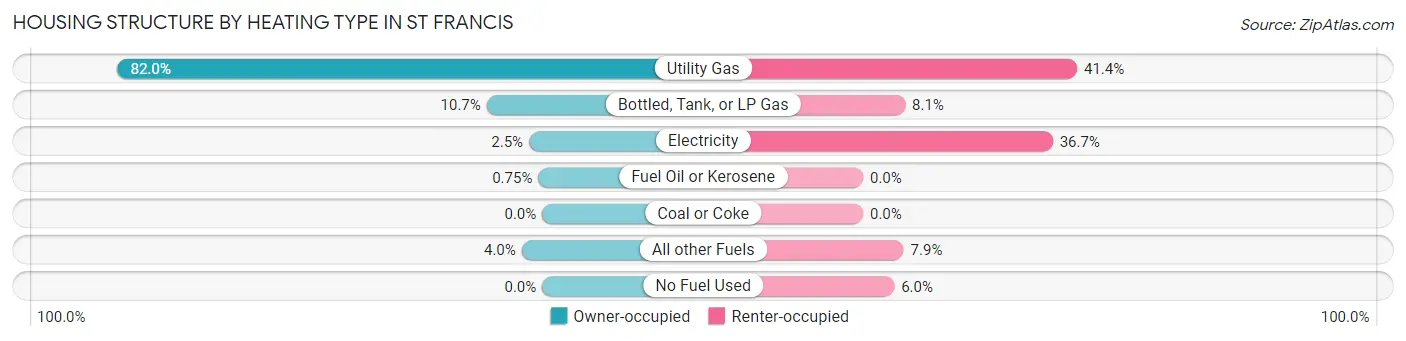
| Heating Type | Owner-occupied | Renter-occupied |
| Utility Gas | 1,967 (82.0%) | 158 (41.4%) |
| Bottled, Tank, or LP Gas | 257 (10.7%) | 31 (8.1%) |
| Electricity | 61 (2.5%) | 140 (36.6%) |
| Fuel Oil or Kerosene | 18 (0.7%) | 0 (0.0%) |
| Coal or Coke | 0 (0.0%) | 0 (0.0%) |
| All other Fuels | 95 (4.0%) | 30 (7.9%) |
| No Fuel Used | 0 (0.0%) | 23 (6.0%) |
| Total | 2,398 (100.0%) | 382 (100.0%) |
Household Vehicle Usage in St Francis
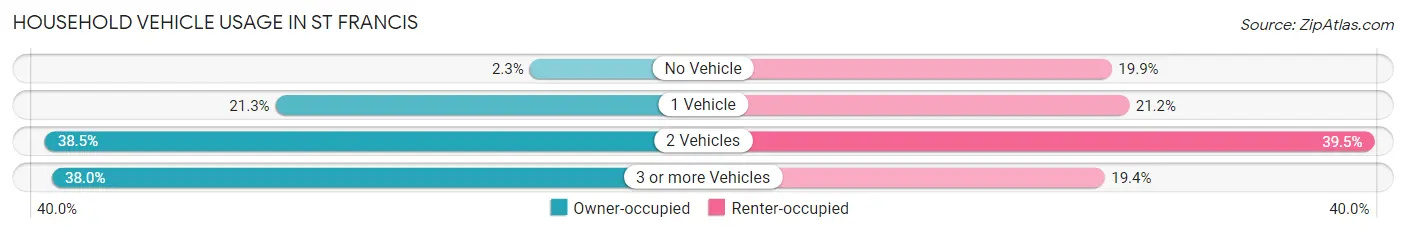
| Vehicles per Household | Owner-occupied | Renter-occupied |
| No Vehicle | 55 (2.3%) | 76 (19.9%) |
| 1 Vehicle | 510 (21.3%) | 81 (21.2%) |
| 2 Vehicles | 923 (38.5%) | 151 (39.5%) |
| 3 or more Vehicles | 910 (38.0%) | 74 (19.4%) |
| Total | 2,398 (100.0%) | 382 (100.0%) |
Real Estate & Mortgages in St Francis
Real Estate and Mortgage Overview in St Francis
| Characteristic | Without Mortgage | With Mortgage |
| Housing Units | 591 | 1,807 |
| Median Property Value | $244,600 | $280,200 |
| Median Household Income | $57,019 | $452 |
| Monthly Housing Costs | $720 | $43 |
| Real Estate Taxes | $2,208 | $6 |
Property Value by Mortgage Status in St Francis
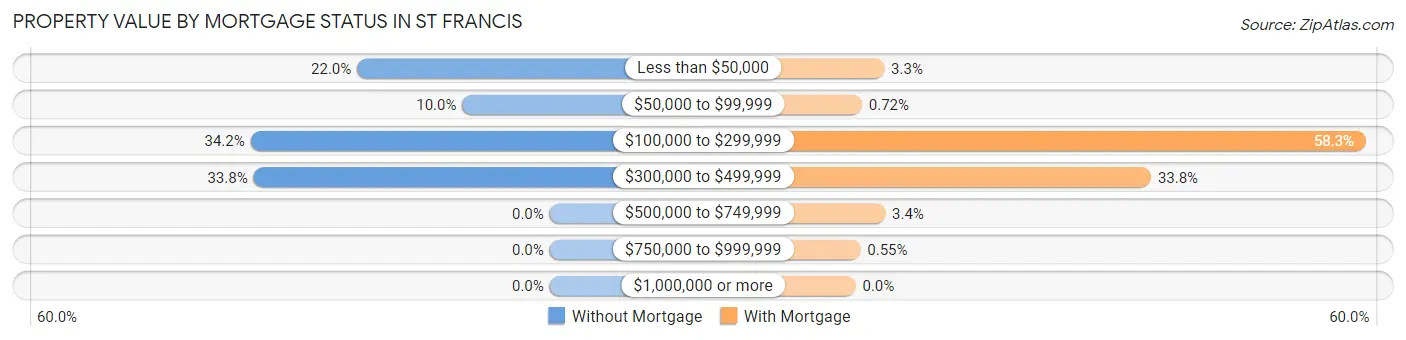
| Property Value | Without Mortgage | With Mortgage |
| Less than $50,000 | 130 (22.0%) | 59 (3.3%) |
| $50,000 to $99,999 | 59 (10.0%) | 13 (0.7%) |
| $100,000 to $299,999 | 202 (34.2%) | 1,054 (58.3%) |
| $300,000 to $499,999 | 200 (33.8%) | 610 (33.8%) |
| $500,000 to $749,999 | 0 (0.0%) | 61 (3.4%) |
| $750,000 to $999,999 | 0 (0.0%) | 10 (0.5%) |
| $1,000,000 or more | 0 (0.0%) | 0 (0.0%) |
| Total | 591 (100.0%) | 1,807 (100.0%) |
Household Income by Mortgage Status in St Francis
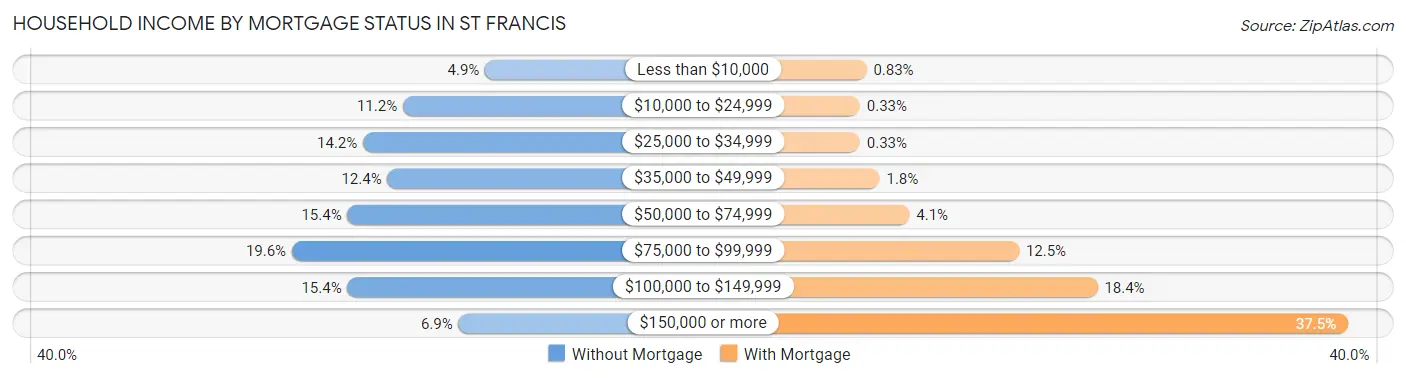
| Household Income | Without Mortgage | With Mortgage |
| Less than $10,000 | 29 (4.9%) | 15 (0.8%) |
| $10,000 to $24,999 | 66 (11.2%) | 6 (0.3%) |
| $25,000 to $34,999 | 84 (14.2%) | 6 (0.3%) |
| $35,000 to $49,999 | 73 (12.3%) | 33 (1.8%) |
| $50,000 to $74,999 | 91 (15.4%) | 74 (4.1%) |
| $75,000 to $99,999 | 116 (19.6%) | 225 (12.4%) |
| $100,000 to $149,999 | 91 (15.4%) | 333 (18.4%) |
| $150,000 or more | 41 (6.9%) | 678 (37.5%) |
| Total | 591 (100.0%) | 1,807 (100.0%) |
Property Value to Household Income Ratio in St Francis
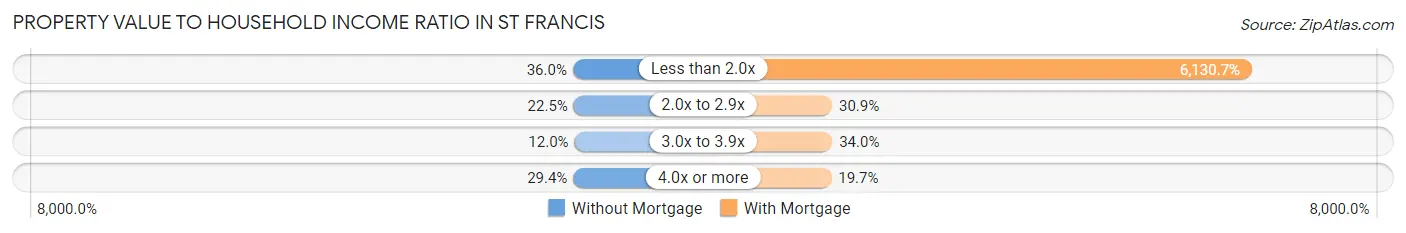
| Value-to-Income Ratio | Without Mortgage | With Mortgage |
| Less than 2.0x | 213 (36.0%) | 110,781 (6,130.7%) |
| 2.0x to 2.9x | 133 (22.5%) | 559 (30.9%) |
| 3.0x to 3.9x | 71 (12.0%) | 615 (34.0%) |
| 4.0x or more | 174 (29.4%) | 356 (19.7%) |
| Total | 591 (100.0%) | 1,807 (100.0%) |
Real Estate Taxes by Mortgage Status in St Francis
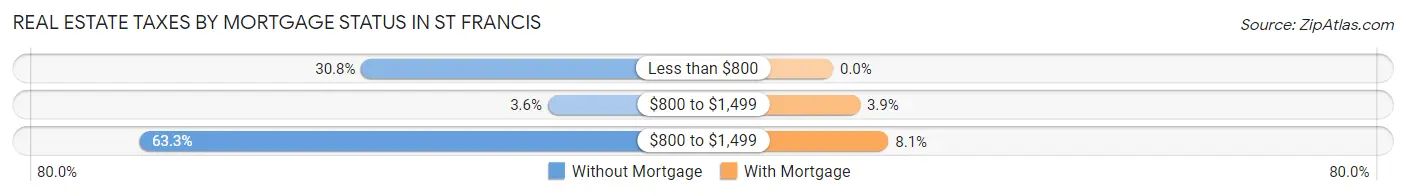
| Property Taxes | Without Mortgage | With Mortgage |
| Less than $800 | 182 (30.8%) | 0 (0.0%) |
| $800 to $1,499 | 21 (3.5%) | 71 (3.9%) |
| $800 to $1,499 | 374 (63.3%) | 146 (8.1%) |
| Total | 591 (100.0%) | 1,807 (100.0%) |
Health & Disability in St Francis
Health Insurance Coverage by Age in St Francis
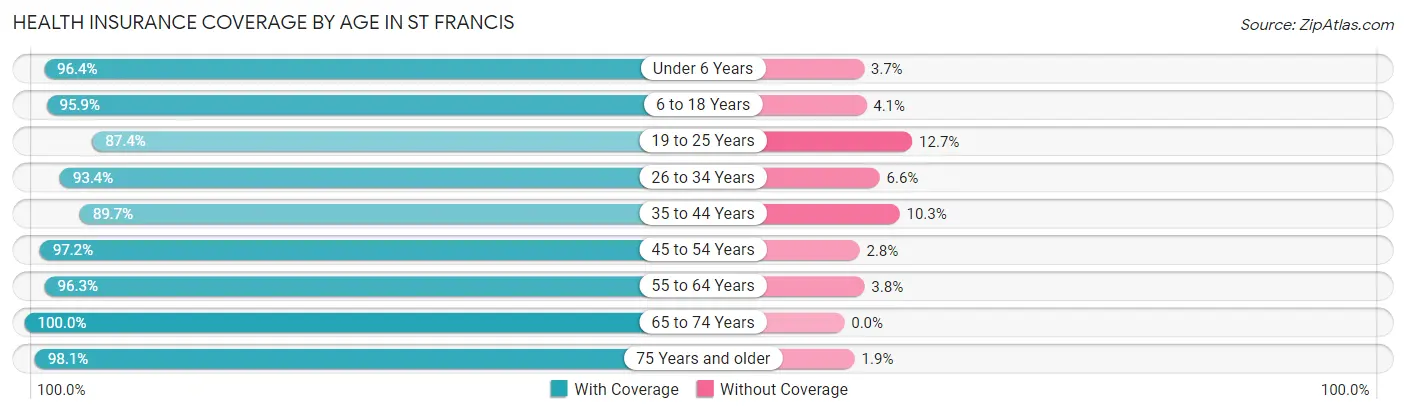
| Age Bracket | With Coverage | Without Coverage |
| Under 6 Years | 712 (96.4%) | 27 (3.6%) |
| 6 to 18 Years | 1,707 (95.9%) | 73 (4.1%) |
| 19 to 25 Years | 580 (87.4%) | 84 (12.7%) |
| 26 to 34 Years | 909 (93.4%) | 64 (6.6%) |
| 35 to 44 Years | 1,158 (89.7%) | 133 (10.3%) |
| 45 to 54 Years | 1,062 (97.2%) | 31 (2.8%) |
| 55 to 64 Years | 744 (96.3%) | 29 (3.7%) |
| 65 to 74 Years | 419 (100.0%) | 0 (0.0%) |
| 75 Years and older | 457 (98.1%) | 9 (1.9%) |
| Total | 7,748 (94.5%) | 450 (5.5%) |
Health Insurance Coverage by Citizenship Status in St Francis
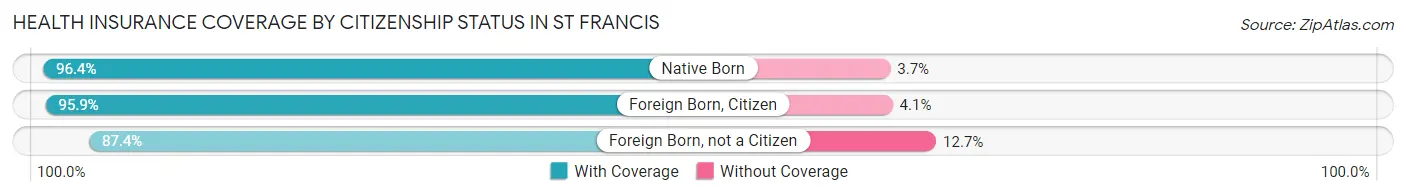
| Citizenship Status | With Coverage | Without Coverage |
| Native Born | 712 (96.4%) | 27 (3.6%) |
| Foreign Born, Citizen | 1,707 (95.9%) | 73 (4.1%) |
| Foreign Born, not a Citizen | 580 (87.4%) | 84 (12.7%) |
Health Insurance Coverage by Household Income in St Francis
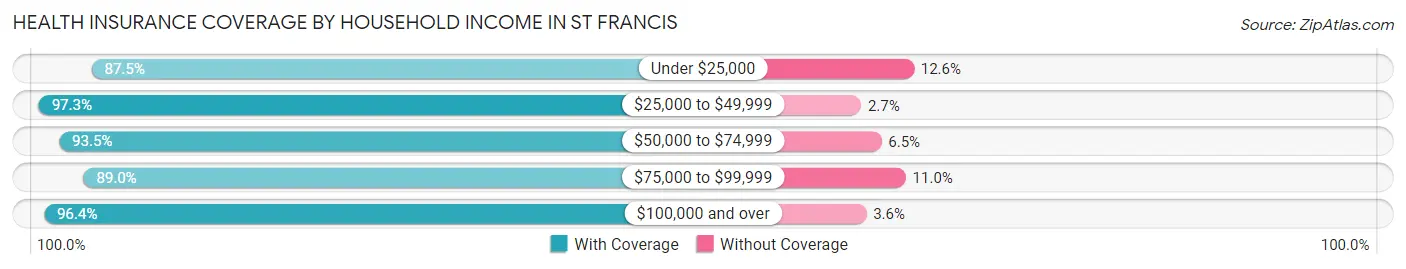
| Household Income | With Coverage | Without Coverage |
| Under $25,000 | 237 (87.5%) | 34 (12.6%) |
| $25,000 to $49,999 | 804 (97.3%) | 22 (2.7%) |
| $50,000 to $74,999 | 923 (93.5%) | 64 (6.5%) |
| $75,000 to $99,999 | 1,290 (89.0%) | 160 (11.0%) |
| $100,000 and over | 4,494 (96.4%) | 170 (3.6%) |
Public vs Private Health Insurance Coverage by Age in St Francis
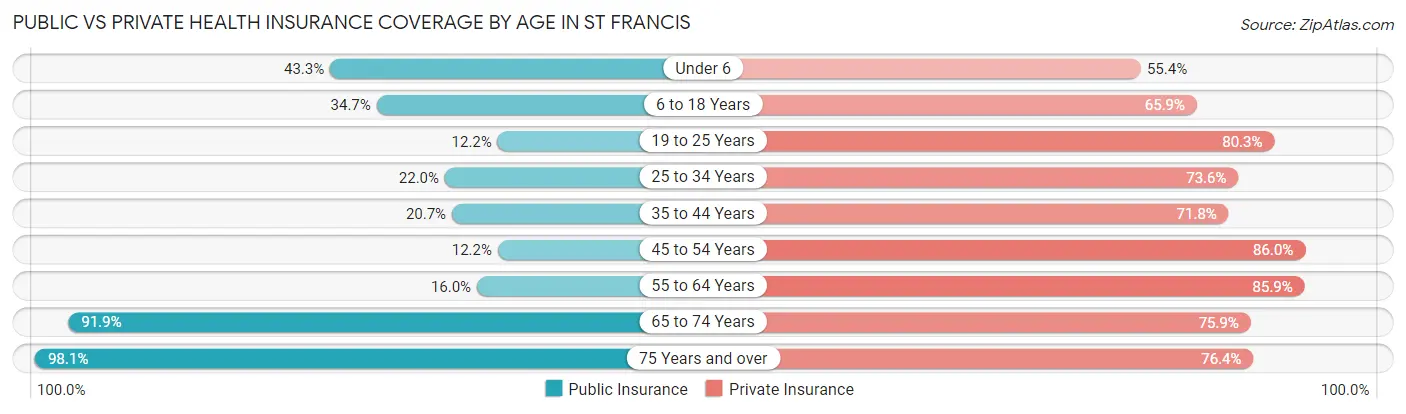
| Age Bracket | Public Insurance | Private Insurance |
| Under 6 | 320 (43.3%) | 409 (55.3%) |
| 6 to 18 Years | 617 (34.7%) | 1,173 (65.9%) |
| 19 to 25 Years | 81 (12.2%) | 533 (80.3%) |
| 25 to 34 Years | 214 (22.0%) | 716 (73.6%) |
| 35 to 44 Years | 267 (20.7%) | 927 (71.8%) |
| 45 to 54 Years | 133 (12.2%) | 940 (86.0%) |
| 55 to 64 Years | 124 (16.0%) | 664 (85.9%) |
| 65 to 74 Years | 385 (91.9%) | 318 (75.9%) |
| 75 Years and over | 457 (98.1%) | 356 (76.4%) |
| Total | 2,598 (31.7%) | 6,036 (73.6%) |
Disability Status by Sex by Age in St Francis
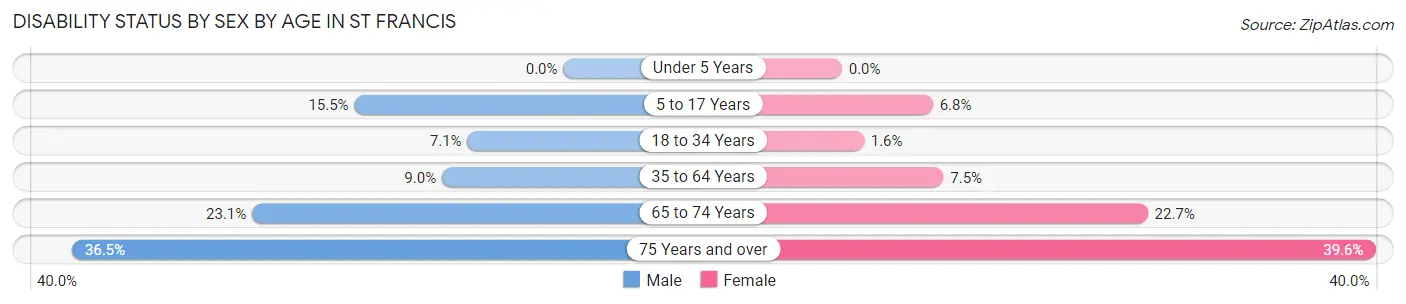
| Age Bracket | Male | Female |
| Under 5 Years | 0 (0.0%) | 0 (0.0%) |
| 5 to 17 Years | 159 (15.5%) | 51 (6.8%) |
| 18 to 34 Years | 63 (7.1%) | 15 (1.6%) |
| 35 to 64 Years | 141 (9.0%) | 120 (7.5%) |
| 65 to 74 Years | 49 (23.1%) | 47 (22.7%) |
| 75 Years and over | 77 (36.5%) | 101 (39.6%) |
Disability Class by Sex by Age in St Francis
Disability Class: Hearing Difficulty
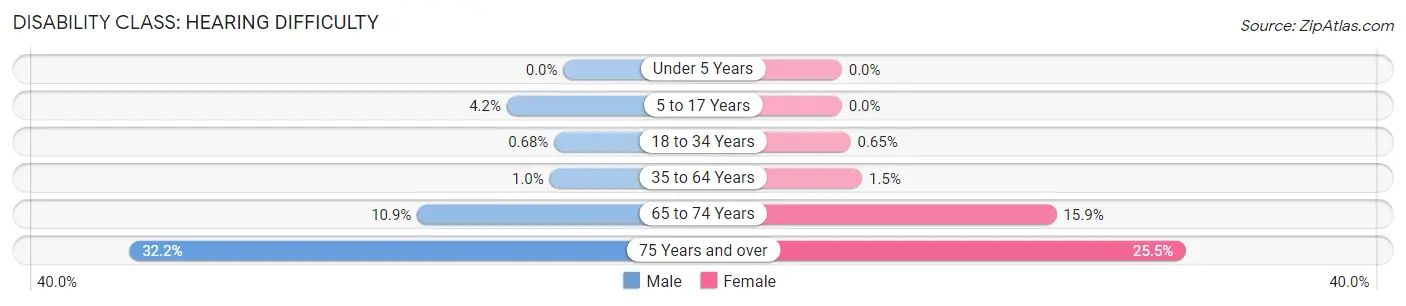
| Age Bracket | Male | Female |
| Under 5 Years | 0 (0.0%) | 0 (0.0%) |
| 5 to 17 Years | 43 (4.2%) | 0 (0.0%) |
| 18 to 34 Years | 6 (0.7%) | 6 (0.6%) |
| 35 to 64 Years | 16 (1.0%) | 24 (1.5%) |
| 65 to 74 Years | 23 (10.8%) | 33 (15.9%) |
| 75 Years and over | 68 (32.2%) | 65 (25.5%) |
Disability Class: Vision Difficulty
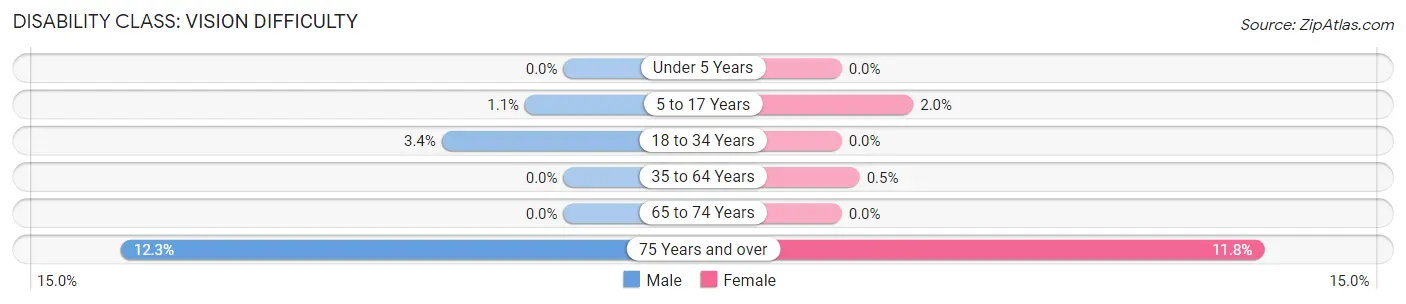
| Age Bracket | Male | Female |
| Under 5 Years | 0 (0.0%) | 0 (0.0%) |
| 5 to 17 Years | 11 (1.1%) | 15 (2.0%) |
| 18 to 34 Years | 30 (3.4%) | 0 (0.0%) |
| 35 to 64 Years | 0 (0.0%) | 8 (0.5%) |
| 65 to 74 Years | 0 (0.0%) | 0 (0.0%) |
| 75 Years and over | 26 (12.3%) | 30 (11.8%) |
Disability Class: Cognitive Difficulty
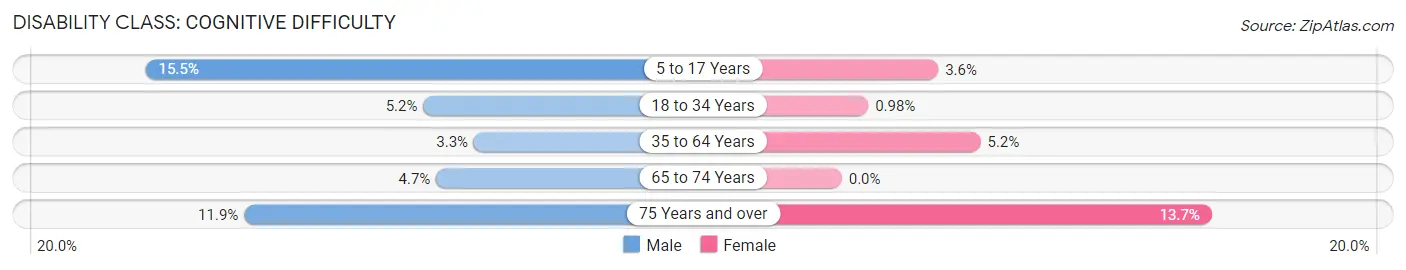
| Age Bracket | Male | Female |
| 5 to 17 Years | 159 (15.5%) | 27 (3.6%) |
| 18 to 34 Years | 46 (5.2%) | 9 (1.0%) |
| 35 to 64 Years | 52 (3.3%) | 82 (5.1%) |
| 65 to 74 Years | 10 (4.7%) | 0 (0.0%) |
| 75 Years and over | 25 (11.8%) | 35 (13.7%) |
Disability Class: Ambulatory Difficulty
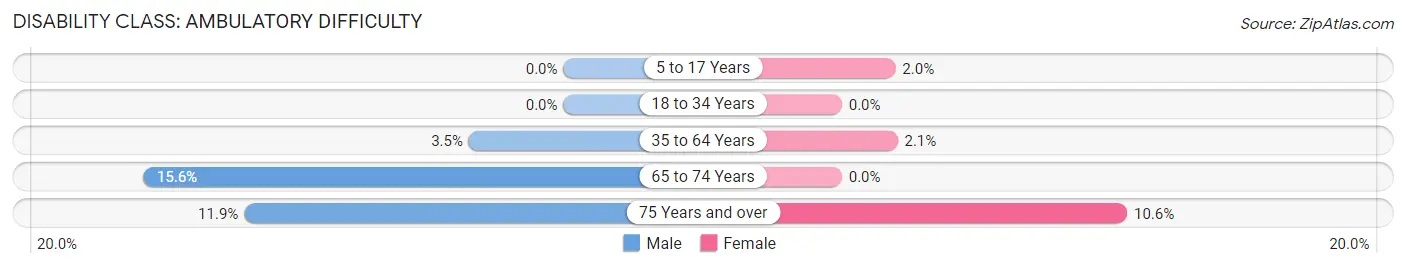
| Age Bracket | Male | Female |
| 5 to 17 Years | 0 (0.0%) | 15 (2.0%) |
| 18 to 34 Years | 0 (0.0%) | 0 (0.0%) |
| 35 to 64 Years | 55 (3.5%) | 33 (2.1%) |
| 65 to 74 Years | 33 (15.6%) | 0 (0.0%) |
| 75 Years and over | 25 (11.8%) | 27 (10.6%) |
Disability Class: Self-Care Difficulty
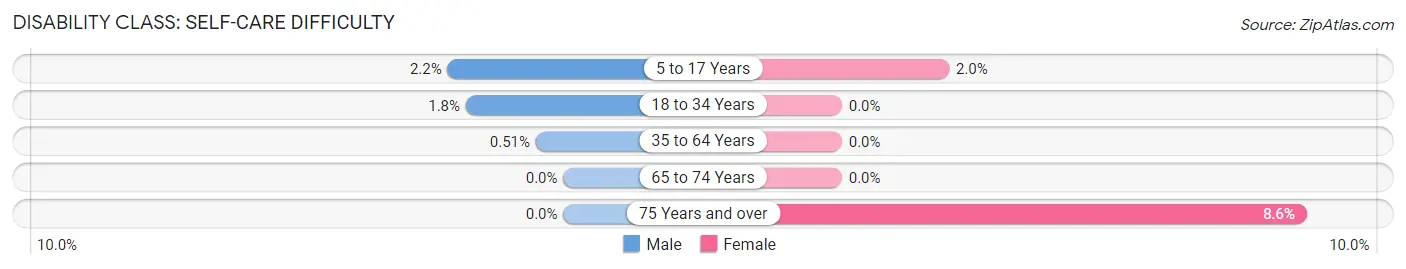
| Age Bracket | Male | Female |
| 5 to 17 Years | 22 (2.1%) | 15 (2.0%) |
| 18 to 34 Years | 16 (1.8%) | 0 (0.0%) |
| 35 to 64 Years | 8 (0.5%) | 0 (0.0%) |
| 65 to 74 Years | 0 (0.0%) | 0 (0.0%) |
| 75 Years and over | 0 (0.0%) | 22 (8.6%) |
Technology Access in St Francis
Computing Device Access in St Francis
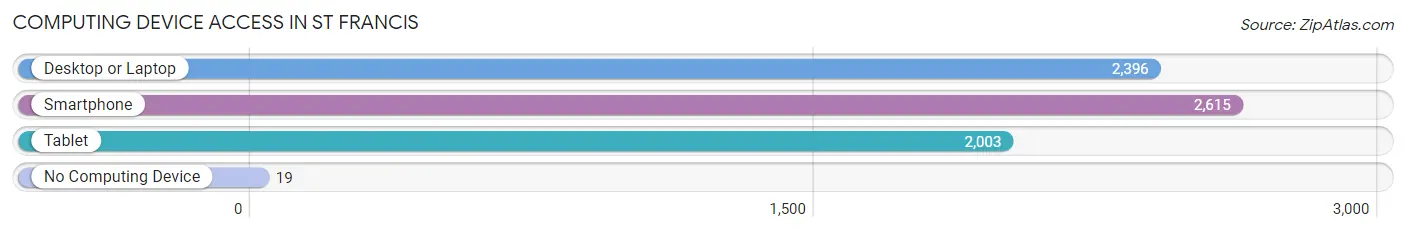
| Device Type | # Households | % Households |
| Desktop or Laptop | 2,396 | 86.2% |
| Smartphone | 2,615 | 94.1% |
| Tablet | 2,003 | 72.1% |
| No Computing Device | 19 | 0.7% |
| Total | 2,780 | 100.0% |
Internet Access in St Francis
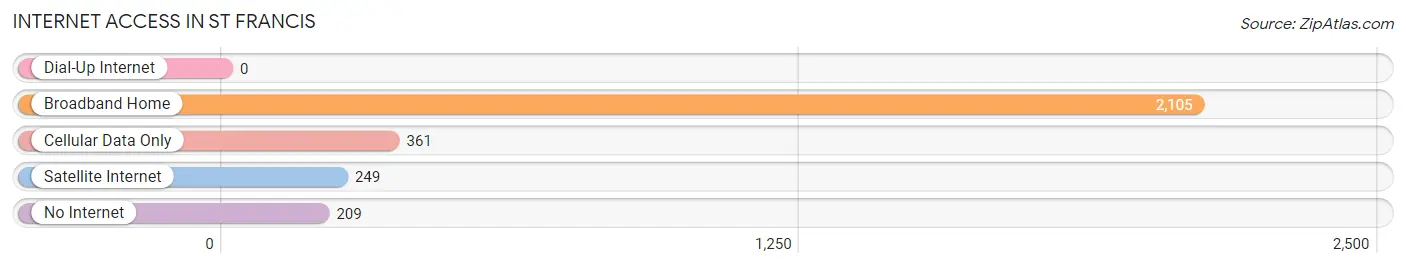
| Internet Type | # Households | % Households |
| Dial-Up Internet | 0 | 0.0% |
| Broadband Home | 2,105 | 75.7% |
| Cellular Data Only | 361 | 13.0% |
| Satellite Internet | 249 | 9.0% |
| No Internet | 209 | 7.5% |
| Total | 2,780 | 100.0% |
St Francis Summary
Francis, Minnesota is a small city located in the central part of the state, about an hour and a half north of the Twin Cities. It is part of the St. Cloud Metropolitan Statistical Area and is home to a population of just over 6,000 people. The city is known for its strong sense of community and its commitment to preserving its history and culture.
Geography
St. Francis is located in the central part of Minnesota, about an hour and a half north of the Twin Cities. It is part of the St. Cloud Metropolitan Statistical Area and is home to a population of just over 6,000 people. The city is situated on the banks of the Mississippi River and is surrounded by rolling hills and forests. The city is also home to several lakes, including Lake George, which is the largest lake in the area.
History
St. Francis was founded in 1856 by a group of settlers from Wisconsin. The city was named after the patron saint of the Catholic Church, St. Francis of Assisi. The city quickly grew and became a center of commerce and industry in the area. In the late 19th century, the city was home to several mills and factories, as well as a large lumber industry.
The city was also home to a large number of immigrants, particularly from Germany and Scandinavia. These immigrants brought with them their culture and traditions, which still influence the city today.
Economy
St. Francis is home to a diverse economy, with a variety of industries and businesses. The city is home to several manufacturing companies, including a large paper mill and a plastics factory. The city is also home to several retail stores, restaurants, and other businesses.
The city is also home to a large number of farms, which produce a variety of crops, including corn, soybeans, and wheat. The city is also home to several wineries, which produce a variety of wines.
Demographics
As of the 2010 census, the population of St. Francis was 6,072. The city is predominantly white, with a small percentage of African Americans, Hispanics, and Asians. The median household income in the city is $50,000, and the median home value is $150,000.
The city is home to a large number of churches, including Catholic, Lutheran, and Methodist. The city is also home to several schools, including a public high school and a private Catholic school.
Conclusion
St. Francis, Minnesota is a small city located in the central part of the state, about an hour and a half north of the Twin Cities. It is part of the St. Cloud Metropolitan Statistical Area and is home to a population of just over 6,000 people. The city is known for its strong sense of community and its commitment to preserving its history and culture. The city is home to a diverse economy, with a variety of industries and businesses, as well as a large number of farms. The city is also home to a large number of churches, schools, and other amenities. The city is predominantly white, with a small percentage of African Americans, Hispanics, and Asians. The median household income in the city is $50,000, and the median home value is $150,000.
Common Questions
What is Per Capita Income in St Francis?
Per Capita income in St Francis is $36,568.
What is the Median Family Income in St Francis?
Median Family Income in St Francis is $99,028.
What is the Median Household income in St Francis?
Median Household Income in St Francis is $98,390.
What is Income or Wage Gap in St Francis?
Income or Wage Gap in St Francis is 34.9%.
Women in St Francis earn 65.1 cents for every dollar earned by a man.
What is Inequality or Gini Index in St Francis?
Inequality or Gini Index in St Francis is 0.32.
What is the Total Population of St Francis?
Total Population of St Francis is 8,198.
What is the Total Male Population of St Francis?
Total Male Population of St Francis is 4,249.
What is the Total Female Population of St Francis?
Total Female Population of St Francis is 3,949.
What is the Ratio of Males per 100 Females in St Francis?
There are 107.60 Males per 100 Females in St Francis.
What is the Ratio of Females per 100 Males in St Francis?
There are 92.94 Females per 100 Males in St Francis.
What is the Median Population Age in St Francis?
Median Population Age in St Francis is 34.4 Years.
What is the Average Family Size in St Francis
Average Family Size in St Francis is 3.3 People.
What is the Average Household Size in St Francis
Average Household Size in St Francis is 3.0 People.
How Large is the Labor Force in St Francis?
There are 4,439 People in the Labor Forcein in St Francis.
What is the Percentage of People in the Labor Force in St Francis?
74.1% of People are in the Labor Force in St Francis.
What is the Unemployment Rate in St Francis?
Unemployment Rate in St Francis is 2.7%.