Zip Codes with the Highest Percentage of Population Employed in Professional & Scientific Services in Noblesville, IN
RELATED REPORTS & OPTIONS
Professional & Scientific Services
Noblesville
Compare Zip Codes
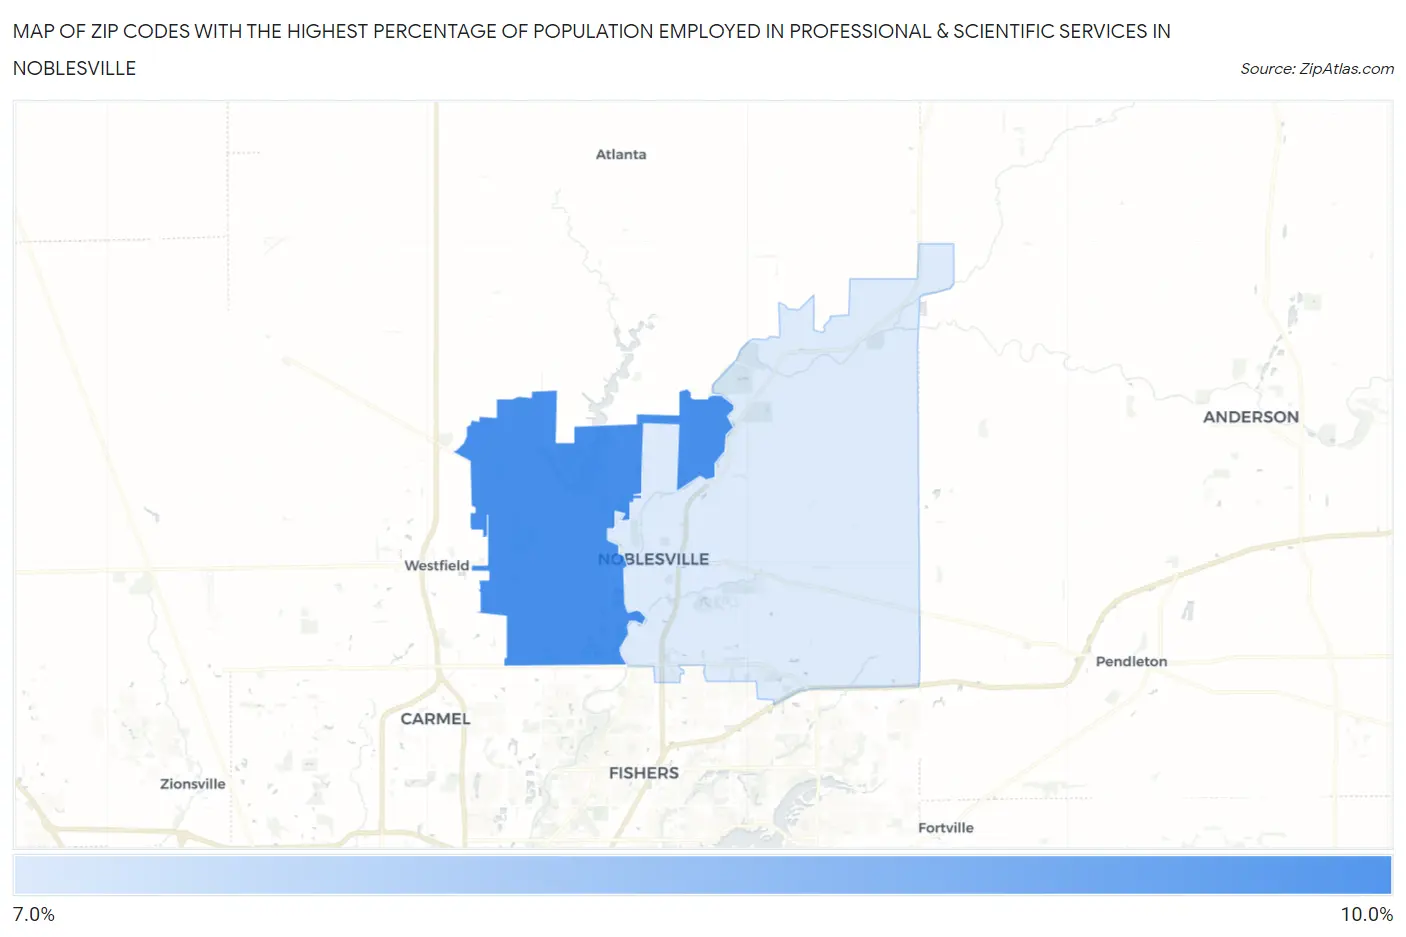
Map of Zip Codes with the Highest Percentage of Population Employed in Professional & Scientific Services in Noblesville
7.0%
9.4%
Zip Codes with the Highest Percentage of Population Employed in Professional & Scientific Services in Noblesville, IN
| Zip Code | % Employed | vs State | vs National | |
| 1. | 46062 | 9.4% | 5.1%(+4.26)#44 | 7.8%(+1.56)#5,086 |
| 2. | 46060 | 7.0% | 5.1%(+1.89)#82 | 7.8%(-0.808)#8,105 |
1
Common Questions
What are the Top Zip Codes with the Highest Percentage of Population Employed in Professional & Scientific Services in Noblesville, IN?
Top Zip Codes with the Highest Percentage of Population Employed in Professional & Scientific Services in Noblesville, IN are:
What zip code has the Highest Percentage of Population Employed in Professional & Scientific Services in Noblesville, IN?
46062 has the Highest Percentage of Population Employed in Professional & Scientific Services in Noblesville, IN with 9.4%.
What is the Percentage of Population Employed in Professional & Scientific Services in Noblesville, IN?
Percentage of Population Employed in Professional & Scientific Services in Noblesville is 8.4%.
What is the Percentage of Population Employed in Professional & Scientific Services in Indiana?
Percentage of Population Employed in Professional & Scientific Services in Indiana is 5.1%.
What is the Percentage of Population Employed in Professional & Scientific Services in the United States?
Percentage of Population Employed in Professional & Scientific Services in the United States is 7.8%.