Zip Codes with the Highest Percentage of Population Employed in Professional & Scientific Services in Indianapolis, IN
RELATED REPORTS & OPTIONS
Professional & Scientific Services
Indianapolis
Compare Zip Codes
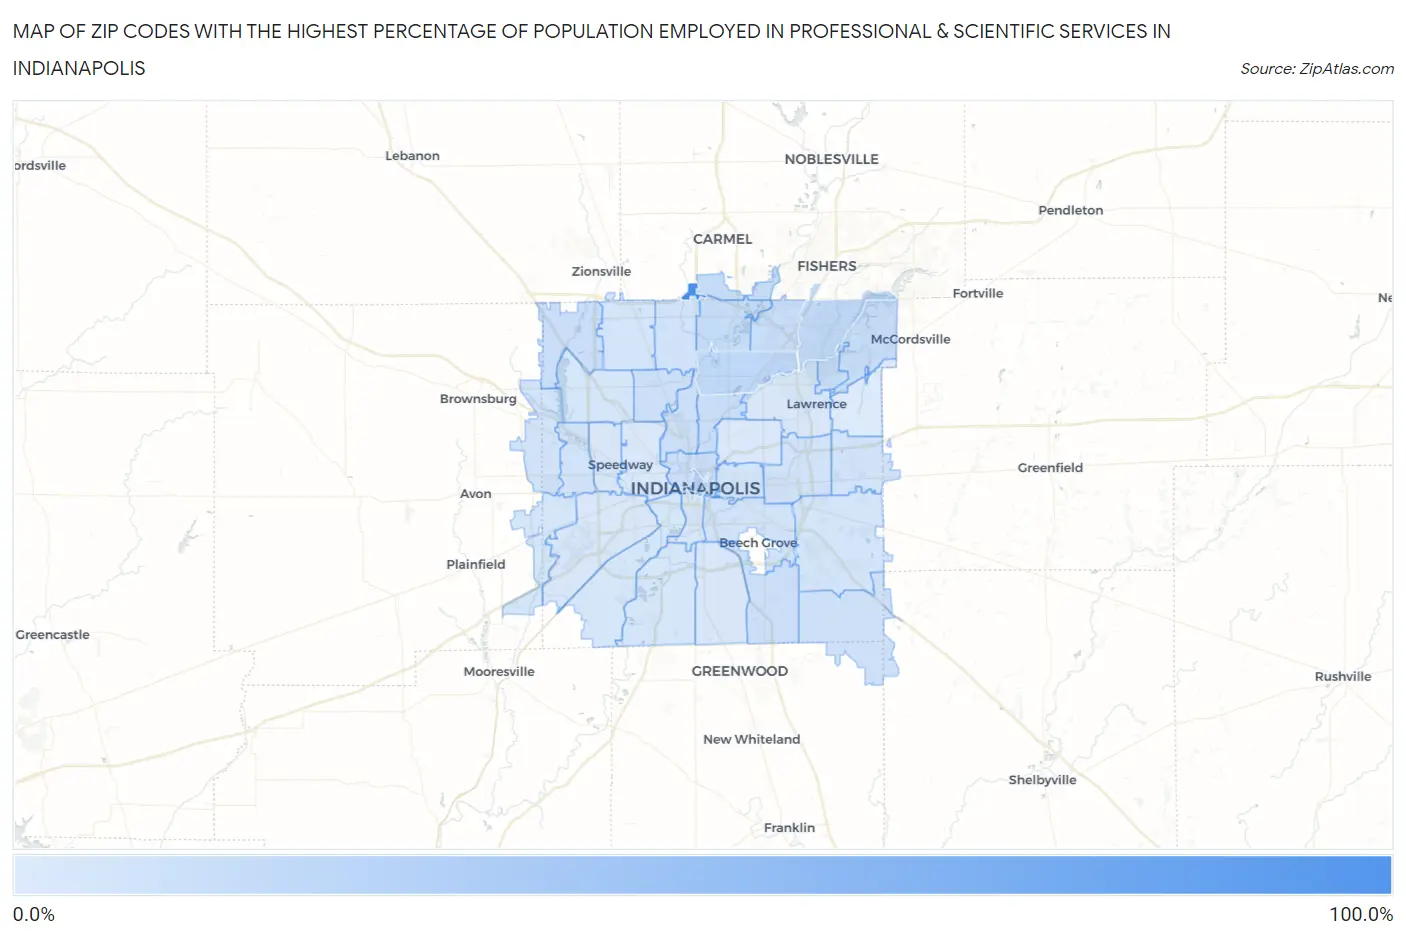
Map of Zip Codes with the Highest Percentage of Population Employed in Professional & Scientific Services in Indianapolis
1.9%
100.0%
Zip Codes with the Highest Percentage of Population Employed in Professional & Scientific Services in Indianapolis, IN
| Zip Code | % Employed | vs State | vs National | |
| 1. | 46290 | 100.0% | 5.1%(+94.9)#1 | 7.8%(+92.2)#7 |
| 2. | 46204 | 21.7% | 5.1%(+16.6)#6 | 7.8%(+13.9)#700 |
| 3. | 46220 | 16.7% | 5.1%(+11.6)#9 | 7.8%(+8.88)#1,423 |
| 4. | 46256 | 15.0% | 5.1%(+9.86)#13 | 7.8%(+7.17)#1,890 |
| 5. | 46280 | 12.7% | 5.1%(+7.52)#20 | 7.8%(+4.83)#2,849 |
| 6. | 46240 | 12.6% | 5.1%(+7.43)#21 | 7.8%(+4.73)#2,898 |
| 7. | 46236 | 12.3% | 5.1%(+7.18)#23 | 7.8%(+4.48)#3,026 |
| 8. | 46216 | 12.3% | 5.1%(+7.13)#24 | 7.8%(+4.43)#3,043 |
| 9. | 46250 | 12.2% | 5.1%(+7.07)#25 | 7.8%(+4.38)#3,081 |
| 10. | 46205 | 12.0% | 5.1%(+6.84)#26 | 7.8%(+4.14)#3,217 |
| 11. | 46278 | 11.0% | 5.1%(+5.80)#33 | 7.8%(+3.11)#3,874 |
| 12. | 46202 | 10.5% | 5.1%(+5.36)#37 | 7.8%(+2.66)#4,188 |
| 13. | 46237 | 9.6% | 5.1%(+4.48)#40 | 7.8%(+1.79)#4,902 |
| 14. | 46208 | 9.5% | 5.1%(+4.31)#43 | 7.8%(+1.61)#5,042 |
| 15. | 46228 | 9.1% | 5.1%(+3.99)#46 | 7.8%(+1.29)#5,359 |
| 16. | 46259 | 8.0% | 5.1%(+2.87)#57 | 7.8%(+0.173)#6,631 |
| 17. | 46234 | 7.7% | 5.1%(+2.51)#66 | 7.8%(-0.190)#7,120 |
| 18. | 46260 | 7.6% | 5.1%(+2.42)#69 | 7.8%(-0.280)#7,254 |
| 19. | 46214 | 7.3% | 5.1%(+2.14)#75 | 7.8%(-0.554)#7,670 |
| 20. | 46219 | 7.2% | 5.1%(+2.09)#77 | 7.8%(-0.613)#7,748 |
| 21. | 46203 | 6.9% | 5.1%(+1.77)#88 | 7.8%(-0.925)#8,298 |
| 22. | 46229 | 6.9% | 5.1%(+1.70)#90 | 7.8%(-0.995)#8,409 |
| 23. | 46268 | 6.2% | 5.1%(+1.09)#116 | 7.8%(-1.60)#9,499 |
| 24. | 46201 | 6.1% | 5.1%(+0.930)#123 | 7.8%(-1.77)#9,819 |
| 25. | 46239 | 5.9% | 5.1%(+0.733)#131 | 7.8%(-1.96)#10,195 |
| 26. | 46217 | 5.2% | 5.1%(+0.100)#169 | 7.8%(-2.60)#11,684 |
| 27. | 46221 | 4.9% | 5.1%(-0.230)#194 | 7.8%(-2.93)#12,523 |
| 28. | 46254 | 4.9% | 5.1%(-0.258)#195 | 7.8%(-2.96)#12,595 |
| 29. | 46231 | 4.6% | 5.1%(-0.515)#208 | 7.8%(-3.21)#13,275 |
| 30. | 46227 | 4.5% | 5.1%(-0.613)#217 | 7.8%(-3.31)#13,554 |
| 31. | 46225 | 4.5% | 5.1%(-0.652)#222 | 7.8%(-3.35)#13,677 |
| 32. | 46224 | 4.2% | 5.1%(-0.958)#242 | 7.8%(-3.66)#14,565 |
| 33. | 46226 | 4.1% | 5.1%(-1.02)#246 | 7.8%(-3.72)#14,753 |
| 34. | 46241 | 3.9% | 5.1%(-1.28)#270 | 7.8%(-3.98)#15,519 |
| 35. | 46218 | 2.8% | 5.1%(-2.36)#398 | 7.8%(-5.05)#19,171 |
| 36. | 46222 | 2.7% | 5.1%(-2.40)#404 | 7.8%(-5.10)#19,358 |
| 37. | 46235 | 1.9% | 5.1%(-3.24)#493 | 7.8%(-5.94)#22,184 |
1
Common Questions
What are the Top 10 Zip Codes with the Highest Percentage of Population Employed in Professional & Scientific Services in Indianapolis, IN?
Top 10 Zip Codes with the Highest Percentage of Population Employed in Professional & Scientific Services in Indianapolis, IN are:
What zip code has the Highest Percentage of Population Employed in Professional & Scientific Services in Indianapolis, IN?
46290 has the Highest Percentage of Population Employed in Professional & Scientific Services in Indianapolis, IN with 100.0%.
What is the Percentage of Population Employed in Professional & Scientific Services in Indianapolis, IN?
Percentage of Population Employed in Professional & Scientific Services in Indianapolis is 7.5%.
What is the Percentage of Population Employed in Professional & Scientific Services in Indiana?
Percentage of Population Employed in Professional & Scientific Services in Indiana is 5.1%.
What is the Percentage of Population Employed in Professional & Scientific Services in the United States?
Percentage of Population Employed in Professional & Scientific Services in the United States is 7.8%.