Zip Codes with the Highest Percentage of Population Employed in Professional & Scientific Services in Fishers, IN
RELATED REPORTS & OPTIONS
Professional & Scientific Services
Fishers
Compare Zip Codes
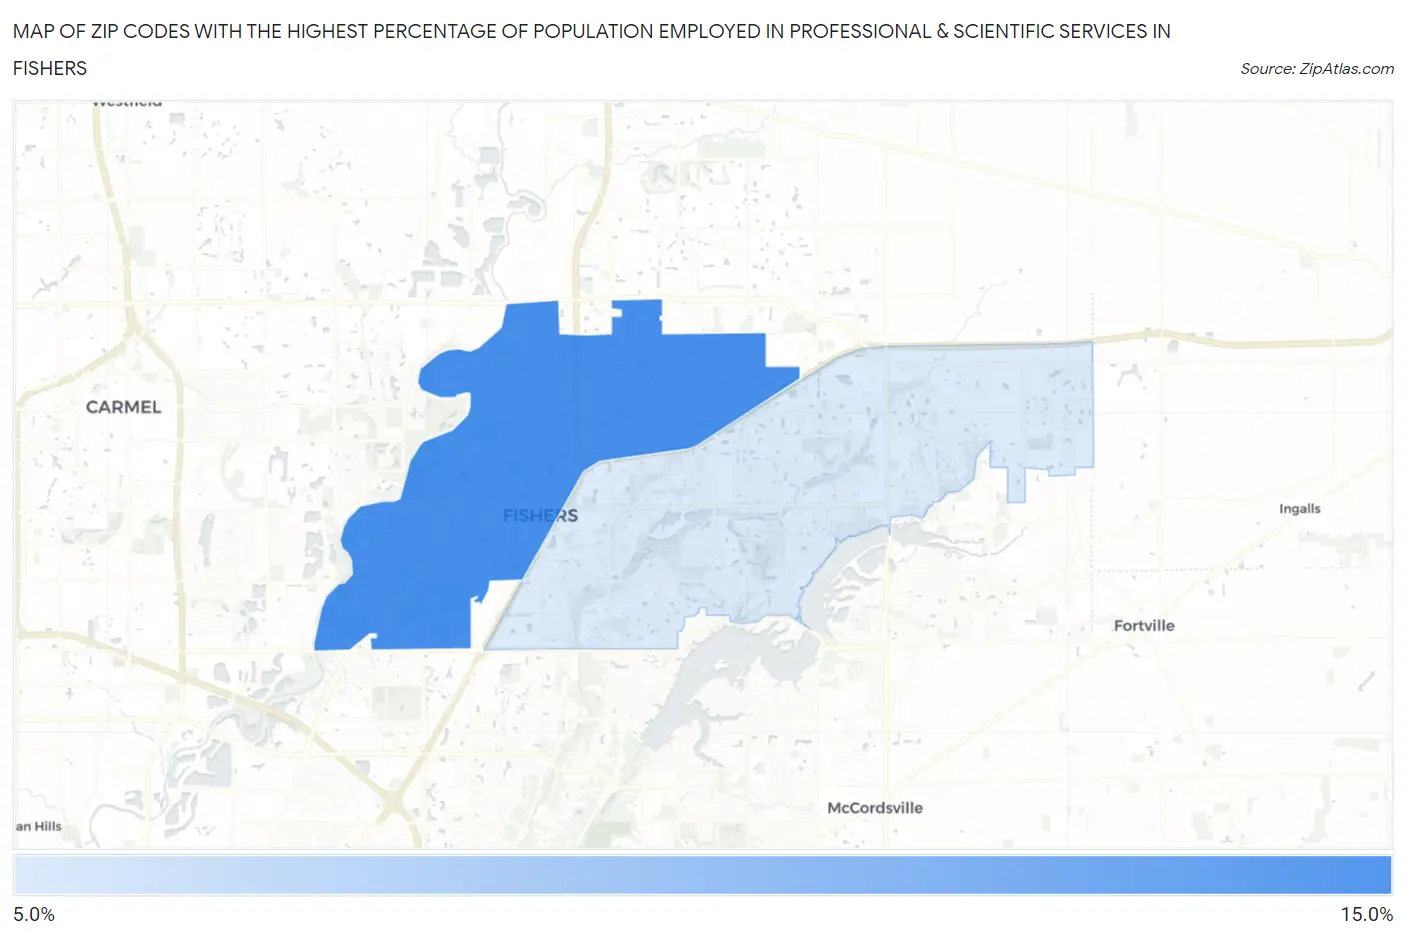
Map of Zip Codes with the Highest Percentage of Population Employed in Professional & Scientific Services in Fishers
12.5%
13.7%
Zip Codes with the Highest Percentage of Population Employed in Professional & Scientific Services in Fishers, IN
| Zip Code | % Employed | vs State | vs National | |
| 1. | 46038 | 13.7% | 5.1%(+8.57)#16 | 7.8%(+5.87)#2,385 |
| 2. | 46037 | 12.5% | 5.1%(+7.33)#22 | 7.8%(+4.64)#2,953 |
1
Common Questions
What are the Top Zip Codes with the Highest Percentage of Population Employed in Professional & Scientific Services in Fishers, IN?
Top Zip Codes with the Highest Percentage of Population Employed in Professional & Scientific Services in Fishers, IN are:
What zip code has the Highest Percentage of Population Employed in Professional & Scientific Services in Fishers, IN?
46038 has the Highest Percentage of Population Employed in Professional & Scientific Services in Fishers, IN with 13.7%.
What is the Percentage of Population Employed in Professional & Scientific Services in Fishers, IN?
Percentage of Population Employed in Professional & Scientific Services in Fishers is 13.0%.
What is the Percentage of Population Employed in Professional & Scientific Services in Indiana?
Percentage of Population Employed in Professional & Scientific Services in Indiana is 5.1%.
What is the Percentage of Population Employed in Professional & Scientific Services in the United States?
Percentage of Population Employed in Professional & Scientific Services in the United States is 7.8%.