Zip Codes with the Highest Percentage of Population Employed in Professional & Scientific Services in Indiana
RELATED REPORTS & OPTIONS
Professional & Scientific Services
Indiana
Compare Zip Codes
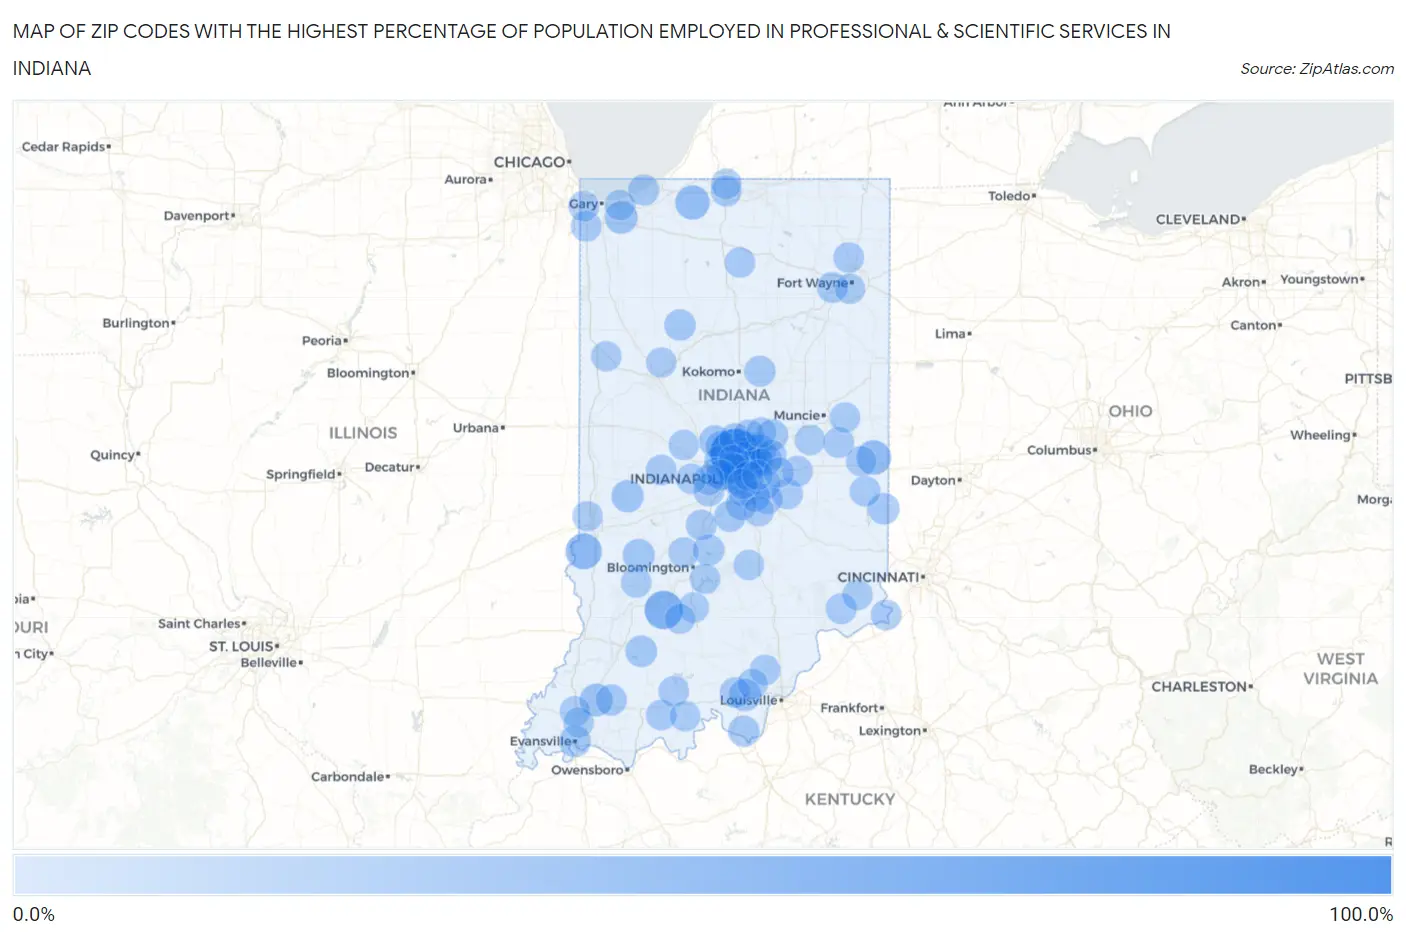
Map of Zip Codes with the Highest Percentage of Population Employed in Professional & Scientific Services in Indiana
0.0%
100.0%
Zip Codes with the Highest Percentage of Population Employed in Professional & Scientific Services in Indiana
| Zip Code | % Employed | vs State | vs National | |
| 1. | 46290 | 100.0% | 5.1%(+94.9)#1 | 7.8%(+92.2)#7 |
| 2. | 47522 | 44.6% | 5.1%(+39.4)#2 | 7.8%(+36.7)#75 |
| 3. | 47869 | 33.3% | 5.1%(+28.2)#3 | 7.8%(+25.5)#166 |
| 4. | 47392 | 26.7% | 5.1%(+21.5)#4 | 7.8%(+18.8)#346 |
| 5. | 46365 | 25.4% | 5.1%(+20.2)#5 | 7.8%(+17.5)#404 |
| 6. | 46204 | 21.7% | 5.1%(+16.6)#6 | 7.8%(+13.9)#700 |
| 7. | 47654 | 18.2% | 5.1%(+13.0)#7 | 7.8%(+10.3)#1,132 |
| 8. | 46393 | 17.3% | 5.1%(+12.1)#8 | 7.8%(+9.44)#1,301 |
| 9. | 46220 | 16.7% | 5.1%(+11.6)#9 | 7.8%(+8.88)#1,423 |
| 10. | 46032 | 15.9% | 5.1%(+10.7)#10 | 7.8%(+8.01)#1,647 |
| 11. | 47837 | 15.8% | 5.1%(+10.6)#11 | 7.8%(+7.93)#1,673 |
| 12. | 47114 | 15.2% | 5.1%(+10.1)#12 | 7.8%(+7.37)#1,824 |
| 13. | 46256 | 15.0% | 5.1%(+9.86)#13 | 7.8%(+7.17)#1,890 |
| 14. | 46033 | 14.9% | 5.1%(+9.73)#14 | 7.8%(+7.03)#1,955 |
| 15. | 47427 | 14.8% | 5.1%(+9.66)#15 | 7.8%(+6.96)#1,974 |
| 16. | 46038 | 13.7% | 5.1%(+8.57)#16 | 7.8%(+5.87)#2,385 |
| 17. | 46075 | 13.2% | 5.1%(+8.09)#17 | 7.8%(+5.39)#2,615 |
| 18. | 47519 | 13.0% | 5.1%(+7.89)#18 | 7.8%(+5.20)#2,697 |
| 19. | 47708 | 12.8% | 5.1%(+7.61)#19 | 7.8%(+4.91)#2,805 |
| 20. | 46280 | 12.7% | 5.1%(+7.52)#20 | 7.8%(+4.83)#2,849 |
| 21. | 46240 | 12.6% | 5.1%(+7.43)#21 | 7.8%(+4.73)#2,898 |
| 22. | 46037 | 12.5% | 5.1%(+7.33)#22 | 7.8%(+4.64)#2,953 |
| 23. | 46236 | 12.3% | 5.1%(+7.18)#23 | 7.8%(+4.48)#3,026 |
| 24. | 46216 | 12.3% | 5.1%(+7.13)#24 | 7.8%(+4.43)#3,043 |
| 25. | 46250 | 12.2% | 5.1%(+7.07)#25 | 7.8%(+4.38)#3,081 |
| 26. | 46205 | 12.0% | 5.1%(+6.84)#26 | 7.8%(+4.14)#3,217 |
| 27. | 47003 | 11.9% | 5.1%(+6.76)#27 | 7.8%(+4.06)#3,270 |
| 28. | 46106 | 11.8% | 5.1%(+6.61)#28 | 7.8%(+3.92)#3,338 |
| 29. | 47950 | 11.7% | 5.1%(+6.57)#29 | 7.8%(+3.88)#3,365 |
| 30. | 46055 | 11.4% | 5.1%(+6.20)#30 | 7.8%(+3.50)#3,604 |
| 31. | 46051 | 11.3% | 5.1%(+6.16)#31 | 7.8%(+3.46)#3,638 |
| 32. | 47468 | 11.1% | 5.1%(+5.94)#32 | 7.8%(+3.24)#3,787 |
| 33. | 46278 | 11.0% | 5.1%(+5.80)#33 | 7.8%(+3.11)#3,874 |
| 34. | 47135 | 10.9% | 5.1%(+5.79)#34 | 7.8%(+3.09)#3,889 |
| 35. | 47584 | 10.8% | 5.1%(+5.66)#35 | 7.8%(+2.96)#3,977 |
| 36. | 46077 | 10.6% | 5.1%(+5.46)#36 | 7.8%(+2.76)#4,098 |
| 37. | 46202 | 10.5% | 5.1%(+5.36)#37 | 7.8%(+2.66)#4,188 |
| 38. | 46936 | 10.3% | 5.1%(+5.13)#38 | 7.8%(+2.44)#4,359 |
| 39. | 46074 | 9.8% | 5.1%(+4.63)#39 | 7.8%(+1.93)#4,761 |
| 40. | 46237 | 9.6% | 5.1%(+4.48)#40 | 7.8%(+1.79)#4,902 |
| 41. | 46814 | 9.6% | 5.1%(+4.44)#41 | 7.8%(+1.75)#4,920 |
| 42. | 46301 | 9.5% | 5.1%(+4.37)#42 | 7.8%(+1.68)#4,982 |
| 43. | 46208 | 9.5% | 5.1%(+4.31)#43 | 7.8%(+1.61)#5,042 |
| 44. | 46062 | 9.4% | 5.1%(+4.26)#44 | 7.8%(+1.56)#5,086 |
| 45. | 47224 | 9.3% | 5.1%(+4.12)#45 | 7.8%(+1.42)#5,218 |
| 46. | 46228 | 9.1% | 5.1%(+3.99)#46 | 7.8%(+1.29)#5,359 |
| 47. | 46151 | 9.1% | 5.1%(+3.97)#47 | 7.8%(+1.28)#5,376 |
| 48. | 46161 | 8.8% | 5.1%(+3.67)#48 | 7.8%(+0.976)#5,676 |
| 49. | 46163 | 8.6% | 5.1%(+3.45)#49 | 7.8%(+0.754)#5,912 |
| 50. | 46617 | 8.6% | 5.1%(+3.40)#50 | 7.8%(+0.703)#5,972 |
| 51. | 46373 | 8.5% | 5.1%(+3.39)#51 | 7.8%(+0.694)#5,985 |
| 52. | 47360 | 8.4% | 5.1%(+3.29)#52 | 7.8%(+0.588)#6,093 |
| 53. | 46748 | 8.3% | 5.1%(+3.13)#53 | 7.8%(+0.429)#6,308 |
| 54. | 47325 | 8.2% | 5.1%(+3.06)#54 | 7.8%(+0.358)#6,397 |
| 55. | 46126 | 8.2% | 5.1%(+3.01)#55 | 7.8%(+0.310)#6,461 |
| 56. | 46172 | 8.1% | 5.1%(+2.99)#56 | 7.8%(+0.290)#6,488 |
| 57. | 46259 | 8.0% | 5.1%(+2.87)#57 | 7.8%(+0.173)#6,631 |
| 58. | 46117 | 8.0% | 5.1%(+2.87)#58 | 7.8%(+0.168)#6,639 |
| 59. | 47038 | 8.0% | 5.1%(+2.80)#59 | 7.8%(+0.104)#6,724 |
| 60. | 46040 | 7.9% | 5.1%(+2.80)#60 | 7.8%(+0.098)#6,733 |
| 61. | 46168 | 7.9% | 5.1%(+2.79)#61 | 7.8%(+0.096)#6,737 |
| 62. | 46324 | 7.9% | 5.1%(+2.78)#62 | 7.8%(+0.084)#6,753 |
| 63. | 46143 | 7.8% | 5.1%(+2.67)#63 | 7.8%(-0.032)#6,907 |
| 64. | 47166 | 7.7% | 5.1%(+2.55)#64 | 7.8%(-0.143)#7,056 |
| 65. | 47451 | 7.7% | 5.1%(+2.52)#65 | 7.8%(-0.178)#7,104 |
| 66. | 46234 | 7.7% | 5.1%(+2.51)#66 | 7.8%(-0.190)#7,120 |
| 67. | 47577 | 7.7% | 5.1%(+2.51)#67 | 7.8%(-0.191)#7,121 |
| 68. | 46570 | 7.6% | 5.1%(+2.48)#68 | 7.8%(-0.214)#7,167 |
| 69. | 46260 | 7.6% | 5.1%(+2.42)#69 | 7.8%(-0.280)#7,254 |
| 70. | 47465 | 7.6% | 5.1%(+2.41)#70 | 7.8%(-0.292)#7,267 |
| 71. | 47513 | 7.6% | 5.1%(+2.40)#71 | 7.8%(-0.294)#7,270 |
| 72. | 47345 | 7.4% | 5.1%(+2.29)#72 | 7.8%(-0.412)#7,444 |
| 73. | 47639 | 7.3% | 5.1%(+2.18)#73 | 7.8%(-0.521)#7,617 |
| 74. | 47368 | 7.3% | 5.1%(+2.15)#74 | 7.8%(-0.546)#7,660 |
| 75. | 46214 | 7.3% | 5.1%(+2.14)#75 | 7.8%(-0.554)#7,670 |
| 76. | 46368 | 7.3% | 5.1%(+2.13)#76 | 7.8%(-0.573)#7,699 |
| 77. | 46219 | 7.2% | 5.1%(+2.09)#77 | 7.8%(-0.613)#7,748 |
| 78. | 47514 | 7.2% | 5.1%(+2.04)#78 | 7.8%(-0.658)#7,823 |
| 79. | 46637 | 7.2% | 5.1%(+2.02)#79 | 7.8%(-0.681)#7,869 |
| 80. | 47018 | 7.1% | 5.1%(+1.96)#80 | 7.8%(-0.735)#7,978 |
| 81. | 47106 | 7.1% | 5.1%(+1.90)#81 | 7.8%(-0.795)#8,082 |
| 82. | 46060 | 7.0% | 5.1%(+1.89)#82 | 7.8%(-0.808)#8,105 |
| 83. | 46123 | 7.0% | 5.1%(+1.87)#83 | 7.8%(-0.827)#8,136 |
| 84. | 46102 | 7.0% | 5.1%(+1.84)#84 | 7.8%(-0.861)#8,201 |
| 85. | 47201 | 7.0% | 5.1%(+1.83)#85 | 7.8%(-0.867)#8,214 |
| 86. | 47401 | 6.9% | 5.1%(+1.79)#86 | 7.8%(-0.907)#8,274 |
| 87. | 46162 | 6.9% | 5.1%(+1.79)#87 | 7.8%(-0.911)#8,281 |
| 88. | 46203 | 6.9% | 5.1%(+1.77)#88 | 7.8%(-0.925)#8,298 |
| 89. | 46122 | 6.9% | 5.1%(+1.74)#89 | 7.8%(-0.954)#8,341 |
| 90. | 46229 | 6.9% | 5.1%(+1.70)#90 | 7.8%(-0.995)#8,409 |
| 91. | 47429 | 6.8% | 5.1%(+1.69)#91 | 7.8%(-1.01)#8,437 |
| 92. | 47725 | 6.8% | 5.1%(+1.68)#92 | 7.8%(-1.01)#8,442 |
| 93. | 47356 | 6.8% | 5.1%(+1.68)#93 | 7.8%(-1.01)#8,443 |
| 94. | 47944 | 6.8% | 5.1%(+1.63)#94 | 7.8%(-1.06)#8,515 |
| 95. | 46807 | 6.7% | 5.1%(+1.59)#95 | 7.8%(-1.10)#8,588 |
| 96. | 47920 | 6.7% | 5.1%(+1.57)#96 | 7.8%(-1.13)#8,625 |
| 97. | 47124 | 6.7% | 5.1%(+1.57)#97 | 7.8%(-1.13)#8,627 |
| 98. | 47876 | 6.7% | 5.1%(+1.52)#98 | 7.8%(-1.18)#8,718 |
| 99. | 46140 | 6.6% | 5.1%(+1.44)#99 | 7.8%(-1.25)#8,857 |
| 100. | 47470 | 6.6% | 5.1%(+1.40)#100 | 7.8%(-1.30)#8,933 |
Common Questions
What are the Top 10 Zip Codes with the Highest Percentage of Population Employed in Professional & Scientific Services in Indiana?
Top 10 Zip Codes with the Highest Percentage of Population Employed in Professional & Scientific Services in Indiana are:
What zip code has the Highest Percentage of Population Employed in Professional & Scientific Services in Indiana?
46290 has the Highest Percentage of Population Employed in Professional & Scientific Services in Indiana with 100.0%.
What is the Percentage of Population Employed in Professional & Scientific Services in the State of Indiana?
Percentage of Population Employed in Professional & Scientific Services in Indiana is 5.1%.
What is the Percentage of Population Employed in Professional & Scientific Services in the United States?
Percentage of Population Employed in Professional & Scientific Services in the United States is 7.8%.