Zip Codes with the Highest Percentage of Population Employed in Security & Protection in Iowa
RELATED REPORTS & OPTIONS
Security & Protection
Iowa
Compare Zip Codes
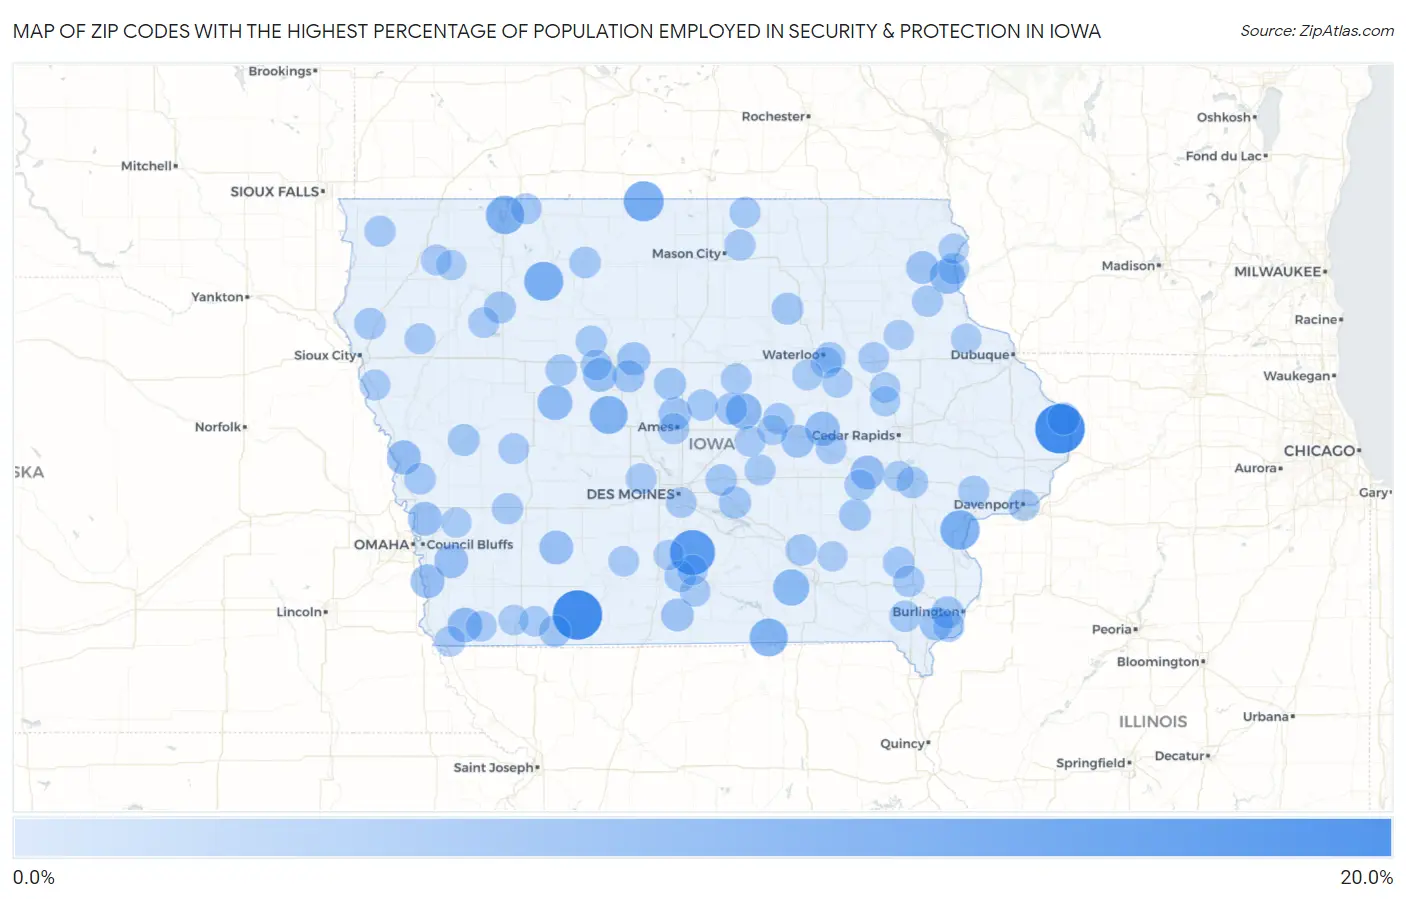
Map of Zip Codes with the Highest Percentage of Population Employed in Security & Protection in Iowa
0.0%
20.0%
Zip Codes with the Highest Percentage of Population Employed in Security & Protection in Iowa
| Zip Code | % Employed | vs State | vs National | |
| 1. | 52771 | 20.0% | 1.4%(+18.6)#1 | 2.1%(+17.9)#196 |
| 2. | 50840 | 19.8% | 1.4%(+18.5)#2 | 2.1%(+17.7)#202 |
| 3. | 50145 | 15.9% | 1.4%(+14.5)#3 | 2.1%(+13.8)#324 |
| 4. | 50465 | 11.4% | 1.4%(+10.1)#4 | 2.1%(+9.28)#611 |
| 5. | 52749 | 10.8% | 1.4%(+9.38)#5 | 2.1%(+8.61)#671 |
| 6. | 50527 | 10.6% | 1.4%(+9.27)#6 | 2.1%(+8.49)#689 |
| 7. | 51355 | 9.8% | 1.4%(+8.44)#7 | 2.1%(+7.66)#792 |
| 8. | 52555 | 9.6% | 1.4%(+8.20)#8 | 2.1%(+7.43)#827 |
| 9. | 50064 | 9.5% | 1.4%(+8.15)#9 | 2.1%(+7.38)#835 |
| 10. | 52536 | 8.0% | 1.4%(+6.67)#10 | 2.1%(+5.89)#1,153 |
| 11. | 50005 | 7.5% | 1.4%(+6.16)#11 | 2.1%(+5.39)#1,320 |
| 12. | 52157 | 7.2% | 1.4%(+5.79)#12 | 2.1%(+5.02)#1,460 |
| 13. | 51451 | 6.9% | 1.4%(+5.52)#13 | 2.1%(+4.75)#1,585 |
| 14. | 51639 | 6.6% | 1.4%(+5.21)#14 | 2.1%(+4.43)#1,744 |
| 15. | 52225 | 6.5% | 1.4%(+5.08)#15 | 2.1%(+4.30)#1,806 |
| 16. | 51545 | 6.3% | 1.4%(+4.96)#16 | 2.1%(+4.18)#1,882 |
| 17. | 51542 | 6.0% | 1.4%(+4.64)#17 | 2.1%(+3.86)#2,073 |
| 18. | 52334 | 6.0% | 1.4%(+4.60)#18 | 2.1%(+3.82)#2,103 |
| 19. | 51561 | 6.0% | 1.4%(+4.59)#19 | 2.1%(+3.81)#2,106 |
| 20. | 50837 | 6.0% | 1.4%(+4.58)#20 | 2.1%(+3.80)#2,112 |
| 21. | 51571 | 5.9% | 1.4%(+4.54)#21 | 2.1%(+3.77)#2,137 |
| 22. | 50523 | 5.9% | 1.4%(+4.53)#22 | 2.1%(+3.75)#2,145 |
| 23. | 50532 | 5.4% | 1.4%(+4.06)#23 | 2.1%(+3.28)#2,510 |
| 24. | 52624 | 5.3% | 1.4%(+3.97)#24 | 2.1%(+3.20)#2,590 |
| 25. | 52339 | 5.0% | 1.4%(+3.66)#25 | 2.1%(+2.88)#2,890 |
| 26. | 52156 | 5.0% | 1.4%(+3.64)#26 | 2.1%(+2.86)#2,911 |
| 27. | 50103 | 4.9% | 1.4%(+3.57)#27 | 2.1%(+2.80)#2,991 |
| 28. | 50105 | 4.9% | 1.4%(+3.54)#28 | 2.1%(+2.76)#3,030 |
| 29. | 52070 | 4.7% | 1.4%(+3.33)#29 | 2.1%(+2.55)#3,301 |
| 30. | 50557 | 4.5% | 1.4%(+3.12)#30 | 2.1%(+2.35)#3,620 |
| 31. | 50170 | 4.5% | 1.4%(+3.10)#31 | 2.1%(+2.33)#3,644 |
| 32. | 52638 | 4.4% | 1.4%(+3.07)#32 | 2.1%(+2.30)#3,698 |
| 33. | 50130 | 4.4% | 1.4%(+2.99)#33 | 2.1%(+2.21)#3,840 |
| 34. | 50576 | 4.3% | 1.4%(+2.97)#34 | 2.1%(+2.20)#3,863 |
| 35. | 50619 | 4.3% | 1.4%(+2.95)#35 | 2.1%(+2.17)#3,905 |
| 36. | 50051 | 4.3% | 1.4%(+2.94)#36 | 2.1%(+2.17)#3,916 |
| 37. | 51528 | 4.2% | 1.4%(+2.87)#37 | 2.1%(+2.10)#4,038 |
| 38. | 50833 | 4.2% | 1.4%(+2.79)#38 | 2.1%(+2.01)#4,200 |
| 39. | 52335 | 4.1% | 1.4%(+2.77)#39 | 2.1%(+2.00)#4,215 |
| 40. | 51550 | 4.1% | 1.4%(+2.68)#40 | 2.1%(+1.91)#4,389 |
| 41. | 52801 | 4.1% | 1.4%(+2.68)#41 | 2.1%(+1.90)#4,392 |
| 42. | 51038 | 4.0% | 1.4%(+2.65)#42 | 2.1%(+1.87)#4,460 |
| 43. | 52654 | 4.0% | 1.4%(+2.59)#43 | 2.1%(+1.81)#4,574 |
| 44. | 52242 | 4.0% | 1.4%(+2.58)#44 | 2.1%(+1.81)#4,580 |
| 45. | 50598 | 4.0% | 1.4%(+2.58)#45 | 2.1%(+1.80)#4,584 |
| 46. | 50579 | 3.9% | 1.4%(+2.57)#46 | 2.1%(+1.79)#4,602 |
| 47. | 52543 | 3.9% | 1.4%(+2.56)#47 | 2.1%(+1.78)#4,623 |
| 48. | 50054 | 3.9% | 1.4%(+2.56)#48 | 2.1%(+1.78)#4,630 |
| 49. | 52641 | 3.9% | 1.4%(+2.54)#49 | 2.1%(+1.77)#4,658 |
| 50. | 52631 | 3.8% | 1.4%(+2.47)#50 | 2.1%(+1.70)#4,817 |
| 51. | 50275 | 3.8% | 1.4%(+2.45)#51 | 2.1%(+1.68)#4,848 |
| 52. | 50154 | 3.8% | 1.4%(+2.45)#52 | 2.1%(+1.68)#4,852 |
| 53. | 50632 | 3.8% | 1.4%(+2.45)#53 | 2.1%(+1.67)#4,868 |
| 54. | 50524 | 3.7% | 1.4%(+2.37)#54 | 2.1%(+1.60)#5,037 |
| 55. | 51552 | 3.7% | 1.4%(+2.36)#55 | 2.1%(+1.58)#5,066 |
| 56. | 52158 | 3.7% | 1.4%(+2.35)#56 | 2.1%(+1.58)#5,078 |
| 57. | 52658 | 3.7% | 1.4%(+2.34)#57 | 2.1%(+1.57)#5,103 |
| 58. | 50013 | 3.7% | 1.4%(+2.30)#58 | 2.1%(+1.52)#5,207 |
| 59. | 50467 | 3.6% | 1.4%(+2.26)#59 | 2.1%(+1.49)#5,317 |
| 60. | 51235 | 3.6% | 1.4%(+2.26)#60 | 2.1%(+1.48)#5,333 |
| 61. | 52778 | 3.6% | 1.4%(+2.23)#61 | 2.1%(+1.45)#5,395 |
| 62. | 50707 | 3.6% | 1.4%(+2.22)#62 | 2.1%(+1.44)#5,414 |
| 63. | 50702 | 3.6% | 1.4%(+2.21)#63 | 2.1%(+1.43)#5,453 |
| 64. | 52043 | 3.6% | 1.4%(+2.20)#64 | 2.1%(+1.42)#5,468 |
| 65. | 50426 | 3.6% | 1.4%(+2.20)#65 | 2.1%(+1.42)#5,477 |
| 66. | 52361 | 3.5% | 1.4%(+2.14)#66 | 2.1%(+1.37)#5,628 |
| 67. | 51363 | 3.5% | 1.4%(+2.14)#67 | 2.1%(+1.36)#5,650 |
| 68. | 50566 | 3.5% | 1.4%(+2.12)#68 | 2.1%(+1.35)#5,684 |
| 69. | 50135 | 3.5% | 1.4%(+2.11)#69 | 2.1%(+1.33)#5,726 |
| 70. | 51048 | 3.4% | 1.4%(+2.08)#70 | 2.1%(+1.30)#5,809 |
| 71. | 50627 | 3.4% | 1.4%(+2.04)#71 | 2.1%(+1.26)#5,909 |
| 72. | 50063 | 3.4% | 1.4%(+2.03)#72 | 2.1%(+1.25)#5,934 |
| 73. | 50644 | 3.4% | 1.4%(+2.02)#73 | 2.1%(+1.24)#5,964 |
| 74. | 51455 | 3.4% | 1.4%(+2.02)#74 | 2.1%(+1.24)#5,979 |
| 75. | 51052 | 3.4% | 1.4%(+2.01)#75 | 2.1%(+1.24)#5,994 |
| 76. | 50120 | 3.4% | 1.4%(+1.99)#76 | 2.1%(+1.22)#6,032 |
| 77. | 51002 | 3.4% | 1.4%(+1.99)#77 | 2.1%(+1.22)#6,034 |
| 78. | 50068 | 3.4% | 1.4%(+1.98)#78 | 2.1%(+1.21)#6,069 |
| 79. | 51231 | 3.3% | 1.4%(+1.93)#79 | 2.1%(+1.16)#6,226 |
| 80. | 50643 | 3.3% | 1.4%(+1.92)#80 | 2.1%(+1.15)#6,247 |
| 81. | 52208 | 3.3% | 1.4%(+1.90)#81 | 2.1%(+1.13)#6,332 |
| 82. | 51601 | 3.3% | 1.4%(+1.89)#82 | 2.1%(+1.12)#6,360 |
| 83. | 50320 | 3.2% | 1.4%(+1.84)#83 | 2.1%(+1.06)#6,518 |
| 84. | 50151 | 3.2% | 1.4%(+1.83)#84 | 2.1%(+1.06)#6,525 |
| 85. | 50149 | 3.2% | 1.4%(+1.81)#85 | 2.1%(+1.03)#6,592 |
| 86. | 51640 | 3.2% | 1.4%(+1.78)#86 | 2.1%(+1.00)#6,693 |
| 87. | 51646 | 3.1% | 1.4%(+1.71)#87 | 2.1%(+0.936)#6,936 |
| 88. | 51632 | 3.1% | 1.4%(+1.69)#88 | 2.1%(+0.914)#7,006 |
| 89. | 50210 | 3.0% | 1.4%(+1.65)#89 | 2.1%(+0.878)#7,121 |
| 90. | 52352 | 3.0% | 1.4%(+1.63)#90 | 2.1%(+0.853)#7,221 |
| 91. | 52056 | 3.0% | 1.4%(+1.63)#91 | 2.1%(+0.852)#7,228 |
| 92. | 51245 | 3.0% | 1.4%(+1.61)#92 | 2.1%(+0.830)#7,312 |
| 93. | 51553 | 3.0% | 1.4%(+1.60)#93 | 2.1%(+0.822)#7,341 |
| 94. | 50142 | 3.0% | 1.4%(+1.60)#94 | 2.1%(+0.822)#7,342 |
| 95. | 52213 | 3.0% | 1.4%(+1.59)#95 | 2.1%(+0.813)#7,376 |
| 96. | 52340 | 2.9% | 1.4%(+1.57)#96 | 2.1%(+0.799)#7,442 |
| 97. | 52568 | 2.9% | 1.4%(+1.57)#97 | 2.1%(+0.793)#7,475 |
| 98. | 50651 | 2.9% | 1.4%(+1.56)#98 | 2.1%(+0.780)#7,524 |
| 99. | 52146 | 2.9% | 1.4%(+1.55)#99 | 2.1%(+0.774)#7,544 |
| 100. | 50650 | 2.9% | 1.4%(+1.55)#100 | 2.1%(+0.774)#7,545 |
Common Questions
What are the Top 10 Zip Codes with the Highest Percentage of Population Employed in Security & Protection in Iowa?
Top 10 Zip Codes with the Highest Percentage of Population Employed in Security & Protection in Iowa are:
What zip code has the Highest Percentage of Population Employed in Security & Protection in Iowa?
52771 has the Highest Percentage of Population Employed in Security & Protection in Iowa with 20.0%.
What is the Percentage of Population Employed in Security & Protection in the State of Iowa?
Percentage of Population Employed in Security & Protection in Iowa is 1.4%.
What is the Percentage of Population Employed in Security & Protection in the United States?
Percentage of Population Employed in Security & Protection in the United States is 2.1%.