Wayland, IA Map & Demographics
Wayland Map
Wayland Overview
$30,315
PER CAPITA INCOME
$83,393
AVG FAMILY INCOME
$66,731
AVG HOUSEHOLD INCOME
45.9%
WAGE / INCOME GAP [ % ]
54.1¢/ $1
WAGE / INCOME GAP [ $ ]
0.31
INEQUALITY / GINI INDEX
1,148
TOTAL POPULATION
503
MALE POPULATION
645
FEMALE POPULATION
77.98
MALES / 100 FEMALES
128.23
FEMALES / 100 MALES
45.3
MEDIAN AGE
3.2
AVG FAMILY SIZE
2.7
AVG HOUSEHOLD SIZE
624
LABOR FORCE [ PEOPLE ]
64.1%
PERCENT IN LABOR FORCE
2.2%
UNEMPLOYMENT RATE
Wayland Zip Codes
Wayland Area Codes
Income in Wayland
Income Overview in Wayland
Per Capita Income in Wayland is $30,315, while median incomes of families and households are $83,393 and $66,731 respectively.
| Characteristic | Number | Measure |
| Per Capita Income | 1,148 | $30,315 |
| Median Family Income | 264 | $83,393 |
| Mean Family Income | 264 | $86,097 |
| Median Household Income | 408 | $66,731 |
| Mean Household Income | 408 | $74,423 |
| Income Deficit | 264 | $0 |
| Wage / Income Gap (%) | 1,148 | 45.91% |
| Wage / Income Gap ($) | 1,148 | 54.09¢ per $1 |
| Gini / Inequality Index | 1,148 | 0.31 |
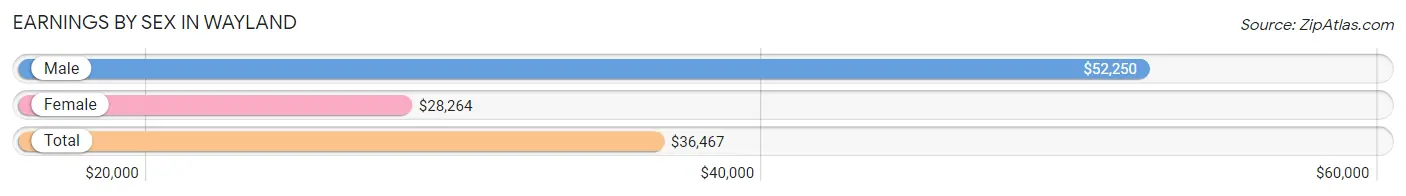
Earnings by Sex in Wayland
Average Earnings in Wayland are $36,467, $52,250 for men and $28,264 for women, a difference of 45.9%.
| Sex | Number | Average Earnings |
| Male | 292 (46.0%) | $52,250 |
| Female | 343 (54.0%) | $28,264 |
| Total | 635 (100.0%) | $36,467 |
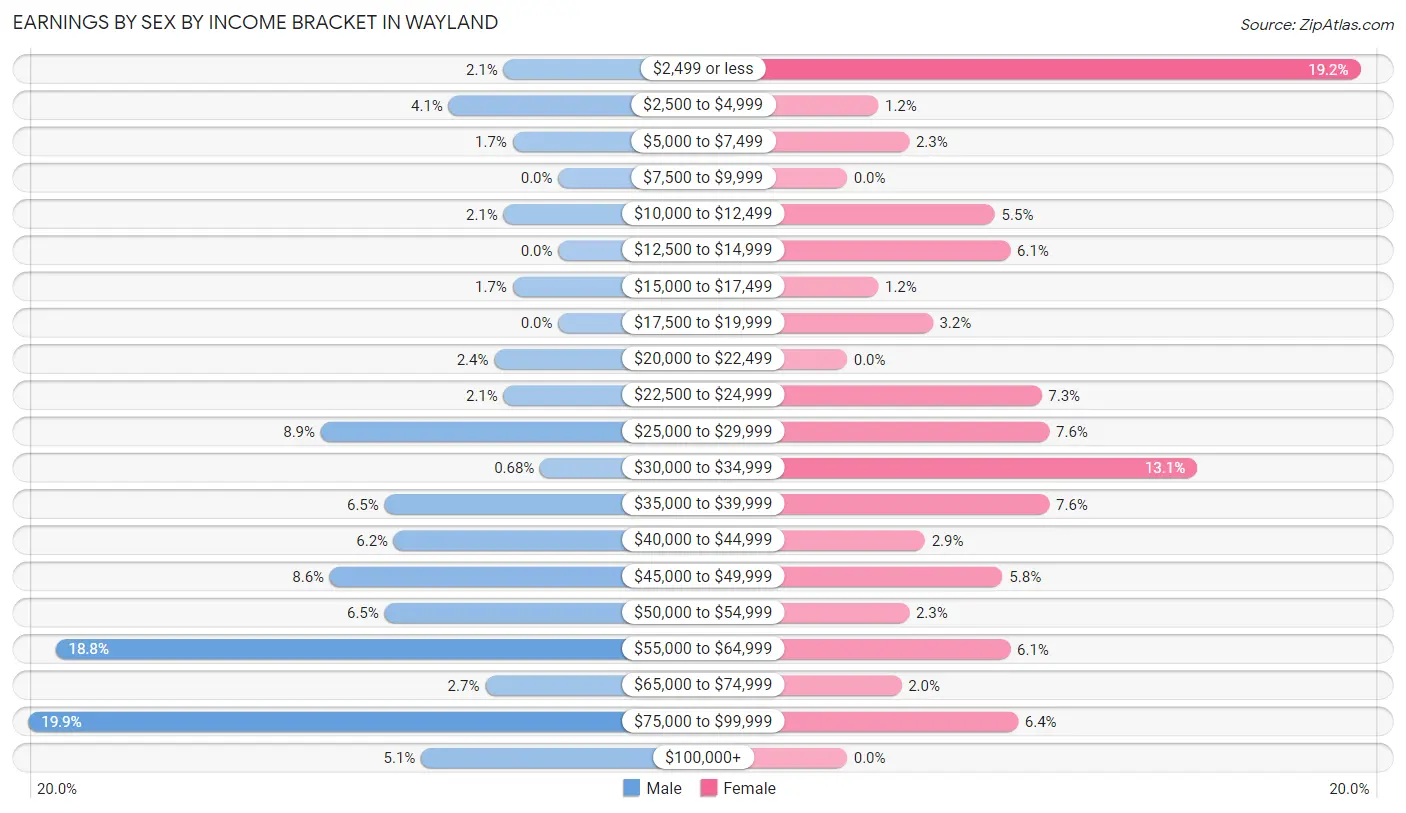
Earnings by Sex by Income Bracket in Wayland
The most common earnings brackets in Wayland are $75,000 to $99,999 for men (58 | 19.9%) and $2,499 or less for women (66 | 19.2%).
| Income | Male | Female |
| $2,499 or less | 6 (2.1%) | 66 (19.2%) |
| $2,500 to $4,999 | 12 (4.1%) | 4 (1.2%) |
| $5,000 to $7,499 | 5 (1.7%) | 8 (2.3%) |
| $7,500 to $9,999 | 0 (0.0%) | 0 (0.0%) |
| $10,000 to $12,499 | 6 (2.1%) | 19 (5.5%) |
| $12,500 to $14,999 | 0 (0.0%) | 21 (6.1%) |
| $15,000 to $17,499 | 5 (1.7%) | 4 (1.2%) |
| $17,500 to $19,999 | 0 (0.0%) | 11 (3.2%) |
| $20,000 to $22,499 | 7 (2.4%) | 0 (0.0%) |
| $22,500 to $24,999 | 6 (2.1%) | 25 (7.3%) |
| $25,000 to $29,999 | 26 (8.9%) | 26 (7.6%) |
| $30,000 to $34,999 | 2 (0.7%) | 45 (13.1%) |
| $35,000 to $39,999 | 19 (6.5%) | 26 (7.6%) |
| $40,000 to $44,999 | 18 (6.2%) | 10 (2.9%) |
| $45,000 to $49,999 | 25 (8.6%) | 20 (5.8%) |
| $50,000 to $54,999 | 19 (6.5%) | 8 (2.3%) |
| $55,000 to $64,999 | 55 (18.8%) | 21 (6.1%) |
| $65,000 to $74,999 | 8 (2.7%) | 7 (2.0%) |
| $75,000 to $99,999 | 58 (19.9%) | 22 (6.4%) |
| $100,000+ | 15 (5.1%) | 0 (0.0%) |
| Total | 292 (100.0%) | 343 (100.0%) |
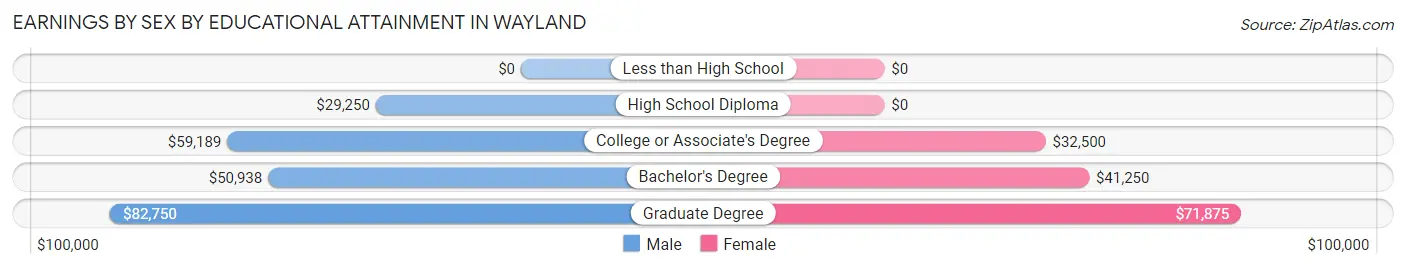
Earnings by Sex by Educational Attainment in Wayland
Average earnings in Wayland are $55,833 for men and $31,071 for women, a difference of 44.4%. Men with an educational attainment of graduate degree enjoy the highest average annual earnings of $82,750, while those with high school diploma education earn the least with $29,250. Women with an educational attainment of graduate degree earn the most with the average annual earnings of $71,875, while those with college or associate's degree education have the smallest earnings of $32,500.
| Educational Attainment | Male Income | Female Income |
| Less than High School | - | - |
| High School Diploma | $29,250 | $0 |
| College or Associate's Degree | $59,189 | $32,500 |
| Bachelor's Degree | $50,938 | $41,250 |
| Graduate Degree | $82,750 | $71,875 |
| Total | $55,833 | $31,071 |
Family Income in Wayland
Family Income Brackets in Wayland
According to the Wayland family income data, there are 87 families falling into the $100,000 to $149,999 income range, which is the most common income bracket and makes up 33.0% of all families.
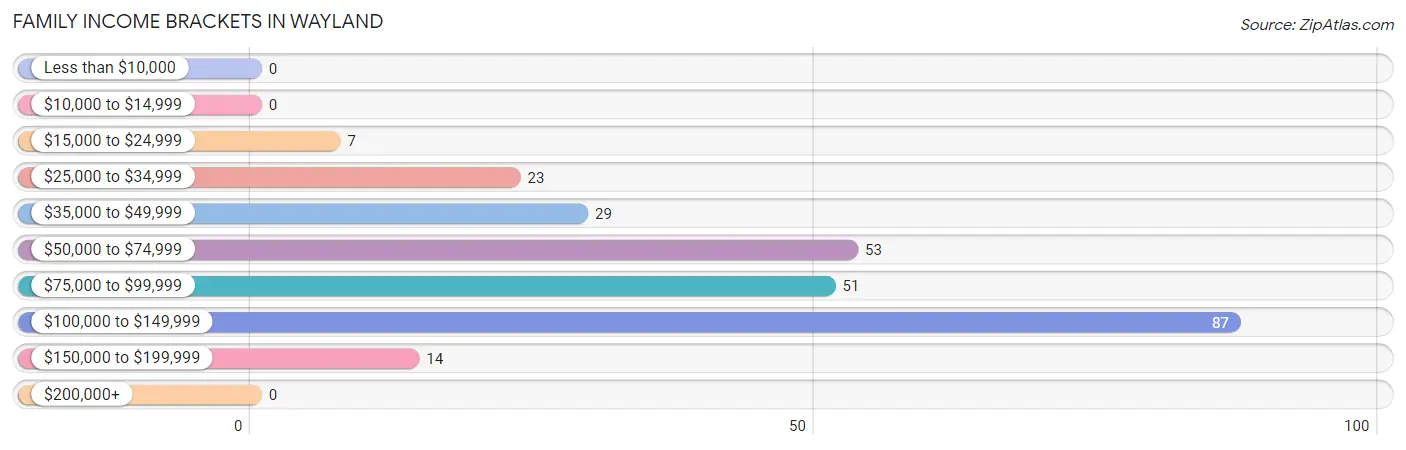
| Income Bracket | # Families | % Families |
| Less than $10,000 | 0 | 0.0% |
| $10,000 to $14,999 | 0 | 0.0% |
| $15,000 to $24,999 | 7 | 2.7% |
| $25,000 to $34,999 | 23 | 8.7% |
| $35,000 to $49,999 | 29 | 11.0% |
| $50,000 to $74,999 | 53 | 20.1% |
| $75,000 to $99,999 | 51 | 19.3% |
| $100,000 to $149,999 | 87 | 33.0% |
| $150,000 to $199,999 | 14 | 5.3% |
| $200,000+ | 0 | 0.0% |
Family Income by Famaliy Size in Wayland
4-person families (40 | 15.1%) account for the highest median family income in Wayland with $135,250 per family, while 2-person families (148 | 56.1%) have the highest median income of $40,625 per family member.
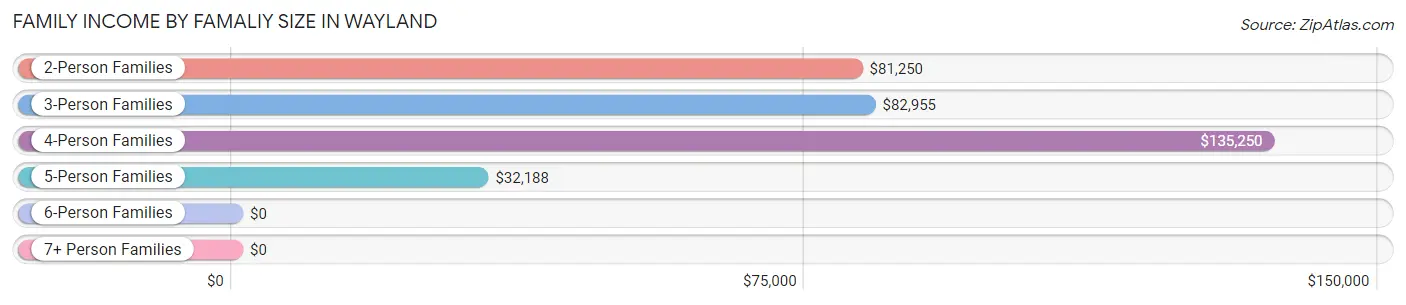
| Income Bracket | # Families | Median Income |
| 2-Person Families | 148 (56.1%) | $81,250 |
| 3-Person Families | 58 (22.0%) | $82,955 |
| 4-Person Families | 40 (15.1%) | $135,250 |
| 5-Person Families | 13 (4.9%) | $32,188 |
| 6-Person Families | 5 (1.9%) | $0 |
| 7+ Person Families | 0 (0.0%) | $0 |
| Total | 264 (100.0%) | $83,393 |
Family Income by Number of Earners in Wayland
The median family income in Wayland is $83,393, with families comprising 3+ earners (19) having the highest median family income of $134,583, while families with no earners (34) have the lowest median family income of $52,500, accounting for 7.2% and 12.9% of families, respectively.
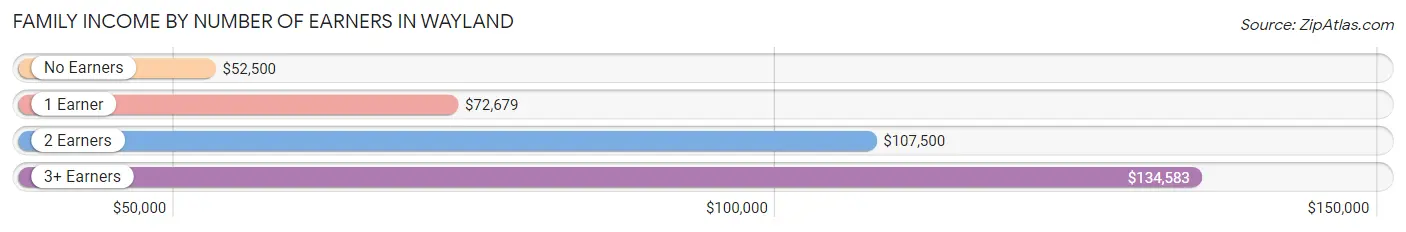
| Number of Earners | # Families | Median Income |
| No Earners | 34 (12.9%) | $52,500 |
| 1 Earner | 73 (27.7%) | $72,679 |
| 2 Earners | 138 (52.3%) | $107,500 |
| 3+ Earners | 19 (7.2%) | $134,583 |
| Total | 264 (100.0%) | $83,393 |
Household Income in Wayland
Household Income Brackets in Wayland
With 107 households falling in the category, the $100,000 to $149,999 income range is the most frequent in Wayland, accounting for 26.2% of all households.
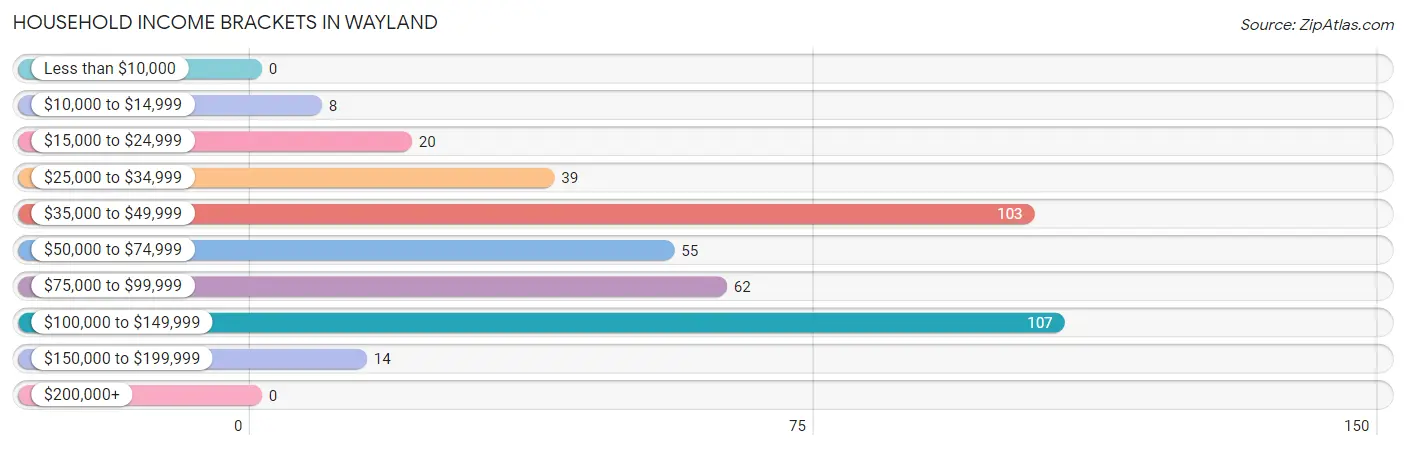
| Income Bracket | # Households | % Households |
| Less than $10,000 | 0 | 0.0% |
| $10,000 to $14,999 | 8 | 2.0% |
| $15,000 to $24,999 | 20 | 4.9% |
| $25,000 to $34,999 | 39 | 9.6% |
| $35,000 to $49,999 | 103 | 25.2% |
| $50,000 to $74,999 | 55 | 13.5% |
| $75,000 to $99,999 | 62 | 15.2% |
| $100,000 to $149,999 | 107 | 26.2% |
| $150,000 to $199,999 | 14 | 3.4% |
| $200,000+ | 0 | 0.0% |
Household Income by Householder Age in Wayland
The median household income in Wayland is $66,731, with the highest median household income of $83,875 found in the 45 to 64 years age bracket for the primary householder. A total of 159 households (39.0%) fall into this category. Meanwhile, the 15 to 24 years age bracket for the primary householder has the lowest median household income of $45,313, with 36 households (8.8%) in this group.
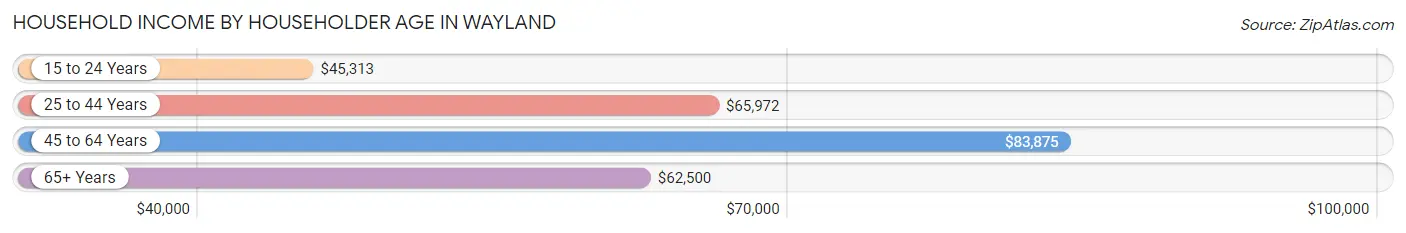
| Income Bracket | # Households | Median Income |
| 15 to 24 Years | 36 (8.8%) | $45,313 |
| 25 to 44 Years | 95 (23.3%) | $65,972 |
| 45 to 64 Years | 159 (39.0%) | $83,875 |
| 65+ Years | 118 (28.9%) | $62,500 |
| Total | 408 (100.0%) | $66,731 |
Poverty in Wayland
Income Below Poverty by Sex and Age in Wayland
With 4.4% poverty level for males and 14.0% for females among the residents of Wayland, 5 year old males and 18 to 24 year old females are the most vulnerable to poverty, with 3 males (100.0%) and 23 females (39.7%) in their respective age groups living below the poverty level.
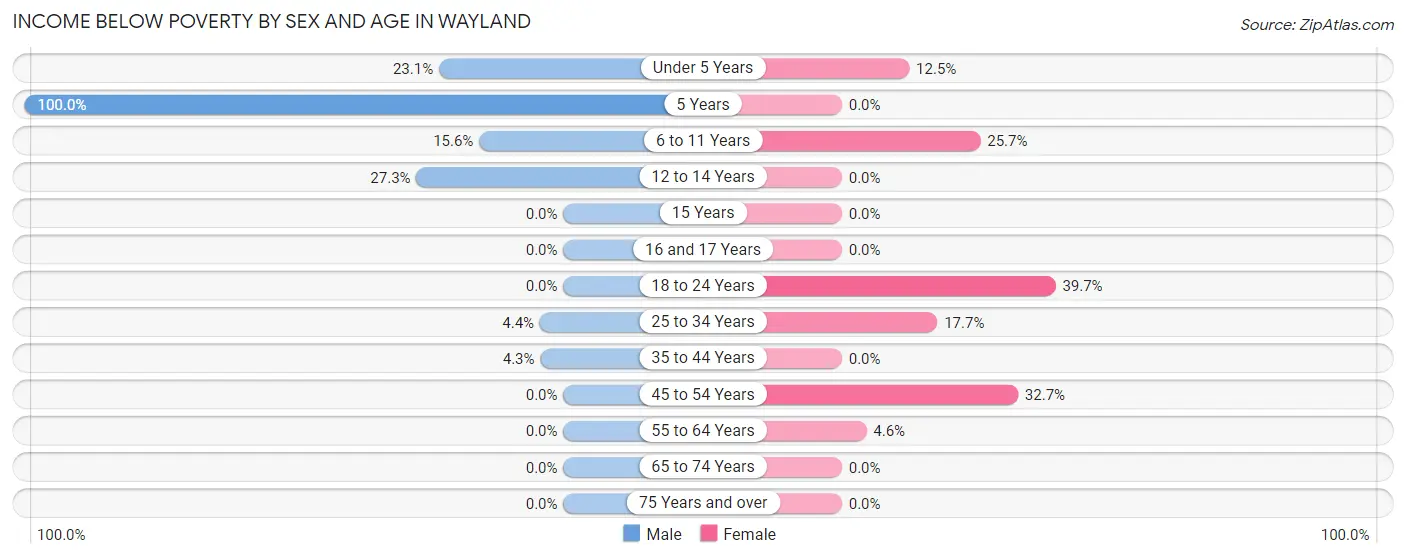
| Age Bracket | Male | Female |
| Under 5 Years | 6 (23.1%) | 3 (12.5%) |
| 5 Years | 3 (100.0%) | 0 (0.0%) |
| 6 to 11 Years | 5 (15.6%) | 9 (25.7%) |
| 12 to 14 Years | 3 (27.3%) | 0 (0.0%) |
| 15 Years | 0 (0.0%) | 0 (0.0%) |
| 16 and 17 Years | 0 (0.0%) | 0 (0.0%) |
| 18 to 24 Years | 0 (0.0%) | 23 (39.7%) |
| 25 to 34 Years | 2 (4.3%) | 14 (17.7%) |
| 35 to 44 Years | 2 (4.3%) | 0 (0.0%) |
| 45 to 54 Years | 0 (0.0%) | 34 (32.7%) |
| 55 to 64 Years | 0 (0.0%) | 3 (4.5%) |
| 65 to 74 Years | 0 (0.0%) | 0 (0.0%) |
| 75 Years and over | 0 (0.0%) | 0 (0.0%) |
| Total | 21 (4.4%) | 86 (14.0%) |
Income Above Poverty by Sex and Age in Wayland
According to the poverty statistics in Wayland, males aged 16 and 17 years and females aged 12 to 14 years are the age groups that are most secure financially, with 100.0% of males and 100.0% of females in these age groups living above the poverty line.
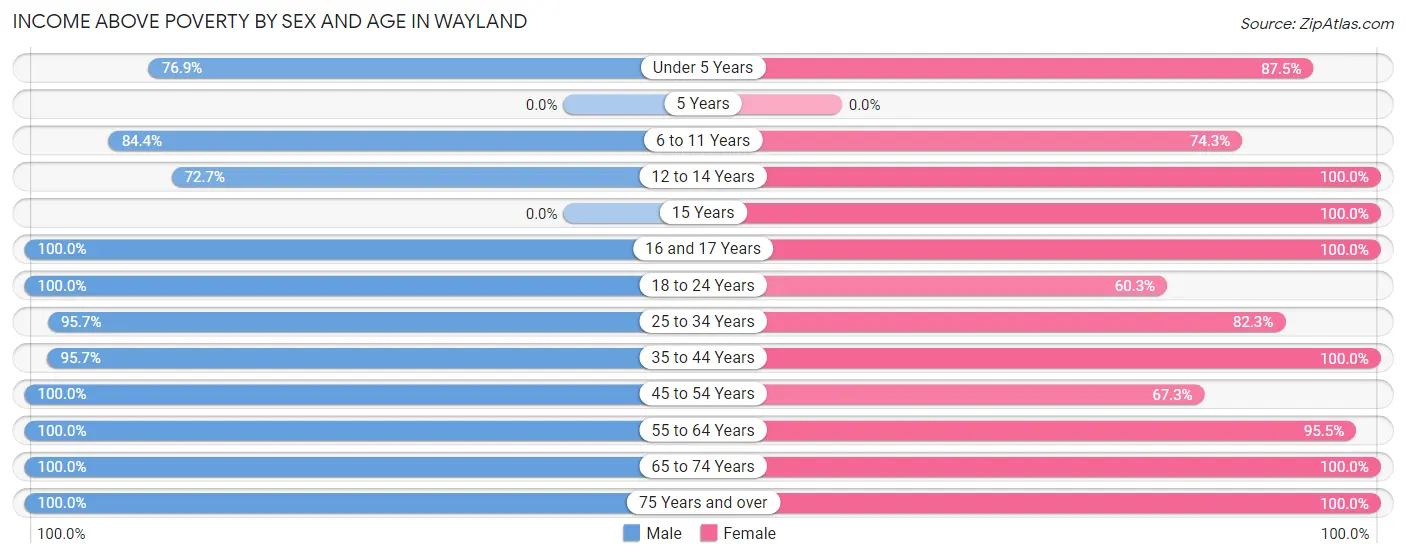
| Age Bracket | Male | Female |
| Under 5 Years | 20 (76.9%) | 21 (87.5%) |
| 5 Years | 0 (0.0%) | 0 (0.0%) |
| 6 to 11 Years | 27 (84.4%) | 26 (74.3%) |
| 12 to 14 Years | 8 (72.7%) | 24 (100.0%) |
| 15 Years | 0 (0.0%) | 4 (100.0%) |
| 16 and 17 Years | 4 (100.0%) | 23 (100.0%) |
| 18 to 24 Years | 40 (100.0%) | 35 (60.3%) |
| 25 to 34 Years | 44 (95.7%) | 65 (82.3%) |
| 35 to 44 Years | 45 (95.7%) | 88 (100.0%) |
| 45 to 54 Years | 109 (100.0%) | 70 (67.3%) |
| 55 to 64 Years | 100 (100.0%) | 63 (95.5%) |
| 65 to 74 Years | 26 (100.0%) | 51 (100.0%) |
| 75 Years and over | 35 (100.0%) | 59 (100.0%) |
| Total | 458 (95.6%) | 529 (86.0%) |
Income Below Poverty Among Married-Couple Families in Wayland
The poverty statistics for married-couple families in Wayland show that 3.4% or 7 of the total 207 families live below the poverty line. Families with 3 or 4 children have the highest poverty rate of 53.8%, comprising of 7 families. On the other hand, families with no children have the lowest poverty rate of 0.0%, which includes 0 families.
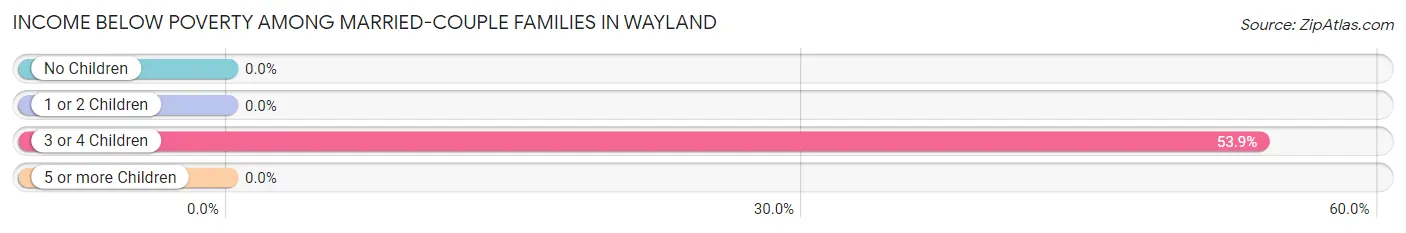
| Children | Above Poverty | Below Poverty |
| No Children | 140 (100.0%) | 0 (0.0%) |
| 1 or 2 Children | 54 (100.0%) | 0 (0.0%) |
| 3 or 4 Children | 6 (46.2%) | 7 (53.8%) |
| 5 or more Children | 0 (0.0%) | 0 (0.0%) |
| Total | 200 (96.6%) | 7 (3.4%) |
Income Below Poverty Among Single-Parent Households in Wayland
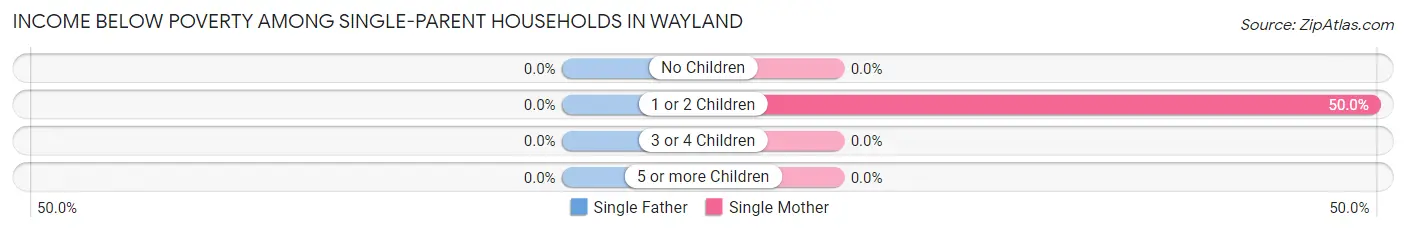
| Children | Single Father | Single Mother |
| No Children | 0 (0.0%) | 0 (0.0%) |
| 1 or 2 Children | 0 (0.0%) | 7 (50.0%) |
| 3 or 4 Children | 0 (0.0%) | 0 (0.0%) |
| 5 or more Children | 0 (0.0%) | 0 (0.0%) |
| Total | 0 (0.0%) | 7 (18.9%) |
Income Below Poverty Among Married-Couple vs Single-Parent Households in Wayland
The poverty data for Wayland shows that 7 of the married-couple family households (3.4%) and 7 of the single-parent households (12.3%) are living below the poverty level. Within the married-couple family households, those with 3 or 4 children have the highest poverty rate, with 7 households (53.8%) falling below the poverty line. Among the single-parent households, those with 1 or 2 children have the highest poverty rate, with 7 household (31.8%) living below poverty.
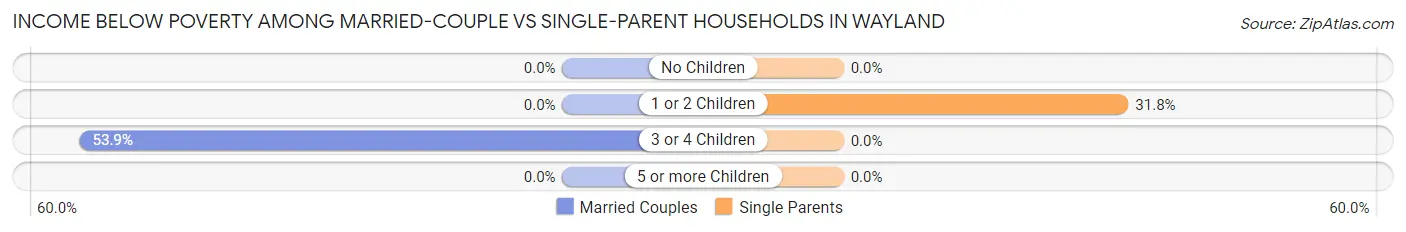
| Children | Married-Couple Families | Single-Parent Households |
| No Children | 0 (0.0%) | 0 (0.0%) |
| 1 or 2 Children | 0 (0.0%) | 7 (31.8%) |
| 3 or 4 Children | 7 (53.8%) | 0 (0.0%) |
| 5 or more Children | 0 (0.0%) | 0 (0.0%) |
| Total | 7 (3.4%) | 7 (12.3%) |
Race in Wayland
The most populous races in Wayland are White / Caucasian (1,067 | 92.9%), Two or more Races (79 | 6.9%), and Hispanic or Latino (4 | 0.4%).
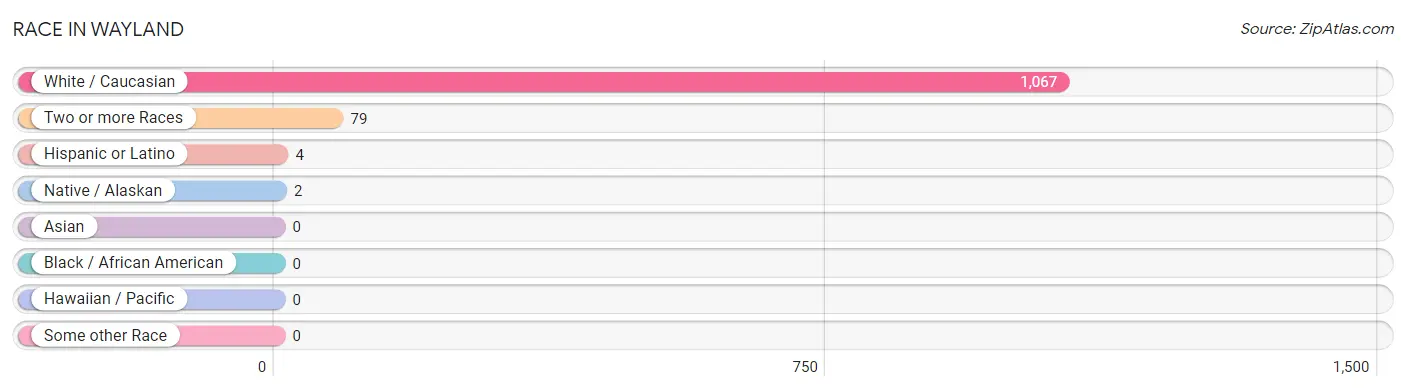
| Race | # Population | % Population |
| Asian | 0 | 0.0% |
| Black / African American | 0 | 0.0% |
| Hawaiian / Pacific | 0 | 0.0% |
| Hispanic or Latino | 4 | 0.4% |
| Native / Alaskan | 2 | 0.2% |
| White / Caucasian | 1,067 | 92.9% |
| Two or more Races | 79 | 6.9% |
| Some other Race | 0 | 0.0% |
| Total | 1,148 | 100.0% |
Ancestry in Wayland
The most populous ancestries reported in Wayland are German (405 | 35.3%), Irish (130 | 11.3%), English (111 | 9.7%), American (98 | 8.5%), and Norwegian (42 | 3.7%), together accounting for 68.5% of all Wayland residents.
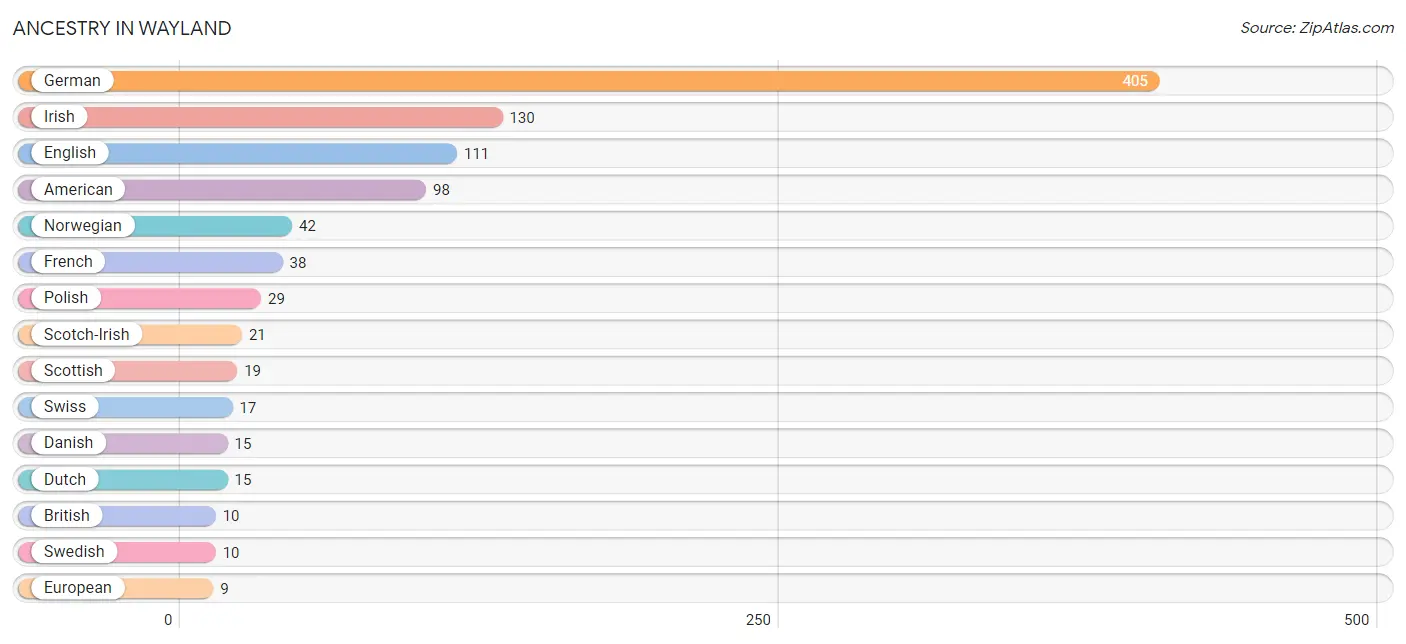
| Ancestry | # Population | % Population |
| American | 98 | 8.5% |
| Arab | 7 | 0.6% |
| Bhutanese | 6 | 0.5% |
| British | 10 | 0.9% |
| Cherokee | 2 | 0.2% |
| Cheyenne | 4 | 0.4% |
| Danish | 15 | 1.3% |
| Dutch | 15 | 1.3% |
| Egyptian | 7 | 0.6% |
| English | 111 | 9.7% |
| European | 9 | 0.8% |
| French | 38 | 3.3% |
| German | 405 | 35.3% |
| Irish | 130 | 11.3% |
| Italian | 9 | 0.8% |
| Mexican | 4 | 0.4% |
| Norwegian | 42 | 3.7% |
| Polish | 29 | 2.5% |
| Russian | 4 | 0.4% |
| Scotch-Irish | 21 | 1.8% |
| Scottish | 19 | 1.7% |
| Sioux | 5 | 0.4% |
| Swedish | 10 | 0.9% |
| Swiss | 17 | 1.5% |
| Welsh | 4 | 0.4% | View All 25 Rows |
Immigrants in Wayland

| Immigration Origin | # Population | % Population | View All 0 Rows |
Sex and Age in Wayland
Sex and Age in Wayland
The most populous age groups in Wayland are 60 to 64 Years (70 | 13.9%) for men and 35 to 39 Years (78 | 12.1%) for women.
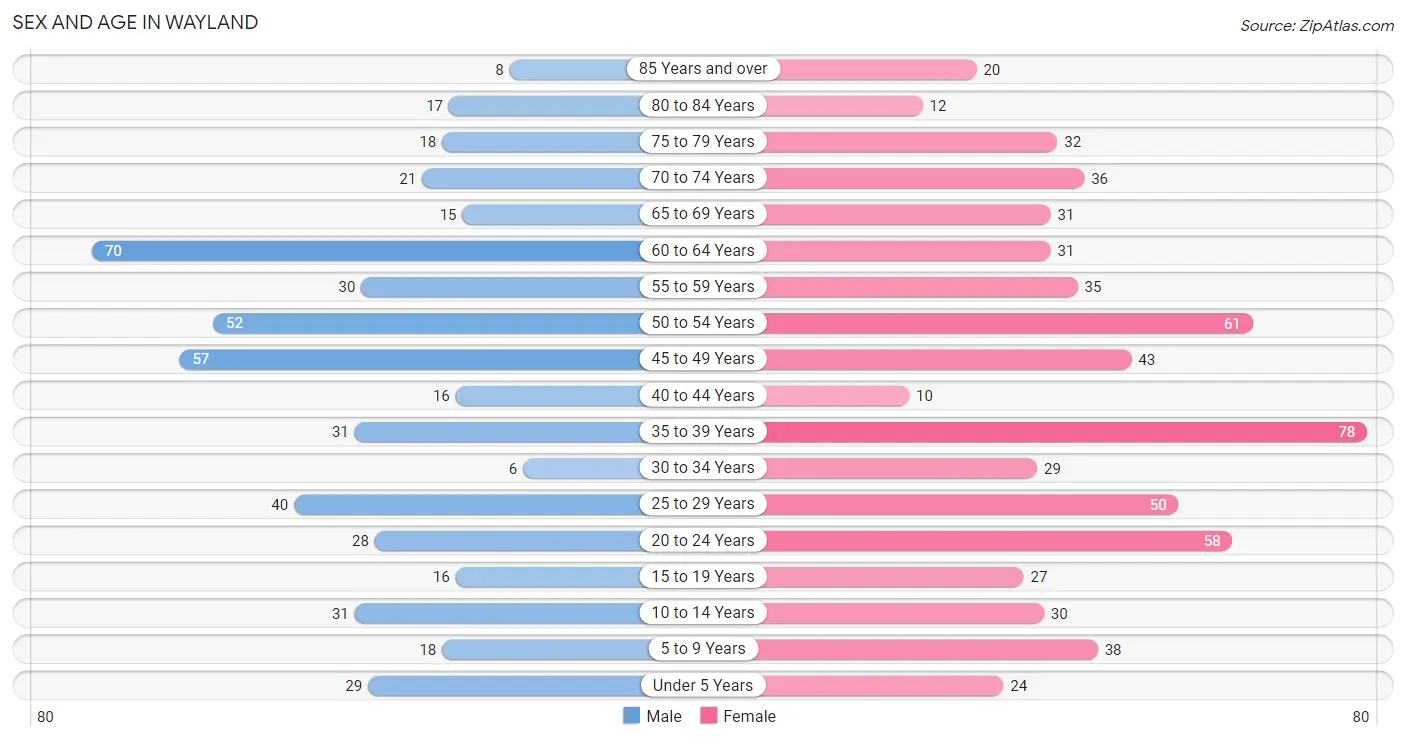
| Age Bracket | Male | Female |
| Under 5 Years | 29 (5.8%) | 24 (3.7%) |
| 5 to 9 Years | 18 (3.6%) | 38 (5.9%) |
| 10 to 14 Years | 31 (6.2%) | 30 (4.6%) |
| 15 to 19 Years | 16 (3.2%) | 27 (4.2%) |
| 20 to 24 Years | 28 (5.6%) | 58 (9.0%) |
| 25 to 29 Years | 40 (8.0%) | 50 (7.7%) |
| 30 to 34 Years | 6 (1.2%) | 29 (4.5%) |
| 35 to 39 Years | 31 (6.2%) | 78 (12.1%) |
| 40 to 44 Years | 16 (3.2%) | 10 (1.5%) |
| 45 to 49 Years | 57 (11.3%) | 43 (6.7%) |
| 50 to 54 Years | 52 (10.3%) | 61 (9.5%) |
| 55 to 59 Years | 30 (6.0%) | 35 (5.4%) |
| 60 to 64 Years | 70 (13.9%) | 31 (4.8%) |
| 65 to 69 Years | 15 (3.0%) | 31 (4.8%) |
| 70 to 74 Years | 21 (4.2%) | 36 (5.6%) |
| 75 to 79 Years | 18 (3.6%) | 32 (5.0%) |
| 80 to 84 Years | 17 (3.4%) | 12 (1.9%) |
| 85 Years and over | 8 (1.6%) | 20 (3.1%) |
| Total | 503 (100.0%) | 645 (100.0%) |
Families and Households in Wayland
Median Family Size in Wayland
The median family size in Wayland is 3.23 persons per family, with single female/mother families (37 | 14.0%) accounting for the largest median family size of 4.62 persons per family. On the other hand, single male/father families (20 | 7.6%) represent the smallest median family size with 2.80 persons per family.
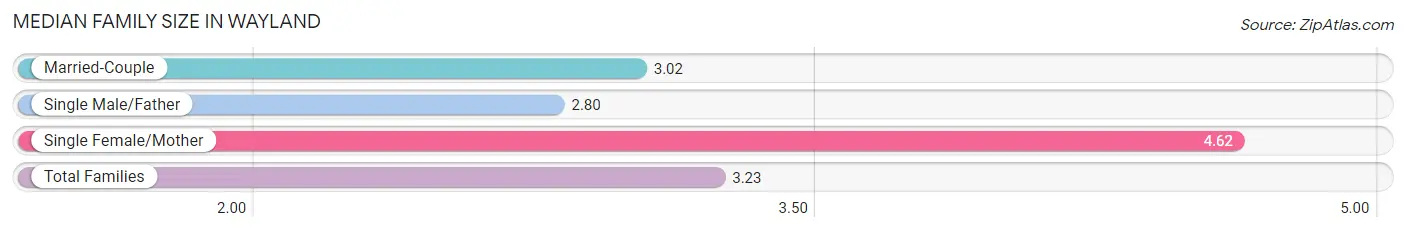
| Family Type | # Families | Family Size |
| Married-Couple | 207 (78.4%) | 3.02 |
| Single Male/Father | 20 (7.6%) | 2.80 |
| Single Female/Mother | 37 (14.0%) | 4.62 |
| Total Families | 264 (100.0%) | 3.23 |
Median Household Size in Wayland
The median household size in Wayland is 2.72 persons per household, with single female/mother households (37 | 9.1%) accounting for the largest median household size of 5.08 persons per household. non-family households (144 | 35.3%) represent the smallest median household size with 1.60 persons per household.
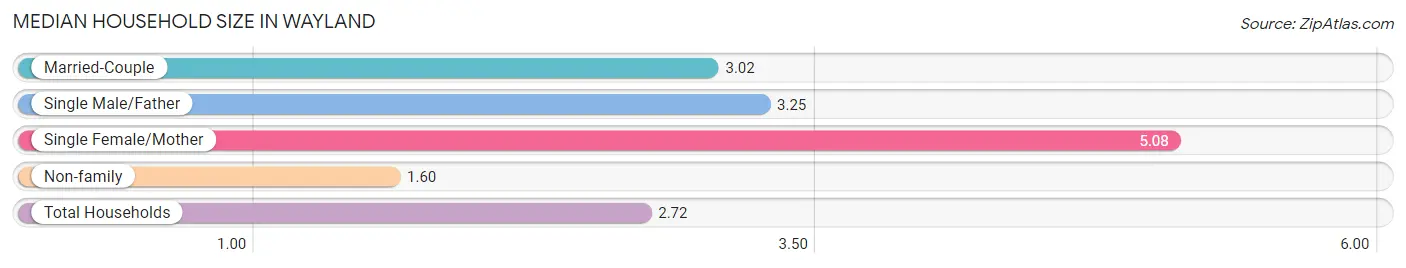
| Household Type | # Households | Household Size |
| Married-Couple | 207 (50.7%) | 3.02 |
| Single Male/Father | 20 (4.9%) | 3.25 |
| Single Female/Mother | 37 (9.1%) | 5.08 |
| Non-family | 144 (35.3%) | 1.60 |
| Total Households | 408 (100.0%) | 2.72 |
Household Size by Marriage Status in Wayland
Out of a total of 408 households in Wayland, 264 (64.7%) are family households, while 144 (35.3%) are nonfamily households. The most numerous type of family households are 2-person households, comprising 148, and the most common type of nonfamily households are 1-person households, comprising 87.
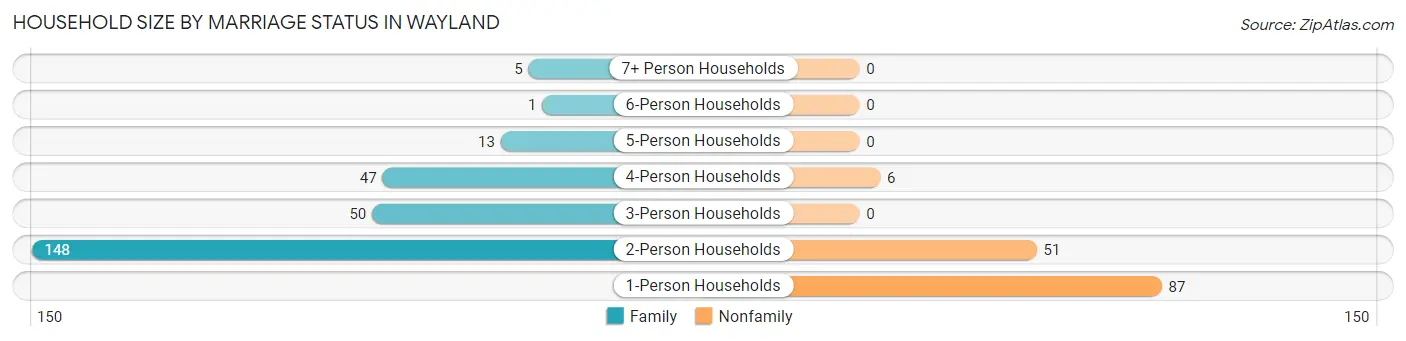
| Household Size | Family Households | Nonfamily Households |
| 1-Person Households | - | 87 (21.3%) |
| 2-Person Households | 148 (36.3%) | 51 (12.5%) |
| 3-Person Households | 50 (12.2%) | 0 (0.0%) |
| 4-Person Households | 47 (11.5%) | 6 (1.5%) |
| 5-Person Households | 13 (3.2%) | 0 (0.0%) |
| 6-Person Households | 1 (0.3%) | 0 (0.0%) |
| 7+ Person Households | 5 (1.2%) | 0 (0.0%) |
| Total | 264 (64.7%) | 144 (35.3%) |
Female Fertility in Wayland
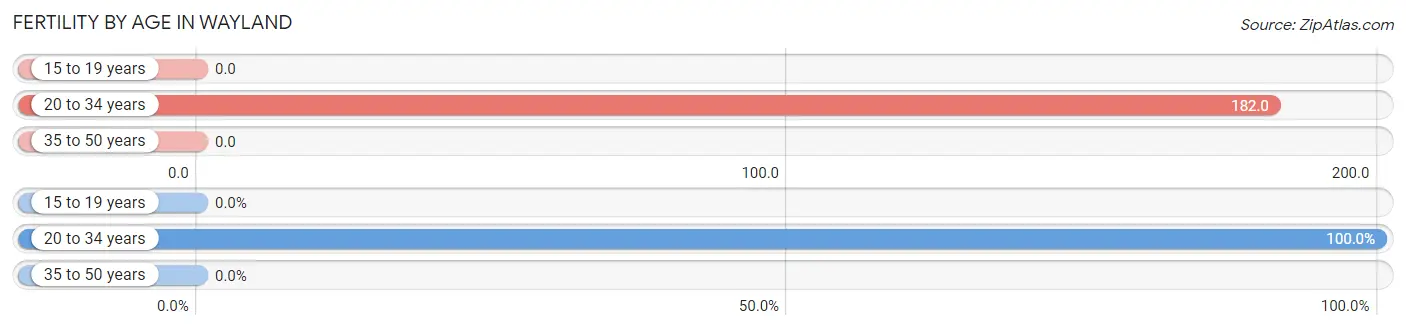
Fertility by Age in Wayland
Average fertility rate in Wayland is 83.0 births per 1,000 women. Women in the age bracket of 20 to 34 years have the highest fertility rate with 182.0 births per 1,000 women. Women in the age bracket of 20 to 34 years acount for 100.0% of all women with births.
| Age Bracket | Women with Births | Births / 1,000 Women |
| 15 to 19 years | 0 (0.0%) | 0.0 |
| 20 to 34 years | 25 (100.0%) | 182.0 |
| 35 to 50 years | 0 (0.0%) | 0.0 |
| Total | 25 (100.0%) | 83.0 |
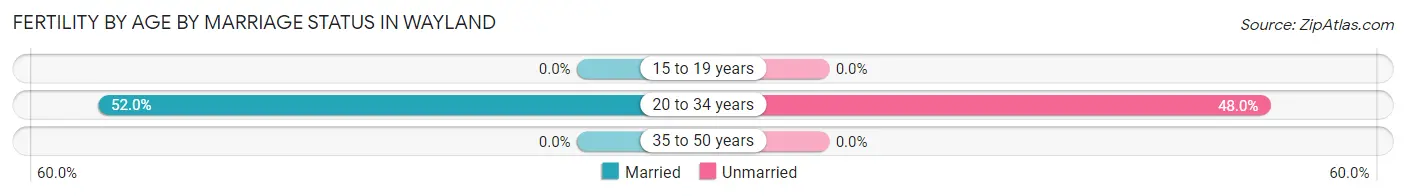
Fertility by Age by Marriage Status in Wayland
52.0% of women with births (25) in Wayland are married. The highest percentage of unmarried women with births falls into 20 to 34 years age bracket with 48.0% of them unmarried at the time of birth, while the lowest percentage of unmarried women with births belong to 20 to 34 years age bracket with 48.0% of them unmarried.
| Age Bracket | Married | Unmarried |
| 15 to 19 years | 0 (0.0%) | 0 (0.0%) |
| 20 to 34 years | 13 (52.0%) | 12 (48.0%) |
| 35 to 50 years | 0 (0.0%) | 0 (0.0%) |
| Total | 13 (52.0%) | 12 (48.0%) |
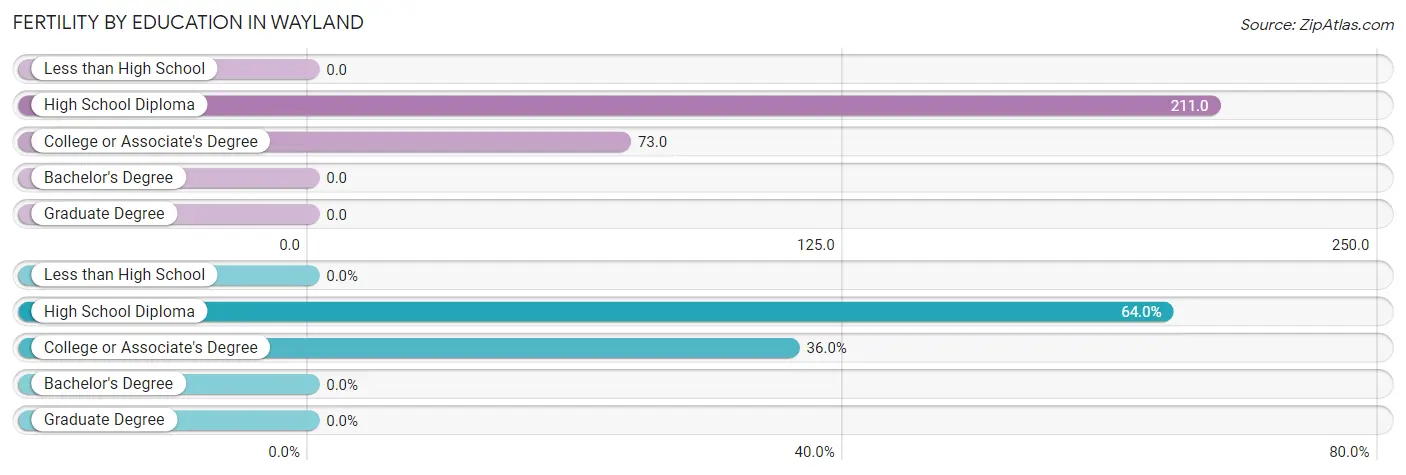
Fertility by Education in Wayland
| Educational Attainment | Women with Births | Births / 1,000 Women |
| Less than High School | 0 (0.0%) | 0.0 |
| High School Diploma | 16 (64.0%) | 211.0 |
| College or Associate's Degree | 9 (36.0%) | 73.0 |
| Bachelor's Degree | 0 (0.0%) | 0.0 |
| Graduate Degree | 0 (0.0%) | 0.0 |
| Total | 25 (100.0%) | 83.0 |
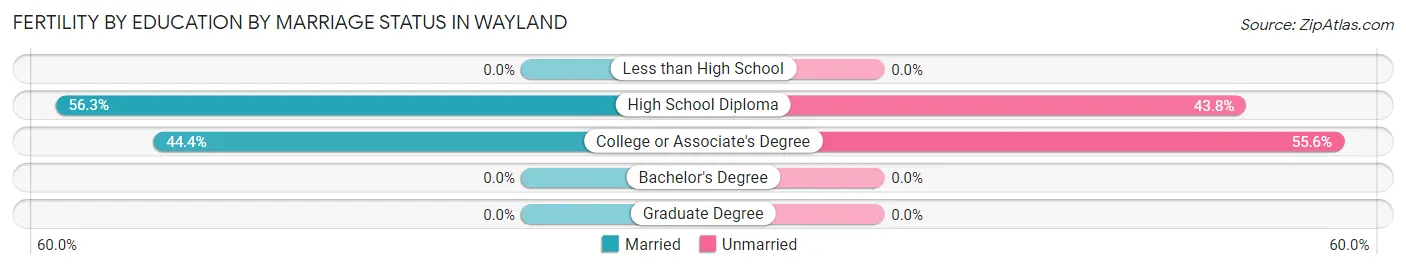
Fertility by Education by Marriage Status in Wayland
48.0% of women with births in Wayland are unmarried. Women with the educational attainment of high school diploma are most likely to be married with 56.2% of them married at childbirth, while women with the educational attainment of college or associate's degree are least likely to be married with 55.6% of them unmarried at childbirth.
| Educational Attainment | Married | Unmarried |
| Less than High School | 0 (0.0%) | 0 (0.0%) |
| High School Diploma | 9 (56.2%) | 7 (43.8%) |
| College or Associate's Degree | 4 (44.4%) | 5 (55.6%) |
| Bachelor's Degree | 0 (0.0%) | 0 (0.0%) |
| Graduate Degree | 0 (0.0%) | 0 (0.0%) |
| Total | 13 (52.0%) | 12 (48.0%) |
Employment Characteristics in Wayland
Employment by Class of Employer in Wayland
Among the 581 employed individuals in Wayland, private company employees (340 | 58.5%), local government employees (77 | 13.3%), and self-employed (not incorporated) (60 | 10.3%) make up the most common classes of employment.
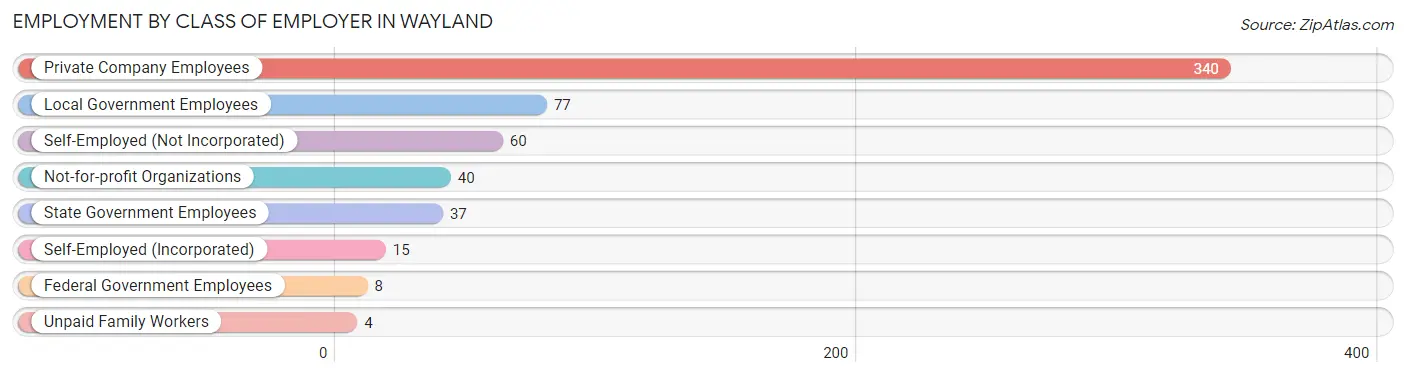
| Employer Class | # Employees | % Employees |
| Private Company Employees | 340 | 58.5% |
| Self-Employed (Incorporated) | 15 | 2.6% |
| Self-Employed (Not Incorporated) | 60 | 10.3% |
| Not-for-profit Organizations | 40 | 6.9% |
| Local Government Employees | 77 | 13.3% |
| State Government Employees | 37 | 6.4% |
| Federal Government Employees | 8 | 1.4% |
| Unpaid Family Workers | 4 | 0.7% |
| Total | 581 | 100.0% |
Employment Status by Age in Wayland
According to the labor force statistics for Wayland, out of the total population over 16 years of age (974), 64.1% or 624 individuals are in the labor force, with 2.2% or 14 of them unemployed. The age group with the highest labor force participation rate is 20 to 24 years, with 95.3% or 82 individuals in the labor force. Within the labor force, the 25 to 29 years age range has the highest percentage of unemployed individuals, with 8.4% or 7 of them being unemployed.
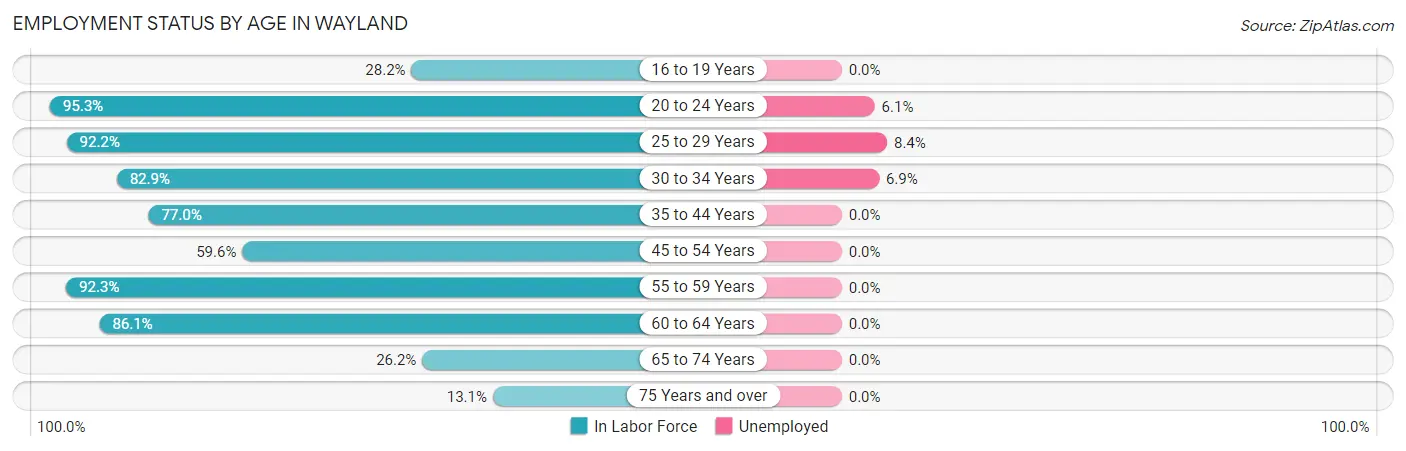
| Age Bracket | In Labor Force | Unemployed |
| 16 to 19 Years | 11 (28.2%) | 0 (0.0%) |
| 20 to 24 Years | 82 (95.3%) | 5 (6.1%) |
| 25 to 29 Years | 83 (92.2%) | 7 (8.4%) |
| 30 to 34 Years | 29 (82.9%) | 2 (6.9%) |
| 35 to 44 Years | 104 (77.0%) | 0 (0.0%) |
| 45 to 54 Years | 127 (59.6%) | 0 (0.0%) |
| 55 to 59 Years | 60 (92.3%) | 0 (0.0%) |
| 60 to 64 Years | 87 (86.1%) | 0 (0.0%) |
| 65 to 74 Years | 27 (26.2%) | 0 (0.0%) |
| 75 Years and over | 14 (13.1%) | 0 (0.0%) |
| Total | 624 (64.1%) | 14 (2.2%) |
Employment Status by Educational Attainment in Wayland
According to labor force statistics for Wayland, 76.7% of individuals (490) out of the total population between 25 and 64 years of age (639) are in the labor force, with 1.8% or 9 of them being unemployed. The group with the highest labor force participation rate are those with the educational attainment of high school diploma, with 90.9% or 190 individuals in the labor force. Within the labor force, individuals with college / associate degree education have the highest percentage of unemployment, with 3.4% or 7 of them being unemployed.
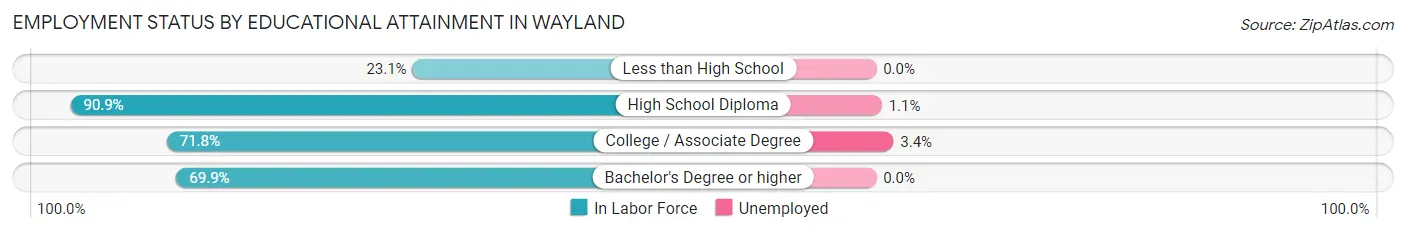
| Educational Attainment | In Labor Force | Unemployed |
| Less than High School | 3 (23.1%) | 0 (0.0%) |
| High School Diploma | 190 (90.9%) | 2 (1.1%) |
| College / Associate Degree | 204 (71.8%) | 10 (3.4%) |
| Bachelor's Degree or higher | 93 (69.9%) | 0 (0.0%) |
| Total | 490 (76.7%) | 12 (1.8%) |
Employment Occupations by Sex in Wayland
Management, Business, Science and Arts Occupations
The most common Management, Business, Science and Arts occupations in Wayland are Community & Social Service (37 | 6.1%), Health Diagnosing & Treating (35 | 5.7%), Management (29 | 4.8%), Health Technologists (29 | 4.8%), and Education Instruction & Library (25 | 4.1%).
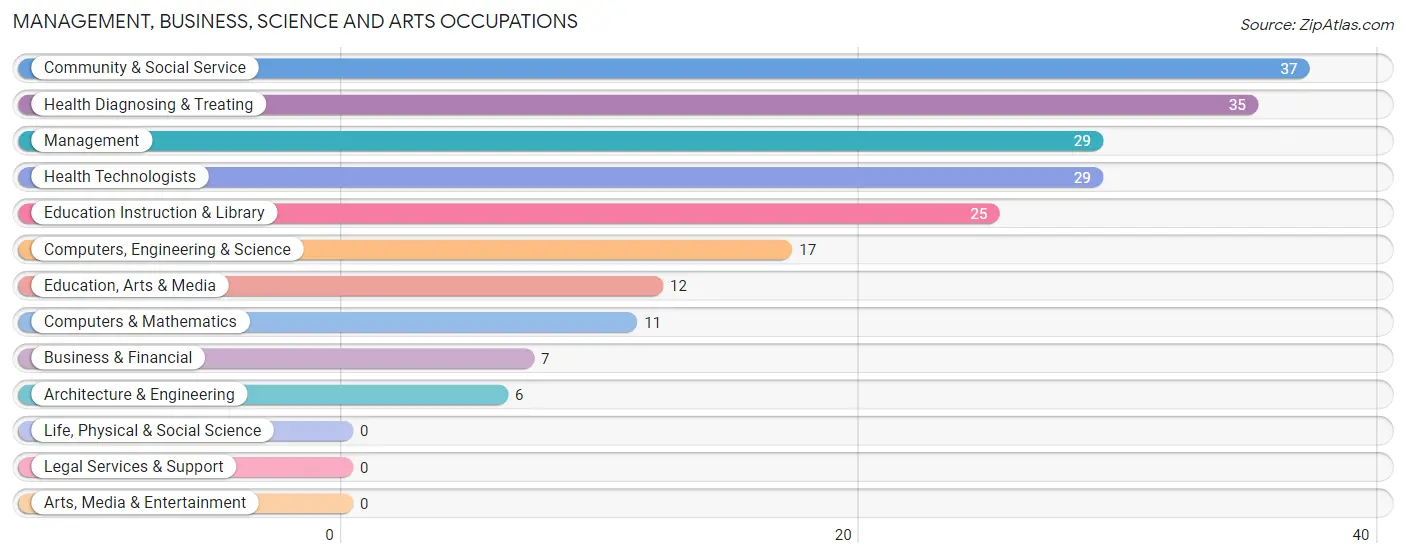
Management, Business, Science and Arts Occupations by Sex
Within the Management, Business, Science and Arts occupations in Wayland, the most male-oriented occupations are Computers, Engineering & Science (100.0%), Computers & Mathematics (100.0%), and Architecture & Engineering (100.0%), while the most female-oriented occupations are Education, Arts & Media (100.0%), Health Diagnosing & Treating (91.4%), and Health Technologists (89.7%).
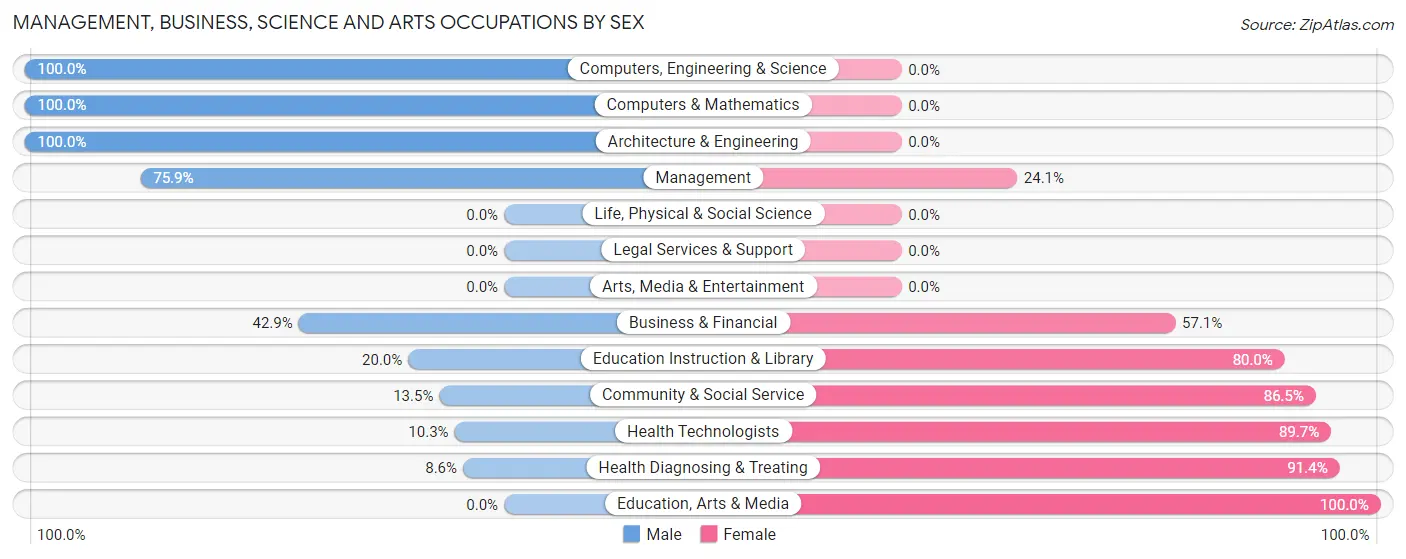
| Occupation | Male | Female |
| Management | 22 (75.9%) | 7 (24.1%) |
| Business & Financial | 3 (42.9%) | 4 (57.1%) |
| Computers, Engineering & Science | 17 (100.0%) | 0 (0.0%) |
| Computers & Mathematics | 11 (100.0%) | 0 (0.0%) |
| Architecture & Engineering | 6 (100.0%) | 0 (0.0%) |
| Life, Physical & Social Science | 0 (0.0%) | 0 (0.0%) |
| Community & Social Service | 5 (13.5%) | 32 (86.5%) |
| Education, Arts & Media | 0 (0.0%) | 12 (100.0%) |
| Legal Services & Support | 0 (0.0%) | 0 (0.0%) |
| Education Instruction & Library | 5 (20.0%) | 20 (80.0%) |
| Arts, Media & Entertainment | 0 (0.0%) | 0 (0.0%) |
| Health Diagnosing & Treating | 3 (8.6%) | 32 (91.4%) |
| Health Technologists | 3 (10.3%) | 26 (89.7%) |
| Total (Category) | 50 (40.0%) | 75 (60.0%) |
| Total (Overall) | 283 (46.4%) | 327 (53.6%) |
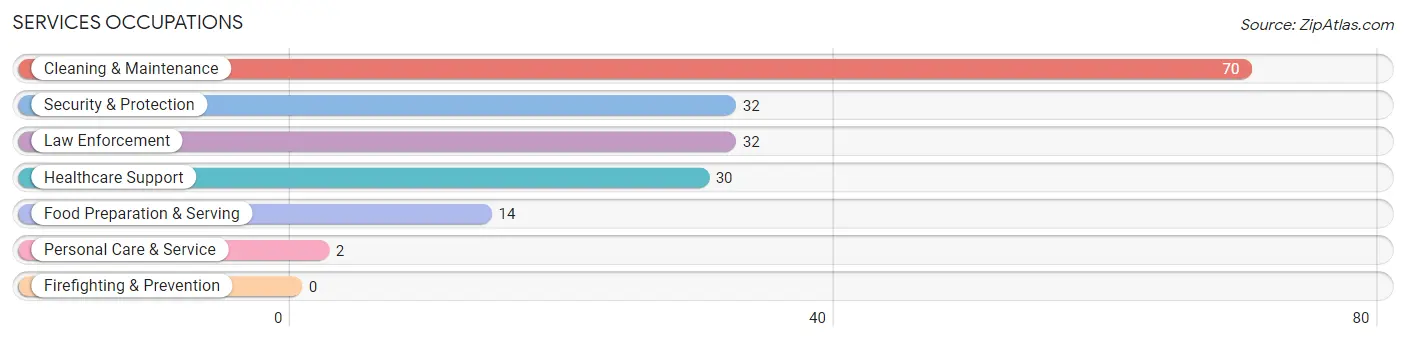
Services Occupations
The most common Services occupations in Wayland are Cleaning & Maintenance (70 | 11.5%), Security & Protection (32 | 5.2%), Law Enforcement (32 | 5.2%), Healthcare Support (30 | 4.9%), and Food Preparation & Serving (14 | 2.3%).
Services Occupations by Sex
Within the Services occupations in Wayland, the most male-oriented occupations are Security & Protection (93.8%), Law Enforcement (93.8%), and Food Preparation & Serving (71.4%), while the most female-oriented occupations are Healthcare Support (100.0%), Personal Care & Service (100.0%), and Cleaning & Maintenance (77.1%).
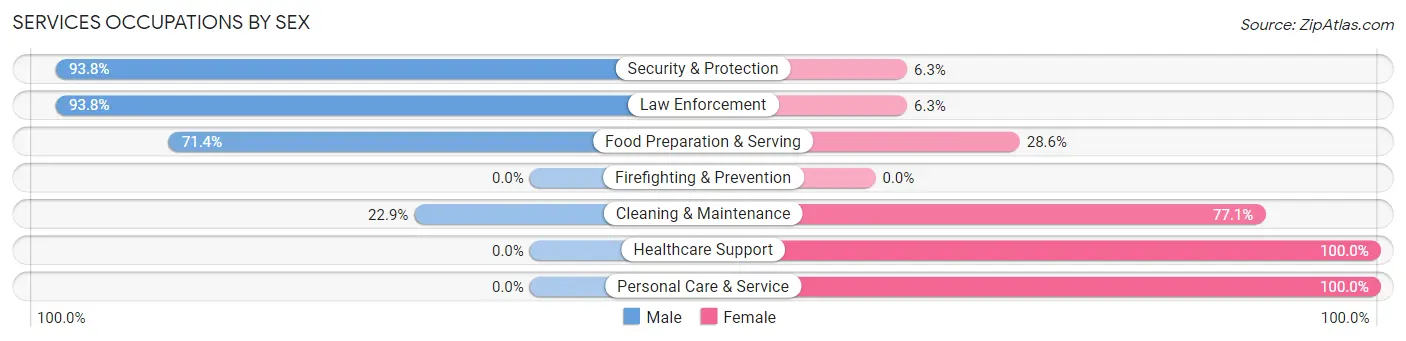
| Occupation | Male | Female |
| Healthcare Support | 0 (0.0%) | 30 (100.0%) |
| Security & Protection | 30 (93.8%) | 2 (6.2%) |
| Firefighting & Prevention | 0 (0.0%) | 0 (0.0%) |
| Law Enforcement | 30 (93.8%) | 2 (6.2%) |
| Food Preparation & Serving | 10 (71.4%) | 4 (28.6%) |
| Cleaning & Maintenance | 16 (22.9%) | 54 (77.1%) |
| Personal Care & Service | 0 (0.0%) | 2 (100.0%) |
| Total (Category) | 56 (37.8%) | 92 (62.2%) |
| Total (Overall) | 283 (46.4%) | 327 (53.6%) |
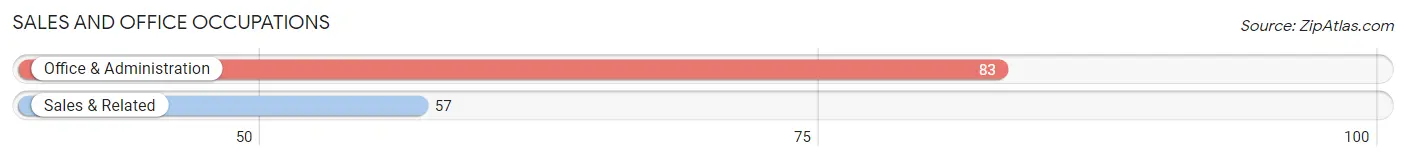
Sales and Office Occupations
The most common Sales and Office occupations in Wayland are Office & Administration (83 | 13.6%), and Sales & Related (57 | 9.3%).
Sales and Office Occupations by Sex
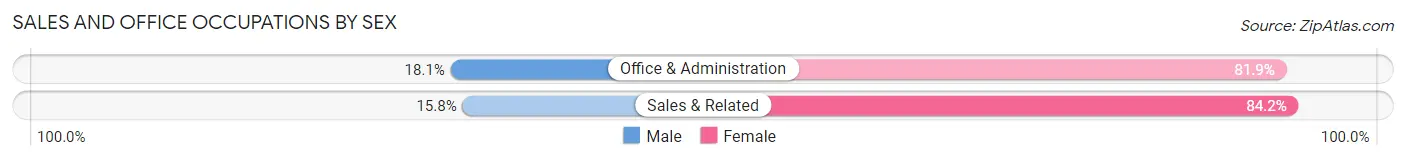
| Occupation | Male | Female |
| Sales & Related | 9 (15.8%) | 48 (84.2%) |
| Office & Administration | 15 (18.1%) | 68 (81.9%) |
| Total (Category) | 24 (17.1%) | 116 (82.9%) |
| Total (Overall) | 283 (46.4%) | 327 (53.6%) |
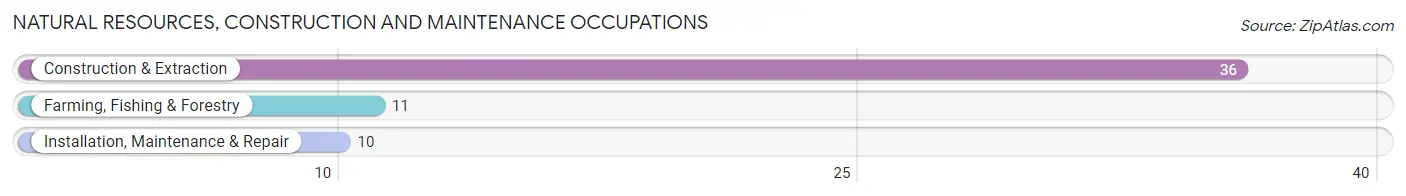
Natural Resources, Construction and Maintenance Occupations
The most common Natural Resources, Construction and Maintenance occupations in Wayland are Construction & Extraction (36 | 5.9%), Farming, Fishing & Forestry (11 | 1.8%), and Installation, Maintenance & Repair (10 | 1.6%).
Natural Resources, Construction and Maintenance Occupations by Sex
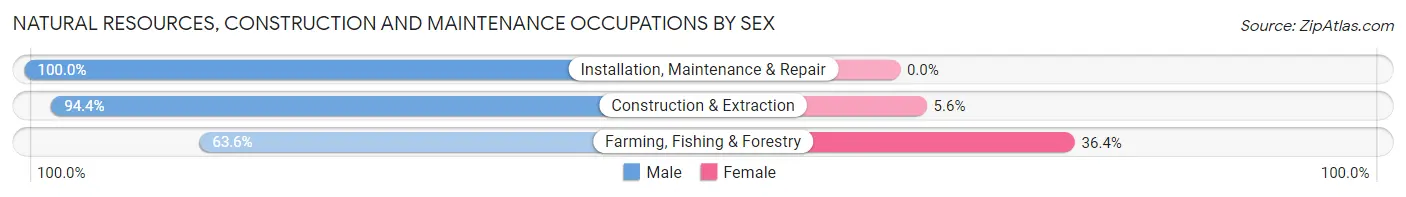
| Occupation | Male | Female |
| Farming, Fishing & Forestry | 7 (63.6%) | 4 (36.4%) |
| Construction & Extraction | 34 (94.4%) | 2 (5.6%) |
| Installation, Maintenance & Repair | 10 (100.0%) | 0 (0.0%) |
| Total (Category) | 51 (89.5%) | 6 (10.5%) |
| Total (Overall) | 283 (46.4%) | 327 (53.6%) |
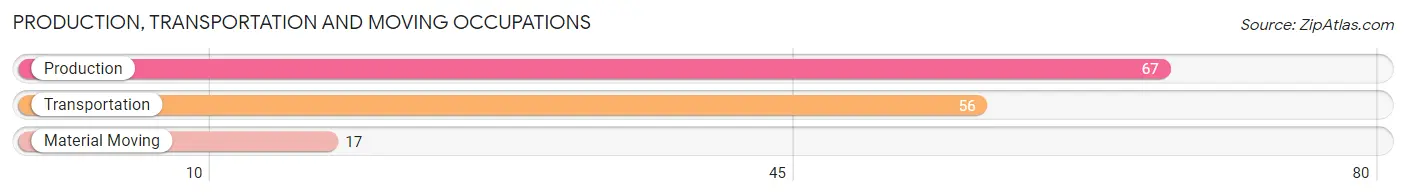
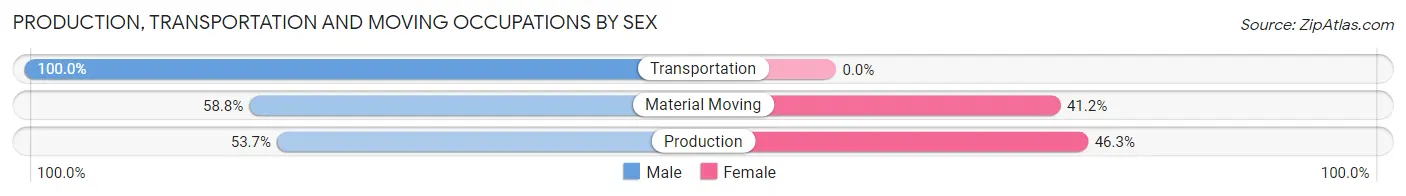
Production, Transportation and Moving Occupations
The most common Production, Transportation and Moving occupations in Wayland are Production (67 | 11.0%), Transportation (56 | 9.2%), and Material Moving (17 | 2.8%).
Production, Transportation and Moving Occupations by Sex
| Occupation | Male | Female |
| Production | 36 (53.7%) | 31 (46.3%) |
| Transportation | 56 (100.0%) | 0 (0.0%) |
| Material Moving | 10 (58.8%) | 7 (41.2%) |
| Total (Category) | 102 (72.9%) | 38 (27.1%) |
| Total (Overall) | 283 (46.4%) | 327 (53.6%) |
Employment Industries by Sex in Wayland
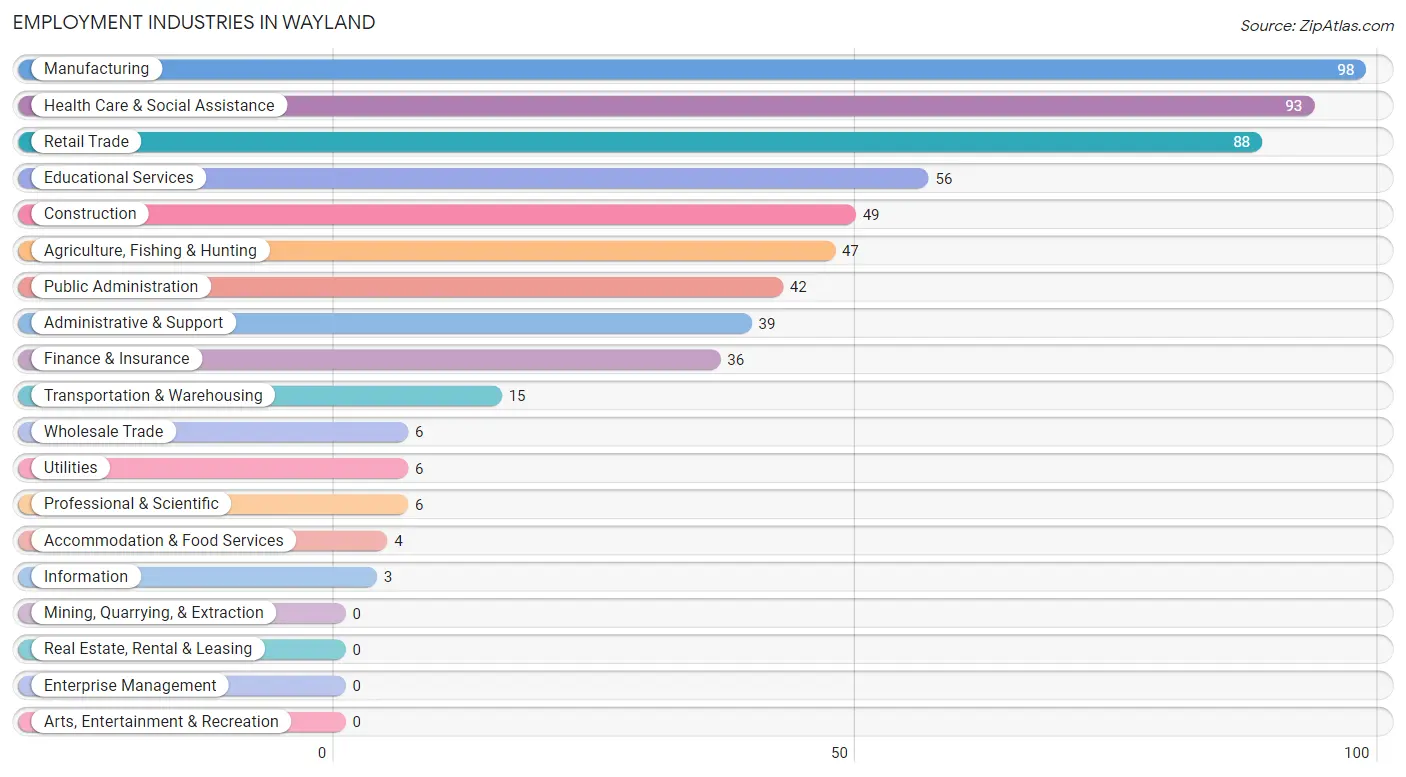
Employment Industries in Wayland
The major employment industries in Wayland include Manufacturing (98 | 16.1%), Health Care & Social Assistance (93 | 15.2%), Retail Trade (88 | 14.4%), Educational Services (56 | 9.2%), and Construction (49 | 8.0%).
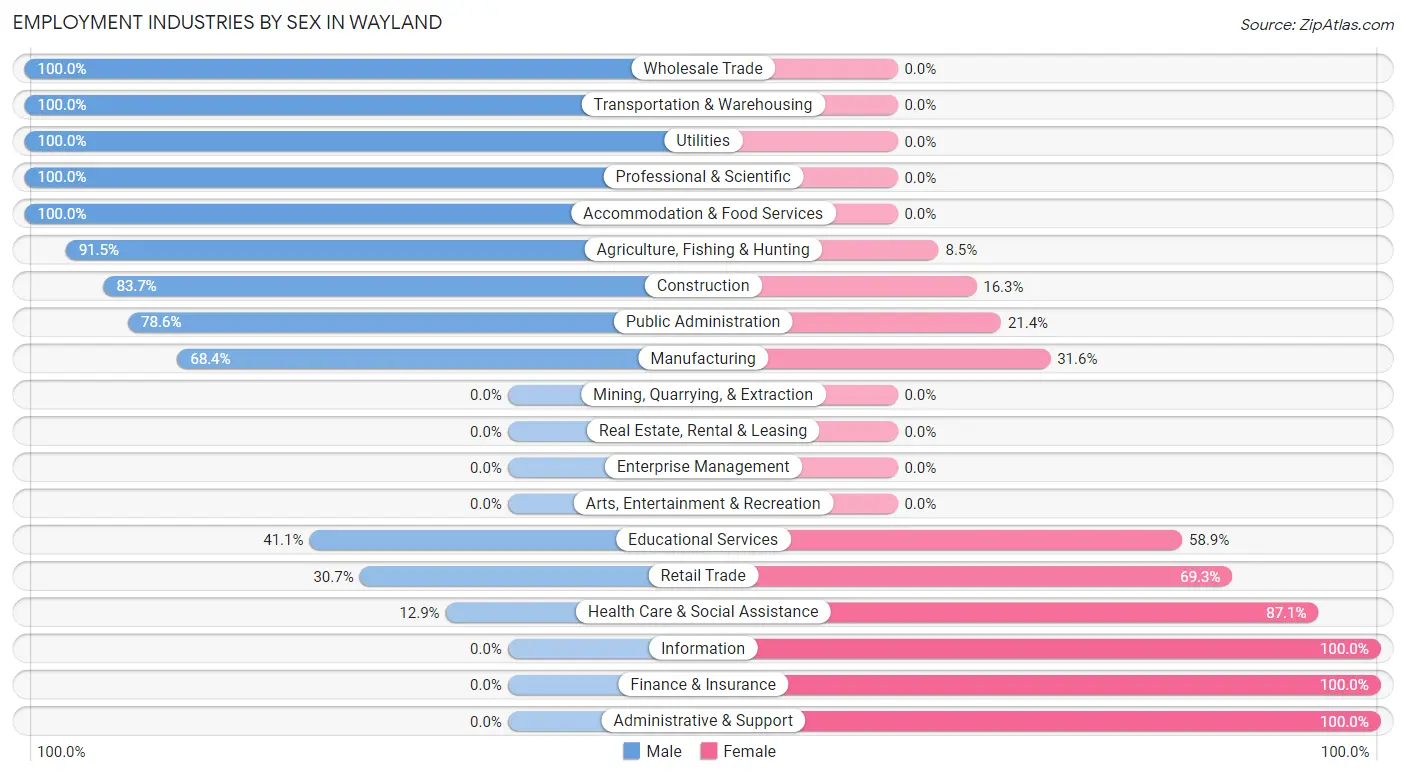
Employment Industries by Sex in Wayland
The Wayland industries that see more men than women are Wholesale Trade (100.0%), Transportation & Warehousing (100.0%), and Utilities (100.0%), whereas the industries that tend to have a higher number of women are Information (100.0%), Finance & Insurance (100.0%), and Administrative & Support (100.0%).
| Industry | Male | Female |
| Agriculture, Fishing & Hunting | 43 (91.5%) | 4 (8.5%) |
| Mining, Quarrying, & Extraction | 0 (0.0%) | 0 (0.0%) |
| Construction | 41 (83.7%) | 8 (16.3%) |
| Manufacturing | 67 (68.4%) | 31 (31.6%) |
| Wholesale Trade | 6 (100.0%) | 0 (0.0%) |
| Retail Trade | 27 (30.7%) | 61 (69.3%) |
| Transportation & Warehousing | 15 (100.0%) | 0 (0.0%) |
| Utilities | 6 (100.0%) | 0 (0.0%) |
| Information | 0 (0.0%) | 3 (100.0%) |
| Finance & Insurance | 0 (0.0%) | 36 (100.0%) |
| Real Estate, Rental & Leasing | 0 (0.0%) | 0 (0.0%) |
| Professional & Scientific | 6 (100.0%) | 0 (0.0%) |
| Enterprise Management | 0 (0.0%) | 0 (0.0%) |
| Administrative & Support | 0 (0.0%) | 39 (100.0%) |
| Educational Services | 23 (41.1%) | 33 (58.9%) |
| Health Care & Social Assistance | 12 (12.9%) | 81 (87.1%) |
| Arts, Entertainment & Recreation | 0 (0.0%) | 0 (0.0%) |
| Accommodation & Food Services | 4 (100.0%) | 0 (0.0%) |
| Public Administration | 33 (78.6%) | 9 (21.4%) |
| Total | 283 (46.4%) | 327 (53.6%) |
Education in Wayland
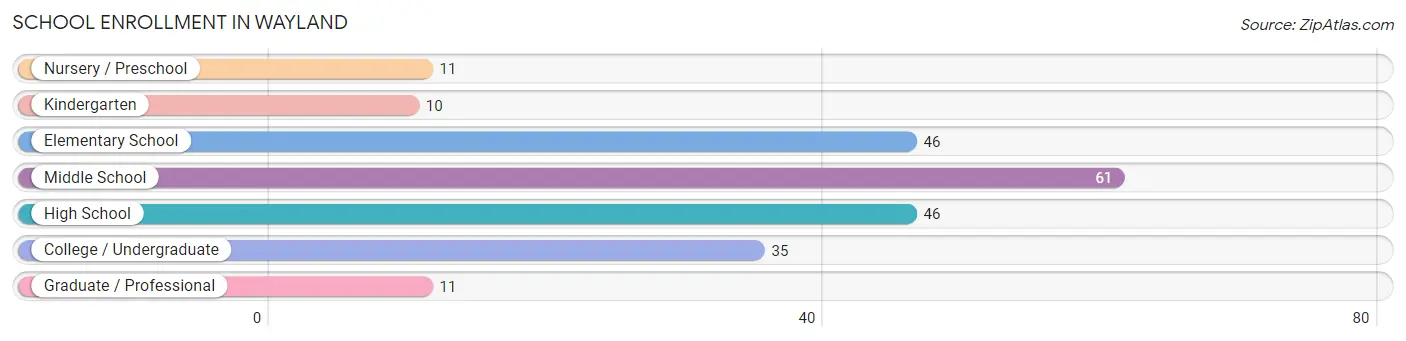
School Enrollment in Wayland
The most common levels of schooling among the 220 students in Wayland are middle school (61 | 27.7%), elementary school (46 | 20.9%), and high school (46 | 20.9%).
| School Level | # Students | % Students |
| Nursery / Preschool | 11 | 5.0% |
| Kindergarten | 10 | 4.5% |
| Elementary School | 46 | 20.9% |
| Middle School | 61 | 27.7% |
| High School | 46 | 20.9% |
| College / Undergraduate | 35 | 15.9% |
| Graduate / Professional | 11 | 5.0% |
| Total | 220 | 100.0% |
School Enrollment by Age by Funding Source in Wayland
Out of a total of 220 students who are enrolled in schools in Wayland, 28 (12.7%) attend a private institution, while the remaining 192 (87.3%) are enrolled in public schools. The age group of 20 to 24 year olds has the highest likelihood of being enrolled in private schools, with 19 (82.6% in the age bracket) enrolled. Conversely, the age group of 3 to 4 year olds has the lowest likelihood of being enrolled in a private school, with 11 (100.0% in the age bracket) attending a public institution.
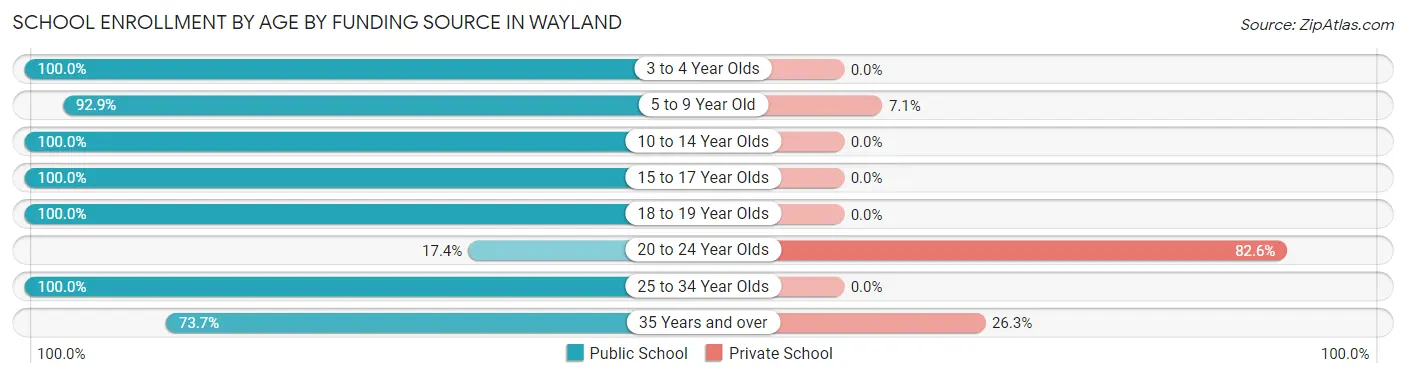
| Age Bracket | Public School | Private School |
| 3 to 4 Year Olds | 11 (100.0%) | 0 (0.0%) |
| 5 to 9 Year Old | 52 (92.9%) | 4 (7.1%) |
| 10 to 14 Year Olds | 61 (100.0%) | 0 (0.0%) |
| 15 to 17 Year Olds | 31 (100.0%) | 0 (0.0%) |
| 18 to 19 Year Olds | 12 (100.0%) | 0 (0.0%) |
| 20 to 24 Year Olds | 4 (17.4%) | 19 (82.6%) |
| 25 to 34 Year Olds | 7 (100.0%) | 0 (0.0%) |
| 35 Years and over | 14 (73.7%) | 5 (26.3%) |
| Total | 192 (87.3%) | 28 (12.7%) |
Educational Attainment by Field of Study in Wayland
Education (40 | 21.2%), science & technology (34 | 18.0%), business (27 | 14.3%), liberal arts & history (23 | 12.2%), and visual & performing arts (23 | 12.2%) are the most common fields of study among 189 individuals in Wayland who have obtained a bachelor's degree or higher.
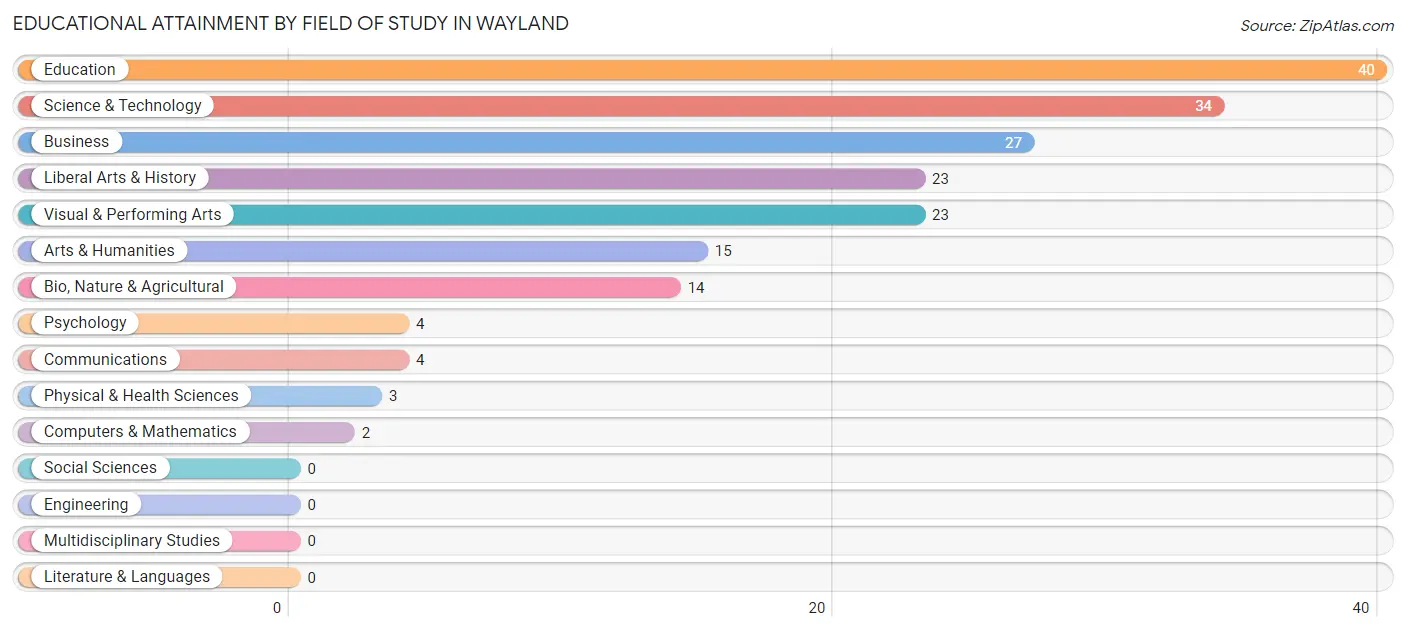
| Field of Study | # Graduates | % Graduates |
| Computers & Mathematics | 2 | 1.1% |
| Bio, Nature & Agricultural | 14 | 7.4% |
| Physical & Health Sciences | 3 | 1.6% |
| Psychology | 4 | 2.1% |
| Social Sciences | 0 | 0.0% |
| Engineering | 0 | 0.0% |
| Multidisciplinary Studies | 0 | 0.0% |
| Science & Technology | 34 | 18.0% |
| Business | 27 | 14.3% |
| Education | 40 | 21.2% |
| Literature & Languages | 0 | 0.0% |
| Liberal Arts & History | 23 | 12.2% |
| Visual & Performing Arts | 23 | 12.2% |
| Communications | 4 | 2.1% |
| Arts & Humanities | 15 | 7.9% |
| Total | 189 | 100.0% |
Transportation & Commute in Wayland
Vehicle Availability by Sex in Wayland
The most prevalent vehicle ownership categories in Wayland are males with 2 vehicles (121, accounting for 43.2%) and females with 2 vehicles (139, making up 40.2%).
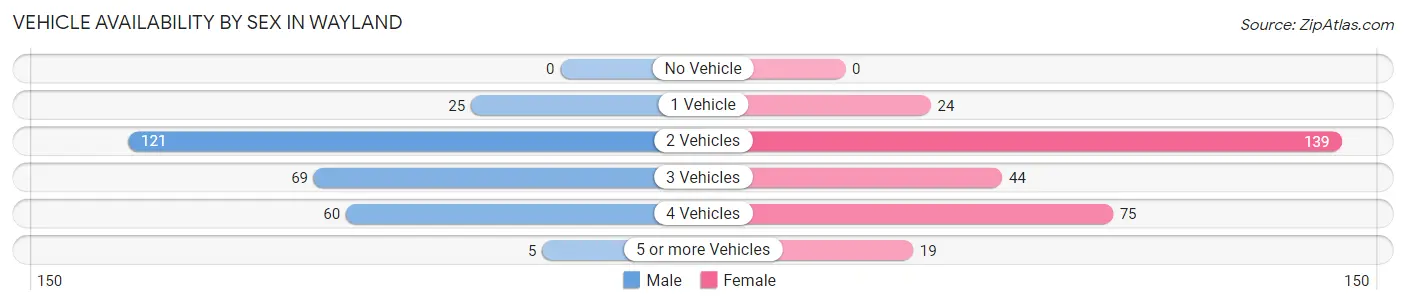
| Vehicles Available | Male | Female |
| No Vehicle | 0 (0.0%) | 0 (0.0%) |
| 1 Vehicle | 25 (8.9%) | 24 (8.0%) |
| 2 Vehicles | 121 (43.2%) | 139 (46.2%) |
| 3 Vehicles | 69 (24.6%) | 44 (14.6%) |
| 4 Vehicles | 60 (21.4%) | 75 (24.9%) |
| 5 or more Vehicles | 5 (1.8%) | 19 (6.3%) |
| Total | 280 (100.0%) | 301 (100.0%) |
Commute Time in Wayland
The most frequently occuring commute durations in Wayland are 5 to 9 minutes (139 commuters, 24.7%), 20 to 24 minutes (107 commuters, 19.0%), and 15 to 19 minutes (89 commuters, 15.8%).
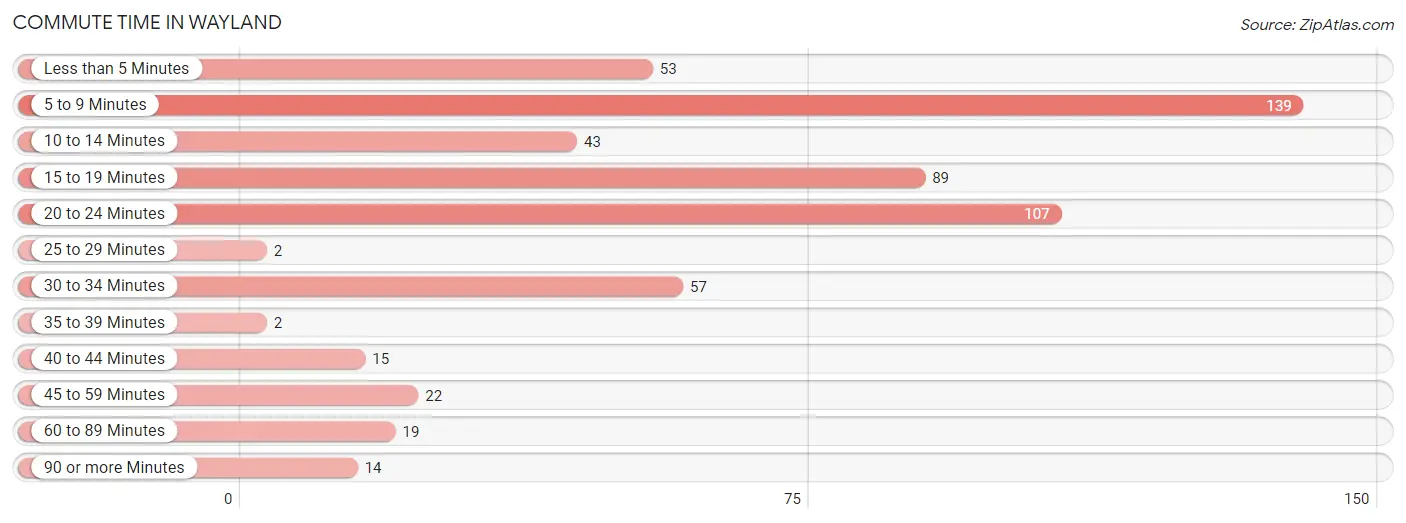
| Commute Time | # Commuters | % Commuters |
| Less than 5 Minutes | 53 | 9.4% |
| 5 to 9 Minutes | 139 | 24.7% |
| 10 to 14 Minutes | 43 | 7.6% |
| 15 to 19 Minutes | 89 | 15.8% |
| 20 to 24 Minutes | 107 | 19.0% |
| 25 to 29 Minutes | 2 | 0.4% |
| 30 to 34 Minutes | 57 | 10.1% |
| 35 to 39 Minutes | 2 | 0.4% |
| 40 to 44 Minutes | 15 | 2.7% |
| 45 to 59 Minutes | 22 | 3.9% |
| 60 to 89 Minutes | 19 | 3.4% |
| 90 or more Minutes | 14 | 2.5% |
Commute Time by Sex in Wayland
The most common commute times in Wayland are 5 to 9 minutes (91 commuters, 33.2%) for males and 15 to 19 minutes (64 commuters, 22.2%) for females.
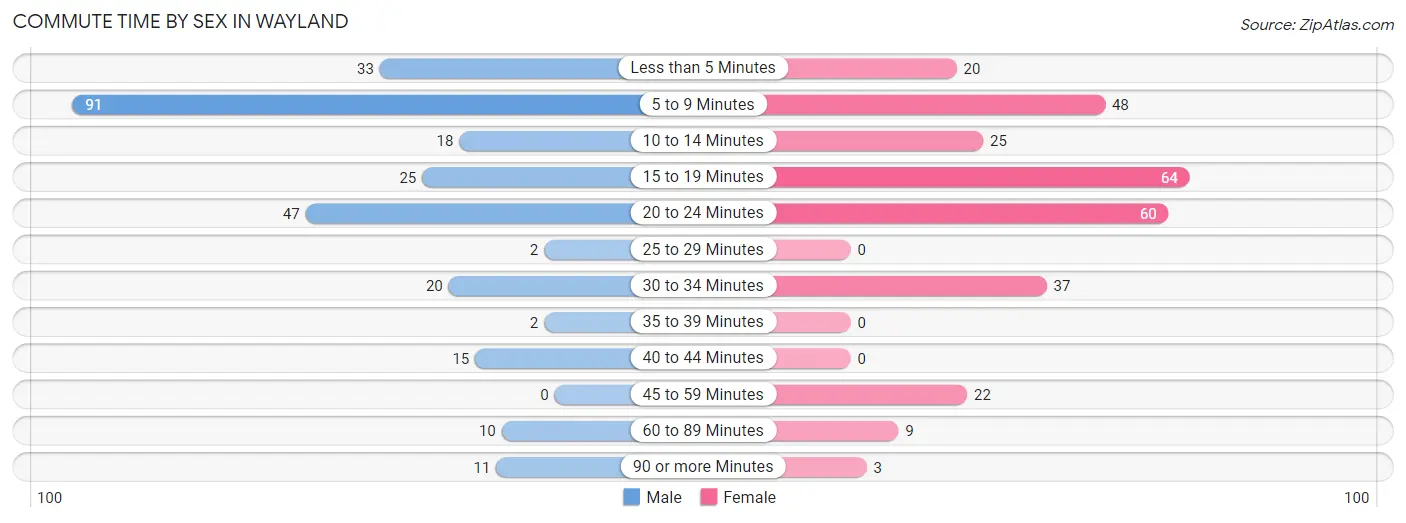
| Commute Time | Male | Female |
| Less than 5 Minutes | 33 (12.0%) | 20 (6.9%) |
| 5 to 9 Minutes | 91 (33.2%) | 48 (16.7%) |
| 10 to 14 Minutes | 18 (6.6%) | 25 (8.7%) |
| 15 to 19 Minutes | 25 (9.1%) | 64 (22.2%) |
| 20 to 24 Minutes | 47 (17.2%) | 60 (20.8%) |
| 25 to 29 Minutes | 2 (0.7%) | 0 (0.0%) |
| 30 to 34 Minutes | 20 (7.3%) | 37 (12.9%) |
| 35 to 39 Minutes | 2 (0.7%) | 0 (0.0%) |
| 40 to 44 Minutes | 15 (5.5%) | 0 (0.0%) |
| 45 to 59 Minutes | 0 (0.0%) | 22 (7.6%) |
| 60 to 89 Minutes | 10 (3.6%) | 9 (3.1%) |
| 90 or more Minutes | 11 (4.0%) | 3 (1.0%) |
Time of Departure to Work by Sex in Wayland
The most frequent times of departure to work in Wayland are 6:30 AM to 6:59 AM (46, 16.8%) for males and 6:30 AM to 6:59 AM (60, 20.8%) for females.
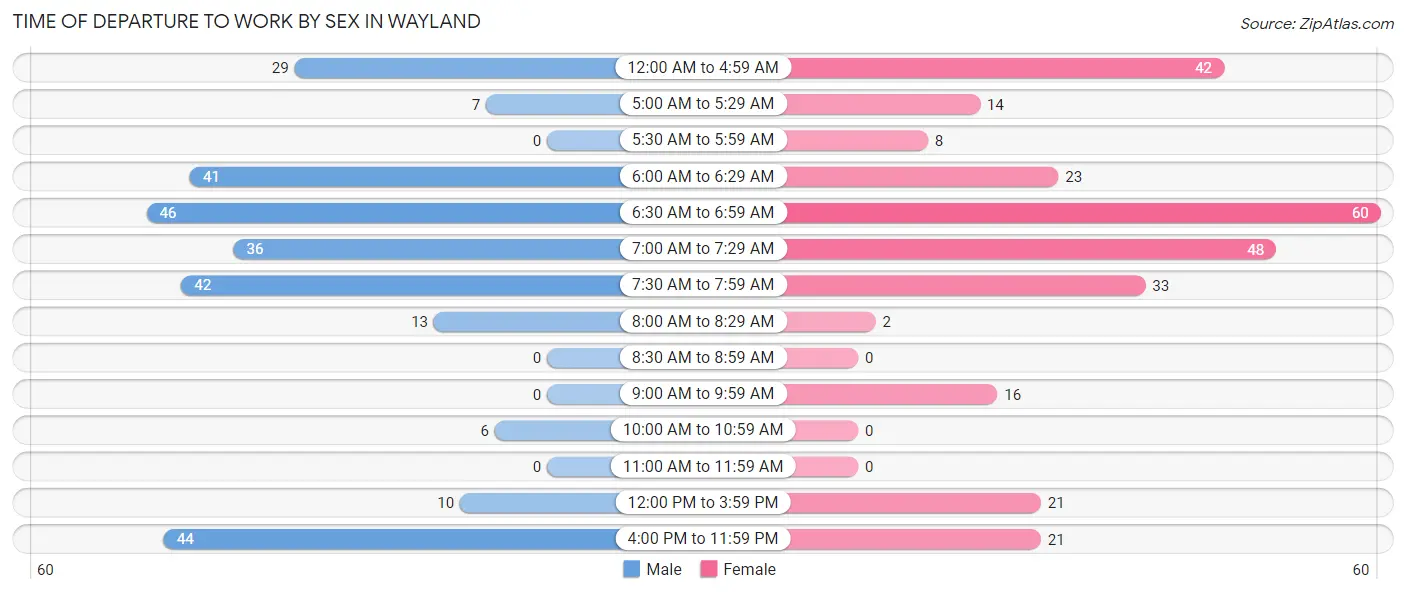
| Time of Departure | Male | Female |
| 12:00 AM to 4:59 AM | 29 (10.6%) | 42 (14.6%) |
| 5:00 AM to 5:29 AM | 7 (2.5%) | 14 (4.9%) |
| 5:30 AM to 5:59 AM | 0 (0.0%) | 8 (2.8%) |
| 6:00 AM to 6:29 AM | 41 (15.0%) | 23 (8.0%) |
| 6:30 AM to 6:59 AM | 46 (16.8%) | 60 (20.8%) |
| 7:00 AM to 7:29 AM | 36 (13.1%) | 48 (16.7%) |
| 7:30 AM to 7:59 AM | 42 (15.3%) | 33 (11.5%) |
| 8:00 AM to 8:29 AM | 13 (4.7%) | 2 (0.7%) |
| 8:30 AM to 8:59 AM | 0 (0.0%) | 0 (0.0%) |
| 9:00 AM to 9:59 AM | 0 (0.0%) | 16 (5.6%) |
| 10:00 AM to 10:59 AM | 6 (2.2%) | 0 (0.0%) |
| 11:00 AM to 11:59 AM | 0 (0.0%) | 0 (0.0%) |
| 12:00 PM to 3:59 PM | 10 (3.6%) | 21 (7.3%) |
| 4:00 PM to 11:59 PM | 44 (16.1%) | 21 (7.3%) |
| Total | 274 (100.0%) | 288 (100.0%) |
Housing Occupancy in Wayland
Occupancy by Ownership in Wayland
Of the total 408 dwellings in Wayland, owner-occupied units account for 294 (72.1%), while renter-occupied units make up 114 (27.9%).
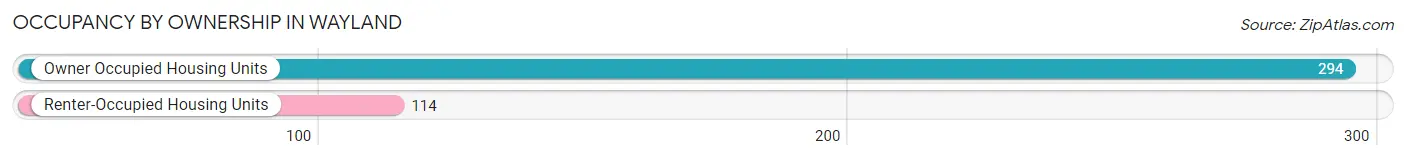
| Occupancy | # Housing Units | % Housing Units |
| Owner Occupied Housing Units | 294 | 72.1% |
| Renter-Occupied Housing Units | 114 | 27.9% |
| Total Occupied Housing Units | 408 | 100.0% |
Occupancy by Household Size in Wayland
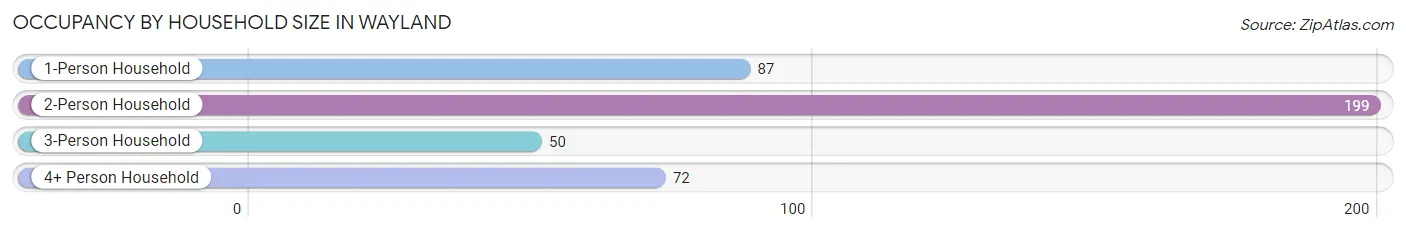
| Household Size | # Housing Units | % Housing Units |
| 1-Person Household | 87 | 21.3% |
| 2-Person Household | 199 | 48.8% |
| 3-Person Household | 50 | 12.2% |
| 4+ Person Household | 72 | 17.6% |
| Total Housing Units | 408 | 100.0% |
Occupancy by Ownership by Household Size in Wayland
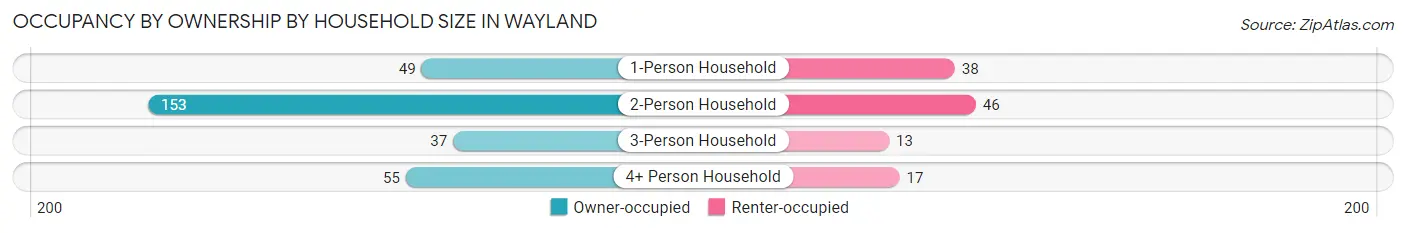
| Household Size | Owner-occupied | Renter-occupied |
| 1-Person Household | 49 (56.3%) | 38 (43.7%) |
| 2-Person Household | 153 (76.9%) | 46 (23.1%) |
| 3-Person Household | 37 (74.0%) | 13 (26.0%) |
| 4+ Person Household | 55 (76.4%) | 17 (23.6%) |
| Total Housing Units | 294 (72.1%) | 114 (27.9%) |
Occupancy by Educational Attainment in Wayland
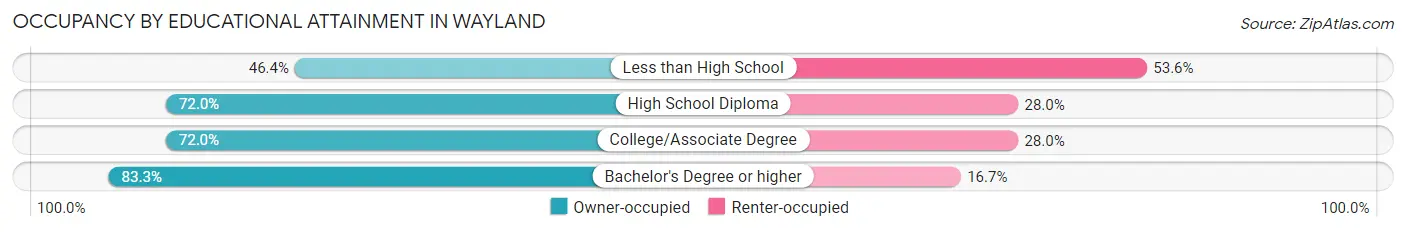
| Household Size | Owner-occupied | Renter-occupied |
| Less than High School | 13 (46.4%) | 15 (53.6%) |
| High School Diploma | 95 (72.0%) | 37 (28.0%) |
| College/Associate Degree | 131 (72.0%) | 51 (28.0%) |
| Bachelor's Degree or higher | 55 (83.3%) | 11 (16.7%) |
Occupancy by Age of Householder in Wayland
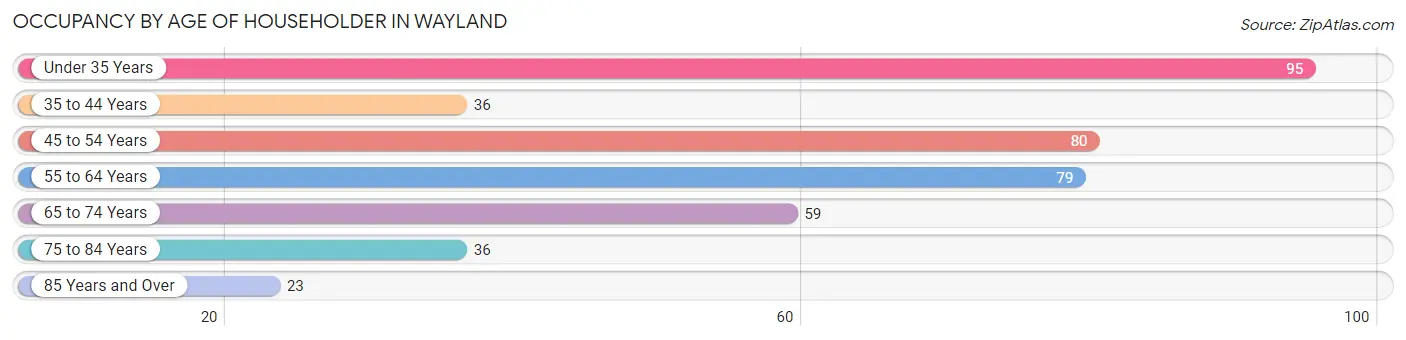
| Age Bracket | # Households | % Households |
| Under 35 Years | 95 | 23.3% |
| 35 to 44 Years | 36 | 8.8% |
| 45 to 54 Years | 80 | 19.6% |
| 55 to 64 Years | 79 | 19.4% |
| 65 to 74 Years | 59 | 14.5% |
| 75 to 84 Years | 36 | 8.8% |
| 85 Years and Over | 23 | 5.6% |
| Total | 408 | 100.0% |
Housing Finances in Wayland
Median Income by Occupancy in Wayland
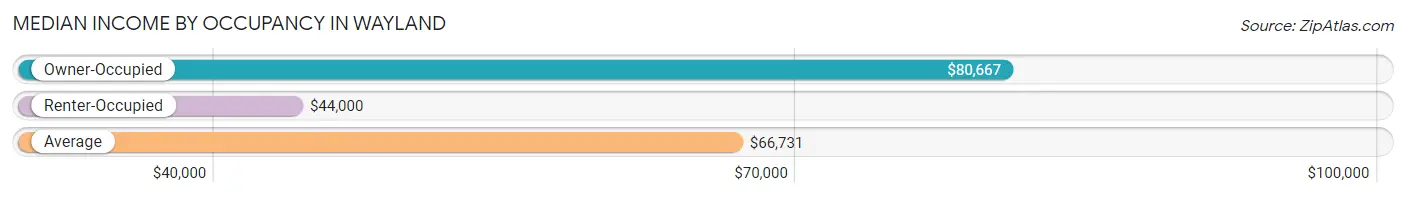
| Occupancy Type | # Households | Median Income |
| Owner-Occupied | 294 (72.1%) | $80,667 |
| Renter-Occupied | 114 (27.9%) | $44,000 |
| Average | 408 (100.0%) | $66,731 |
Occupancy by Householder Income Bracket in Wayland
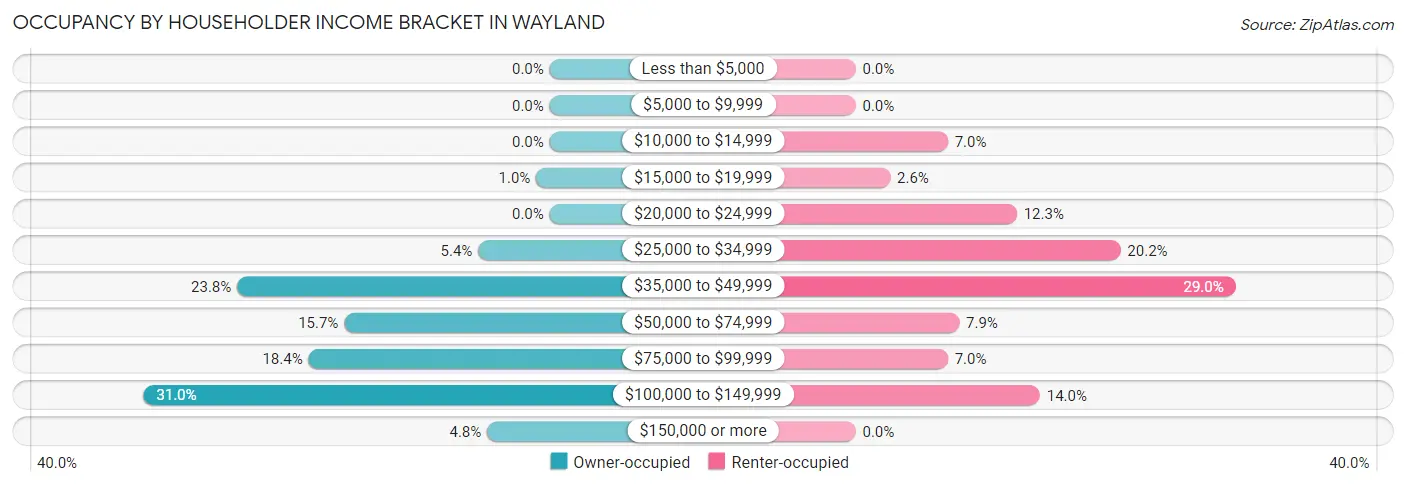
| Income Bracket | Owner-occupied | Renter-occupied |
| Less than $5,000 | 0 (0.0%) | 0 (0.0%) |
| $5,000 to $9,999 | 0 (0.0%) | 0 (0.0%) |
| $10,000 to $14,999 | 0 (0.0%) | 8 (7.0%) |
| $15,000 to $19,999 | 3 (1.0%) | 3 (2.6%) |
| $20,000 to $24,999 | 0 (0.0%) | 14 (12.3%) |
| $25,000 to $34,999 | 16 (5.4%) | 23 (20.2%) |
| $35,000 to $49,999 | 70 (23.8%) | 33 (28.9%) |
| $50,000 to $74,999 | 46 (15.7%) | 9 (7.9%) |
| $75,000 to $99,999 | 54 (18.4%) | 8 (7.0%) |
| $100,000 to $149,999 | 91 (30.9%) | 16 (14.0%) |
| $150,000 or more | 14 (4.8%) | 0 (0.0%) |
| Total | 294 (100.0%) | 114 (100.0%) |
Monthly Housing Cost Tiers in Wayland
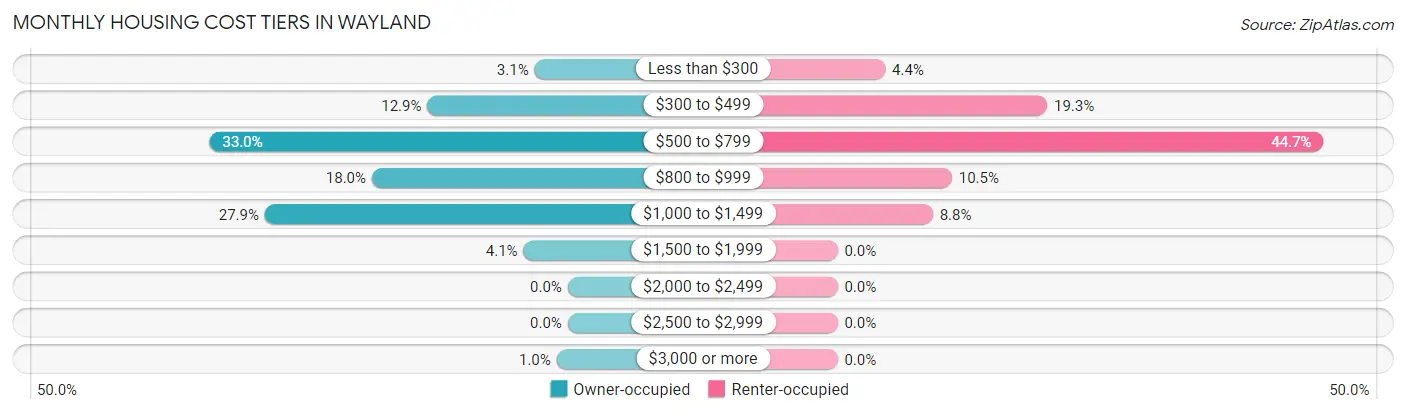
| Monthly Cost | Owner-occupied | Renter-occupied |
| Less than $300 | 9 (3.1%) | 5 (4.4%) |
| $300 to $499 | 38 (12.9%) | 22 (19.3%) |
| $500 to $799 | 97 (33.0%) | 51 (44.7%) |
| $800 to $999 | 53 (18.0%) | 12 (10.5%) |
| $1,000 to $1,499 | 82 (27.9%) | 10 (8.8%) |
| $1,500 to $1,999 | 12 (4.1%) | 0 (0.0%) |
| $2,000 to $2,499 | 0 (0.0%) | 0 (0.0%) |
| $2,500 to $2,999 | 0 (0.0%) | 0 (0.0%) |
| $3,000 or more | 3 (1.0%) | 0 (0.0%) |
| Total | 294 (100.0%) | 114 (100.0%) |
Physical Housing Characteristics in Wayland
Housing Structures in Wayland
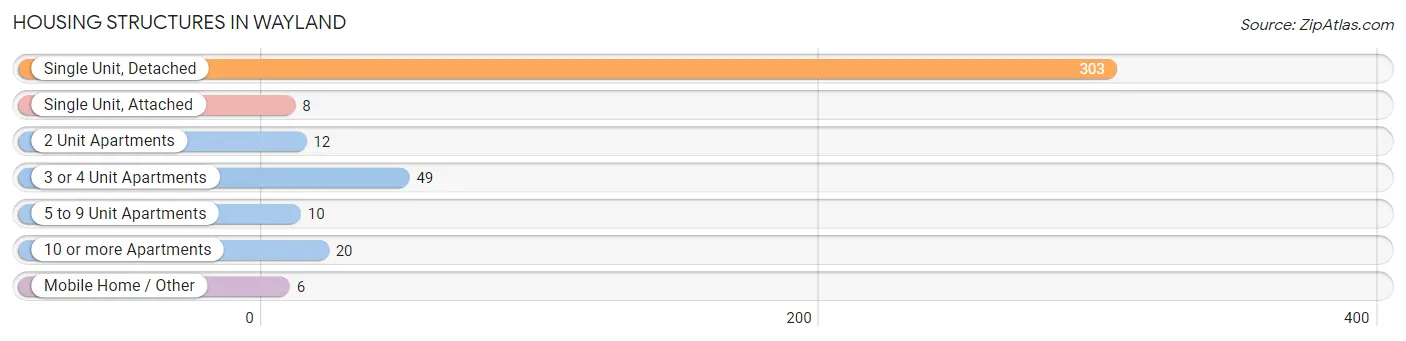
| Structure Type | # Housing Units | % Housing Units |
| Single Unit, Detached | 303 | 74.3% |
| Single Unit, Attached | 8 | 2.0% |
| 2 Unit Apartments | 12 | 2.9% |
| 3 or 4 Unit Apartments | 49 | 12.0% |
| 5 to 9 Unit Apartments | 10 | 2.5% |
| 10 or more Apartments | 20 | 4.9% |
| Mobile Home / Other | 6 | 1.5% |
| Total | 408 | 100.0% |
Housing Structures by Occupancy in Wayland
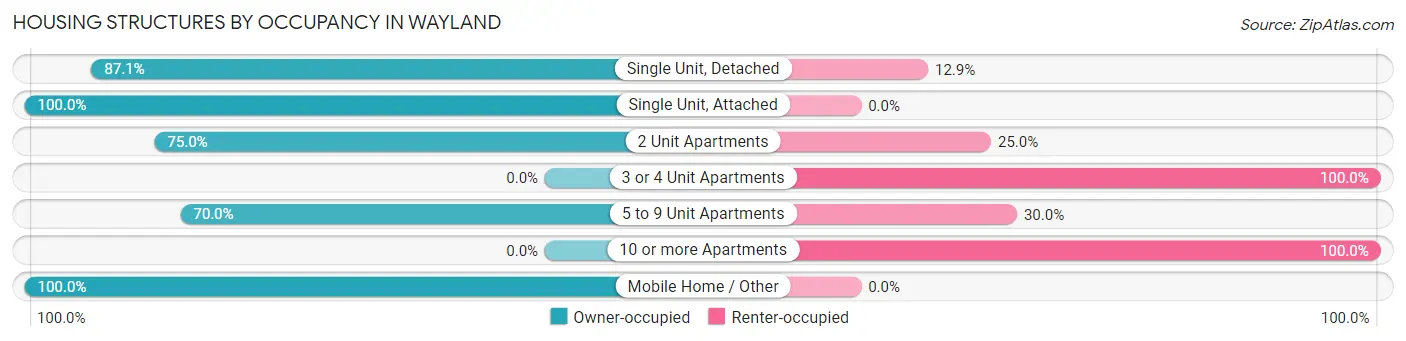
| Structure Type | Owner-occupied | Renter-occupied |
| Single Unit, Detached | 264 (87.1%) | 39 (12.9%) |
| Single Unit, Attached | 8 (100.0%) | 0 (0.0%) |
| 2 Unit Apartments | 9 (75.0%) | 3 (25.0%) |
| 3 or 4 Unit Apartments | 0 (0.0%) | 49 (100.0%) |
| 5 to 9 Unit Apartments | 7 (70.0%) | 3 (30.0%) |
| 10 or more Apartments | 0 (0.0%) | 20 (100.0%) |
| Mobile Home / Other | 6 (100.0%) | 0 (0.0%) |
| Total | 294 (72.1%) | 114 (27.9%) |
Housing Structures by Number of Rooms in Wayland
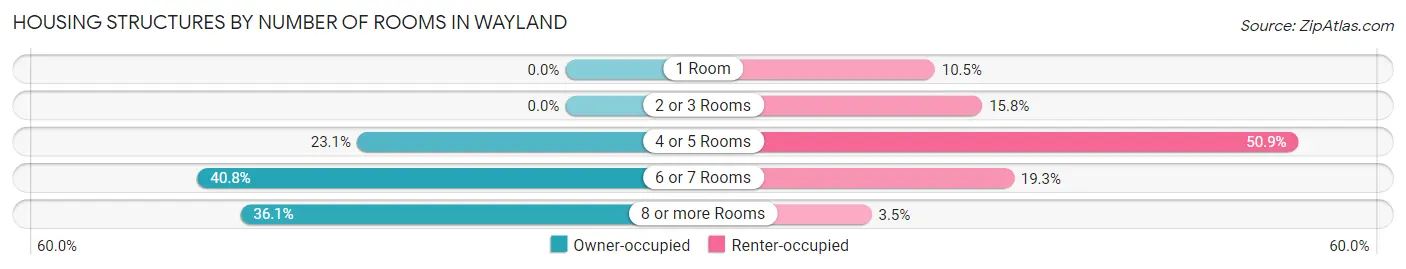
| Number of Rooms | Owner-occupied | Renter-occupied |
| 1 Room | 0 (0.0%) | 12 (10.5%) |
| 2 or 3 Rooms | 0 (0.0%) | 18 (15.8%) |
| 4 or 5 Rooms | 68 (23.1%) | 58 (50.9%) |
| 6 or 7 Rooms | 120 (40.8%) | 22 (19.3%) |
| 8 or more Rooms | 106 (36.0%) | 4 (3.5%) |
| Total | 294 (100.0%) | 114 (100.0%) |
Housing Structure by Heating Type in Wayland
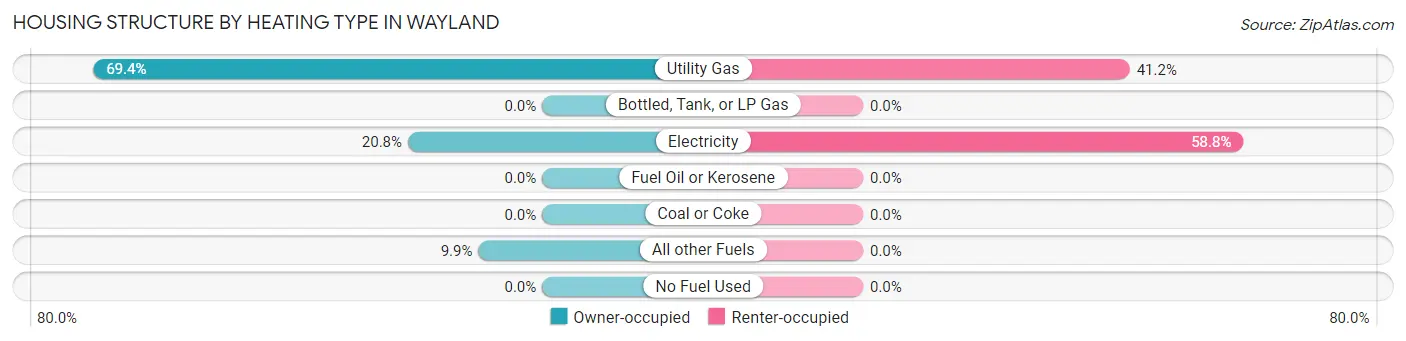
| Heating Type | Owner-occupied | Renter-occupied |
| Utility Gas | 204 (69.4%) | 47 (41.2%) |
| Bottled, Tank, or LP Gas | 0 (0.0%) | 0 (0.0%) |
| Electricity | 61 (20.7%) | 67 (58.8%) |
| Fuel Oil or Kerosene | 0 (0.0%) | 0 (0.0%) |
| Coal or Coke | 0 (0.0%) | 0 (0.0%) |
| All other Fuels | 29 (9.9%) | 0 (0.0%) |
| No Fuel Used | 0 (0.0%) | 0 (0.0%) |
| Total | 294 (100.0%) | 114 (100.0%) |
Household Vehicle Usage in Wayland
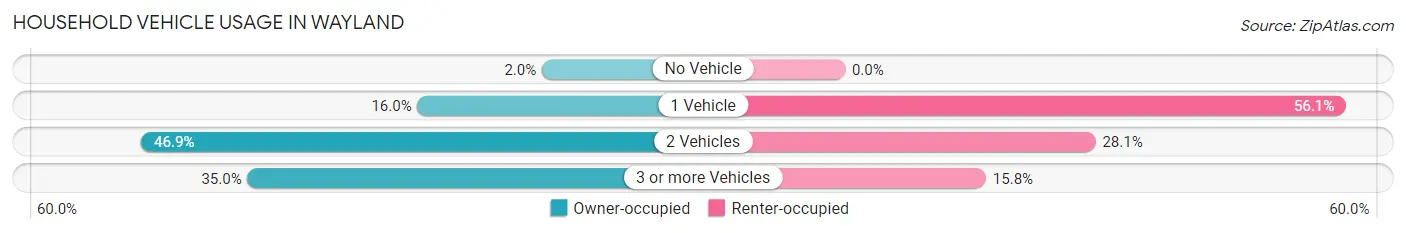
| Vehicles per Household | Owner-occupied | Renter-occupied |
| No Vehicle | 6 (2.0%) | 0 (0.0%) |
| 1 Vehicle | 47 (16.0%) | 64 (56.1%) |
| 2 Vehicles | 138 (46.9%) | 32 (28.1%) |
| 3 or more Vehicles | 103 (35.0%) | 18 (15.8%) |
| Total | 294 (100.0%) | 114 (100.0%) |
Real Estate & Mortgages in Wayland
Real Estate and Mortgage Overview in Wayland
| Characteristic | Without Mortgage | With Mortgage |
| Housing Units | 111 | 183 |
| Median Property Value | $133,600 | $109,600 |
| Median Household Income | $74,821 | $12 |
| Monthly Housing Costs | $577 | $3 |
| Real Estate Taxes | $1,667 | $3 |
Property Value by Mortgage Status in Wayland
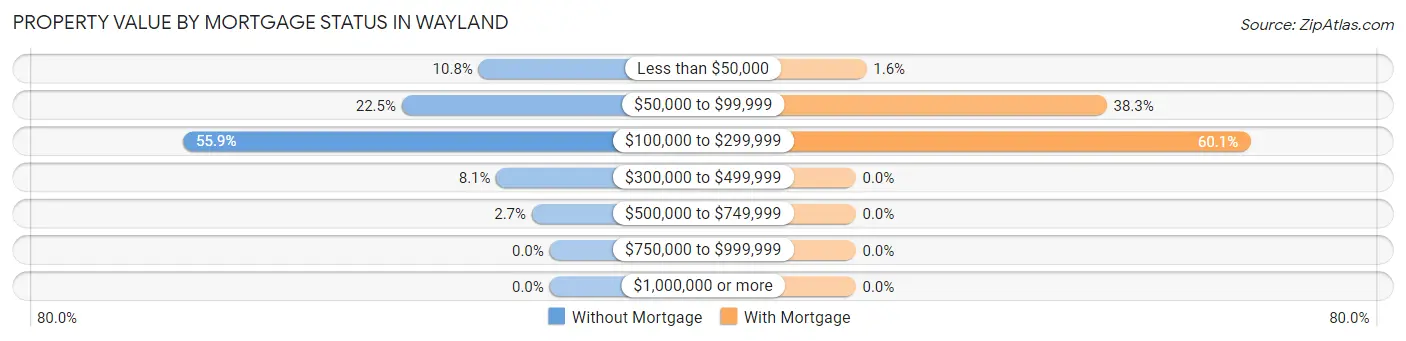
| Property Value | Without Mortgage | With Mortgage |
| Less than $50,000 | 12 (10.8%) | 3 (1.6%) |
| $50,000 to $99,999 | 25 (22.5%) | 70 (38.3%) |
| $100,000 to $299,999 | 62 (55.9%) | 110 (60.1%) |
| $300,000 to $499,999 | 9 (8.1%) | 0 (0.0%) |
| $500,000 to $749,999 | 3 (2.7%) | 0 (0.0%) |
| $750,000 to $999,999 | 0 (0.0%) | 0 (0.0%) |
| $1,000,000 or more | 0 (0.0%) | 0 (0.0%) |
| Total | 111 (100.0%) | 183 (100.0%) |
Household Income by Mortgage Status in Wayland
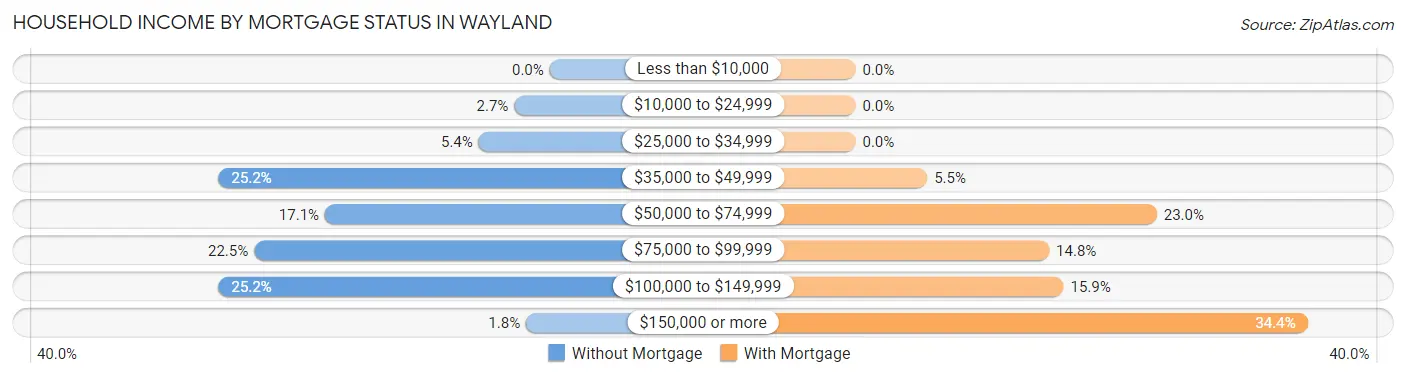
| Household Income | Without Mortgage | With Mortgage |
| Less than $10,000 | 0 (0.0%) | 0 (0.0%) |
| $10,000 to $24,999 | 3 (2.7%) | 0 (0.0%) |
| $25,000 to $34,999 | 6 (5.4%) | 0 (0.0%) |
| $35,000 to $49,999 | 28 (25.2%) | 10 (5.5%) |
| $50,000 to $74,999 | 19 (17.1%) | 42 (23.0%) |
| $75,000 to $99,999 | 25 (22.5%) | 27 (14.7%) |
| $100,000 to $149,999 | 28 (25.2%) | 29 (15.9%) |
| $150,000 or more | 2 (1.8%) | 63 (34.4%) |
| Total | 111 (100.0%) | 183 (100.0%) |
Property Value to Household Income Ratio in Wayland
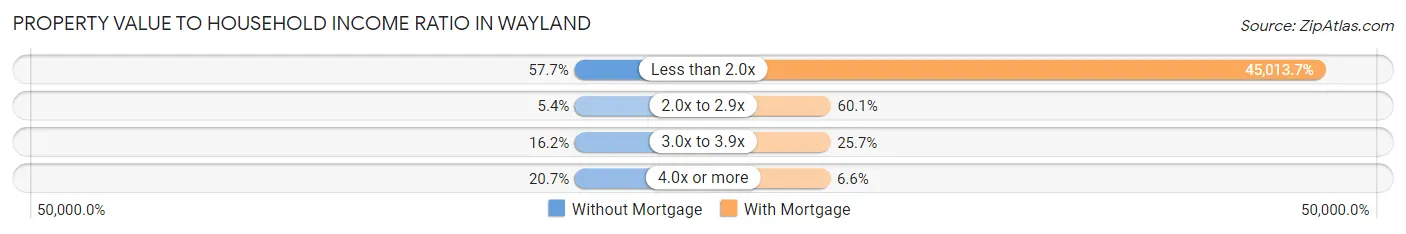
| Value-to-Income Ratio | Without Mortgage | With Mortgage |
| Less than 2.0x | 64 (57.7%) | 82,375 (45,013.7%) |
| 2.0x to 2.9x | 6 (5.4%) | 110 (60.1%) |
| 3.0x to 3.9x | 18 (16.2%) | 47 (25.7%) |
| 4.0x or more | 23 (20.7%) | 12 (6.6%) |
| Total | 111 (100.0%) | 183 (100.0%) |
Real Estate Taxes by Mortgage Status in Wayland
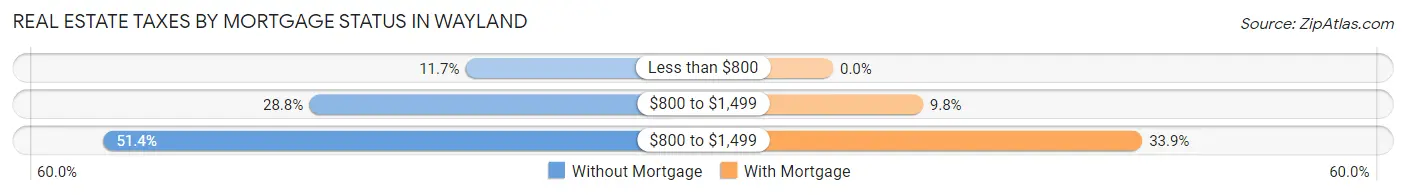
| Property Taxes | Without Mortgage | With Mortgage |
| Less than $800 | 13 (11.7%) | 0 (0.0%) |
| $800 to $1,499 | 32 (28.8%) | 18 (9.8%) |
| $800 to $1,499 | 57 (51.3%) | 62 (33.9%) |
| Total | 111 (100.0%) | 183 (100.0%) |
Health & Disability in Wayland
Health Insurance Coverage by Age in Wayland
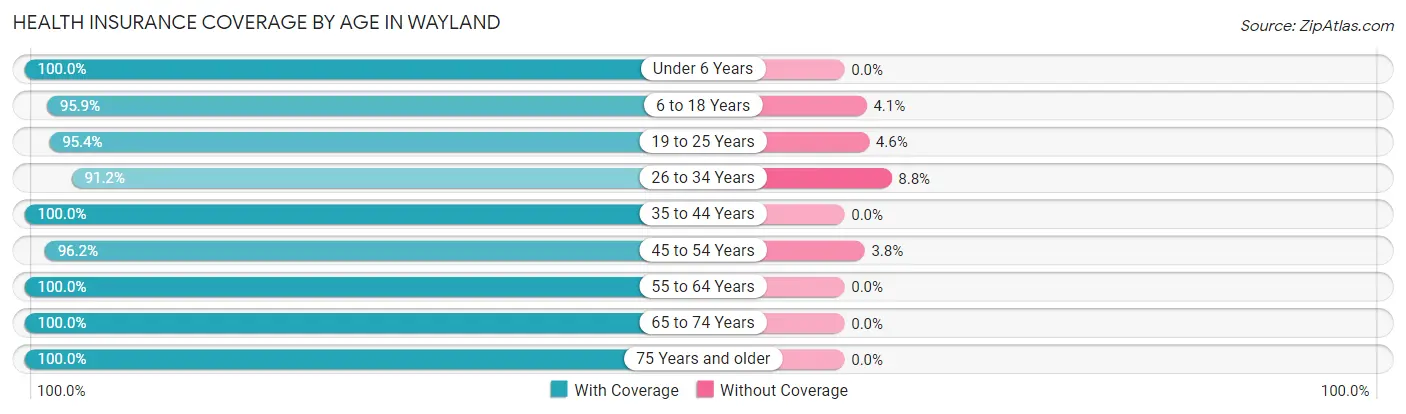
| Age Bracket | With Coverage | Without Coverage |
| Under 6 Years | 56 (100.0%) | 0 (0.0%) |
| 6 to 18 Years | 139 (95.9%) | 6 (4.1%) |
| 19 to 25 Years | 104 (95.4%) | 5 (4.6%) |
| 26 to 34 Years | 104 (91.2%) | 10 (8.8%) |
| 35 to 44 Years | 135 (100.0%) | 0 (0.0%) |
| 45 to 54 Years | 205 (96.2%) | 8 (3.8%) |
| 55 to 64 Years | 166 (100.0%) | 0 (0.0%) |
| 65 to 74 Years | 77 (100.0%) | 0 (0.0%) |
| 75 Years and older | 94 (100.0%) | 0 (0.0%) |
| Total | 1,080 (97.4%) | 29 (2.6%) |
Health Insurance Coverage by Citizenship Status in Wayland
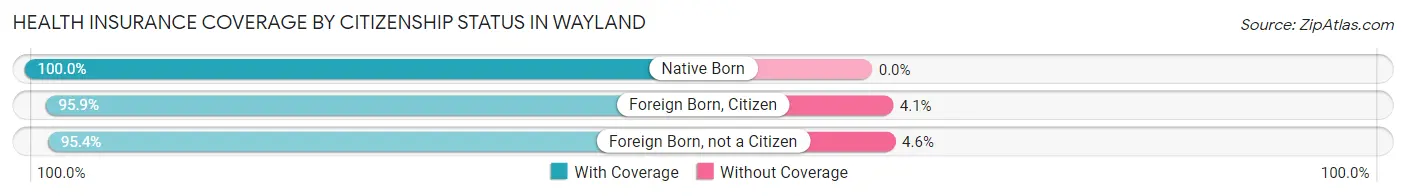
| Citizenship Status | With Coverage | Without Coverage |
| Native Born | 56 (100.0%) | 0 (0.0%) |
| Foreign Born, Citizen | 139 (95.9%) | 6 (4.1%) |
| Foreign Born, not a Citizen | 104 (95.4%) | 5 (4.6%) |
Health Insurance Coverage by Household Income in Wayland
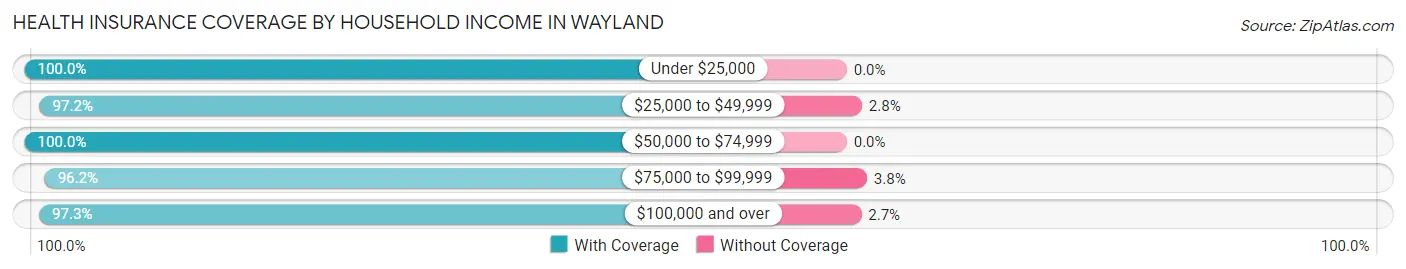
| Household Income | With Coverage | Without Coverage |
| Under $25,000 | 28 (100.0%) | 0 (0.0%) |
| $25,000 to $49,999 | 343 (97.2%) | 10 (2.8%) |
| $50,000 to $74,999 | 113 (100.0%) | 0 (0.0%) |
| $75,000 to $99,999 | 204 (96.2%) | 8 (3.8%) |
| $100,000 and over | 392 (97.3%) | 11 (2.7%) |
Public vs Private Health Insurance Coverage by Age in Wayland
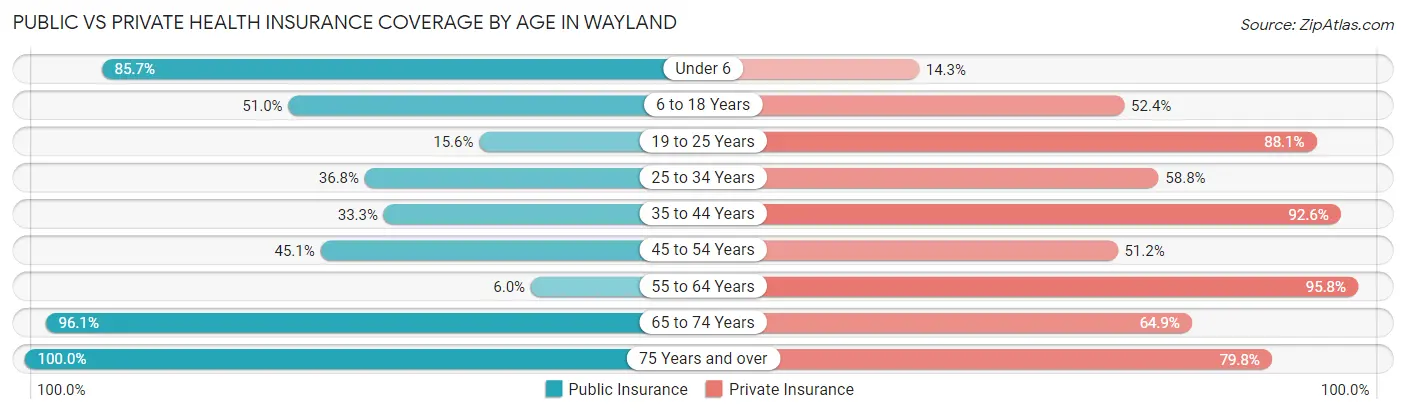
| Age Bracket | Public Insurance | Private Insurance |
| Under 6 | 48 (85.7%) | 8 (14.3%) |
| 6 to 18 Years | 74 (51.0%) | 76 (52.4%) |
| 19 to 25 Years | 17 (15.6%) | 96 (88.1%) |
| 25 to 34 Years | 42 (36.8%) | 67 (58.8%) |
| 35 to 44 Years | 45 (33.3%) | 125 (92.6%) |
| 45 to 54 Years | 96 (45.1%) | 109 (51.2%) |
| 55 to 64 Years | 10 (6.0%) | 159 (95.8%) |
| 65 to 74 Years | 74 (96.1%) | 50 (64.9%) |
| 75 Years and over | 94 (100.0%) | 75 (79.8%) |
| Total | 500 (45.1%) | 765 (69.0%) |
Disability Status by Sex by Age in Wayland
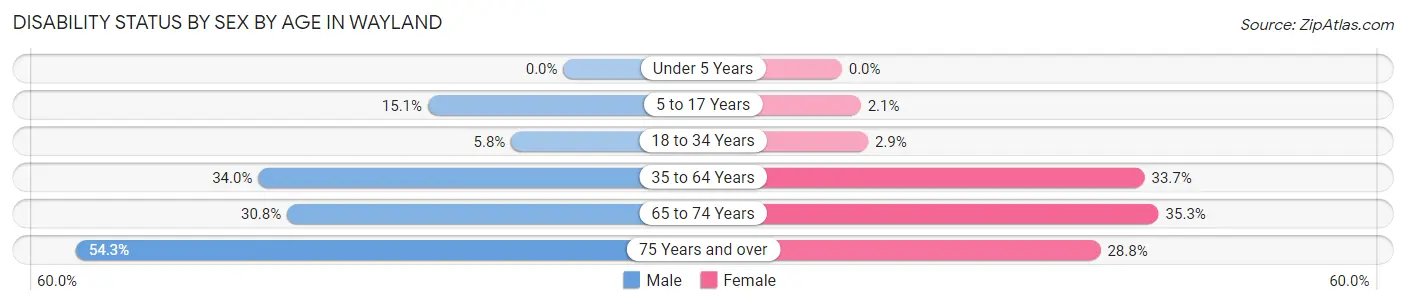
| Age Bracket | Male | Female |
| Under 5 Years | 0 (0.0%) | 0 (0.0%) |
| 5 to 17 Years | 8 (15.1%) | 2 (2.1%) |
| 18 to 34 Years | 5 (5.8%) | 4 (2.9%) |
| 35 to 64 Years | 87 (34.0%) | 87 (33.7%) |
| 65 to 74 Years | 8 (30.8%) | 18 (35.3%) |
| 75 Years and over | 19 (54.3%) | 17 (28.8%) |
Disability Class by Sex by Age in Wayland
Disability Class: Hearing Difficulty
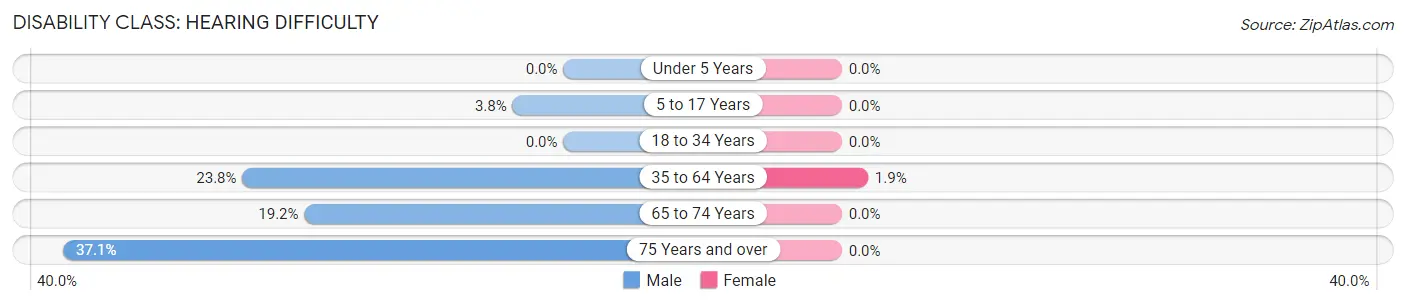
| Age Bracket | Male | Female |
| Under 5 Years | 0 (0.0%) | 0 (0.0%) |
| 5 to 17 Years | 2 (3.8%) | 0 (0.0%) |
| 18 to 34 Years | 0 (0.0%) | 0 (0.0%) |
| 35 to 64 Years | 61 (23.8%) | 5 (1.9%) |
| 65 to 74 Years | 5 (19.2%) | 0 (0.0%) |
| 75 Years and over | 13 (37.1%) | 0 (0.0%) |
Disability Class: Vision Difficulty
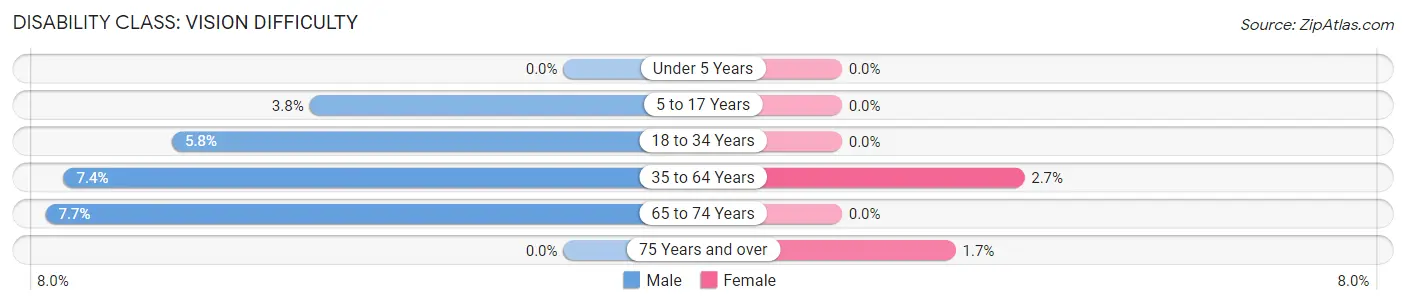
| Age Bracket | Male | Female |
| Under 5 Years | 0 (0.0%) | 0 (0.0%) |
| 5 to 17 Years | 2 (3.8%) | 0 (0.0%) |
| 18 to 34 Years | 5 (5.8%) | 0 (0.0%) |
| 35 to 64 Years | 19 (7.4%) | 7 (2.7%) |
| 65 to 74 Years | 2 (7.7%) | 0 (0.0%) |
| 75 Years and over | 0 (0.0%) | 1 (1.7%) |
Disability Class: Cognitive Difficulty
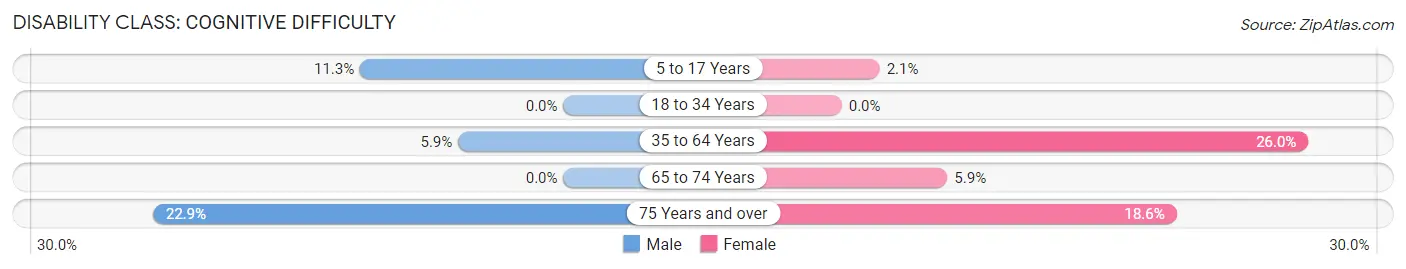
| Age Bracket | Male | Female |
| 5 to 17 Years | 6 (11.3%) | 2 (2.1%) |
| 18 to 34 Years | 0 (0.0%) | 0 (0.0%) |
| 35 to 64 Years | 15 (5.9%) | 67 (26.0%) |
| 65 to 74 Years | 0 (0.0%) | 3 (5.9%) |
| 75 Years and over | 8 (22.9%) | 11 (18.6%) |
Disability Class: Ambulatory Difficulty
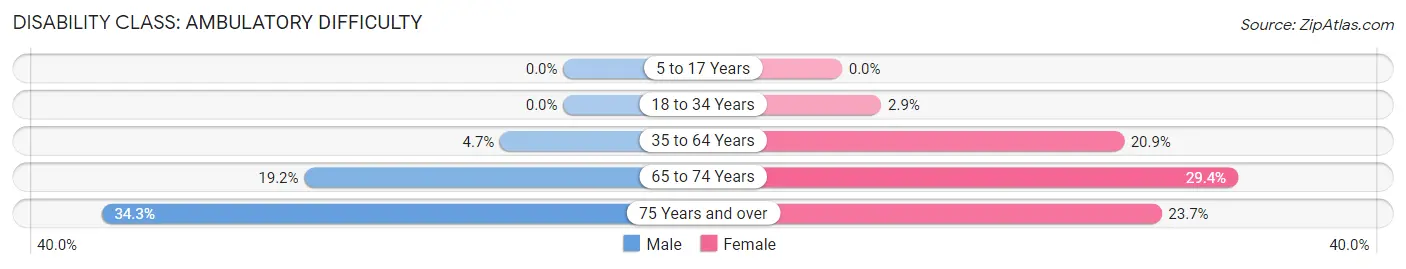
| Age Bracket | Male | Female |
| 5 to 17 Years | 0 (0.0%) | 0 (0.0%) |
| 18 to 34 Years | 0 (0.0%) | 4 (2.9%) |
| 35 to 64 Years | 12 (4.7%) | 54 (20.9%) |
| 65 to 74 Years | 5 (19.2%) | 15 (29.4%) |
| 75 Years and over | 12 (34.3%) | 14 (23.7%) |
Disability Class: Self-Care Difficulty
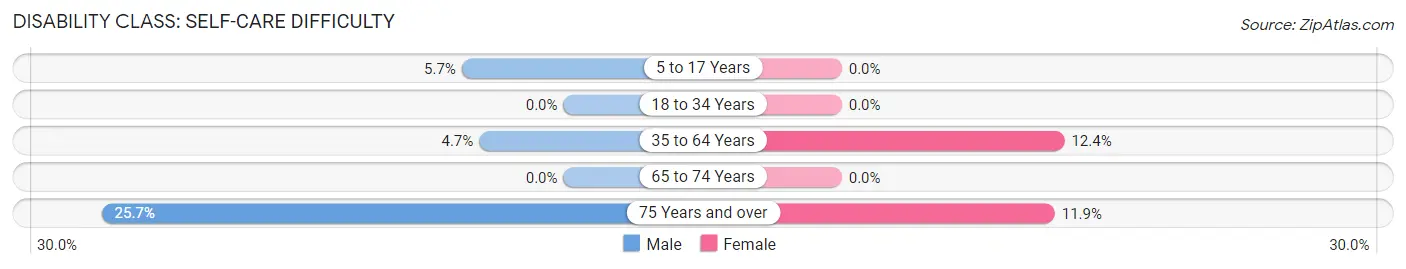
| Age Bracket | Male | Female |
| 5 to 17 Years | 3 (5.7%) | 0 (0.0%) |
| 18 to 34 Years | 0 (0.0%) | 0 (0.0%) |
| 35 to 64 Years | 12 (4.7%) | 32 (12.4%) |
| 65 to 74 Years | 0 (0.0%) | 0 (0.0%) |
| 75 Years and over | 9 (25.7%) | 7 (11.9%) |
Technology Access in Wayland
Computing Device Access in Wayland
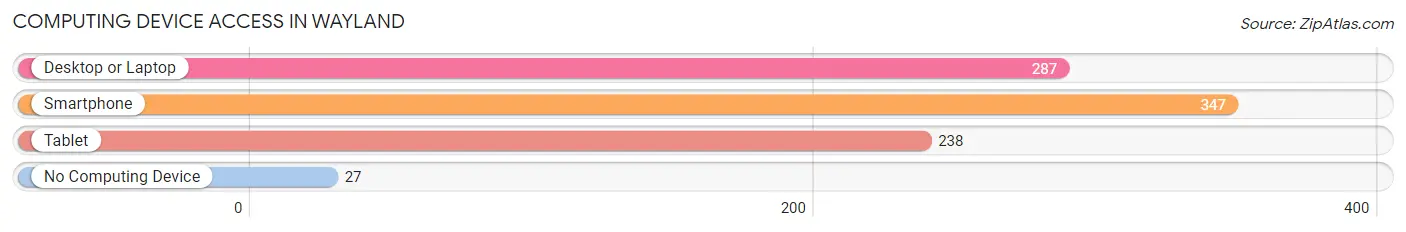
| Device Type | # Households | % Households |
| Desktop or Laptop | 287 | 70.3% |
| Smartphone | 347 | 85.1% |
| Tablet | 238 | 58.3% |
| No Computing Device | 27 | 6.6% |
| Total | 408 | 100.0% |
Internet Access in Wayland
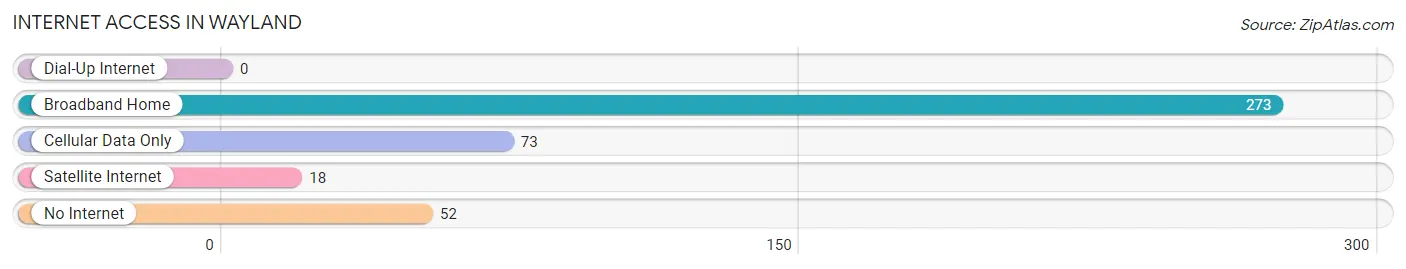
| Internet Type | # Households | % Households |
| Dial-Up Internet | 0 | 0.0% |
| Broadband Home | 273 | 66.9% |
| Cellular Data Only | 73 | 17.9% |
| Satellite Internet | 18 | 4.4% |
| No Internet | 52 | 12.8% |
| Total | 408 | 100.0% |
Wayland Summary
History
The city of Wayland, Iowa is located in Henry County in the southeastern part of the state. It is situated on the banks of the Des Moines River, and is part of the Burlington-Fort Madison Metropolitan Statistical Area. The city was founded in 1837 by a group of settlers from Ohio, led by William Wayland. The settlers were attracted to the area by its fertile soil and abundant natural resources.
The city was originally known as Waylandville, but the name was changed to Wayland in 1851. The city was incorporated in 1856, and the first mayor was elected in 1857. The city grew rapidly in the late 19th century, and by 1900 it had a population of over 1,000.
Wayland was an important stop on the Chicago, Burlington & Quincy Railroad, and the city was a major shipping point for agricultural products. The city also had a thriving manufacturing sector, with several factories producing furniture, clothing, and other goods.
Geography
Wayland is located in southeastern Iowa, in Henry County. It is situated on the banks of the Des Moines River, and is part of the Burlington-Fort Madison Metropolitan Statistical Area. The city has a total area of 2.2 square miles, all of which is land.
The city is located in the Central Lowland region of the Midwest, and is characterized by rolling hills and fertile soil. The climate is humid continental, with hot summers and cold winters. The average annual temperature is around 50 degrees Fahrenheit, and the average annual precipitation is around 36 inches.
Economy
Wayland’s economy is largely based on agriculture and manufacturing. The city is home to several large farms, and the surrounding area is known for its production of corn, soybeans, and other crops. The city is also home to several manufacturing companies, including a furniture factory, a clothing factory, and a plastics factory.
The city is also home to several small businesses, including restaurants, retail stores, and service providers. The city is served by the Burlington-Fort Madison Metropolitan Statistical Area, which has a population of over 200,000.
Demographics
As of the 2010 census, the population of Wayland was 1,845. The racial makeup of the city was 95.3% White, 0.7% African American, 0.3% Native American, 0.3% Asian, 0.1% Pacific Islander, 1.2% from other races, and 2.3% from two or more races. Hispanic or Latino of any race were 3.2% of the population.
The median household income in Wayland was $41,250, and the median family income was $50,000. The per capita income was $20,845. About 11.2% of families and 14.2% of the population were below the poverty line, including 18.2% of those under age 18 and 8.3% of those age 65 or over.
Common Questions
What is Per Capita Income in Wayland?
Per Capita income in Wayland is $30,315.
What is the Median Family Income in Wayland?
Median Family Income in Wayland is $83,393.
What is the Median Household income in Wayland?
Median Household Income in Wayland is $66,731.
What is Income or Wage Gap in Wayland?
Income or Wage Gap in Wayland is 45.9%.
Women in Wayland earn 54.1 cents for every dollar earned by a man.
What is Inequality or Gini Index in Wayland?
Inequality or Gini Index in Wayland is 0.31.
What is the Total Population of Wayland?
Total Population of Wayland is 1,148.
What is the Total Male Population of Wayland?
Total Male Population of Wayland is 503.
What is the Total Female Population of Wayland?
Total Female Population of Wayland is 645.
What is the Ratio of Males per 100 Females in Wayland?
There are 77.98 Males per 100 Females in Wayland.
What is the Ratio of Females per 100 Males in Wayland?
There are 128.23 Females per 100 Males in Wayland.
What is the Median Population Age in Wayland?
Median Population Age in Wayland is 45.3 Years.
What is the Average Family Size in Wayland
Average Family Size in Wayland is 3.2 People.
What is the Average Household Size in Wayland
Average Household Size in Wayland is 2.7 People.
How Large is the Labor Force in Wayland?
There are 624 People in the Labor Forcein in Wayland.
What is the Percentage of People in the Labor Force in Wayland?
64.1% of People are in the Labor Force in Wayland.
What is the Unemployment Rate in Wayland?
Unemployment Rate in Wayland is 2.2%.