Denmark, IA Map & Demographics
Denmark Map
Denmark Overview
$43,900
PER CAPITA INCOME
$145,029
AVG FAMILY INCOME
$116,875
AVG HOUSEHOLD INCOME
0.31
INEQUALITY / GINI INDEX
648
TOTAL POPULATION
222
MALE POPULATION
426
FEMALE POPULATION
52.11
MALES / 100 FEMALES
191.89
FEMALES / 100 MALES
48.8
MEDIAN AGE
2.5
AVG FAMILY SIZE
2.3
AVG HOUSEHOLD SIZE
340
LABOR FORCE [ PEOPLE ]
65.6%
PERCENT IN LABOR FORCE
Denmark Zip Codes
Denmark Area Codes
Income in Denmark
Income Overview in Denmark
Per Capita Income in Denmark is $43,900, while median incomes of families and households are $145,029 and $116,875 respectively.
| Characteristic | Number | Measure |
| Per Capita Income | 648 | $43,900 |
| Median Family Income | 240 | $145,029 |
| Mean Family Income | 240 | $115,973 |
| Median Household Income | 286 | $116,875 |
| Mean Household Income | 286 | $104,974 |
| Income Deficit | 240 | $0 |
| Wage / Income Gap (%) | 648 | 0.00% |
| Wage / Income Gap ($) | 648 | 100.00¢ per $1 |
| Gini / Inequality Index | 648 | 0.31 |
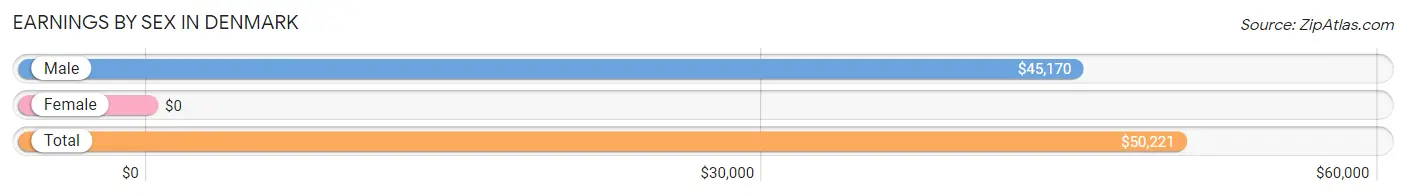
Earnings by Sex in Denmark
| Sex | Number | Average Earnings |
| Male | 123 (34.6%) | $45,170 |
| Female | 232 (65.3%) | $0 |
| Total | 355 (100.0%) | $50,221 |
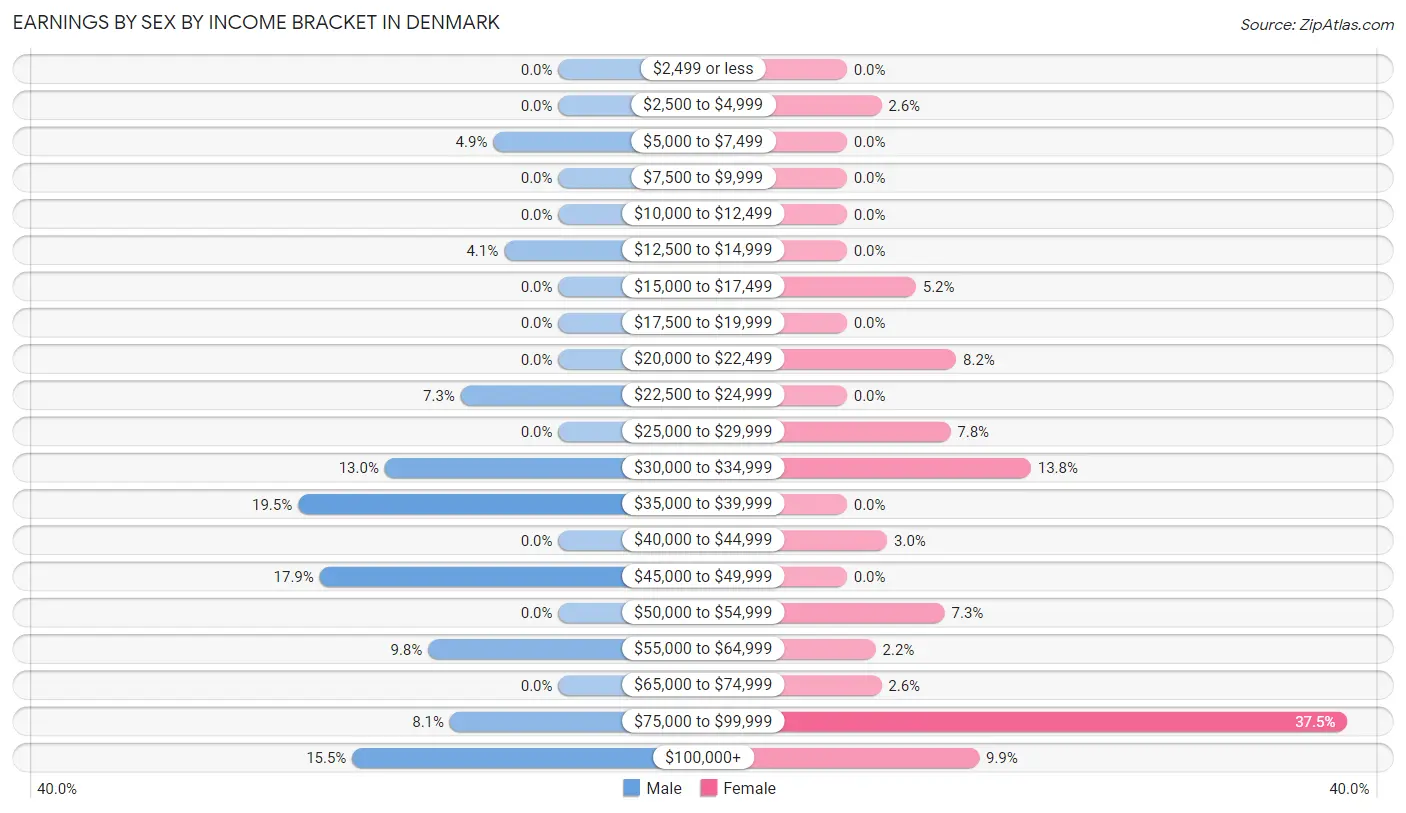
Earnings by Sex by Income Bracket in Denmark
The most common earnings brackets in Denmark are $35,000 to $39,999 for men (24 | 19.5%) and $75,000 to $99,999 for women (87 | 37.5%).
| Income | Male | Female |
| $2,499 or less | 0 (0.0%) | 0 (0.0%) |
| $2,500 to $4,999 | 0 (0.0%) | 6 (2.6%) |
| $5,000 to $7,499 | 6 (4.9%) | 0 (0.0%) |
| $7,500 to $9,999 | 0 (0.0%) | 0 (0.0%) |
| $10,000 to $12,499 | 0 (0.0%) | 0 (0.0%) |
| $12,500 to $14,999 | 5 (4.1%) | 0 (0.0%) |
| $15,000 to $17,499 | 0 (0.0%) | 12 (5.2%) |
| $17,500 to $19,999 | 0 (0.0%) | 0 (0.0%) |
| $20,000 to $22,499 | 0 (0.0%) | 19 (8.2%) |
| $22,500 to $24,999 | 9 (7.3%) | 0 (0.0%) |
| $25,000 to $29,999 | 0 (0.0%) | 18 (7.8%) |
| $30,000 to $34,999 | 16 (13.0%) | 32 (13.8%) |
| $35,000 to $39,999 | 24 (19.5%) | 0 (0.0%) |
| $40,000 to $44,999 | 0 (0.0%) | 7 (3.0%) |
| $45,000 to $49,999 | 22 (17.9%) | 0 (0.0%) |
| $50,000 to $54,999 | 0 (0.0%) | 17 (7.3%) |
| $55,000 to $64,999 | 12 (9.8%) | 5 (2.2%) |
| $65,000 to $74,999 | 0 (0.0%) | 6 (2.6%) |
| $75,000 to $99,999 | 10 (8.1%) | 87 (37.5%) |
| $100,000+ | 19 (15.4%) | 23 (9.9%) |
| Total | 123 (100.0%) | 232 (100.0%) |
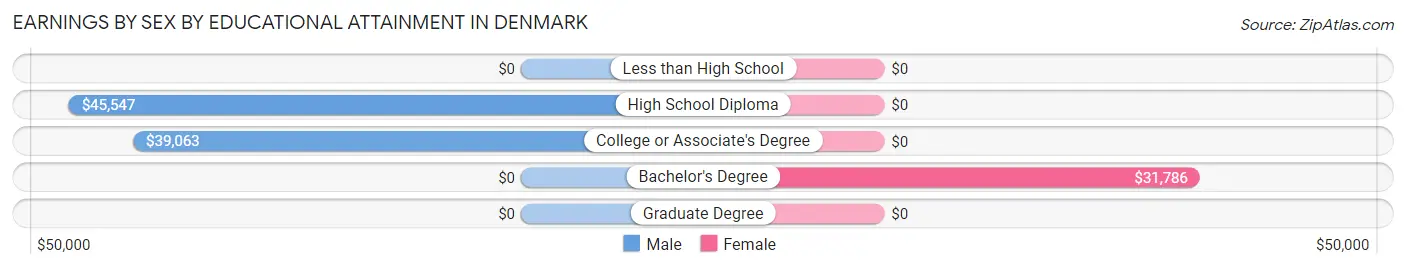
Earnings by Sex by Educational Attainment in Denmark
| Educational Attainment | Male Income | Female Income |
| Less than High School | - | - |
| High School Diploma | $45,547 | $0 |
| College or Associate's Degree | $39,063 | $0 |
| Bachelor's Degree | - | - |
| Graduate Degree | - | - |
| Total | $45,511 | $0 |
Family Income in Denmark
Family Income Brackets in Denmark
According to the Denmark family income data, there are 107 families falling into the $100,000 to $149,999 income range, which is the most common income bracket and makes up 44.6% of all families.
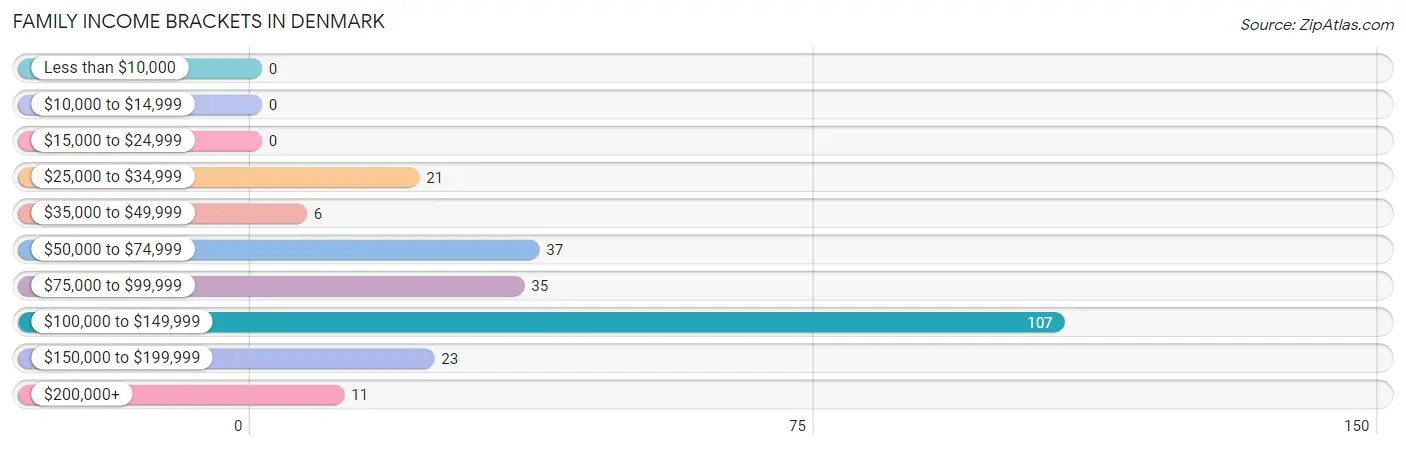
| Income Bracket | # Families | % Families |
| Less than $10,000 | 0 | 0.0% |
| $10,000 to $14,999 | 0 | 0.0% |
| $15,000 to $24,999 | 0 | 0.0% |
| $25,000 to $34,999 | 21 | 8.8% |
| $35,000 to $49,999 | 6 | 2.5% |
| $50,000 to $74,999 | 37 | 15.4% |
| $75,000 to $99,999 | 35 | 14.6% |
| $100,000 to $149,999 | 107 | 44.6% |
| $150,000 to $199,999 | 23 | 9.6% |
| $200,000+ | 11 | 4.6% |
Family Income by Famaliy Size in Denmark
4-person families (33 | 13.8%) account for the highest median family income in Denmark with $178,859 per family, while 2-person families (175 | 72.9%) have the highest median income of $72,564 per family member.
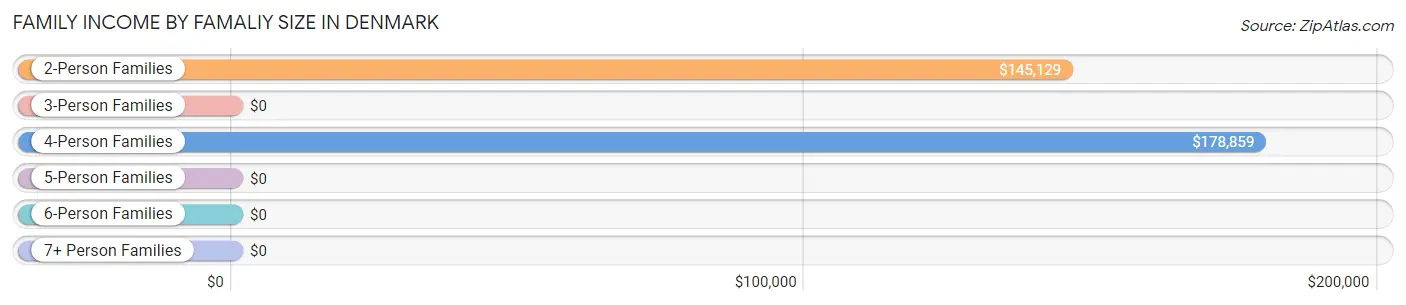
| Income Bracket | # Families | Median Income |
| 2-Person Families | 175 (72.9%) | $145,129 |
| 3-Person Families | 12 (5.0%) | $0 |
| 4-Person Families | 33 (13.8%) | $178,859 |
| 5-Person Families | 20 (8.3%) | $0 |
| 6-Person Families | 0 (0.0%) | $0 |
| 7+ Person Families | 0 (0.0%) | $0 |
| Total | 240 (100.0%) | $145,029 |
Family Income by Number of Earners in Denmark
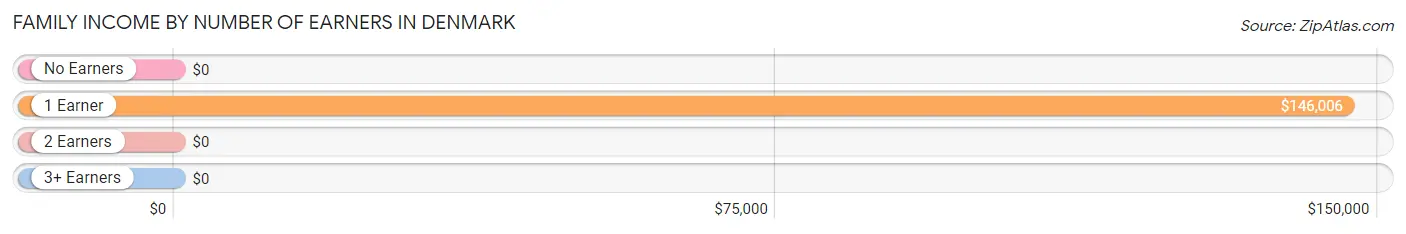
| Number of Earners | # Families | Median Income |
| No Earners | 35 (14.6%) | $0 |
| 1 Earner | 104 (43.3%) | $146,006 |
| 2 Earners | 101 (42.1%) | $0 |
| 3+ Earners | 0 (0.0%) | $0 |
| Total | 240 (100.0%) | $145,029 |
Household Income in Denmark
Household Income Brackets in Denmark
With 112 households falling in the category, the $100,000 to $149,999 income range is the most frequent in Denmark, accounting for 39.2% of all households.
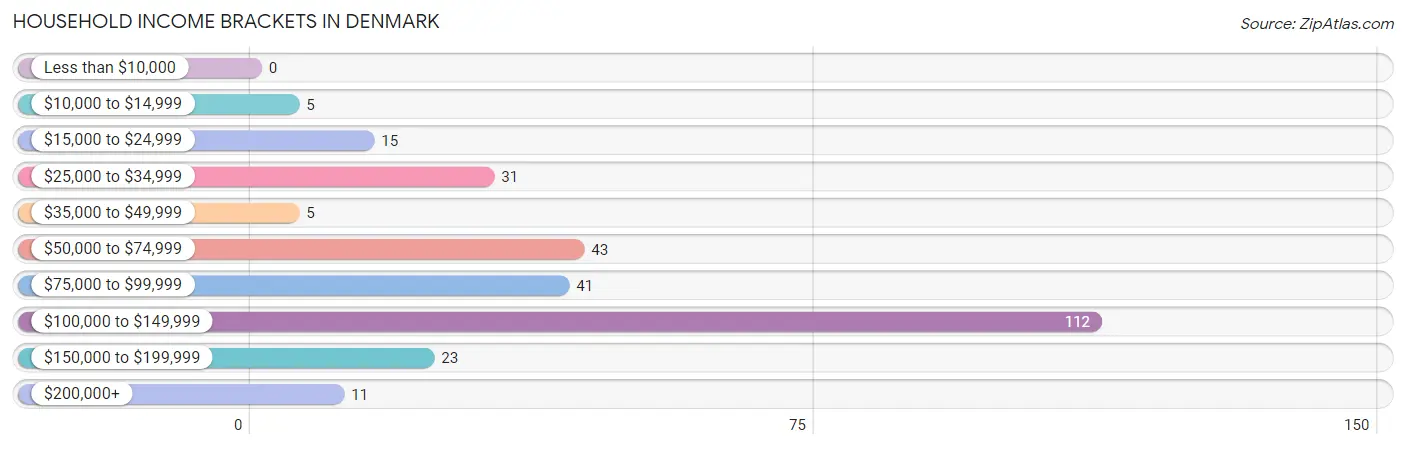
| Income Bracket | # Households | % Households |
| Less than $10,000 | 0 | 0.0% |
| $10,000 to $14,999 | 5 | 1.7% |
| $15,000 to $24,999 | 15 | 5.2% |
| $25,000 to $34,999 | 31 | 10.8% |
| $35,000 to $49,999 | 5 | 1.7% |
| $50,000 to $74,999 | 43 | 15.0% |
| $75,000 to $99,999 | 41 | 14.3% |
| $100,000 to $149,999 | 112 | 39.2% |
| $150,000 to $199,999 | 23 | 8.0% |
| $200,000+ | 11 | 3.8% |
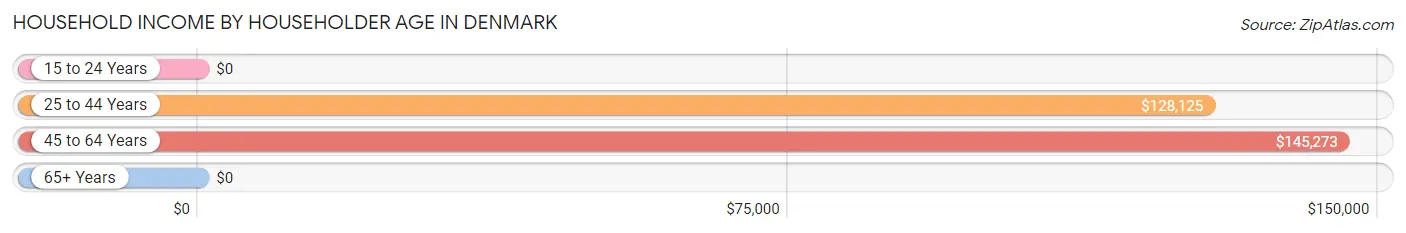
Household Income by Householder Age in Denmark
The median household income in Denmark is $116,875, with the highest median household income of $145,273 found in the 45 to 64 years age bracket for the primary householder. A total of 177 households (61.9%) fall into this category. Meanwhile, the 15 to 24 years age bracket for the primary householder has the lowest median household income of $0, with 5 households (1.8%) in this group.
| Income Bracket | # Households | Median Income |
| 15 to 24 Years | 5 (1.8%) | $0 |
| 25 to 44 Years | 55 (19.2%) | $128,125 |
| 45 to 64 Years | 177 (61.9%) | $145,273 |
| 65+ Years | 49 (17.1%) | $0 |
| Total | 286 (100.0%) | $116,875 |
Poverty in Denmark
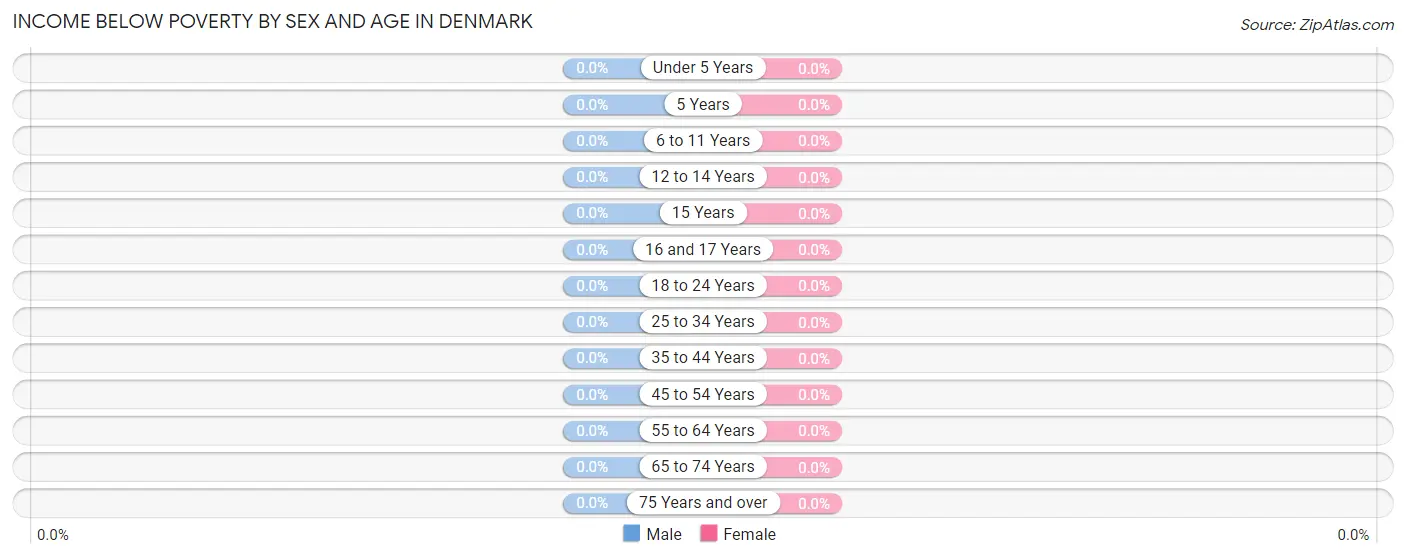
Income Below Poverty by Sex and Age in Denmark
| Age Bracket | Male | Female |
| Under 5 Years | 0 (0.0%) | 0 (0.0%) |
| 5 Years | 0 (0.0%) | 0 (0.0%) |
| 6 to 11 Years | 0 (0.0%) | 0 (0.0%) |
| 12 to 14 Years | 0 (0.0%) | 0 (0.0%) |
| 15 Years | 0 (0.0%) | 0 (0.0%) |
| 16 and 17 Years | 0 (0.0%) | 0 (0.0%) |
| 18 to 24 Years | 0 (0.0%) | 0 (0.0%) |
| 25 to 34 Years | 0 (0.0%) | 0 (0.0%) |
| 35 to 44 Years | 0 (0.0%) | 0 (0.0%) |
| 45 to 54 Years | 0 (0.0%) | 0 (0.0%) |
| 55 to 64 Years | 0 (0.0%) | 0 (0.0%) |
| 65 to 74 Years | 0 (0.0%) | 0 (0.0%) |
| 75 Years and over | 0 (0.0%) | 0 (0.0%) |
| Total | 0 (0.0%) | 0 (0.0%) |
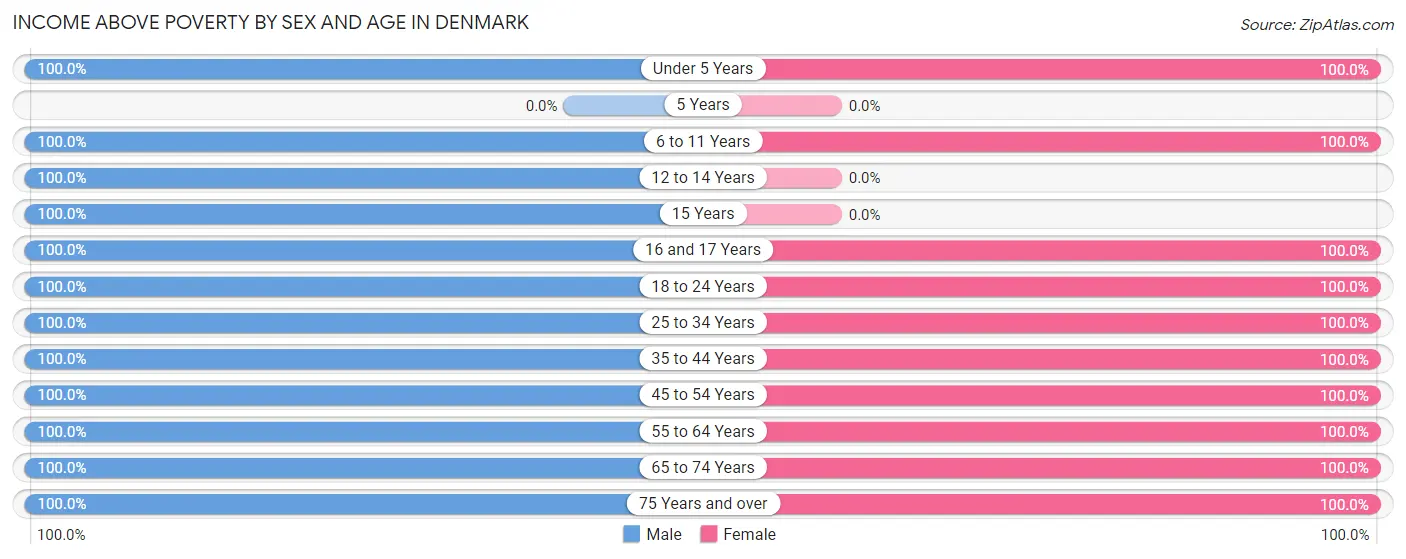
Income Above Poverty by Sex and Age in Denmark
According to the poverty statistics in Denmark, males aged under 5 years and females aged under 5 years are the age groups that are most secure financially, with 100.0% of males and 100.0% of females in these age groups living above the poverty line.
| Age Bracket | Male | Female |
| Under 5 Years | 7 (100.0%) | 24 (100.0%) |
| 5 Years | 0 (0.0%) | 0 (0.0%) |
| 6 to 11 Years | 5 (100.0%) | 76 (100.0%) |
| 12 to 14 Years | 11 (100.0%) | 0 (0.0%) |
| 15 Years | 7 (100.0%) | 0 (0.0%) |
| 16 and 17 Years | 5 (100.0%) | 13 (100.0%) |
| 18 to 24 Years | 6 (100.0%) | 5 (100.0%) |
| 25 to 34 Years | 18 (100.0%) | 15 (100.0%) |
| 35 to 44 Years | 40 (100.0%) | 54 (100.0%) |
| 45 to 54 Years | 24 (100.0%) | 142 (100.0%) |
| 55 to 64 Years | 39 (100.0%) | 28 (100.0%) |
| 65 to 74 Years | 41 (100.0%) | 20 (100.0%) |
| 75 Years and over | 19 (100.0%) | 49 (100.0%) |
| Total | 222 (100.0%) | 426 (100.0%) |
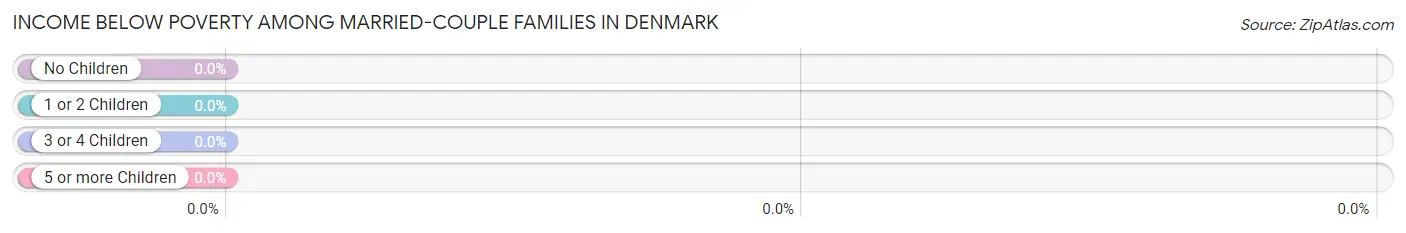
Income Below Poverty Among Married-Couple Families in Denmark
| Children | Above Poverty | Below Poverty |
| No Children | 77 (100.0%) | 0 (0.0%) |
| 1 or 2 Children | 39 (100.0%) | 0 (0.0%) |
| 3 or 4 Children | 20 (100.0%) | 0 (0.0%) |
| 5 or more Children | 0 (0.0%) | 0 (0.0%) |
| Total | 136 (100.0%) | 0 (0.0%) |
Income Below Poverty Among Single-Parent Households in Denmark
| Children | Single Father | Single Mother |
| No Children | 0 (0.0%) | 0 (0.0%) |
| 1 or 2 Children | 0 (0.0%) | 0 (0.0%) |
| 3 or 4 Children | 0 (0.0%) | 0 (0.0%) |
| 5 or more Children | 0 (0.0%) | 0 (0.0%) |
| Total | 0 (0.0%) | 0 (0.0%) |
Income Below Poverty Among Married-Couple vs Single-Parent Households in Denmark
| Children | Married-Couple Families | Single-Parent Households |
| No Children | 0 (0.0%) | 0 (0.0%) |
| 1 or 2 Children | 0 (0.0%) | 0 (0.0%) |
| 3 or 4 Children | 0 (0.0%) | 0 (0.0%) |
| 5 or more Children | 0 (0.0%) | 0 (0.0%) |
| Total | 0 (0.0%) | 0 (0.0%) |
Race in Denmark
The most populous races in Denmark are White / Caucasian (627 | 96.8%), Hispanic or Latino (21 | 3.2%), and Some other Race (13 | 2.0%).
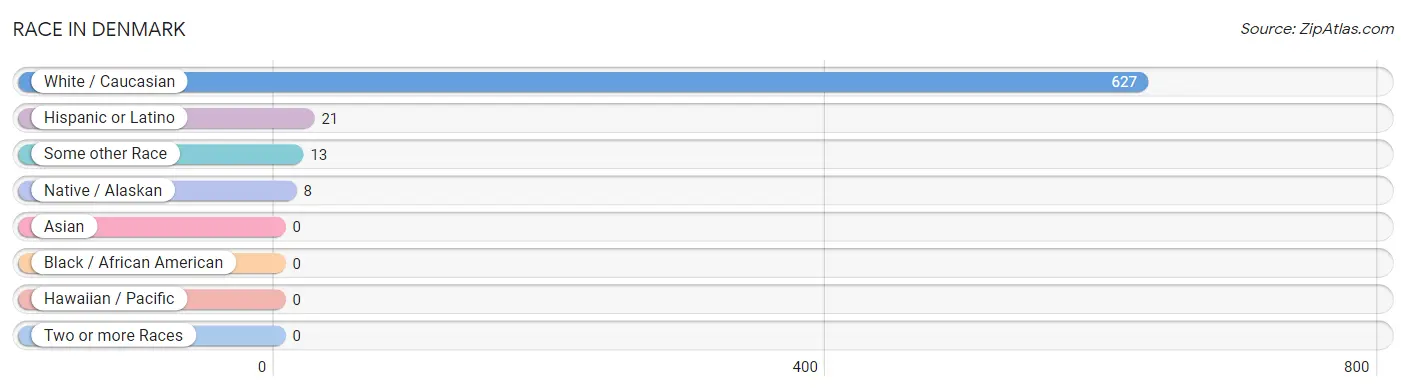
| Race | # Population | % Population |
| Asian | 0 | 0.0% |
| Black / African American | 0 | 0.0% |
| Hawaiian / Pacific | 0 | 0.0% |
| Hispanic or Latino | 21 | 3.2% |
| Native / Alaskan | 8 | 1.2% |
| White / Caucasian | 627 | 96.8% |
| Two or more Races | 0 | 0.0% |
| Some other Race | 13 | 2.0% |
| Total | 648 | 100.0% |
Ancestry in Denmark
The most populous ancestries reported in Denmark are German (223 | 34.4%), Irish (47 | 7.2%), Mexican (21 | 3.2%), Danish (19 | 2.9%), and Polish (19 | 2.9%), together accounting for 50.8% of all Denmark residents.
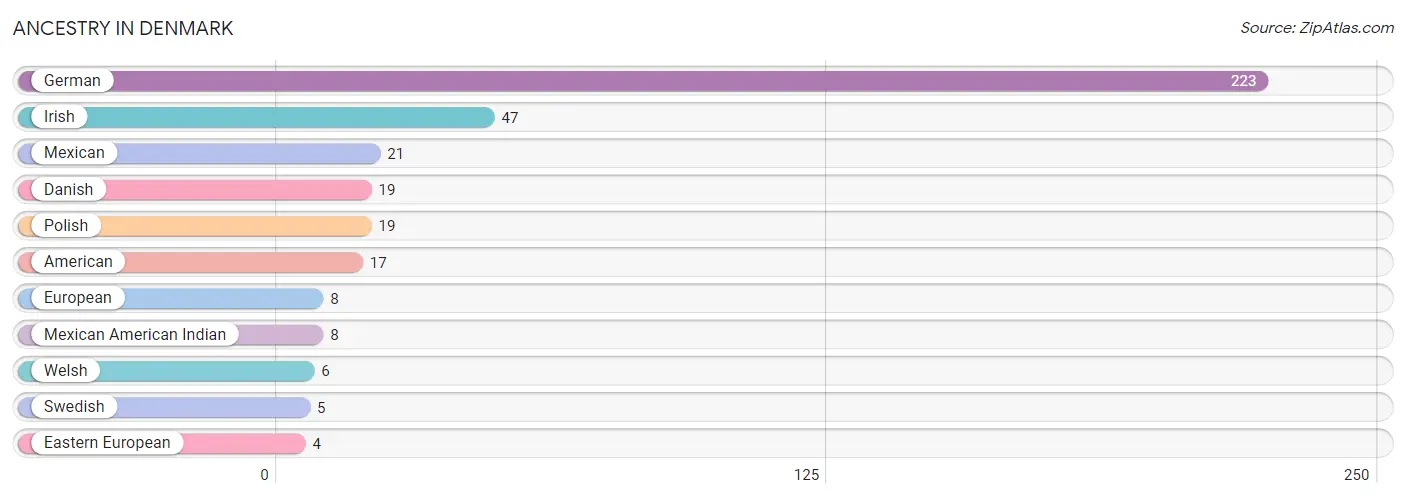
| Ancestry | # Population | % Population |
| American | 17 | 2.6% |
| Danish | 19 | 2.9% |
| Eastern European | 4 | 0.6% |
| European | 8 | 1.2% |
| German | 223 | 34.4% |
| Irish | 47 | 7.2% |
| Mexican | 21 | 3.2% |
| Mexican American Indian | 8 | 1.2% |
| Polish | 19 | 2.9% |
| Swedish | 5 | 0.8% |
| Welsh | 6 | 0.9% | View All 11 Rows |
Immigrants in Denmark

| Immigration Origin | # Population | % Population | View All 0 Rows |
Sex and Age in Denmark
Sex and Age in Denmark
The most populous age groups in Denmark are 40 to 44 Years (40 | 18.0%) for men and 50 to 54 Years (100 | 23.5%) for women.
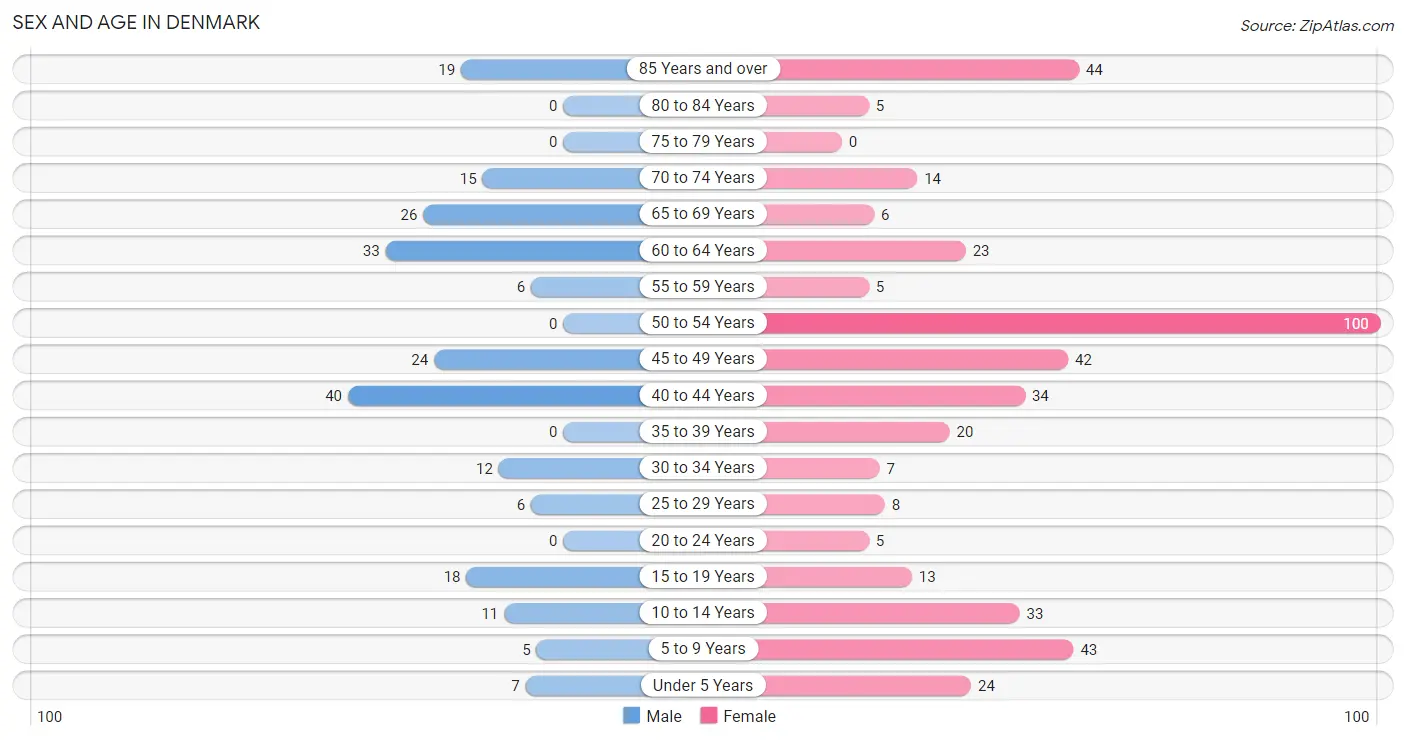
| Age Bracket | Male | Female |
| Under 5 Years | 7 (3.2%) | 24 (5.6%) |
| 5 to 9 Years | 5 (2.2%) | 43 (10.1%) |
| 10 to 14 Years | 11 (5.0%) | 33 (7.7%) |
| 15 to 19 Years | 18 (8.1%) | 13 (3.0%) |
| 20 to 24 Years | 0 (0.0%) | 5 (1.2%) |
| 25 to 29 Years | 6 (2.7%) | 8 (1.9%) |
| 30 to 34 Years | 12 (5.4%) | 7 (1.6%) |
| 35 to 39 Years | 0 (0.0%) | 20 (4.7%) |
| 40 to 44 Years | 40 (18.0%) | 34 (8.0%) |
| 45 to 49 Years | 24 (10.8%) | 42 (9.9%) |
| 50 to 54 Years | 0 (0.0%) | 100 (23.5%) |
| 55 to 59 Years | 6 (2.7%) | 5 (1.2%) |
| 60 to 64 Years | 33 (14.9%) | 23 (5.4%) |
| 65 to 69 Years | 26 (11.7%) | 6 (1.4%) |
| 70 to 74 Years | 15 (6.8%) | 14 (3.3%) |
| 75 to 79 Years | 0 (0.0%) | 0 (0.0%) |
| 80 to 84 Years | 0 (0.0%) | 5 (1.2%) |
| 85 Years and over | 19 (8.6%) | 44 (10.3%) |
| Total | 222 (100.0%) | 426 (100.0%) |
Families and Households in Denmark
Median Family Size in Denmark
The median family size in Denmark is 2.45 persons per family, with married-couple families (136 | 56.7%) accounting for the largest median family size of 3.15 persons per family. On the other hand, single female/mother families (93 | 38.8%) represent the smallest median family size with 1.42 persons per family.
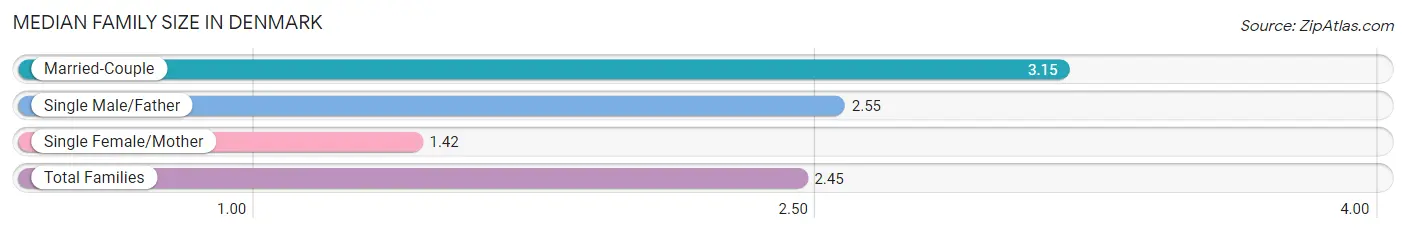
| Family Type | # Families | Family Size |
| Married-Couple | 136 (56.7%) | 3.15 |
| Single Male/Father | 11 (4.6%) | 2.55 |
| Single Female/Mother | 93 (38.8%) | 1.42 |
| Total Families | 240 (100.0%) | 2.45 |
Median Household Size in Denmark
The median household size in Denmark is 2.27 persons per household, with single male/father households (11 | 3.8%) accounting for the largest median household size of 3.27 persons per household. non-family households (46 | 16.1%) represent the smallest median household size with 1.13 persons per household.
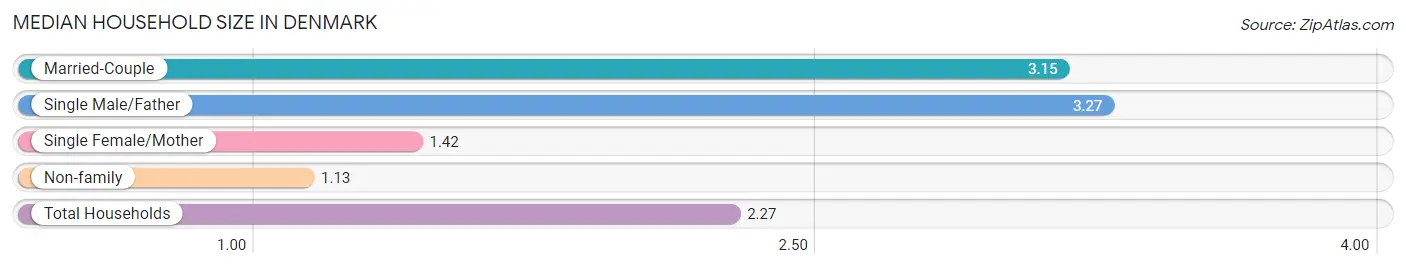
| Household Type | # Households | Household Size |
| Married-Couple | 136 (47.5%) | 3.15 |
| Single Male/Father | 11 (3.8%) | 3.27 |
| Single Female/Mother | 93 (32.5%) | 1.42 |
| Non-family | 46 (16.1%) | 1.13 |
| Total Households | 286 (100.0%) | 2.27 |
Household Size by Marriage Status in Denmark
Out of a total of 286 households in Denmark, 240 (83.9%) are family households, while 46 (16.1%) are nonfamily households. The most numerous type of family households are 2-person households, comprising 175, and the most common type of nonfamily households are 1-person households, comprising 41.
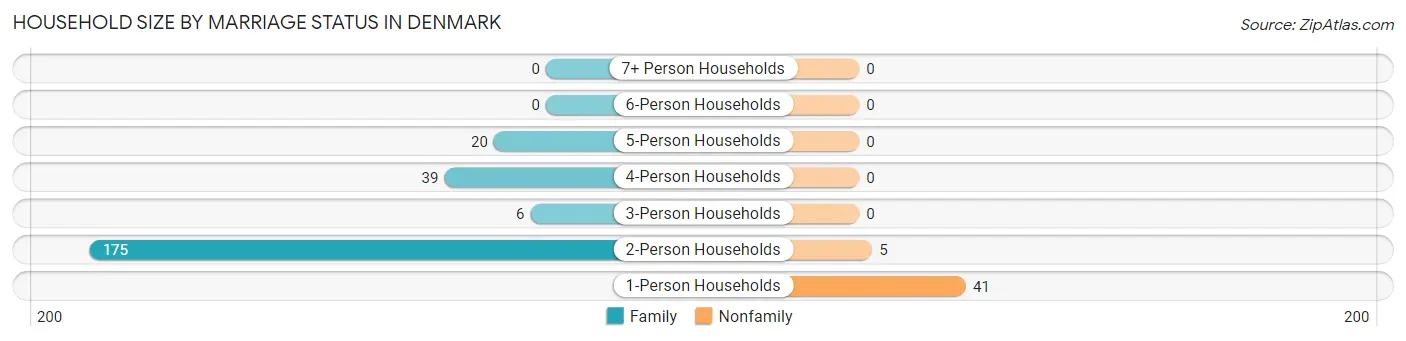
| Household Size | Family Households | Nonfamily Households |
| 1-Person Households | - | 41 (14.3%) |
| 2-Person Households | 175 (61.2%) | 5 (1.8%) |
| 3-Person Households | 6 (2.1%) | 0 (0.0%) |
| 4-Person Households | 39 (13.6%) | 0 (0.0%) |
| 5-Person Households | 20 (7.0%) | 0 (0.0%) |
| 6-Person Households | 0 (0.0%) | 0 (0.0%) |
| 7+ Person Households | 0 (0.0%) | 0 (0.0%) |
| Total | 240 (83.9%) | 46 (16.1%) |
Female Fertility in Denmark
Fertility by Age in Denmark
Average fertility rate in Denmark is 54.0 births per 1,000 women. Women in the age bracket of 20 to 34 years have the highest fertility rate with 350.0 births per 1,000 women. Women in the age bracket of 20 to 34 years acount for 100.0% of all women with births.
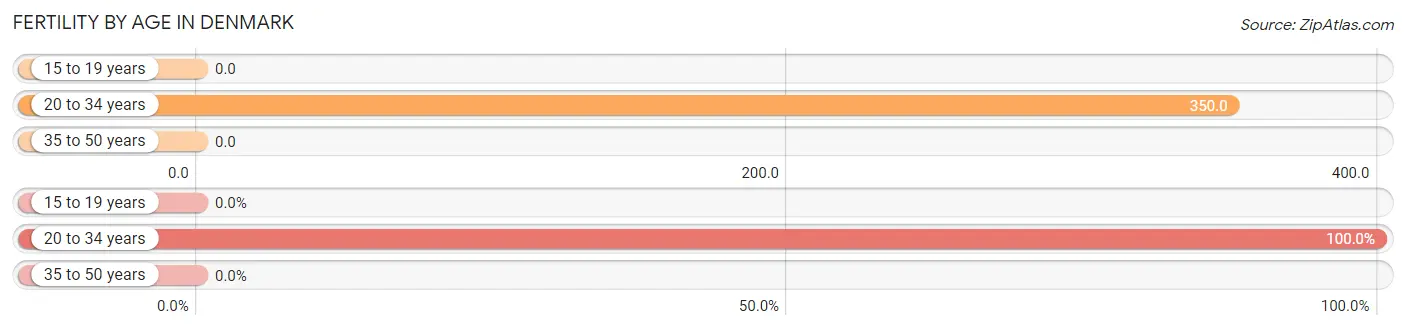
| Age Bracket | Women with Births | Births / 1,000 Women |
| 15 to 19 years | 0 (0.0%) | 0.0 |
| 20 to 34 years | 7 (100.0%) | 350.0 |
| 35 to 50 years | 0 (0.0%) | 0.0 |
| Total | 7 (100.0%) | 54.0 |
Fertility by Age by Marriage Status in Denmark
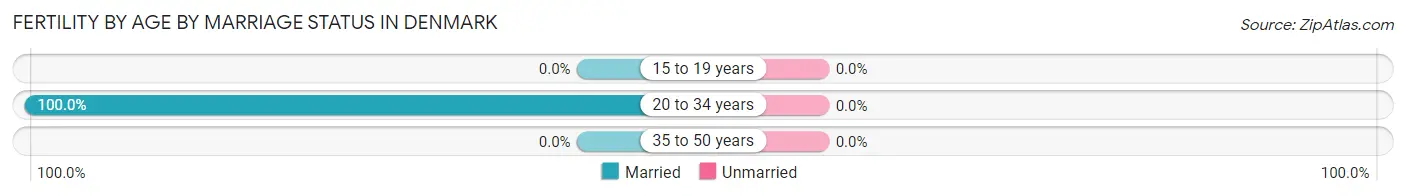
| Age Bracket | Married | Unmarried |
| 15 to 19 years | 0 (0.0%) | 0 (0.0%) |
| 20 to 34 years | 7 (100.0%) | 0 (0.0%) |
| 35 to 50 years | 0 (0.0%) | 0 (0.0%) |
| Total | 7 (100.0%) | 0 (0.0%) |
Fertility by Education in Denmark
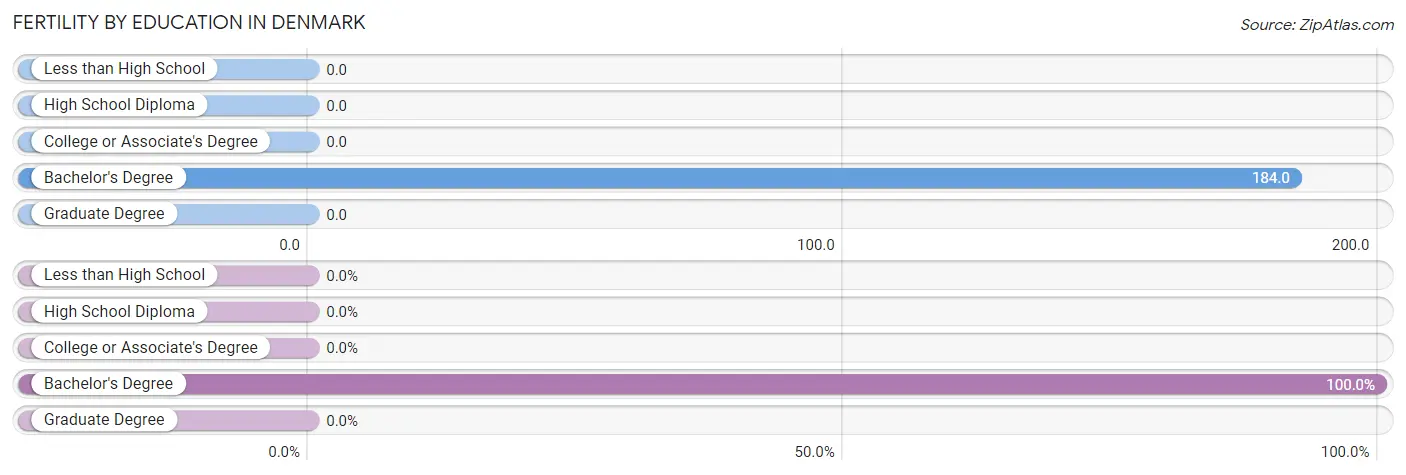
| Educational Attainment | Women with Births | Births / 1,000 Women |
| Less than High School | 0 (0.0%) | 0.0 |
| High School Diploma | 0 (0.0%) | 0.0 |
| College or Associate's Degree | 0 (0.0%) | 0.0 |
| Bachelor's Degree | 7 (100.0%) | 184.0 |
| Graduate Degree | 0 (0.0%) | 0.0 |
| Total | 7 (100.0%) | 54.0 |
Fertility by Education by Marriage Status in Denmark
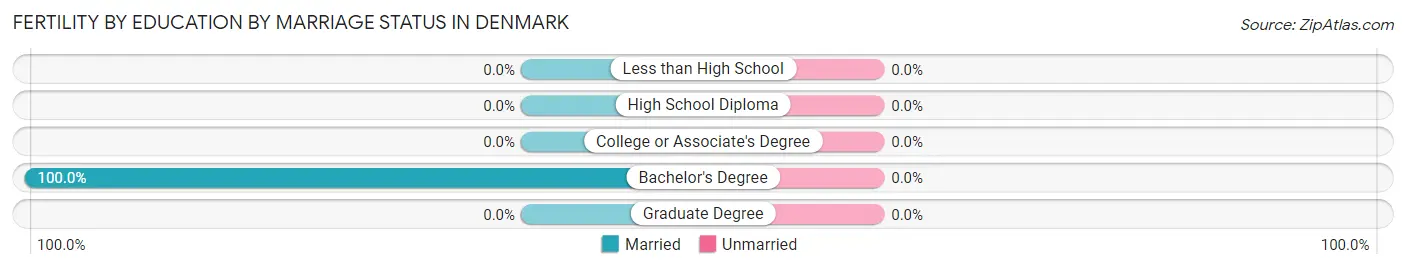
| Educational Attainment | Married | Unmarried |
| Less than High School | 0 (0.0%) | 0 (0.0%) |
| High School Diploma | 0 (0.0%) | 0 (0.0%) |
| College or Associate's Degree | 0 (0.0%) | 0 (0.0%) |
| Bachelor's Degree | 7 (100.0%) | 0 (0.0%) |
| Graduate Degree | 0 (0.0%) | 0 (0.0%) |
| Total | 7 (100.0%) | 0 (0.0%) |
Employment Characteristics in Denmark
Employment by Class of Employer in Denmark
Among the 335 employed individuals in Denmark, private company employees (187 | 55.8%), state government employees (87 | 26.0%), and not-for-profit organizations (38 | 11.3%) make up the most common classes of employment.
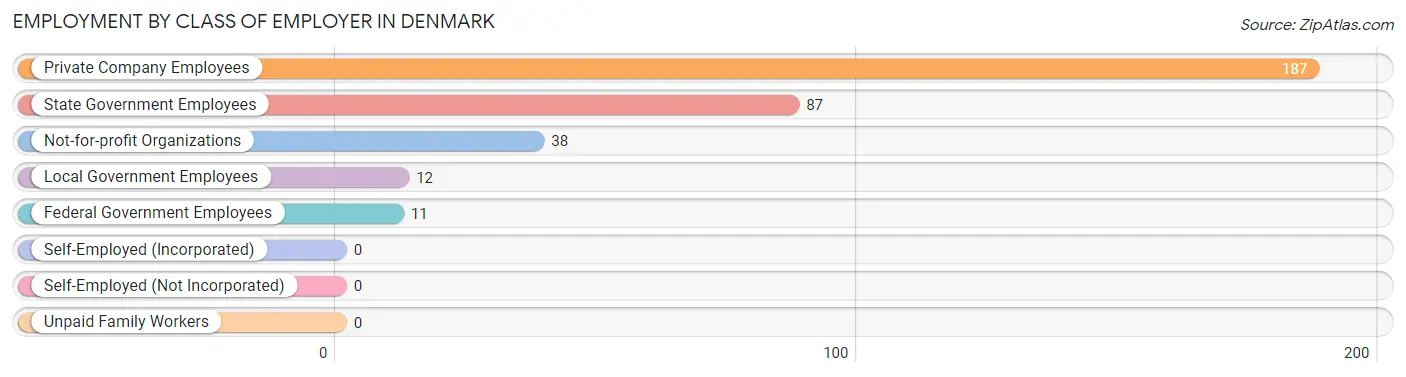
| Employer Class | # Employees | % Employees |
| Private Company Employees | 187 | 55.8% |
| Self-Employed (Incorporated) | 0 | 0.0% |
| Self-Employed (Not Incorporated) | 0 | 0.0% |
| Not-for-profit Organizations | 38 | 11.3% |
| Local Government Employees | 12 | 3.6% |
| State Government Employees | 87 | 26.0% |
| Federal Government Employees | 11 | 3.3% |
| Unpaid Family Workers | 0 | 0.0% |
| Total | 335 | 100.0% |
Employment Status by Age in Denmark
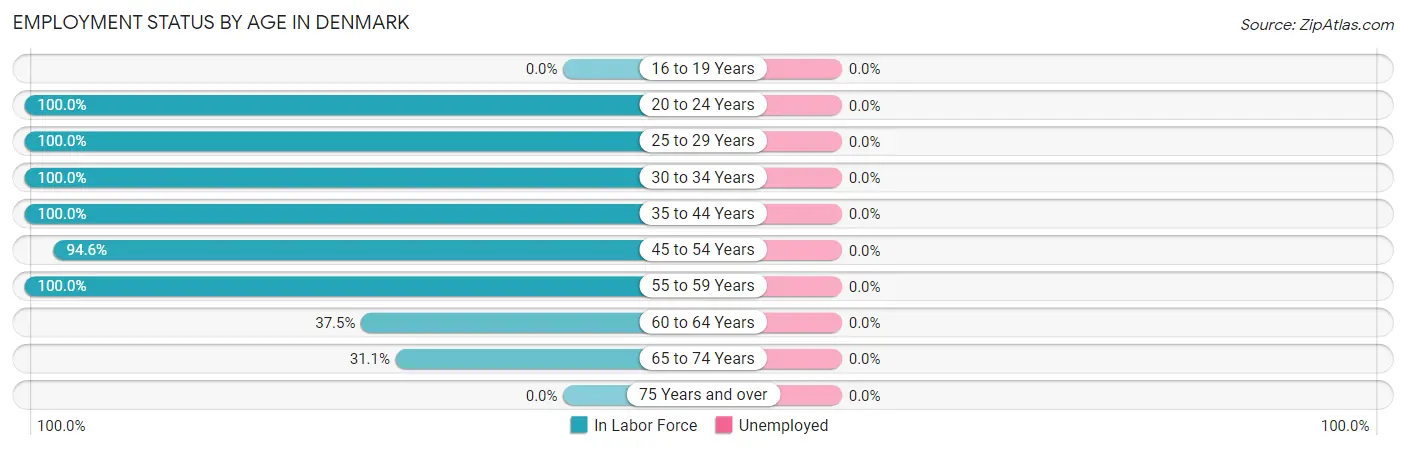
| Age Bracket | In Labor Force | Unemployed |
| 16 to 19 Years | 0 (0.0%) | 0 (0.0%) |
| 20 to 24 Years | 5 (100.0%) | 0 (0.0%) |
| 25 to 29 Years | 14 (100.0%) | 0 (0.0%) |
| 30 to 34 Years | 19 (100.0%) | 0 (0.0%) |
| 35 to 44 Years | 94 (100.0%) | 0 (0.0%) |
| 45 to 54 Years | 157 (94.6%) | 0 (0.0%) |
| 55 to 59 Years | 11 (100.0%) | 0 (0.0%) |
| 60 to 64 Years | 21 (37.5%) | 0 (0.0%) |
| 65 to 74 Years | 19 (31.1%) | 0 (0.0%) |
| 75 Years and over | 0 (0.0%) | 0 (0.0%) |
| Total | 340 (65.6%) | 0 (0.0%) |
Employment Status by Educational Attainment in Denmark
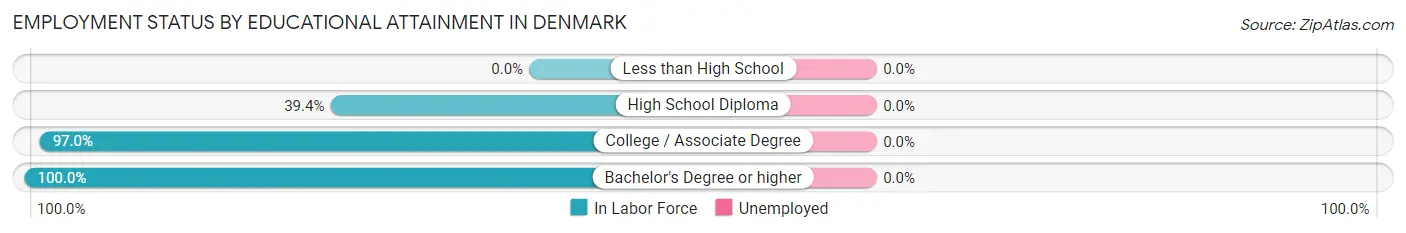
| Educational Attainment | In Labor Force | Unemployed |
| Less than High School | 0 (0.0%) | 0 (0.0%) |
| High School Diploma | 26 (39.4%) | 0 (0.0%) |
| College / Associate Degree | 130 (97.0%) | 0 (0.0%) |
| Bachelor's Degree or higher | 160 (100.0%) | 0 (0.0%) |
| Total | 316 (87.8%) | 0 (0.0%) |
Employment Occupations by Sex in Denmark
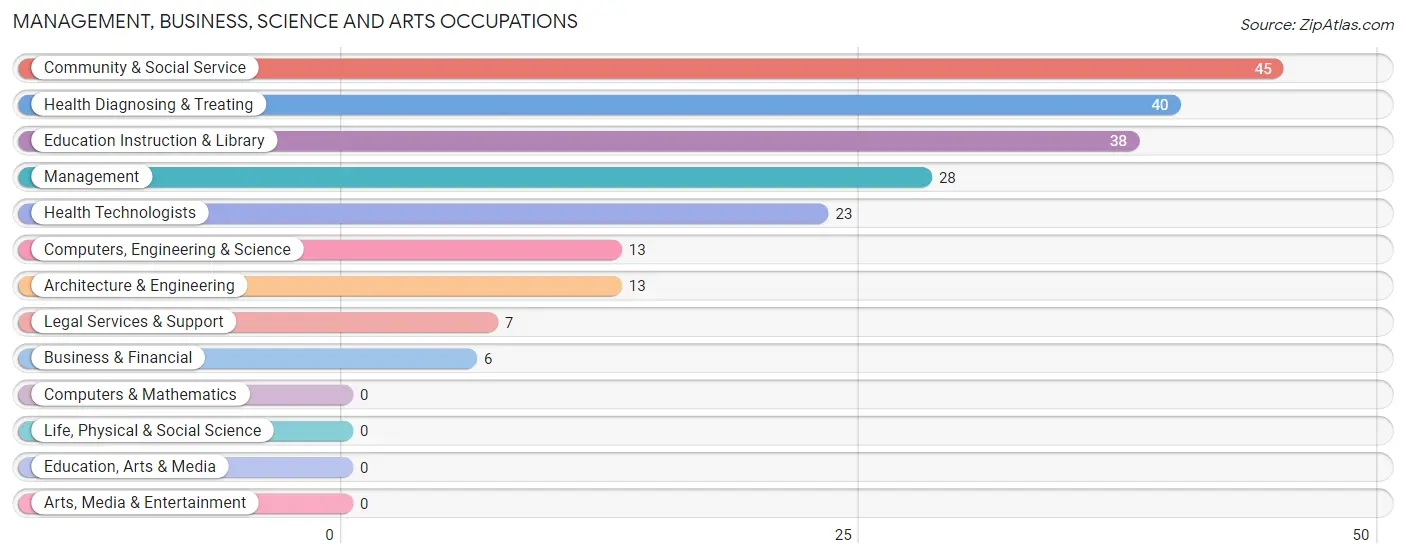
Management, Business, Science and Arts Occupations
The most common Management, Business, Science and Arts occupations in Denmark are Community & Social Service (45 | 13.2%), Health Diagnosing & Treating (40 | 11.8%), Education Instruction & Library (38 | 11.2%), Management (28 | 8.2%), and Health Technologists (23 | 6.8%).
Management, Business, Science and Arts Occupations by Sex
Within the Management, Business, Science and Arts occupations in Denmark, the most male-oriented occupations are Management (100.0%), Business & Financial (100.0%), and Computers, Engineering & Science (100.0%), while the most female-oriented occupations are Legal Services & Support (100.0%), Health Diagnosing & Treating (100.0%), and Health Technologists (100.0%).
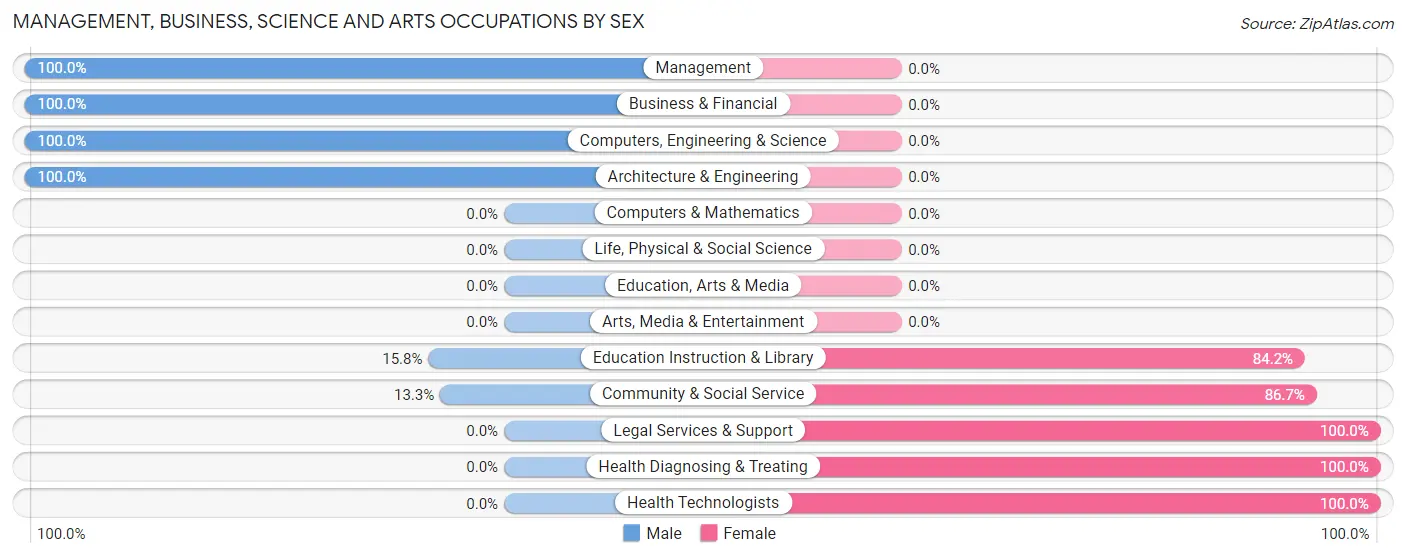
| Occupation | Male | Female |
| Management | 28 (100.0%) | 0 (0.0%) |
| Business & Financial | 6 (100.0%) | 0 (0.0%) |
| Computers, Engineering & Science | 13 (100.0%) | 0 (0.0%) |
| Computers & Mathematics | 0 (0.0%) | 0 (0.0%) |
| Architecture & Engineering | 13 (100.0%) | 0 (0.0%) |
| Life, Physical & Social Science | 0 (0.0%) | 0 (0.0%) |
| Community & Social Service | 6 (13.3%) | 39 (86.7%) |
| Education, Arts & Media | 0 (0.0%) | 0 (0.0%) |
| Legal Services & Support | 0 (0.0%) | 7 (100.0%) |
| Education Instruction & Library | 6 (15.8%) | 32 (84.2%) |
| Arts, Media & Entertainment | 0 (0.0%) | 0 (0.0%) |
| Health Diagnosing & Treating | 0 (0.0%) | 40 (100.0%) |
| Health Technologists | 0 (0.0%) | 23 (100.0%) |
| Total (Category) | 53 (40.2%) | 79 (59.9%) |
| Total (Overall) | 108 (31.8%) | 232 (68.2%) |
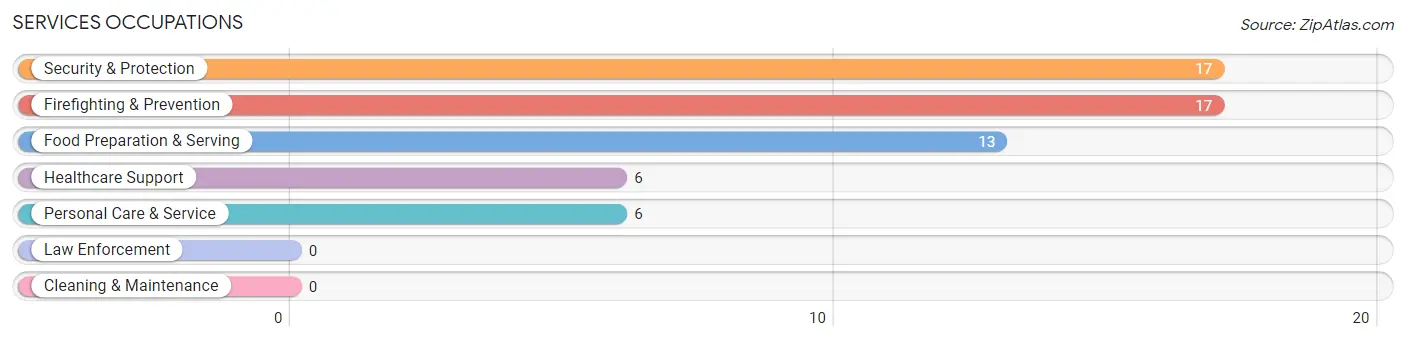
Services Occupations
The most common Services occupations in Denmark are Security & Protection (17 | 5.0%), Firefighting & Prevention (17 | 5.0%), Food Preparation & Serving (13 | 3.8%), Healthcare Support (6 | 1.8%), and Personal Care & Service (6 | 1.8%).
Services Occupations by Sex
Within the Services occupations in Denmark, the most male-oriented occupations are Security & Protection (35.3%), and Firefighting & Prevention (35.3%), while the most female-oriented occupations are Healthcare Support (100.0%), Food Preparation & Serving (100.0%), and Personal Care & Service (100.0%).
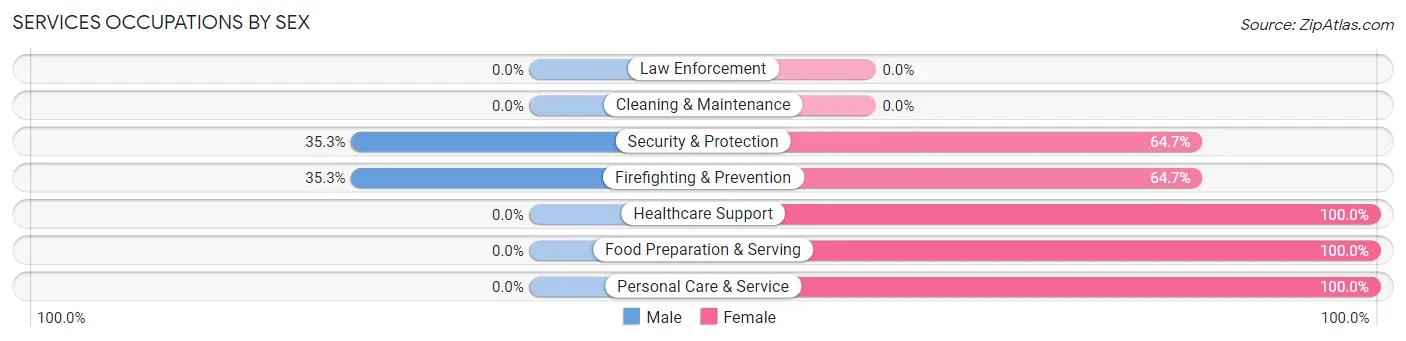
| Occupation | Male | Female |
| Healthcare Support | 0 (0.0%) | 6 (100.0%) |
| Security & Protection | 6 (35.3%) | 11 (64.7%) |
| Firefighting & Prevention | 6 (35.3%) | 11 (64.7%) |
| Law Enforcement | 0 (0.0%) | 0 (0.0%) |
| Food Preparation & Serving | 0 (0.0%) | 13 (100.0%) |
| Cleaning & Maintenance | 0 (0.0%) | 0 (0.0%) |
| Personal Care & Service | 0 (0.0%) | 6 (100.0%) |
| Total (Category) | 6 (14.3%) | 36 (85.7%) |
| Total (Overall) | 108 (31.8%) | 232 (68.2%) |
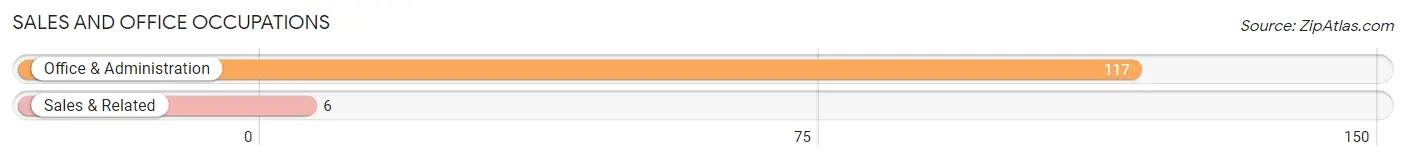
Sales and Office Occupations
The most common Sales and Office occupations in Denmark are Office & Administration (117 | 34.4%), and Sales & Related (6 | 1.8%).
Sales and Office Occupations by Sex
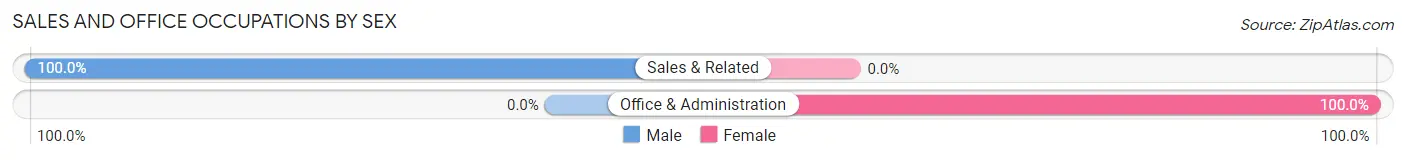
| Occupation | Male | Female |
| Sales & Related | 6 (100.0%) | 0 (0.0%) |
| Office & Administration | 0 (0.0%) | 117 (100.0%) |
| Total (Category) | 6 (4.9%) | 117 (95.1%) |
| Total (Overall) | 108 (31.8%) | 232 (68.2%) |
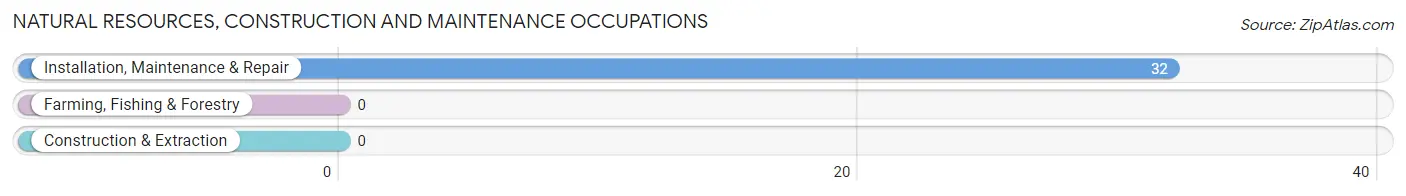
Natural Resources, Construction and Maintenance Occupations
The most common Natural Resources, Construction and Maintenance occupations in Denmark are , and Installation, Maintenance & Repair (32 | 9.4%).
Natural Resources, Construction and Maintenance Occupations by Sex
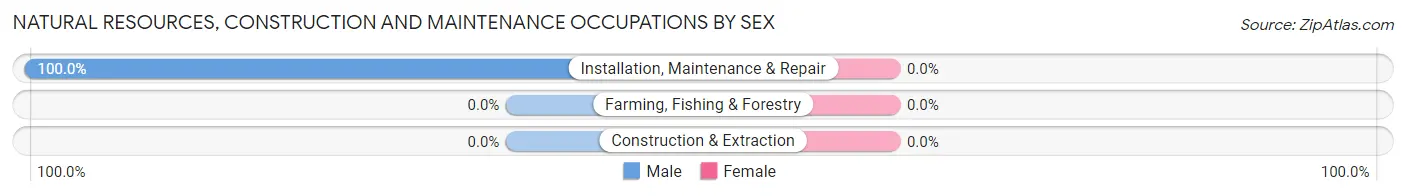
| Occupation | Male | Female |
| Farming, Fishing & Forestry | 0 (0.0%) | 0 (0.0%) |
| Construction & Extraction | 0 (0.0%) | 0 (0.0%) |
| Installation, Maintenance & Repair | 32 (100.0%) | 0 (0.0%) |
| Total (Category) | 32 (100.0%) | 0 (0.0%) |
| Total (Overall) | 108 (31.8%) | 232 (68.2%) |
Production, Transportation and Moving Occupations
The most common Production, Transportation and Moving occupations in Denmark are Production (6 | 1.8%), and Transportation (5 | 1.5%).
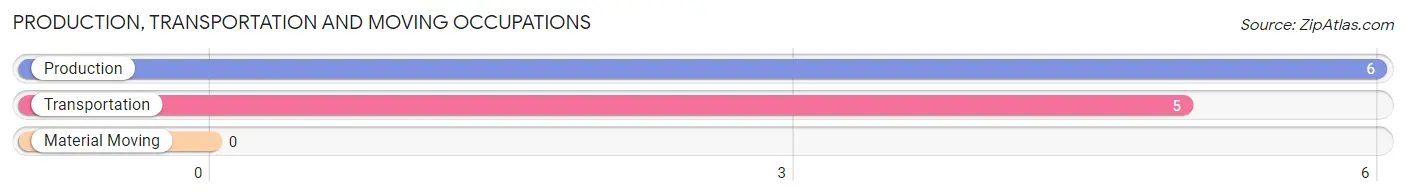
Production, Transportation and Moving Occupations by Sex
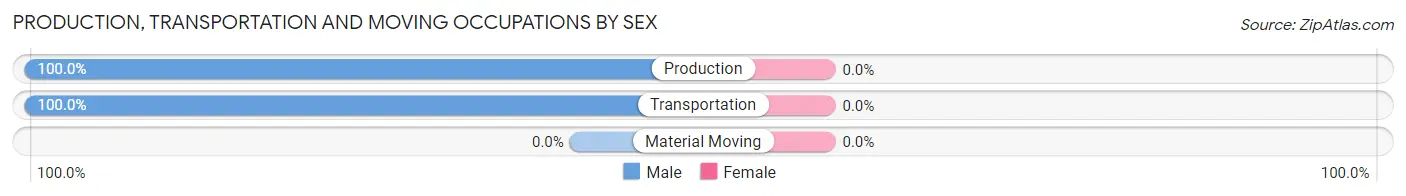
| Occupation | Male | Female |
| Production | 6 (100.0%) | 0 (0.0%) |
| Transportation | 5 (100.0%) | 0 (0.0%) |
| Material Moving | 0 (0.0%) | 0 (0.0%) |
| Total (Category) | 11 (100.0%) | 0 (0.0%) |
| Total (Overall) | 108 (31.8%) | 232 (68.2%) |
Employment Industries by Sex in Denmark
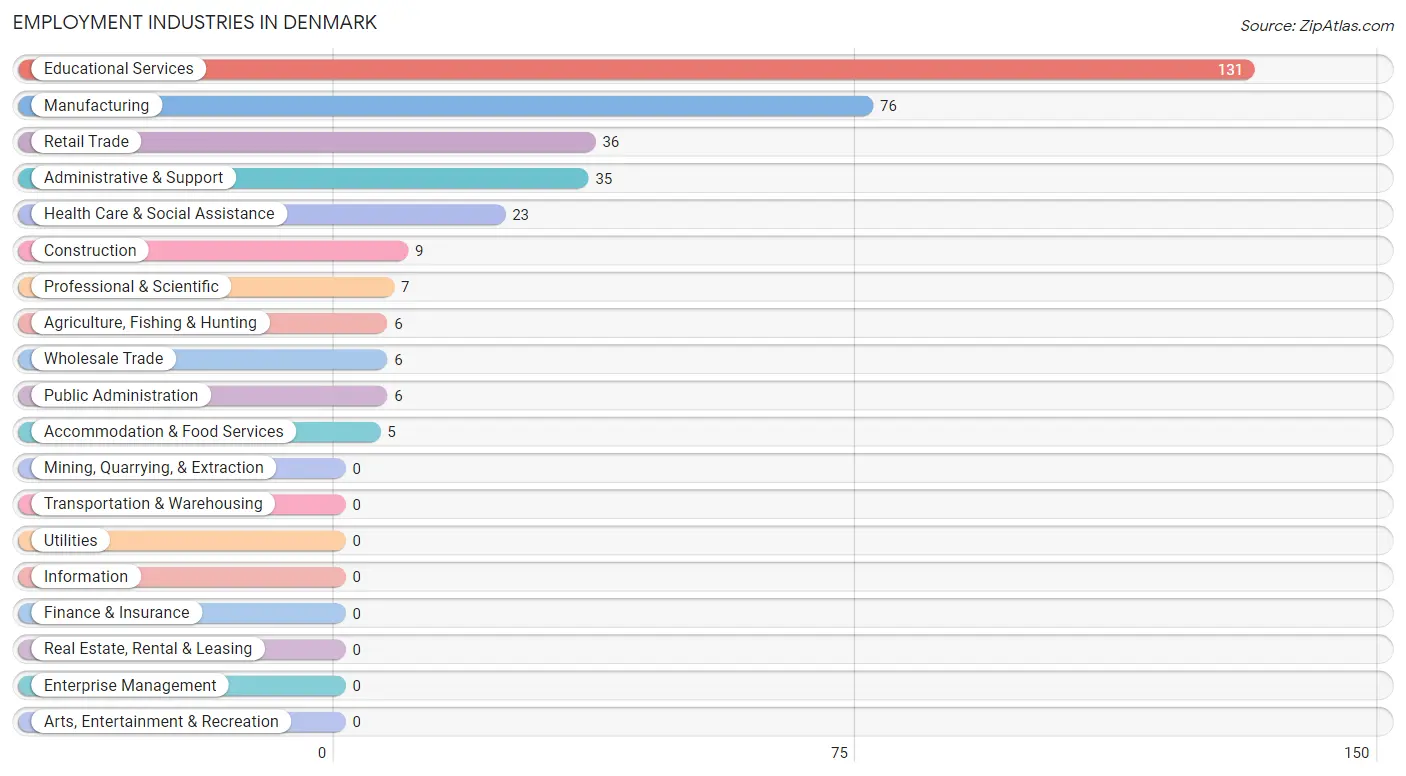
Employment Industries in Denmark
The major employment industries in Denmark include Educational Services (131 | 38.5%), Manufacturing (76 | 22.4%), Retail Trade (36 | 10.6%), Administrative & Support (35 | 10.3%), and Health Care & Social Assistance (23 | 6.8%).
Employment Industries by Sex in Denmark
The Denmark industries that see more men than women are Wholesale Trade (100.0%), Manufacturing (93.4%), and Administrative & Support (45.7%), whereas the industries that tend to have a higher number of women are Agriculture, Fishing & Hunting (100.0%), Professional & Scientific (100.0%), and Health Care & Social Assistance (100.0%).
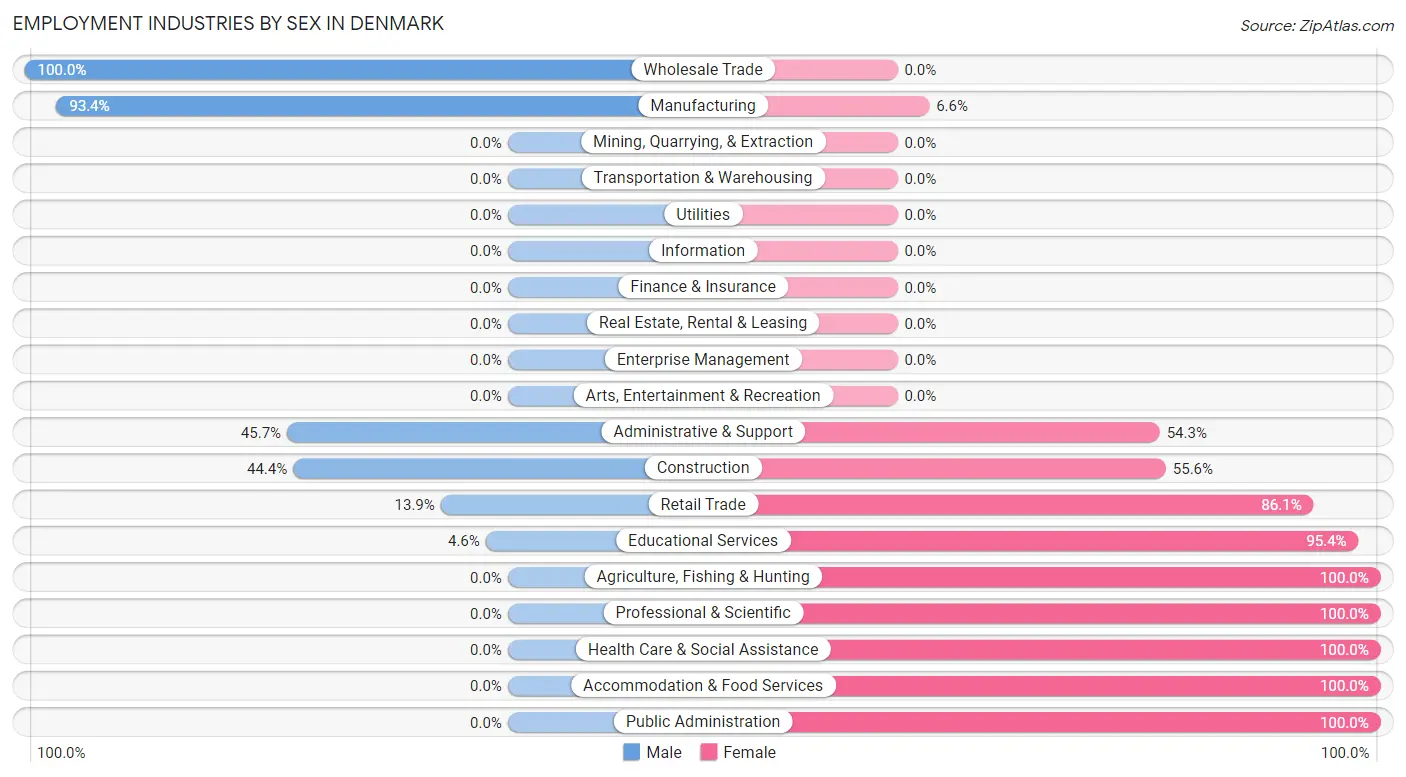
| Industry | Male | Female |
| Agriculture, Fishing & Hunting | 0 (0.0%) | 6 (100.0%) |
| Mining, Quarrying, & Extraction | 0 (0.0%) | 0 (0.0%) |
| Construction | 4 (44.4%) | 5 (55.6%) |
| Manufacturing | 71 (93.4%) | 5 (6.6%) |
| Wholesale Trade | 6 (100.0%) | 0 (0.0%) |
| Retail Trade | 5 (13.9%) | 31 (86.1%) |
| Transportation & Warehousing | 0 (0.0%) | 0 (0.0%) |
| Utilities | 0 (0.0%) | 0 (0.0%) |
| Information | 0 (0.0%) | 0 (0.0%) |
| Finance & Insurance | 0 (0.0%) | 0 (0.0%) |
| Real Estate, Rental & Leasing | 0 (0.0%) | 0 (0.0%) |
| Professional & Scientific | 0 (0.0%) | 7 (100.0%) |
| Enterprise Management | 0 (0.0%) | 0 (0.0%) |
| Administrative & Support | 16 (45.7%) | 19 (54.3%) |
| Educational Services | 6 (4.6%) | 125 (95.4%) |
| Health Care & Social Assistance | 0 (0.0%) | 23 (100.0%) |
| Arts, Entertainment & Recreation | 0 (0.0%) | 0 (0.0%) |
| Accommodation & Food Services | 0 (0.0%) | 5 (100.0%) |
| Public Administration | 0 (0.0%) | 6 (100.0%) |
| Total | 108 (31.8%) | 232 (68.2%) |
Education in Denmark
School Enrollment in Denmark
The most common levels of schooling among the 123 students in Denmark are elementary school (54 | 43.9%), middle school (33 | 26.8%), and high school (30 | 24.4%).
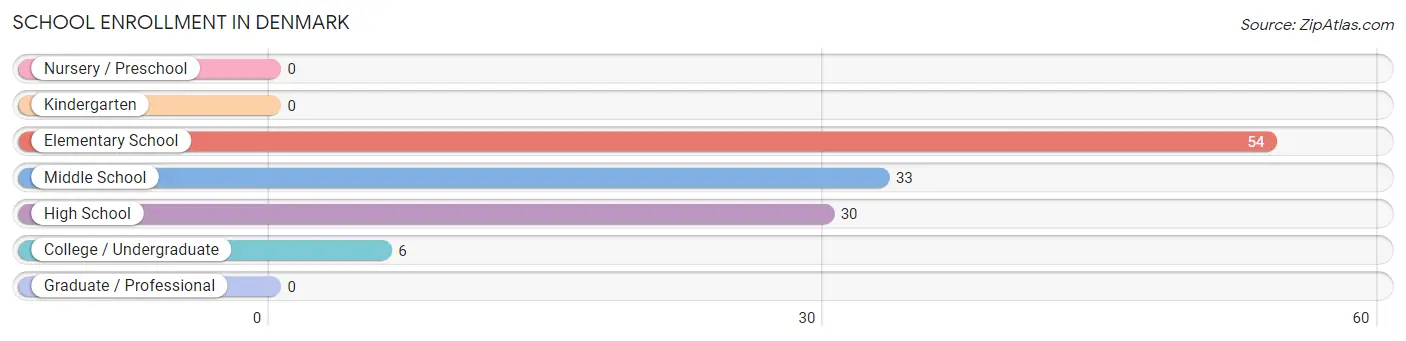
| School Level | # Students | % Students |
| Nursery / Preschool | 0 | 0.0% |
| Kindergarten | 0 | 0.0% |
| Elementary School | 54 | 43.9% |
| Middle School | 33 | 26.8% |
| High School | 30 | 24.4% |
| College / Undergraduate | 6 | 4.9% |
| Graduate / Professional | 0 | 0.0% |
| Total | 123 | 100.0% |
School Enrollment by Age by Funding Source in Denmark
Out of a total of 123 students who are enrolled in schools in Denmark, 22 (17.9%) attend a private institution, while the remaining 101 (82.1%) are enrolled in public schools. The age group of 5 to 9 year old has the highest likelihood of being enrolled in private schools, with 22 (45.8% in the age bracket) enrolled. Conversely, the age group of 10 to 14 year olds has the lowest likelihood of being enrolled in a private school, with 44 (100.0% in the age bracket) attending a public institution.
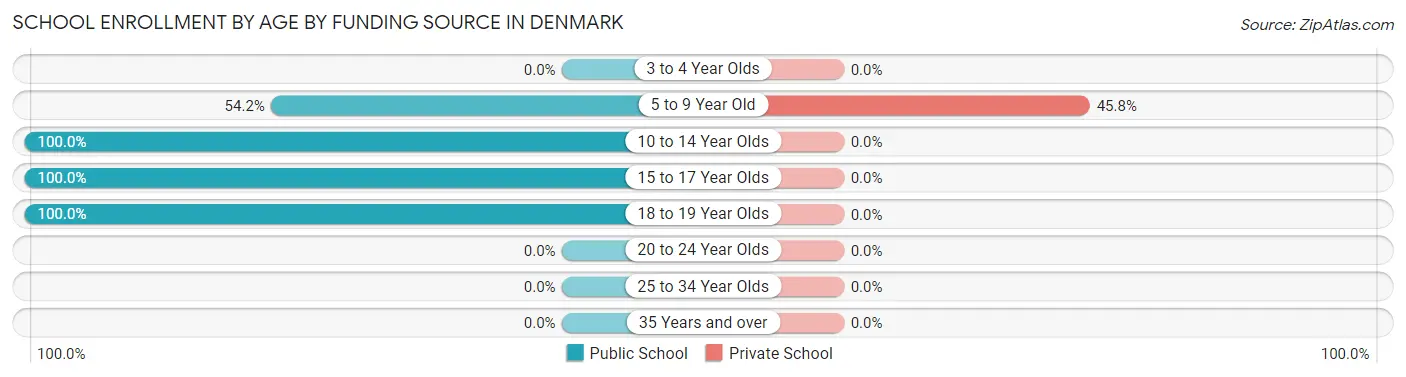
| Age Bracket | Public School | Private School |
| 3 to 4 Year Olds | 0 (0.0%) | 0 (0.0%) |
| 5 to 9 Year Old | 26 (54.2%) | 22 (45.8%) |
| 10 to 14 Year Olds | 44 (100.0%) | 0 (0.0%) |
| 15 to 17 Year Olds | 25 (100.0%) | 0 (0.0%) |
| 18 to 19 Year Olds | 6 (100.0%) | 0 (0.0%) |
| 20 to 24 Year Olds | 0 (0.0%) | 0 (0.0%) |
| 25 to 34 Year Olds | 0 (0.0%) | 0 (0.0%) |
| 35 Years and over | 0 (0.0%) | 0 (0.0%) |
| Total | 101 (82.1%) | 22 (17.9%) |
Educational Attainment by Field of Study in Denmark
Education (114 | 60.3%), computers & mathematics (23 | 12.2%), science & technology (23 | 12.2%), business (12 | 6.4%), and psychology (6 | 3.2%) are the most common fields of study among 189 individuals in Denmark who have obtained a bachelor's degree or higher.
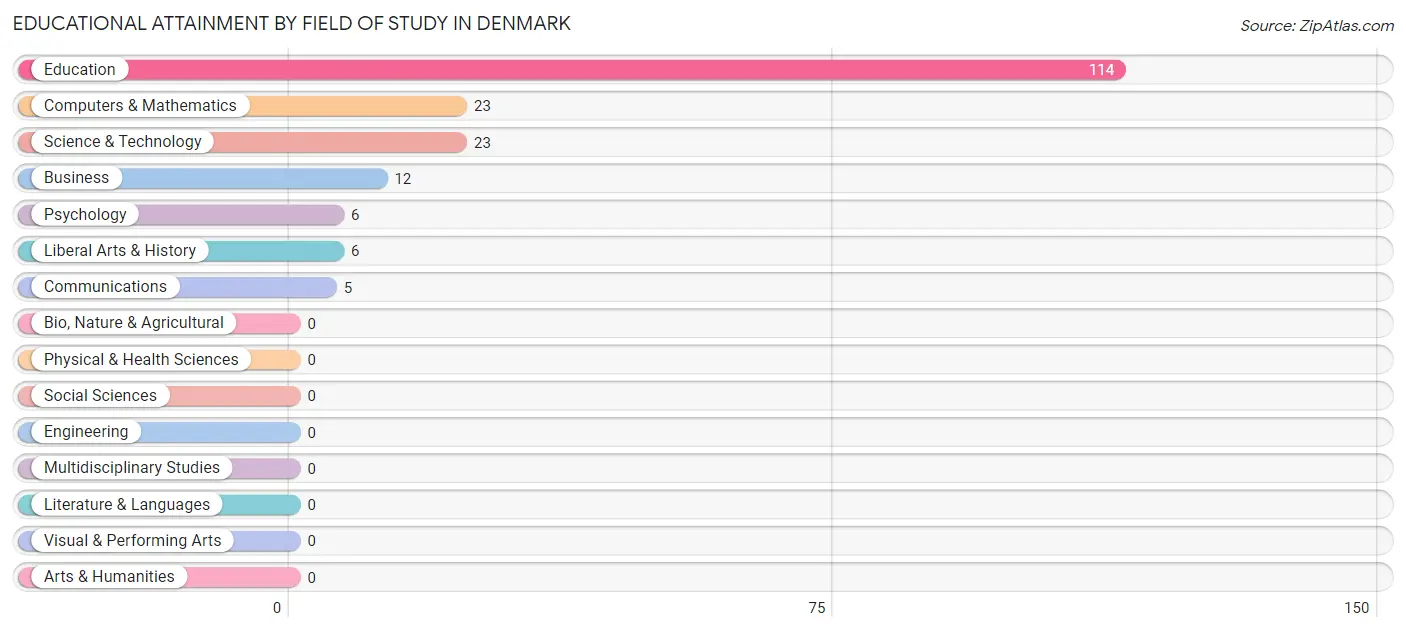
| Field of Study | # Graduates | % Graduates |
| Computers & Mathematics | 23 | 12.2% |
| Bio, Nature & Agricultural | 0 | 0.0% |
| Physical & Health Sciences | 0 | 0.0% |
| Psychology | 6 | 3.2% |
| Social Sciences | 0 | 0.0% |
| Engineering | 0 | 0.0% |
| Multidisciplinary Studies | 0 | 0.0% |
| Science & Technology | 23 | 12.2% |
| Business | 12 | 6.4% |
| Education | 114 | 60.3% |
| Literature & Languages | 0 | 0.0% |
| Liberal Arts & History | 6 | 3.2% |
| Visual & Performing Arts | 0 | 0.0% |
| Communications | 5 | 2.6% |
| Arts & Humanities | 0 | 0.0% |
| Total | 189 | 100.0% |
Transportation & Commute in Denmark
Vehicle Availability by Sex in Denmark
The most prevalent vehicle ownership categories in Denmark are males with 4 vehicles (34, accounting for 33.0%) and females with 4 vehicles (129, making up 14.7%).
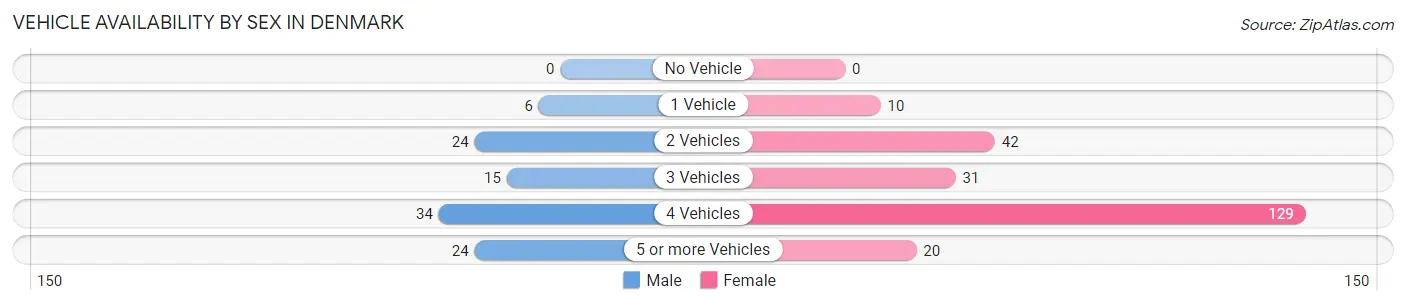
| Vehicles Available | Male | Female |
| No Vehicle | 0 (0.0%) | 0 (0.0%) |
| 1 Vehicle | 6 (5.8%) | 10 (4.3%) |
| 2 Vehicles | 24 (23.3%) | 42 (18.1%) |
| 3 Vehicles | 15 (14.6%) | 31 (13.4%) |
| 4 Vehicles | 34 (33.0%) | 129 (55.6%) |
| 5 or more Vehicles | 24 (23.3%) | 20 (8.6%) |
| Total | 103 (100.0%) | 232 (100.0%) |
Commute Time in Denmark
The most frequently occuring commute durations in Denmark are 15 to 19 minutes (119 commuters, 35.5%), 20 to 24 minutes (91 commuters, 27.2%), and 25 to 29 minutes (34 commuters, 10.2%).
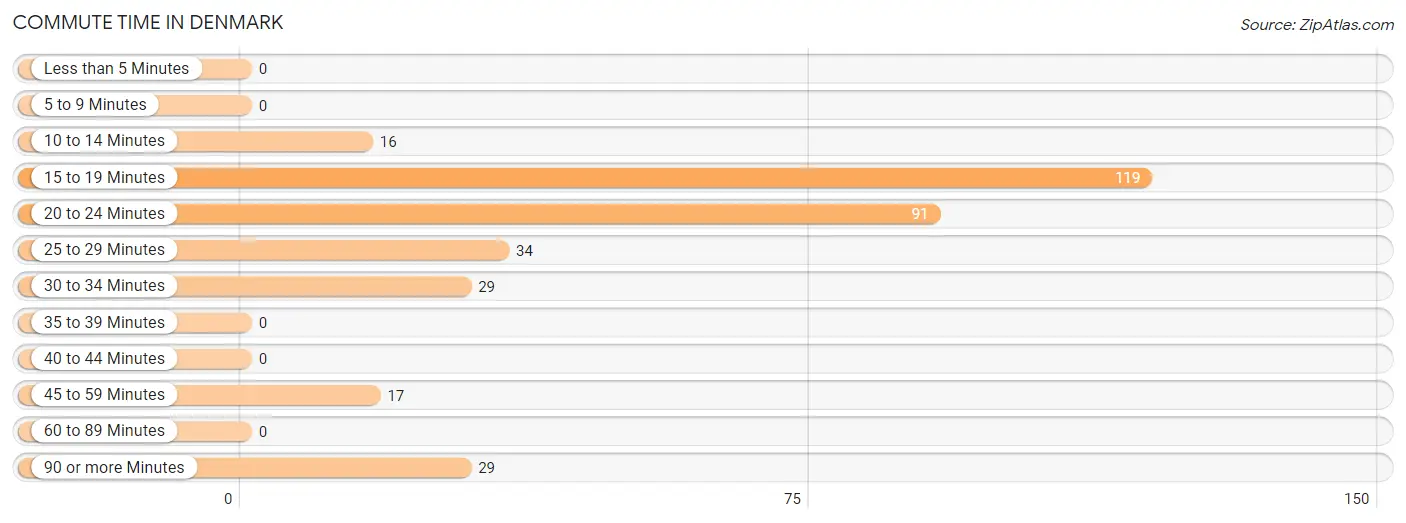
| Commute Time | # Commuters | % Commuters |
| Less than 5 Minutes | 0 | 0.0% |
| 5 to 9 Minutes | 0 | 0.0% |
| 10 to 14 Minutes | 16 | 4.8% |
| 15 to 19 Minutes | 119 | 35.5% |
| 20 to 24 Minutes | 91 | 27.2% |
| 25 to 29 Minutes | 34 | 10.2% |
| 30 to 34 Minutes | 29 | 8.7% |
| 35 to 39 Minutes | 0 | 0.0% |
| 40 to 44 Minutes | 0 | 0.0% |
| 45 to 59 Minutes | 17 | 5.1% |
| 60 to 89 Minutes | 0 | 0.0% |
| 90 or more Minutes | 29 | 8.7% |
Commute Time by Sex in Denmark
The most common commute times in Denmark are 20 to 24 minutes (56 commuters, 54.4%) for males and 15 to 19 minutes (119 commuters, 51.3%) for females.
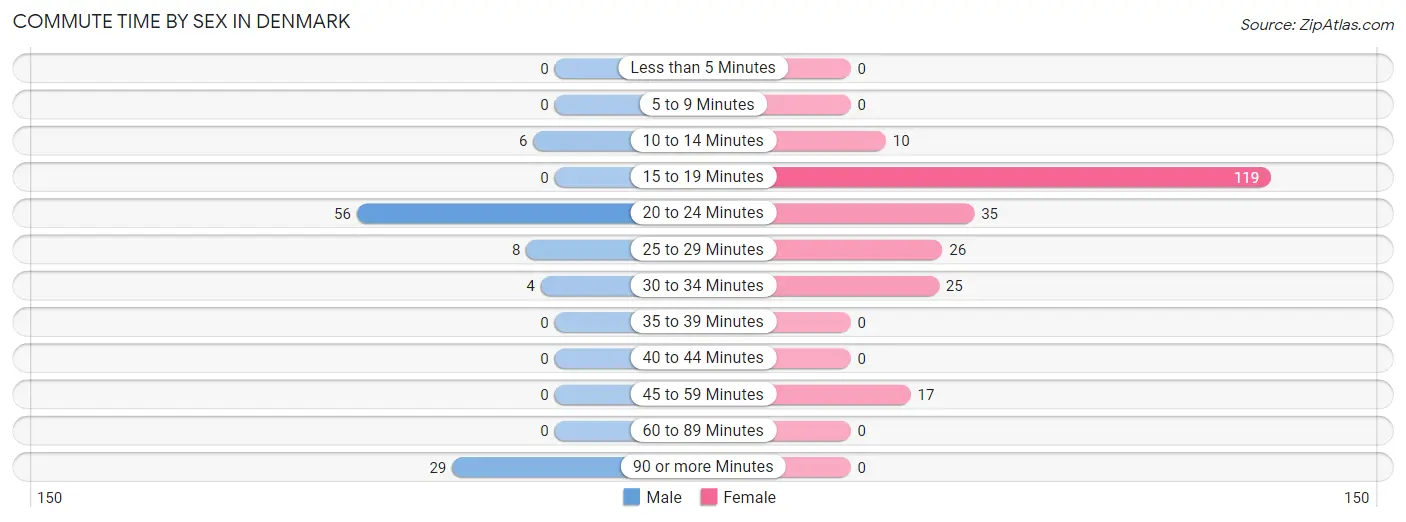
| Commute Time | Male | Female |
| Less than 5 Minutes | 0 (0.0%) | 0 (0.0%) |
| 5 to 9 Minutes | 0 (0.0%) | 0 (0.0%) |
| 10 to 14 Minutes | 6 (5.8%) | 10 (4.3%) |
| 15 to 19 Minutes | 0 (0.0%) | 119 (51.3%) |
| 20 to 24 Minutes | 56 (54.4%) | 35 (15.1%) |
| 25 to 29 Minutes | 8 (7.8%) | 26 (11.2%) |
| 30 to 34 Minutes | 4 (3.9%) | 25 (10.8%) |
| 35 to 39 Minutes | 0 (0.0%) | 0 (0.0%) |
| 40 to 44 Minutes | 0 (0.0%) | 0 (0.0%) |
| 45 to 59 Minutes | 0 (0.0%) | 17 (7.3%) |
| 60 to 89 Minutes | 0 (0.0%) | 0 (0.0%) |
| 90 or more Minutes | 29 (28.2%) | 0 (0.0%) |
Time of Departure to Work by Sex in Denmark
The most frequent times of departure to work in Denmark are 6:00 AM to 6:29 AM (45, 43.7%) for males and 7:00 AM to 7:29 AM (111, 47.8%) for females.
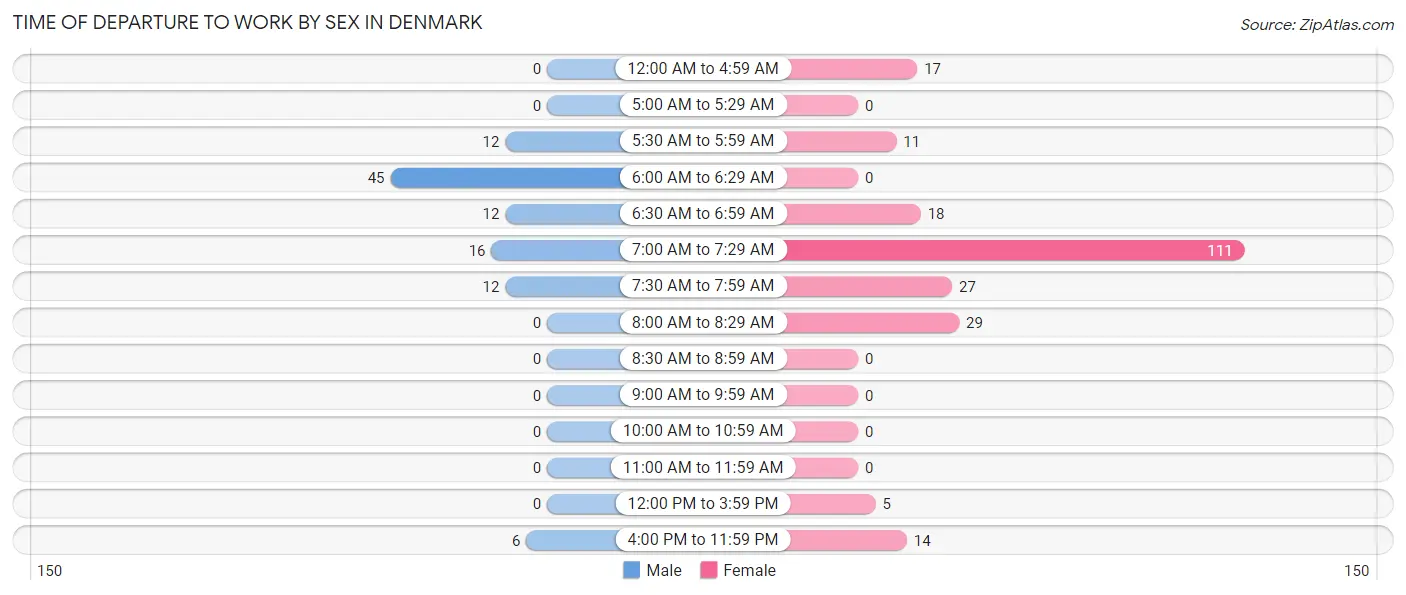
| Time of Departure | Male | Female |
| 12:00 AM to 4:59 AM | 0 (0.0%) | 17 (7.3%) |
| 5:00 AM to 5:29 AM | 0 (0.0%) | 0 (0.0%) |
| 5:30 AM to 5:59 AM | 12 (11.7%) | 11 (4.7%) |
| 6:00 AM to 6:29 AM | 45 (43.7%) | 0 (0.0%) |
| 6:30 AM to 6:59 AM | 12 (11.7%) | 18 (7.8%) |
| 7:00 AM to 7:29 AM | 16 (15.5%) | 111 (47.8%) |
| 7:30 AM to 7:59 AM | 12 (11.7%) | 27 (11.6%) |
| 8:00 AM to 8:29 AM | 0 (0.0%) | 29 (12.5%) |
| 8:30 AM to 8:59 AM | 0 (0.0%) | 0 (0.0%) |
| 9:00 AM to 9:59 AM | 0 (0.0%) | 0 (0.0%) |
| 10:00 AM to 10:59 AM | 0 (0.0%) | 0 (0.0%) |
| 11:00 AM to 11:59 AM | 0 (0.0%) | 0 (0.0%) |
| 12:00 PM to 3:59 PM | 0 (0.0%) | 5 (2.2%) |
| 4:00 PM to 11:59 PM | 6 (5.8%) | 14 (6.0%) |
| Total | 103 (100.0%) | 232 (100.0%) |
Housing Occupancy in Denmark
Occupancy by Ownership in Denmark
Of the total 286 dwellings in Denmark, owner-occupied units account for 244 (85.3%), while renter-occupied units make up 42 (14.7%).
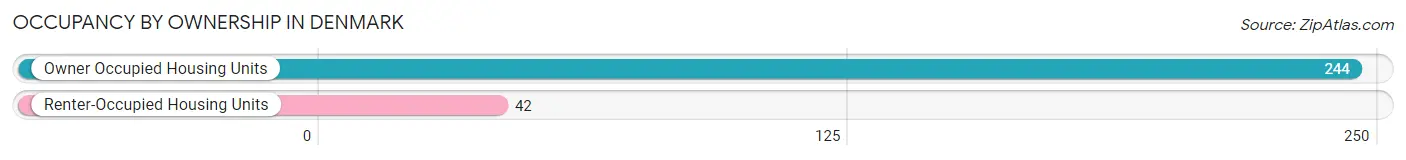
| Occupancy | # Housing Units | % Housing Units |
| Owner Occupied Housing Units | 244 | 85.3% |
| Renter-Occupied Housing Units | 42 | 14.7% |
| Total Occupied Housing Units | 286 | 100.0% |
Occupancy by Household Size in Denmark
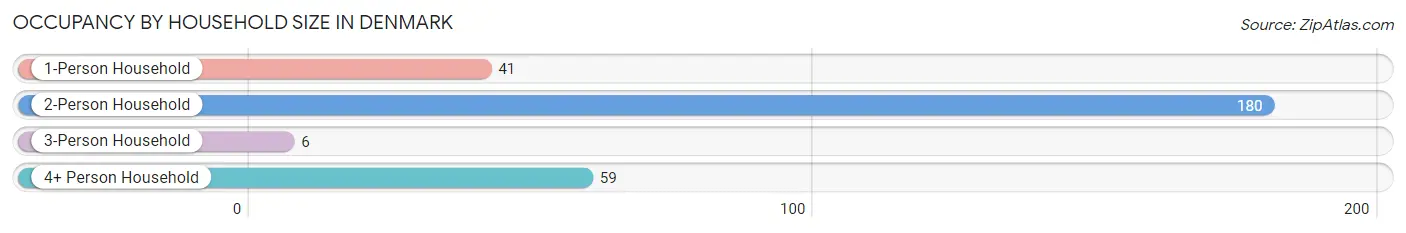
| Household Size | # Housing Units | % Housing Units |
| 1-Person Household | 41 | 14.3% |
| 2-Person Household | 180 | 62.9% |
| 3-Person Household | 6 | 2.1% |
| 4+ Person Household | 59 | 20.6% |
| Total Housing Units | 286 | 100.0% |
Occupancy by Ownership by Household Size in Denmark
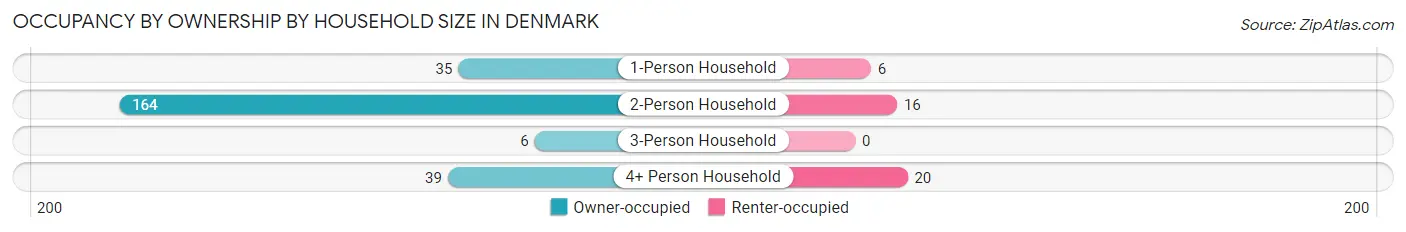
| Household Size | Owner-occupied | Renter-occupied |
| 1-Person Household | 35 (85.4%) | 6 (14.6%) |
| 2-Person Household | 164 (91.1%) | 16 (8.9%) |
| 3-Person Household | 6 (100.0%) | 0 (0.0%) |
| 4+ Person Household | 39 (66.1%) | 20 (33.9%) |
| Total Housing Units | 244 (85.3%) | 42 (14.7%) |
Occupancy by Educational Attainment in Denmark
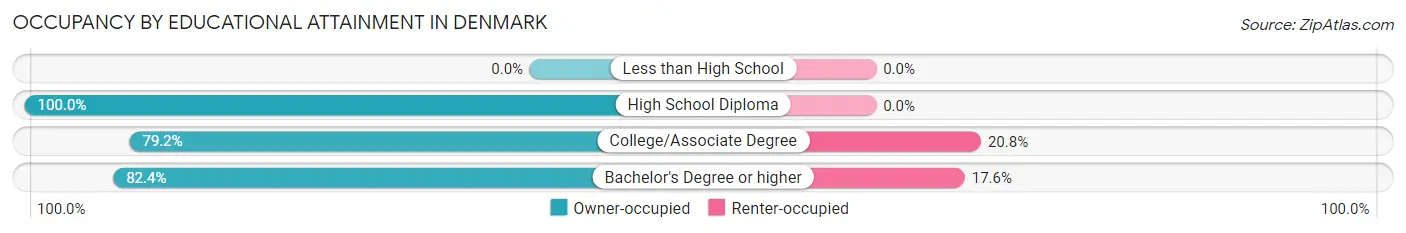
| Household Size | Owner-occupied | Renter-occupied |
| Less than High School | 0 (0.0%) | 0 (0.0%) |
| High School Diploma | 61 (100.0%) | 0 (0.0%) |
| College/Associate Degree | 61 (79.2%) | 16 (20.8%) |
| Bachelor's Degree or higher | 122 (82.4%) | 26 (17.6%) |
Occupancy by Age of Householder in Denmark
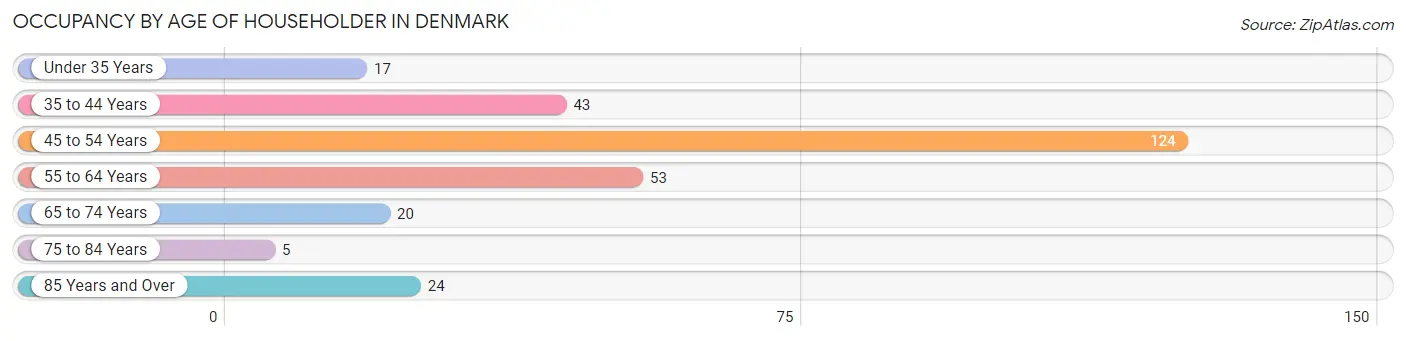
| Age Bracket | # Households | % Households |
| Under 35 Years | 17 | 5.9% |
| 35 to 44 Years | 43 | 15.0% |
| 45 to 54 Years | 124 | 43.4% |
| 55 to 64 Years | 53 | 18.5% |
| 65 to 74 Years | 20 | 7.0% |
| 75 to 84 Years | 5 | 1.8% |
| 85 Years and Over | 24 | 8.4% |
| Total | 286 | 100.0% |
Housing Finances in Denmark
Median Income by Occupancy in Denmark
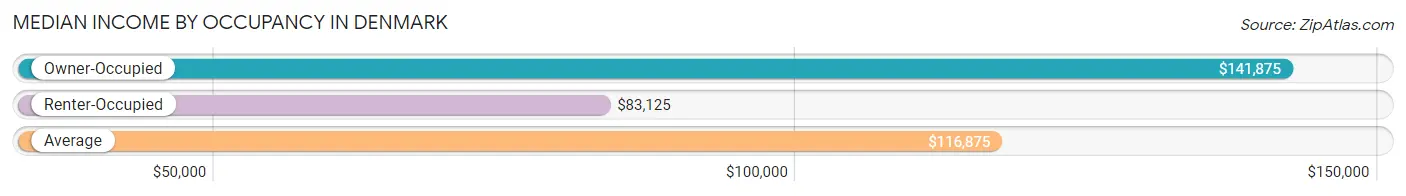
| Occupancy Type | # Households | Median Income |
| Owner-Occupied | 244 (85.3%) | $141,875 |
| Renter-Occupied | 42 (14.7%) | $83,125 |
| Average | 286 (100.0%) | $116,875 |
Occupancy by Householder Income Bracket in Denmark
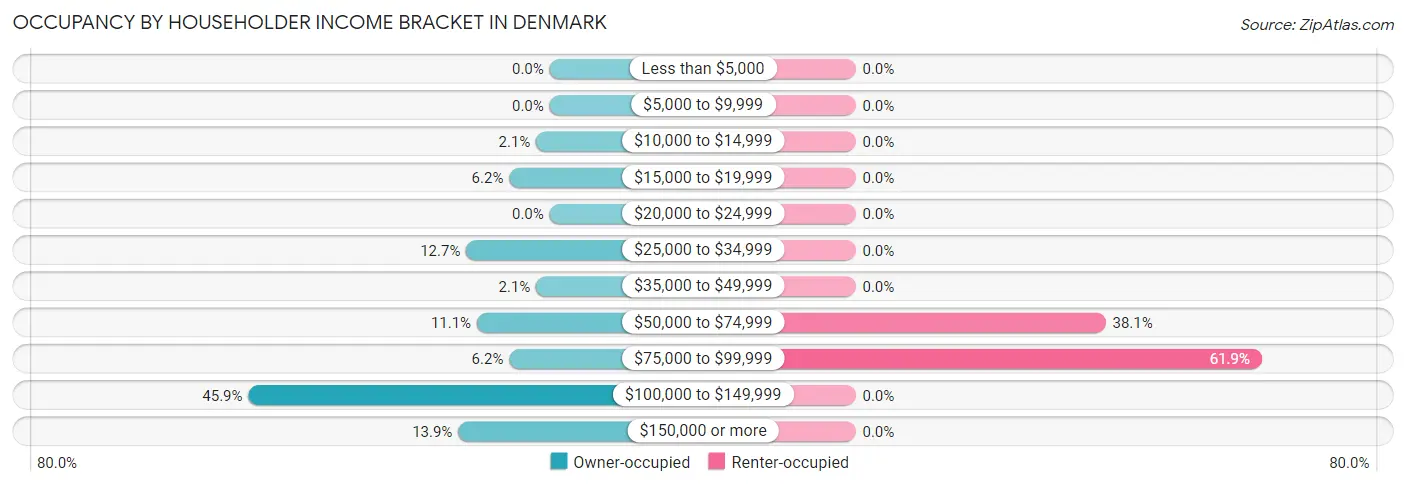
| Income Bracket | Owner-occupied | Renter-occupied |
| Less than $5,000 | 0 (0.0%) | 0 (0.0%) |
| $5,000 to $9,999 | 0 (0.0%) | 0 (0.0%) |
| $10,000 to $14,999 | 5 (2.1%) | 0 (0.0%) |
| $15,000 to $19,999 | 15 (6.1%) | 0 (0.0%) |
| $20,000 to $24,999 | 0 (0.0%) | 0 (0.0%) |
| $25,000 to $34,999 | 31 (12.7%) | 0 (0.0%) |
| $35,000 to $49,999 | 5 (2.1%) | 0 (0.0%) |
| $50,000 to $74,999 | 27 (11.1%) | 16 (38.1%) |
| $75,000 to $99,999 | 15 (6.1%) | 26 (61.9%) |
| $100,000 to $149,999 | 112 (45.9%) | 0 (0.0%) |
| $150,000 or more | 34 (13.9%) | 0 (0.0%) |
| Total | 244 (100.0%) | 42 (100.0%) |
Monthly Housing Cost Tiers in Denmark
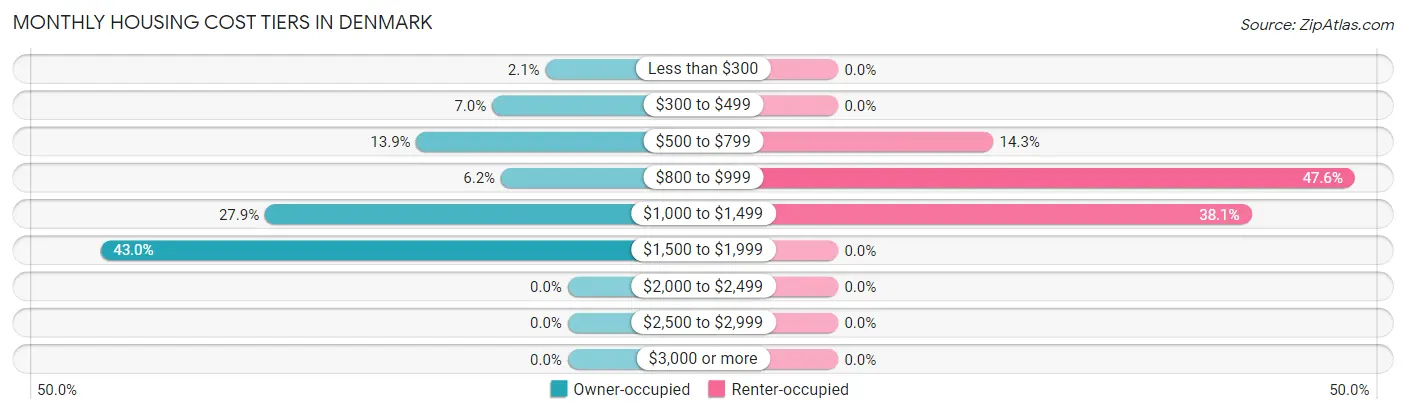
| Monthly Cost | Owner-occupied | Renter-occupied |
| Less than $300 | 5 (2.1%) | 0 (0.0%) |
| $300 to $499 | 17 (7.0%) | 0 (0.0%) |
| $500 to $799 | 34 (13.9%) | 6 (14.3%) |
| $800 to $999 | 15 (6.1%) | 20 (47.6%) |
| $1,000 to $1,499 | 68 (27.9%) | 16 (38.1%) |
| $1,500 to $1,999 | 105 (43.0%) | 0 (0.0%) |
| $2,000 to $2,499 | 0 (0.0%) | 0 (0.0%) |
| $2,500 to $2,999 | 0 (0.0%) | 0 (0.0%) |
| $3,000 or more | 0 (0.0%) | 0 (0.0%) |
| Total | 244 (100.0%) | 42 (100.0%) |
Physical Housing Characteristics in Denmark
Housing Structures in Denmark
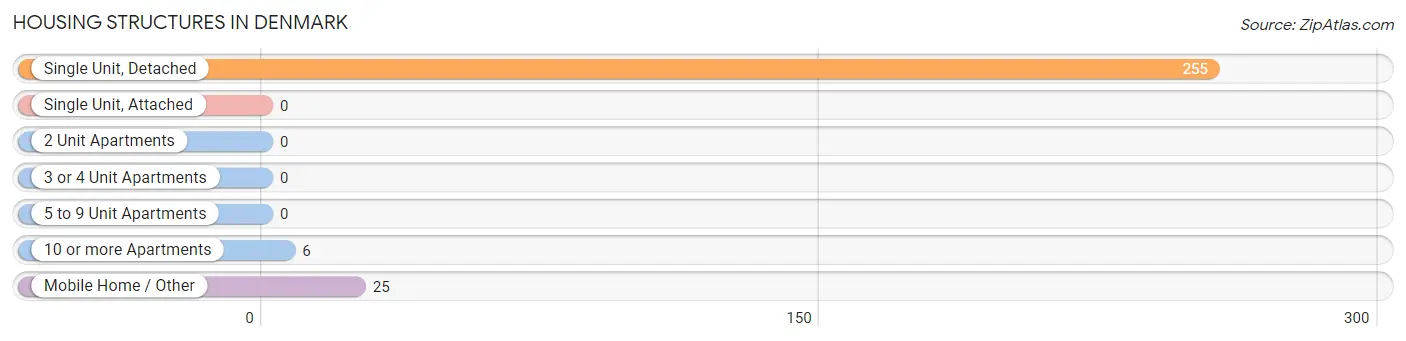
| Structure Type | # Housing Units | % Housing Units |
| Single Unit, Detached | 255 | 89.2% |
| Single Unit, Attached | 0 | 0.0% |
| 2 Unit Apartments | 0 | 0.0% |
| 3 or 4 Unit Apartments | 0 | 0.0% |
| 5 to 9 Unit Apartments | 0 | 0.0% |
| 10 or more Apartments | 6 | 2.1% |
| Mobile Home / Other | 25 | 8.7% |
| Total | 286 | 100.0% |
Housing Structures by Occupancy in Denmark
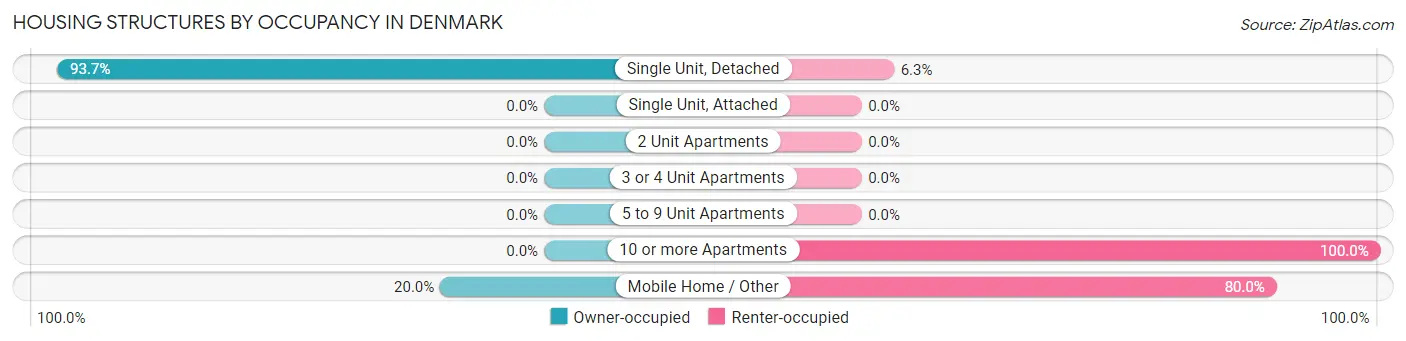
| Structure Type | Owner-occupied | Renter-occupied |
| Single Unit, Detached | 239 (93.7%) | 16 (6.3%) |
| Single Unit, Attached | 0 (0.0%) | 0 (0.0%) |
| 2 Unit Apartments | 0 (0.0%) | 0 (0.0%) |
| 3 or 4 Unit Apartments | 0 (0.0%) | 0 (0.0%) |
| 5 to 9 Unit Apartments | 0 (0.0%) | 0 (0.0%) |
| 10 or more Apartments | 0 (0.0%) | 6 (100.0%) |
| Mobile Home / Other | 5 (20.0%) | 20 (80.0%) |
| Total | 244 (85.3%) | 42 (14.7%) |
Housing Structures by Number of Rooms in Denmark
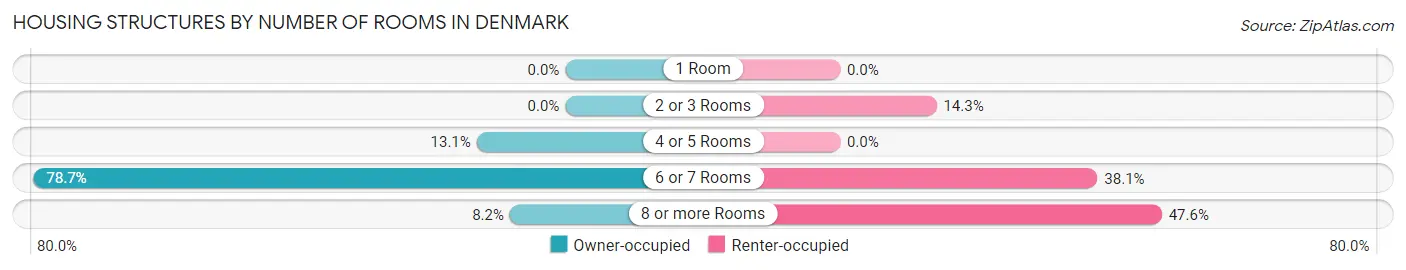
| Number of Rooms | Owner-occupied | Renter-occupied |
| 1 Room | 0 (0.0%) | 0 (0.0%) |
| 2 or 3 Rooms | 0 (0.0%) | 6 (14.3%) |
| 4 or 5 Rooms | 32 (13.1%) | 0 (0.0%) |
| 6 or 7 Rooms | 192 (78.7%) | 16 (38.1%) |
| 8 or more Rooms | 20 (8.2%) | 20 (47.6%) |
| Total | 244 (100.0%) | 42 (100.0%) |
Housing Structure by Heating Type in Denmark
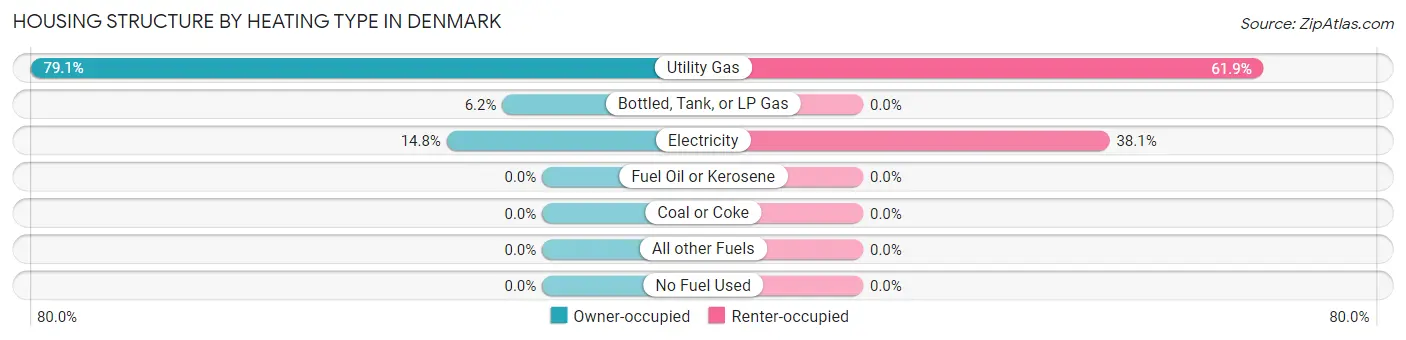
| Heating Type | Owner-occupied | Renter-occupied |
| Utility Gas | 193 (79.1%) | 26 (61.9%) |
| Bottled, Tank, or LP Gas | 15 (6.1%) | 0 (0.0%) |
| Electricity | 36 (14.7%) | 16 (38.1%) |
| Fuel Oil or Kerosene | 0 (0.0%) | 0 (0.0%) |
| Coal or Coke | 0 (0.0%) | 0 (0.0%) |
| All other Fuels | 0 (0.0%) | 0 (0.0%) |
| No Fuel Used | 0 (0.0%) | 0 (0.0%) |
| Total | 244 (100.0%) | 42 (100.0%) |
Household Vehicle Usage in Denmark
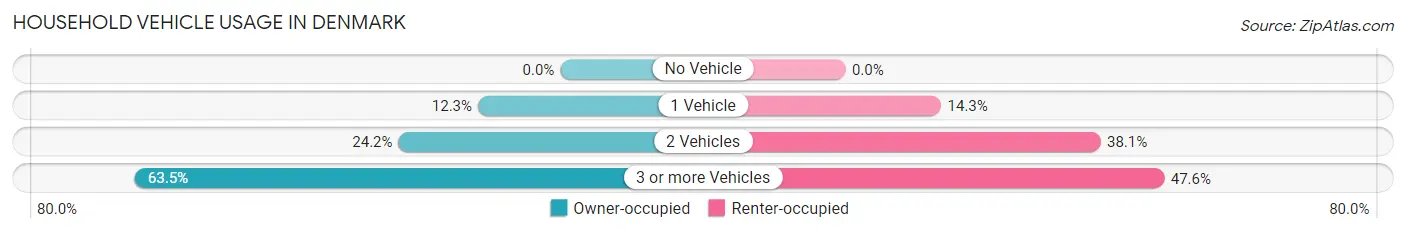
| Vehicles per Household | Owner-occupied | Renter-occupied |
| No Vehicle | 0 (0.0%) | 0 (0.0%) |
| 1 Vehicle | 30 (12.3%) | 6 (14.3%) |
| 2 Vehicles | 59 (24.2%) | 16 (38.1%) |
| 3 or more Vehicles | 155 (63.5%) | 20 (47.6%) |
| Total | 244 (100.0%) | 42 (100.0%) |
Real Estate & Mortgages in Denmark
Real Estate and Mortgage Overview in Denmark
| Characteristic | Without Mortgage | With Mortgage |
| Housing Units | 58 | 186 |
| Median Property Value | $129,200 | $198,900 |
| Median Household Income | - | - |
| Monthly Housing Costs | $547 | $0 |
| Real Estate Taxes | $1,273 | $0 |
Property Value by Mortgage Status in Denmark
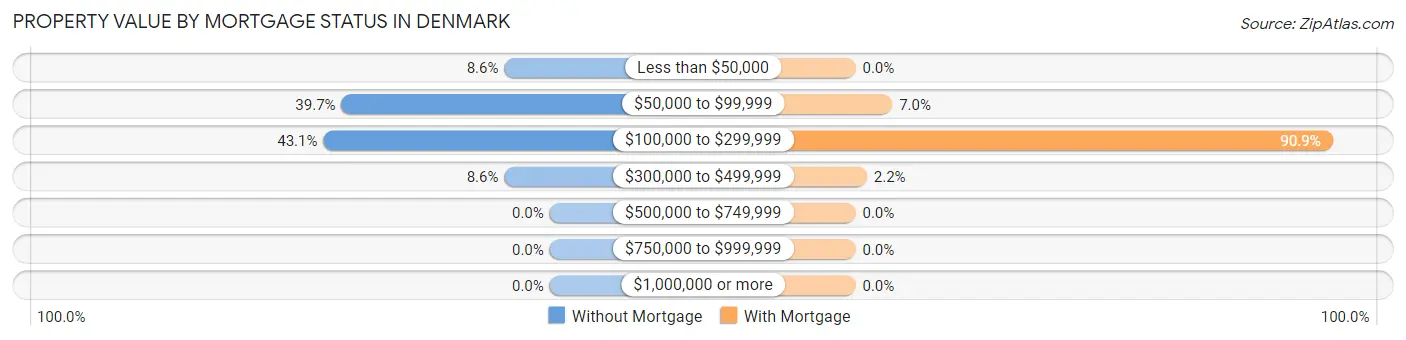
| Property Value | Without Mortgage | With Mortgage |
| Less than $50,000 | 5 (8.6%) | 0 (0.0%) |
| $50,000 to $99,999 | 23 (39.7%) | 13 (7.0%) |
| $100,000 to $299,999 | 25 (43.1%) | 169 (90.9%) |
| $300,000 to $499,999 | 5 (8.6%) | 4 (2.1%) |
| $500,000 to $749,999 | 0 (0.0%) | 0 (0.0%) |
| $750,000 to $999,999 | 0 (0.0%) | 0 (0.0%) |
| $1,000,000 or more | 0 (0.0%) | 0 (0.0%) |
| Total | 58 (100.0%) | 186 (100.0%) |
Household Income by Mortgage Status in Denmark
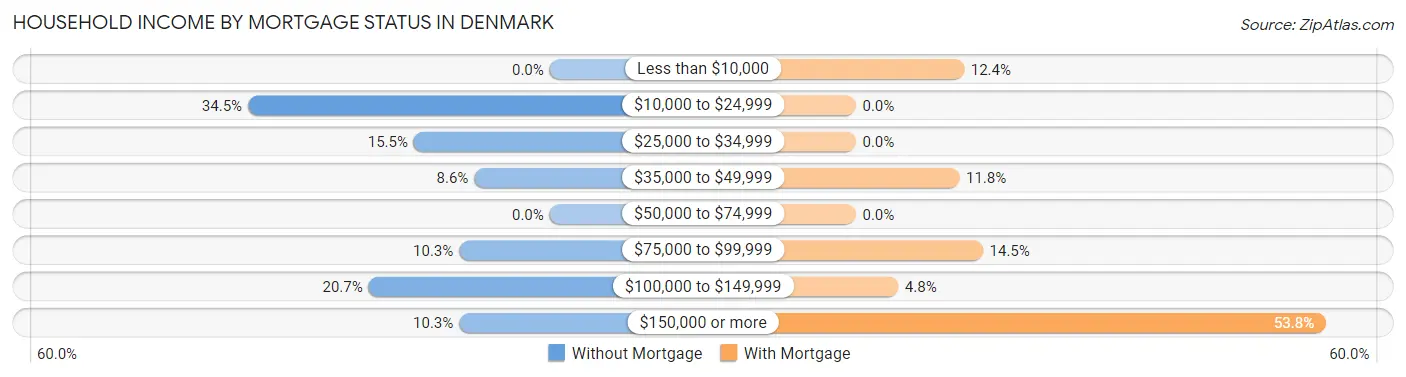
| Household Income | Without Mortgage | With Mortgage |
| Less than $10,000 | 0 (0.0%) | 23 (12.4%) |
| $10,000 to $24,999 | 20 (34.5%) | 0 (0.0%) |
| $25,000 to $34,999 | 9 (15.5%) | 0 (0.0%) |
| $35,000 to $49,999 | 5 (8.6%) | 22 (11.8%) |
| $50,000 to $74,999 | 0 (0.0%) | 0 (0.0%) |
| $75,000 to $99,999 | 6 (10.3%) | 27 (14.5%) |
| $100,000 to $149,999 | 12 (20.7%) | 9 (4.8%) |
| $150,000 or more | 6 (10.3%) | 100 (53.8%) |
| Total | 58 (100.0%) | 186 (100.0%) |
Property Value to Household Income Ratio in Denmark
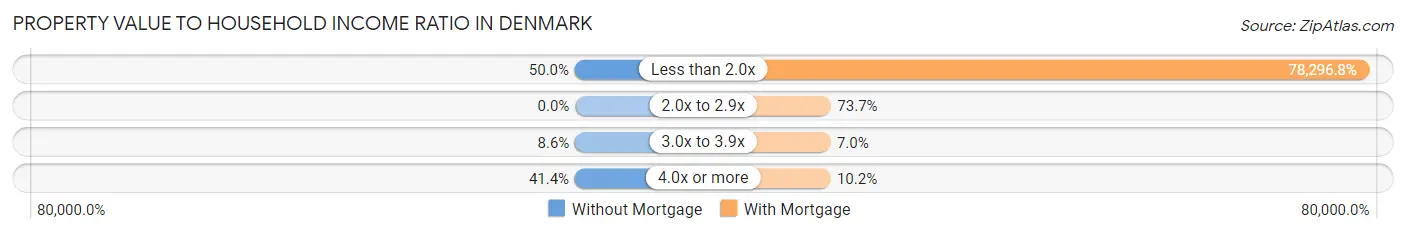
| Value-to-Income Ratio | Without Mortgage | With Mortgage |
| Less than 2.0x | 29 (50.0%) | 145,632 (78,296.8%) |
| 2.0x to 2.9x | 0 (0.0%) | 137 (73.7%) |
| 3.0x to 3.9x | 5 (8.6%) | 13 (7.0%) |
| 4.0x or more | 24 (41.4%) | 19 (10.2%) |
| Total | 58 (100.0%) | 186 (100.0%) |
Real Estate Taxes by Mortgage Status in Denmark
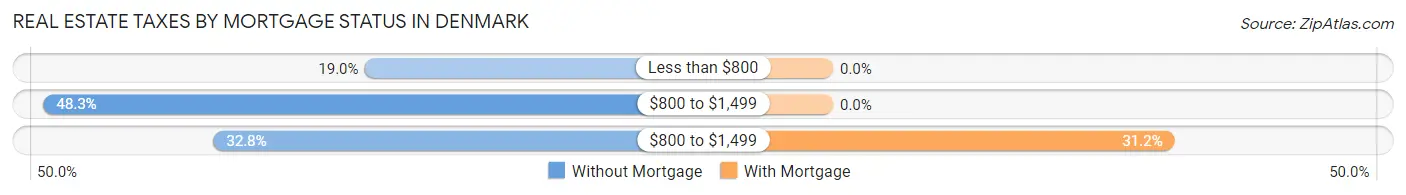
| Property Taxes | Without Mortgage | With Mortgage |
| Less than $800 | 11 (19.0%) | 0 (0.0%) |
| $800 to $1,499 | 28 (48.3%) | 0 (0.0%) |
| $800 to $1,499 | 19 (32.8%) | 58 (31.2%) |
| Total | 58 (100.0%) | 186 (100.0%) |
Health & Disability in Denmark
Health Insurance Coverage by Age in Denmark
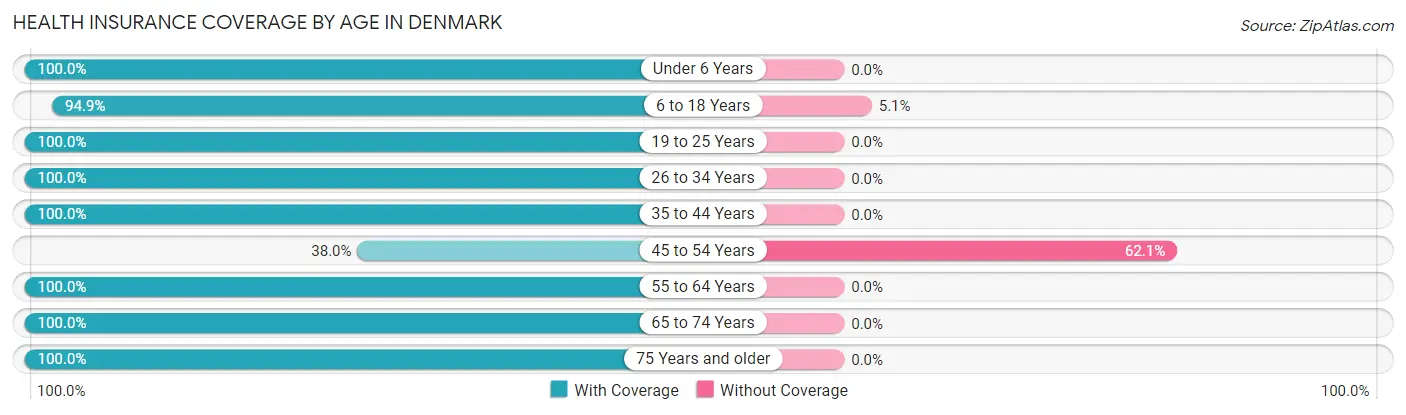
| Age Bracket | With Coverage | Without Coverage |
| Under 6 Years | 31 (100.0%) | 0 (0.0%) |
| 6 to 18 Years | 111 (94.9%) | 6 (5.1%) |
| 19 to 25 Years | 11 (100.0%) | 0 (0.0%) |
| 26 to 34 Years | 33 (100.0%) | 0 (0.0%) |
| 35 to 44 Years | 94 (100.0%) | 0 (0.0%) |
| 45 to 54 Years | 63 (38.0%) | 103 (62.1%) |
| 55 to 64 Years | 67 (100.0%) | 0 (0.0%) |
| 65 to 74 Years | 61 (100.0%) | 0 (0.0%) |
| 75 Years and older | 68 (100.0%) | 0 (0.0%) |
| Total | 539 (83.2%) | 109 (16.8%) |
Health Insurance Coverage by Citizenship Status in Denmark
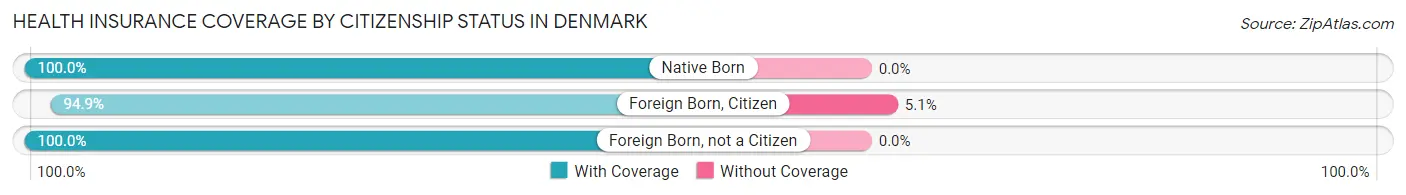
| Citizenship Status | With Coverage | Without Coverage |
| Native Born | 31 (100.0%) | 0 (0.0%) |
| Foreign Born, Citizen | 111 (94.9%) | 6 (5.1%) |
| Foreign Born, not a Citizen | 11 (100.0%) | 0 (0.0%) |
Health Insurance Coverage by Household Income in Denmark
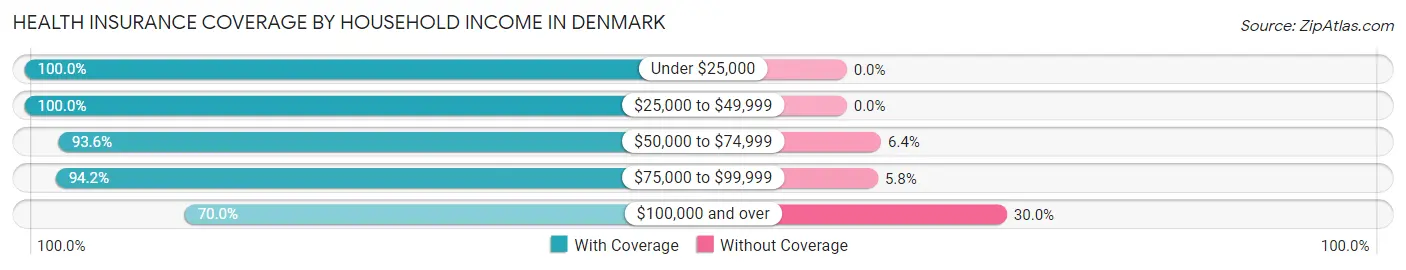
| Household Income | With Coverage | Without Coverage |
| Under $25,000 | 20 (100.0%) | 0 (0.0%) |
| $25,000 to $49,999 | 55 (100.0%) | 0 (0.0%) |
| $50,000 to $74,999 | 102 (93.6%) | 7 (6.4%) |
| $75,000 to $99,999 | 145 (94.2%) | 9 (5.8%) |
| $100,000 and over | 217 (70.0%) | 93 (30.0%) |
Public vs Private Health Insurance Coverage by Age in Denmark
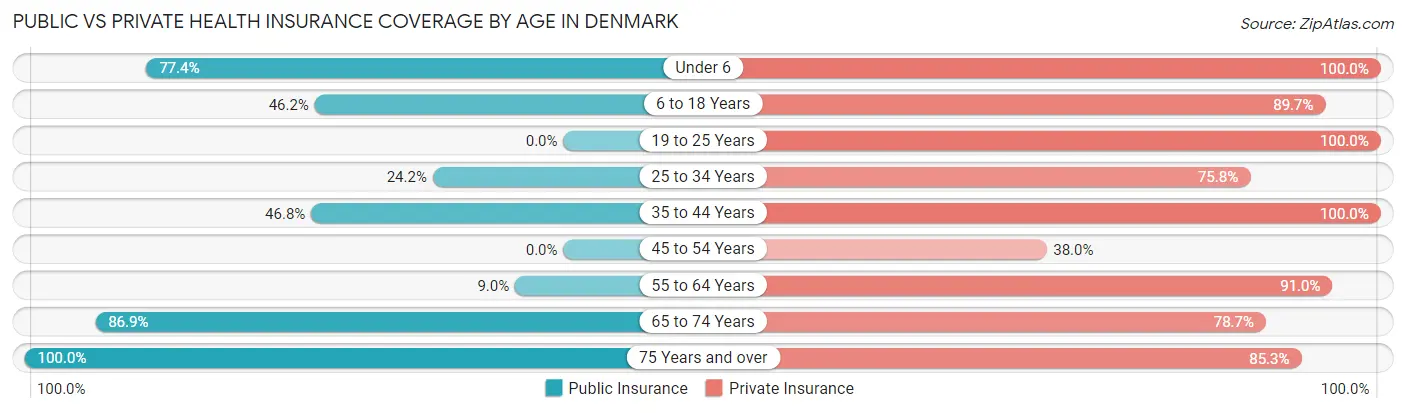
| Age Bracket | Public Insurance | Private Insurance |
| Under 6 | 24 (77.4%) | 31 (100.0%) |
| 6 to 18 Years | 54 (46.2%) | 105 (89.7%) |
| 19 to 25 Years | 0 (0.0%) | 11 (100.0%) |
| 25 to 34 Years | 8 (24.2%) | 25 (75.8%) |
| 35 to 44 Years | 44 (46.8%) | 94 (100.0%) |
| 45 to 54 Years | 0 (0.0%) | 63 (38.0%) |
| 55 to 64 Years | 6 (9.0%) | 61 (91.0%) |
| 65 to 74 Years | 53 (86.9%) | 48 (78.7%) |
| 75 Years and over | 68 (100.0%) | 58 (85.3%) |
| Total | 257 (39.7%) | 496 (76.5%) |
Disability Status by Sex by Age in Denmark
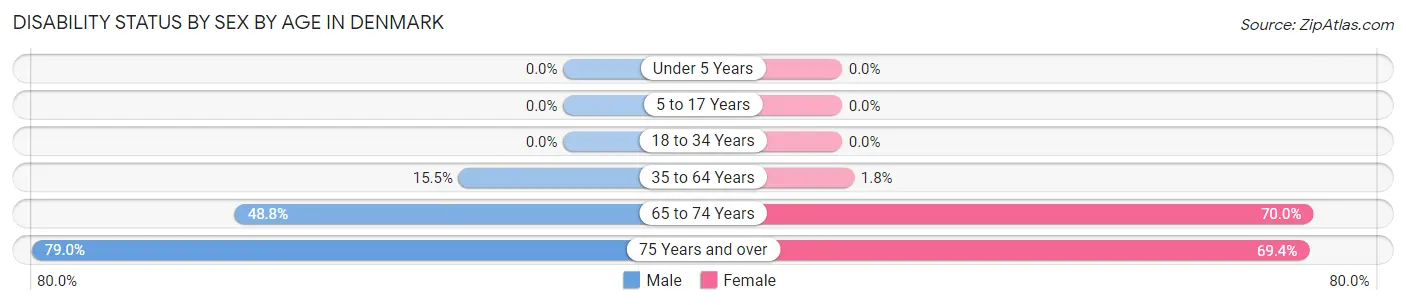
| Age Bracket | Male | Female |
| Under 5 Years | 0 (0.0%) | 0 (0.0%) |
| 5 to 17 Years | 0 (0.0%) | 0 (0.0%) |
| 18 to 34 Years | 0 (0.0%) | 0 (0.0%) |
| 35 to 64 Years | 16 (15.5%) | 4 (1.8%) |
| 65 to 74 Years | 20 (48.8%) | 14 (70.0%) |
| 75 Years and over | 15 (78.9%) | 34 (69.4%) |
Disability Class by Sex by Age in Denmark
Disability Class: Hearing Difficulty
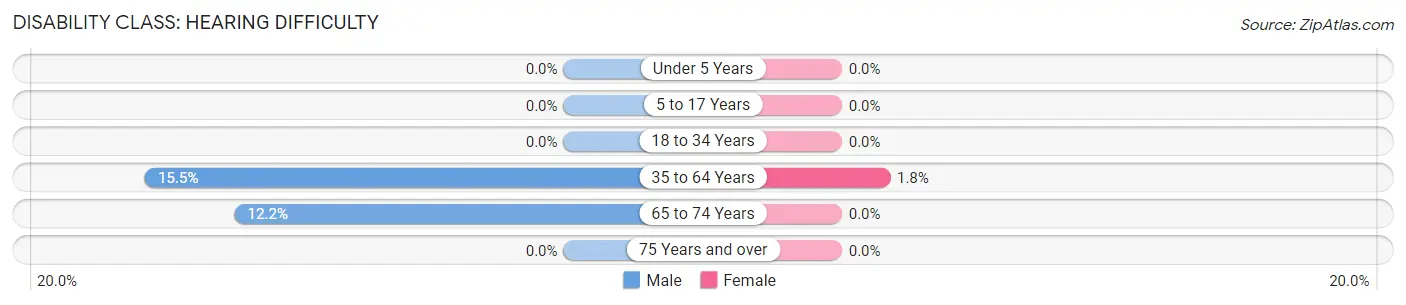
| Age Bracket | Male | Female |
| Under 5 Years | 0 (0.0%) | 0 (0.0%) |
| 5 to 17 Years | 0 (0.0%) | 0 (0.0%) |
| 18 to 34 Years | 0 (0.0%) | 0 (0.0%) |
| 35 to 64 Years | 16 (15.5%) | 4 (1.8%) |
| 65 to 74 Years | 5 (12.2%) | 0 (0.0%) |
| 75 Years and over | 0 (0.0%) | 0 (0.0%) |
Disability Class: Vision Difficulty
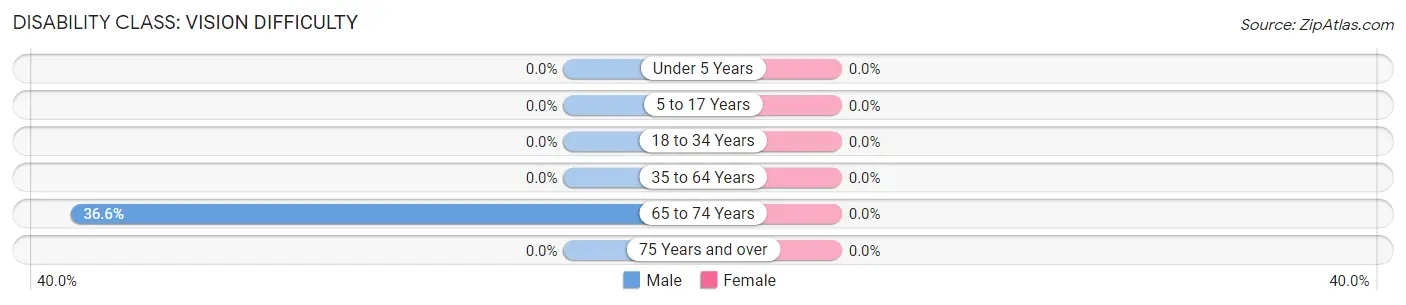
| Age Bracket | Male | Female |
| Under 5 Years | 0 (0.0%) | 0 (0.0%) |
| 5 to 17 Years | 0 (0.0%) | 0 (0.0%) |
| 18 to 34 Years | 0 (0.0%) | 0 (0.0%) |
| 35 to 64 Years | 0 (0.0%) | 0 (0.0%) |
| 65 to 74 Years | 15 (36.6%) | 0 (0.0%) |
| 75 Years and over | 0 (0.0%) | 0 (0.0%) |
Disability Class: Cognitive Difficulty
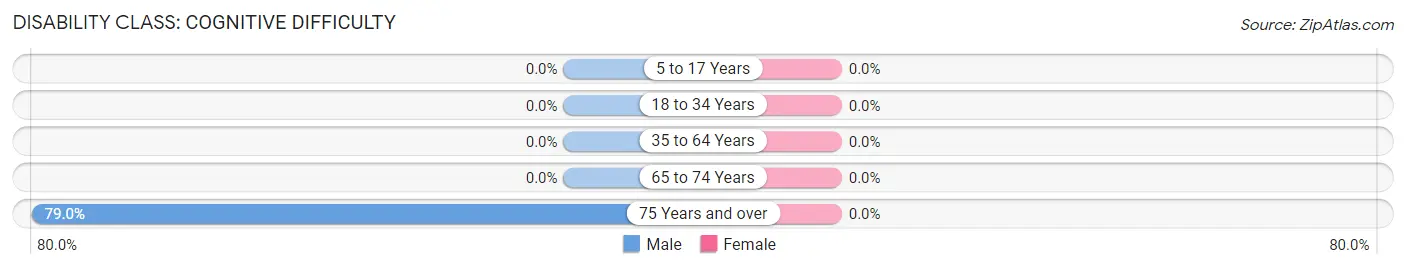
| Age Bracket | Male | Female |
| 5 to 17 Years | 0 (0.0%) | 0 (0.0%) |
| 18 to 34 Years | 0 (0.0%) | 0 (0.0%) |
| 35 to 64 Years | 0 (0.0%) | 0 (0.0%) |
| 65 to 74 Years | 0 (0.0%) | 0 (0.0%) |
| 75 Years and over | 15 (78.9%) | 0 (0.0%) |
Disability Class: Ambulatory Difficulty
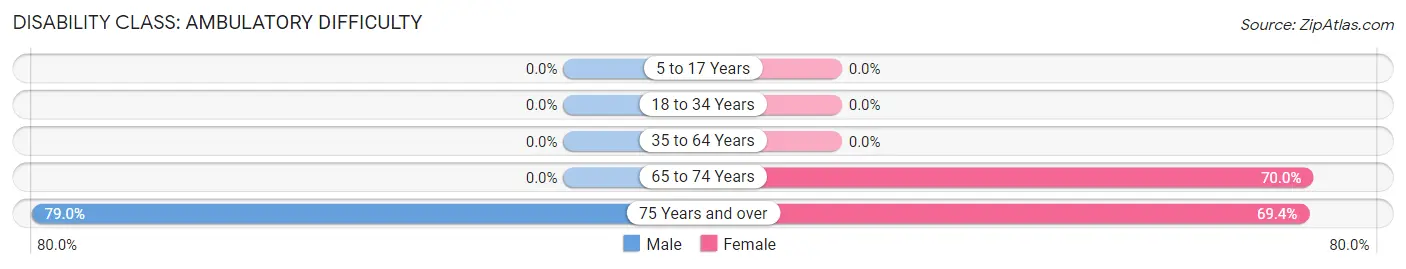
| Age Bracket | Male | Female |
| 5 to 17 Years | 0 (0.0%) | 0 (0.0%) |
| 18 to 34 Years | 0 (0.0%) | 0 (0.0%) |
| 35 to 64 Years | 0 (0.0%) | 0 (0.0%) |
| 65 to 74 Years | 0 (0.0%) | 14 (70.0%) |
| 75 Years and over | 15 (78.9%) | 34 (69.4%) |
Disability Class: Self-Care Difficulty
| Age Bracket | Male | Female |
| 5 to 17 Years | 0 (0.0%) | 0 (0.0%) |
| 18 to 34 Years | 0 (0.0%) | 0 (0.0%) |
| 35 to 64 Years | 0 (0.0%) | 0 (0.0%) |
| 65 to 74 Years | 0 (0.0%) | 0 (0.0%) |
| 75 Years and over | 0 (0.0%) | 0 (0.0%) |
Technology Access in Denmark
Computing Device Access in Denmark
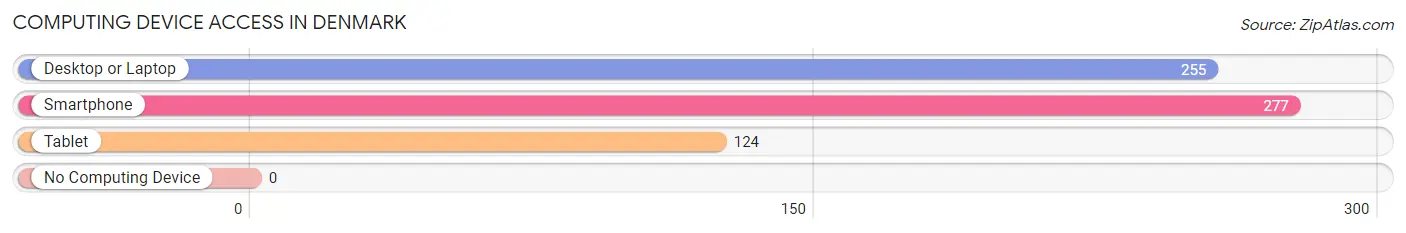
| Device Type | # Households | % Households |
| Desktop or Laptop | 255 | 89.2% |
| Smartphone | 277 | 96.9% |
| Tablet | 124 | 43.4% |
| No Computing Device | 0 | 0.0% |
| Total | 286 | 100.0% |
Internet Access in Denmark
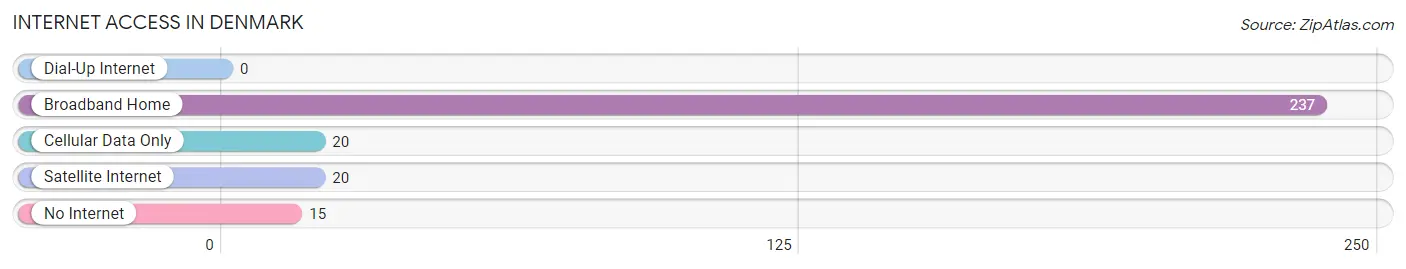
| Internet Type | # Households | % Households |
| Dial-Up Internet | 0 | 0.0% |
| Broadband Home | 237 | 82.9% |
| Cellular Data Only | 20 | 7.0% |
| Satellite Internet | 20 | 7.0% |
| No Internet | 15 | 5.2% |
| Total | 286 | 100.0% |
Denmark Summary
Denmark is a small town located in Lee County, Iowa, United States. It is situated on the banks of the Mississippi River, approximately 20 miles south of the Iowa-Illinois border. The population of Denmark was estimated to be 545 in the year 2020.
Geography
Denmark is located in the southeastern corner of Lee County, Iowa, on the banks of the Mississippi River. The town is situated on a bluff overlooking the river, and is surrounded by rolling hills and farmland. The town is located approximately 20 miles south of the Iowa-Illinois border, and is approximately 40 miles west of the Quad Cities.
The climate in Denmark is typical of the Midwest, with hot summers and cold winters. The average temperature in the summer is around 80 degrees Fahrenheit, while the average temperature in the winter is around 20 degrees Fahrenheit. The town receives an average of 40 inches of precipitation per year.
Economy
The economy of Denmark is largely based on agriculture. The town is home to several farms, which produce corn, soybeans, and other crops. The town also has a small manufacturing sector, which produces a variety of products, including furniture, clothing, and food products.
The town also has a small tourism industry, which is centered around the Mississippi River. The town is home to several parks and recreational areas, which attract visitors from all over the region.
Demographics
As of the 2020 census, the population of Denmark was estimated to be 545. The town is predominantly white, with a small minority population. The median household income in Denmark is $45,000, and the median home value is $125,000.
The town is served by the Lee County School District, which includes two elementary schools, one middle school, and one high school. The town also has a public library, which offers a variety of services and programs.
Conclusion
Denmark is a small town located in Lee County, Iowa, on the banks of the Mississippi River. The town is predominantly white, with a small minority population. The economy of Denmark is largely based on agriculture, with a small manufacturing sector and a small tourism industry. The town is served by the Lee County School District, and has a public library.
Common Questions
What is Per Capita Income in Denmark?
Per Capita income in Denmark is $43,900.
What is the Median Family Income in Denmark?
Median Family Income in Denmark is $145,029.
What is the Median Household income in Denmark?
Median Household Income in Denmark is $116,875.
What is Inequality or Gini Index in Denmark?
Inequality or Gini Index in Denmark is 0.31.
What is the Total Population of Denmark?
Total Population of Denmark is 648.
What is the Total Male Population of Denmark?
Total Male Population of Denmark is 222.
What is the Total Female Population of Denmark?
Total Female Population of Denmark is 426.
What is the Ratio of Males per 100 Females in Denmark?
There are 52.11 Males per 100 Females in Denmark.
What is the Ratio of Females per 100 Males in Denmark?
There are 191.89 Females per 100 Males in Denmark.
What is the Median Population Age in Denmark?
Median Population Age in Denmark is 48.8 Years.
What is the Average Family Size in Denmark
Average Family Size in Denmark is 2.5 People.
What is the Average Household Size in Denmark
Average Household Size in Denmark is 2.3 People.
How Large is the Labor Force in Denmark?
There are 340 People in the Labor Forcein in Denmark.
What is the Percentage of People in the Labor Force in Denmark?
65.6% of People are in the Labor Force in Denmark.