Cities with the Highest Percentage of Sioux Population in Iowa
RELATED REPORTS & OPTIONS
Sioux
Iowa
Compare Cities
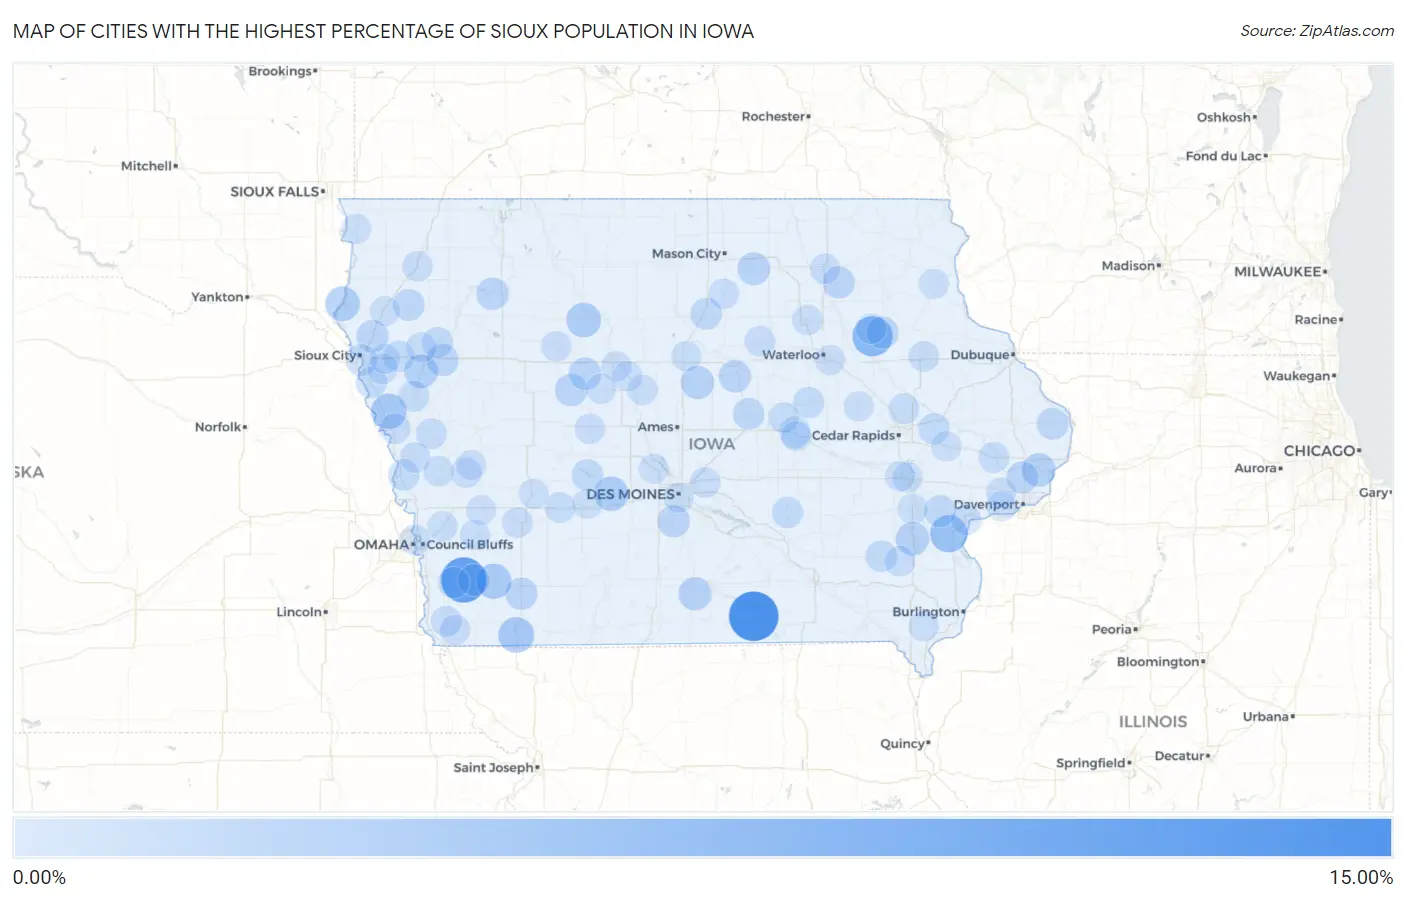
Map of Cities with the Highest Percentage of Sioux Population in Iowa
0.00%
15.00%
Cities with the Highest Percentage of Sioux Population in Iowa
| City | Sioux | vs State | vs National | |
| 1. | Mystic | 11.04% | 0.10%(+10.9)#1 | 0.061%(+11.0)#132 |
| 2. | Hastings | 8.66% | 0.10%(+8.56)#2 | 0.061%(+8.60)#162 |
| 3. | Hazleton | 5.68% | 0.10%(+5.58)#3 | 0.061%(+5.62)#200 |
| 4. | Letts | 4.12% | 0.10%(+4.02)#4 | 0.061%(+4.06)#253 |
| 5. | Shambaugh | 3.14% | 0.10%(+3.04)#5 | 0.061%(+3.08)#311 |
| 6. | Whiting | 3.02% | 0.10%(+2.92)#6 | 0.061%(+2.96)#321 |
| 7. | Red Oak | 2.88% | 0.10%(+2.77)#7 | 0.061%(+2.82)#334 |
| 8. | Gilmore City | 2.63% | 0.10%(+2.52)#8 | 0.061%(+2.57)#351 |
| 9. | Akron | 2.59% | 0.10%(+2.49)#9 | 0.061%(+2.53)#353 |
| 10. | Redfield | 2.47% | 0.10%(+2.36)#10 | 0.061%(+2.41)#370 |
| 11. | Anthon | 2.09% | 0.10%(+1.98)#11 | 0.061%(+2.03)#419 |
| 12. | Mccausland | 1.99% | 0.10%(+1.88)#12 | 0.061%(+1.93)#433 |
| 13. | Ainsworth | 1.92% | 0.10%(+1.82)#13 | 0.061%(+1.86)#440 |
| 14. | Derby | 1.82% | 0.10%(+1.71)#14 | 0.061%(+1.76)#457 |
| 15. | Radcliffe | 1.77% | 0.10%(+1.67)#15 | 0.061%(+1.71)#466 |
| 16. | Rockford | 1.56% | 0.10%(+1.46)#16 | 0.061%(+1.50)#511 |
| 17. | Lohrville | 1.50% | 0.10%(+1.39)#17 | 0.061%(+1.44)#528 |
| 18. | Somers | 1.49% | 0.10%(+1.39)#18 | 0.061%(+1.43)#529 |
| 19. | Eldora | 1.44% | 0.10%(+1.33)#19 | 0.061%(+1.38)#544 |
| 20. | Linn Grove | 1.41% | 0.10%(+1.30)#20 | 0.061%(+1.35)#553 |
| 21. | Spring Hill | 1.41% | 0.10%(+1.30)#21 | 0.061%(+1.35)#554 |
| 22. | Cushing | 1.32% | 0.10%(+1.21)#22 | 0.061%(+1.25)#577 |
| 23. | Villisca | 1.31% | 0.10%(+1.20)#23 | 0.061%(+1.25)#579 |
| 24. | Hinton | 1.28% | 0.10%(+1.18)#24 | 0.061%(+1.22)#589 |
| 25. | Fredericksburg | 1.24% | 0.10%(+1.13)#25 | 0.061%(+1.17)#599 |
| 26. | Stanley | 1.23% | 0.10%(+1.13)#26 | 0.061%(+1.17)#600 |
| 27. | Long Grove | 1.19% | 0.10%(+1.08)#27 | 0.061%(+1.12)#615 |
| 28. | Emerson | 1.18% | 0.10%(+1.08)#28 | 0.061%(+1.12)#617 |
| 29. | Nichols | 1.16% | 0.10%(+1.06)#29 | 0.061%(+1.10)#623 |
| 30. | Remsen | 1.10% | 0.10%(+0.993)#30 | 0.061%(+1.04)#654 |
| 31. | Albion | 1.01% | 0.10%(+0.907)#31 | 0.061%(+0.951)#684 |
| 32. | Latimer | 1.01% | 0.10%(+0.904)#32 | 0.061%(+0.948)#687 |
| 33. | Miles | 1.01% | 0.10%(+0.900)#33 | 0.061%(+0.944)#688 |
| 34. | Toledo | 0.93% | 0.10%(+0.824)#34 | 0.061%(+0.867)#731 |
| 35. | Lake Panorama | 0.92% | 0.10%(+0.819)#35 | 0.061%(+0.863)#735 |
| 36. | Sioux City | 0.88% | 0.10%(+0.774)#36 | 0.061%(+0.818)#766 |
| 37. | Brighton | 0.84% | 0.10%(+0.739)#37 | 0.061%(+0.783)#782 |
| 38. | Mondamin | 0.77% | 0.10%(+0.667)#38 | 0.061%(+0.710)#827 |
| 39. | Traer | 0.76% | 0.10%(+0.659)#39 | 0.061%(+0.702)#832 |
| 40. | New Sharon | 0.76% | 0.10%(+0.656)#40 | 0.061%(+0.700)#839 |
| 41. | Moville | 0.73% | 0.10%(+0.627)#41 | 0.061%(+0.671)#862 |
| 42. | Martelle | 0.73% | 0.10%(+0.625)#42 | 0.061%(+0.669)#866 |
| 43. | Malvern | 0.71% | 0.10%(+0.607)#43 | 0.061%(+0.651)#880 |
| 44. | Salix | 0.67% | 0.10%(+0.568)#44 | 0.061%(+0.612)#909 |
| 45. | Washta | 0.65% | 0.10%(+0.541)#45 | 0.061%(+0.584)#930 |
| 46. | Smithland | 0.64% | 0.10%(+0.532)#46 | 0.061%(+0.576)#936 |
| 47. | Soldier | 0.60% | 0.10%(+0.498)#47 | 0.061%(+0.542)#972 |
| 48. | Wheatland | 0.58% | 0.10%(+0.473)#48 | 0.061%(+0.516)#994 |
| 49. | Sidney | 0.53% | 0.10%(+0.423)#49 | 0.061%(+0.467)#1,042 |
| 50. | Onawa | 0.52% | 0.10%(+0.417)#50 | 0.061%(+0.461)#1,048 |
| 51. | Carter Lake | 0.50% | 0.10%(+0.398)#51 | 0.061%(+0.442)#1,072 |
| 52. | Garwin | 0.49% | 0.10%(+0.384)#52 | 0.061%(+0.428)#1,086 |
| 53. | Adair | 0.48% | 0.10%(+0.378)#53 | 0.061%(+0.422)#1,094 |
| 54. | Alburnett | 0.48% | 0.10%(+0.378)#54 | 0.061%(+0.422)#1,095 |
| 55. | Manchester | 0.47% | 0.10%(+0.365)#55 | 0.061%(+0.409)#1,113 |
| 56. | Wayland | 0.44% | 0.10%(+0.331)#56 | 0.061%(+0.375)#1,156 |
| 57. | Atlantic | 0.43% | 0.10%(+0.324)#57 | 0.061%(+0.367)#1,164 |
| 58. | Sheffield | 0.41% | 0.10%(+0.309)#58 | 0.061%(+0.353)#1,185 |
| 59. | Panama | 0.40% | 0.10%(+0.300)#59 | 0.061%(+0.344)#1,194 |
| 60. | Waverly | 0.40% | 0.10%(+0.299)#60 | 0.061%(+0.343)#1,197 |
| 61. | Pisgah | 0.40% | 0.10%(+0.299)#61 | 0.061%(+0.342)#1,199 |
| 62. | Mitchellville | 0.40% | 0.10%(+0.294)#62 | 0.061%(+0.338)#1,205 |
| 63. | Pomeroy | 0.38% | 0.10%(+0.275)#63 | 0.061%(+0.319)#1,244 |
| 64. | Riverton | 0.38% | 0.10%(+0.273)#64 | 0.061%(+0.316)#1,247 |
| 65. | Muscatine | 0.35% | 0.10%(+0.242)#65 | 0.061%(+0.286)#1,291 |
| 66. | Bronson | 0.34% | 0.10%(+0.233)#66 | 0.061%(+0.277)#1,305 |
| 67. | Jefferson | 0.33% | 0.10%(+0.230)#67 | 0.061%(+0.273)#1,314 |
| 68. | Aplington | 0.33% | 0.10%(+0.226)#68 | 0.061%(+0.270)#1,322 |
| 69. | Hospers | 0.32% | 0.10%(+0.214)#69 | 0.061%(+0.258)#1,350 |
| 70. | Woodbine | 0.31% | 0.10%(+0.206)#70 | 0.061%(+0.250)#1,367 |
| 71. | Pierson | 0.31% | 0.10%(+0.203)#71 | 0.061%(+0.247)#1,380 |
| 72. | Evansdale | 0.31% | 0.10%(+0.202)#72 | 0.061%(+0.246)#1,381 |
| 73. | Underwood | 0.31% | 0.10%(+0.201)#73 | 0.061%(+0.244)#1,385 |
| 74. | Oelwein | 0.30% | 0.10%(+0.199)#74 | 0.061%(+0.242)#1,393 |
| 75. | Oakland | 0.30% | 0.10%(+0.193)#75 | 0.061%(+0.237)#1,411 |
| 76. | New Hampton | 0.29% | 0.10%(+0.183)#76 | 0.061%(+0.227)#1,429 |
| 77. | Williams | 0.28% | 0.10%(+0.175)#77 | 0.061%(+0.219)#1,445 |
| 78. | Riverside | 0.28% | 0.10%(+0.171)#78 | 0.061%(+0.214)#1,451 |
| 79. | Farmersburg | 0.25% | 0.10%(+0.149)#79 | 0.061%(+0.192)#1,503 |
| 80. | Earling | 0.25% | 0.10%(+0.144)#80 | 0.061%(+0.187)#1,516 |
| 81. | Menlo | 0.25% | 0.10%(+0.141)#81 | 0.061%(+0.185)#1,527 |
| 82. | Coralville | 0.24% | 0.10%(+0.140)#82 | 0.061%(+0.184)#1,530 |
| 83. | Stratford | 0.24% | 0.10%(+0.139)#83 | 0.061%(+0.182)#1,534 |
| 84. | Otho | 0.24% | 0.10%(+0.133)#84 | 0.061%(+0.177)#1,549 |
| 85. | Lehigh | 0.24% | 0.10%(+0.132)#85 | 0.061%(+0.176)#1,553 |
| 86. | Exira | 0.24% | 0.10%(+0.132)#86 | 0.061%(+0.175)#1,554 |
| 87. | Gowrie | 0.23% | 0.10%(+0.130)#87 | 0.061%(+0.173)#1,559 |
| 88. | Inwood | 0.23% | 0.10%(+0.123)#88 | 0.061%(+0.167)#1,579 |
| 89. | West Point | 0.22% | 0.10%(+0.114)#89 | 0.061%(+0.158)#1,615 |
| 90. | Avoca | 0.22% | 0.10%(+0.114)#90 | 0.061%(+0.157)#1,618 |
| 91. | Mechanicsville | 0.22% | 0.10%(+0.112)#91 | 0.061%(+0.156)#1,624 |
| 92. | Walcott | 0.22% | 0.10%(+0.111)#92 | 0.061%(+0.155)#1,627 |
| 93. | Blue Grass | 0.21% | 0.10%(+0.109)#93 | 0.061%(+0.153)#1,635 |
| 94. | Granger | 0.21% | 0.10%(+0.101)#94 | 0.061%(+0.144)#1,662 |
| 95. | Vinton | 0.20% | 0.10%(+0.097)#95 | 0.061%(+0.141)#1,670 |
| 96. | Le Mars | 0.20% | 0.10%(+0.094)#96 | 0.061%(+0.138)#1,684 |
| 97. | Lawton | 0.20% | 0.10%(+0.091)#97 | 0.061%(+0.135)#1,698 |
| 98. | Tama | 0.20% | 0.10%(+0.091)#98 | 0.061%(+0.134)#1,702 |
| 99. | Des Moines | 0.19% | 0.10%(+0.085)#99 | 0.061%(+0.129)#1,716 |
| 100. | Tiffin | 0.19% | 0.10%(+0.081)#100 | 0.061%(+0.125)#1,731 |
Common Questions
What are the Top 10 Cities with the Highest Percentage of Sioux Population in Iowa?
Top 10 Cities with the Highest Percentage of Sioux Population in Iowa are:
What city has the Highest Percentage of Sioux Population in Iowa?
Mystic has the Highest Percentage of Sioux Population in Iowa with 11.04%.
What is the Percentage of Sioux Population in the State of Iowa?
Percentage of Sioux Population in Iowa is 0.10%.
What is the Percentage of Sioux Population in the United States?
Percentage of Sioux Population in the United States is 0.061%.