South Amana, IA Map & Demographics
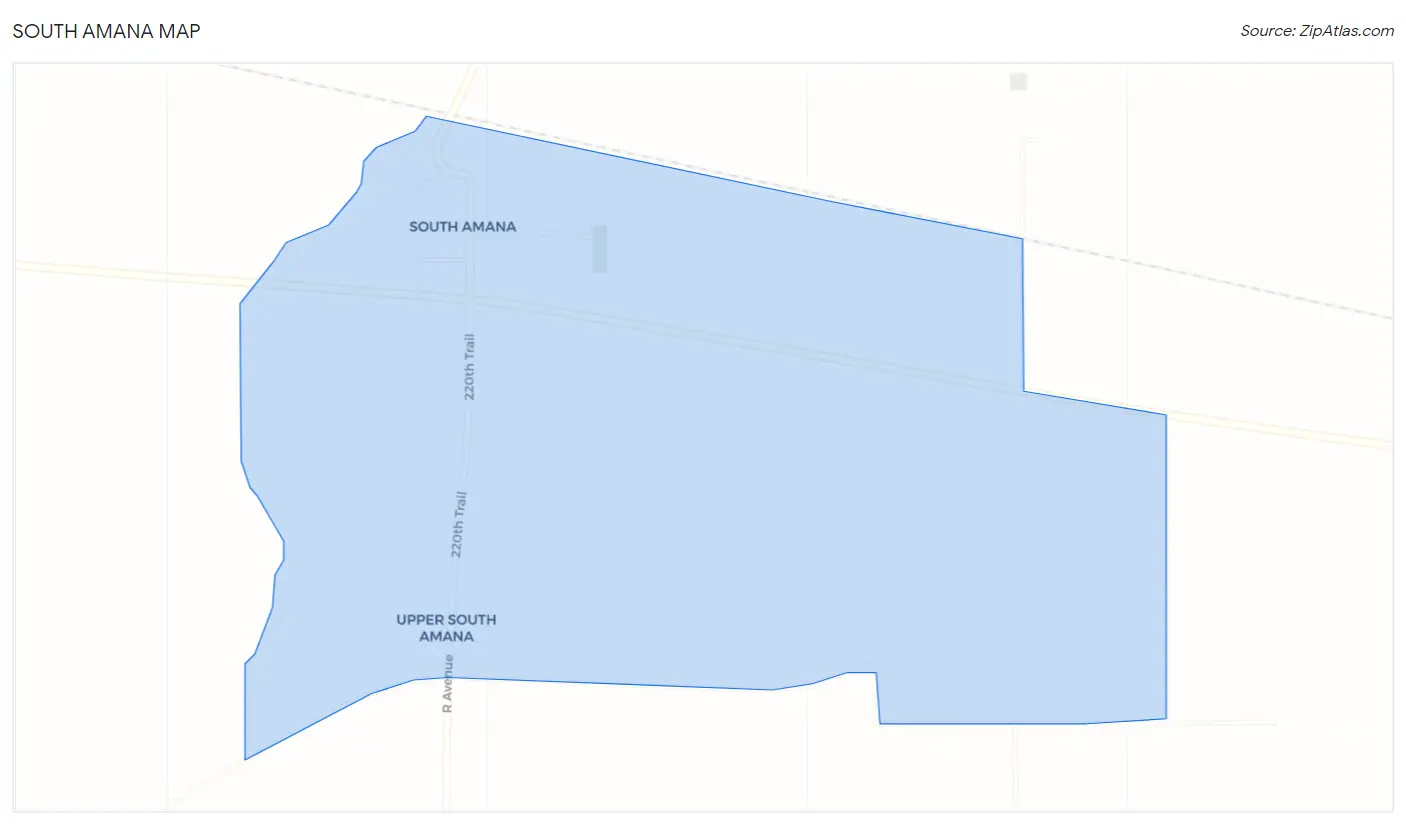
South Amana Map
South Amana Overview
$27,111
PER CAPITA INCOME
8.0%
WAGE / INCOME GAP [ % ]
92.0¢/ $1
WAGE / INCOME GAP [ $ ]
0.46
INEQUALITY / GINI INDEX
151
TOTAL POPULATION
65
MALE POPULATION
86
FEMALE POPULATION
75.58
MALES / 100 FEMALES
132.31
FEMALES / 100 MALES
39.8
MEDIAN AGE
3.2
AVG FAMILY SIZE
3.2
AVG HOUSEHOLD SIZE
68
LABOR FORCE [ PEOPLE ]
60.7%
PERCENT IN LABOR FORCE
South Amana Zip Codes
South Amana Area Codes
Income in South Amana
Income Overview in South Amana
| Characteristic | Number | Measure |
| Per Capita Income | 151 | $27,111 |
| Median Family Income | 47 | $0 |
| Mean Family Income | 47 | $84,138 |
| Median Household Income | 47 | $0 |
| Mean Household Income | 47 | $84,138 |
| Income Deficit | 47 | $0 |
| Wage / Income Gap (%) | 151 | 8.00% |
| Wage / Income Gap ($) | 151 | 92.00¢ per $1 |
| Gini / Inequality Index | 151 | 0.46 |
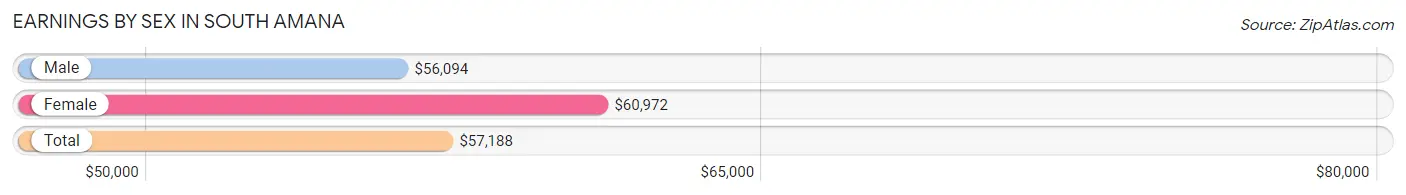
Earnings by Sex in South Amana
Average Earnings in South Amana are $57,188, $56,094 for men and $60,972 for women, a difference of 8.0%.
| Sex | Number | Average Earnings |
| Male | 25 (36.8%) | $56,094 |
| Female | 43 (63.2%) | $60,972 |
| Total | 68 (100.0%) | $57,188 |
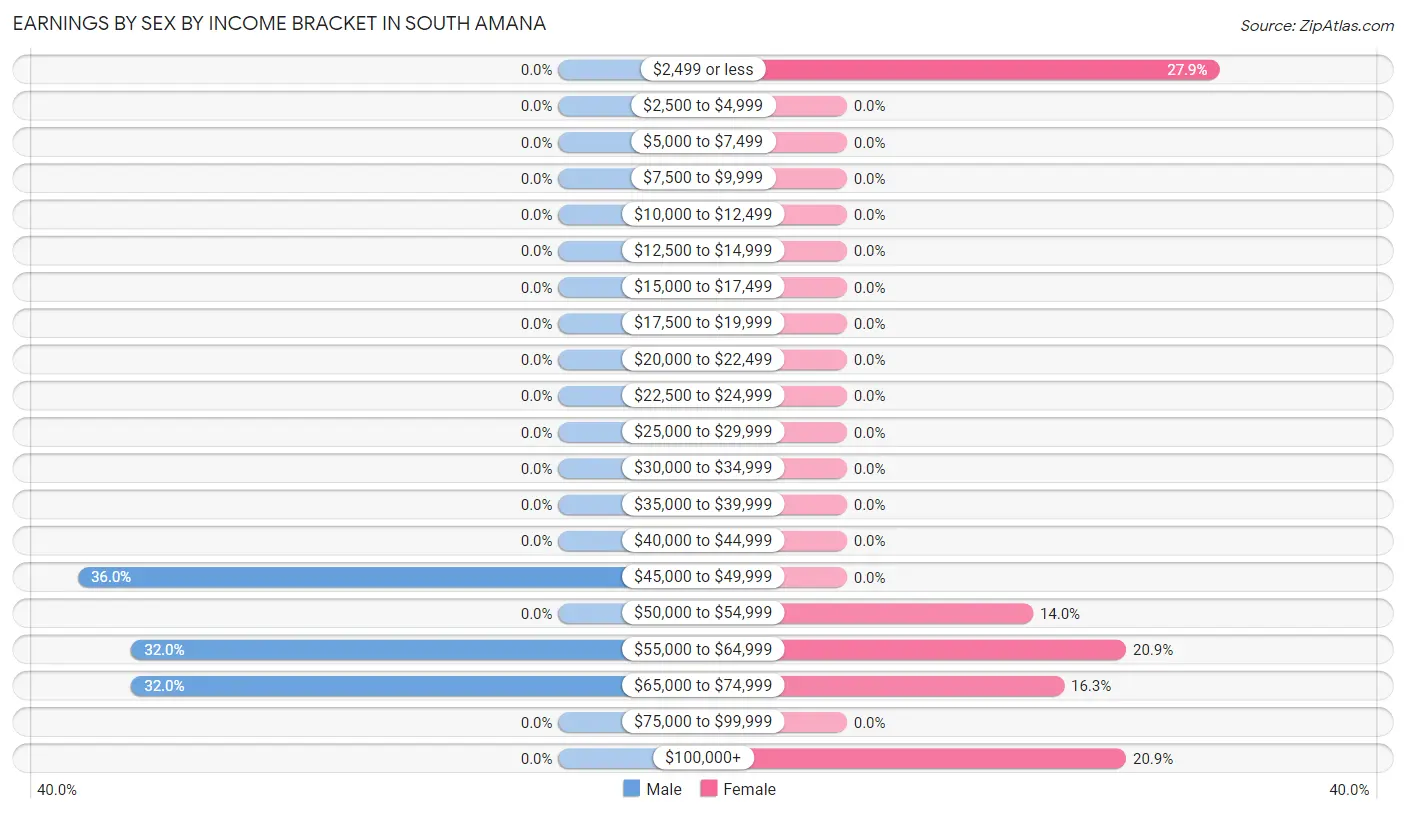
Earnings by Sex by Income Bracket in South Amana
The most common earnings brackets in South Amana are $45,000 to $49,999 for men (9 | 36.0%) and $2,499 or less for women (12 | 27.9%).
| Income | Male | Female |
| $2,499 or less | 0 (0.0%) | 12 (27.9%) |
| $2,500 to $4,999 | 0 (0.0%) | 0 (0.0%) |
| $5,000 to $7,499 | 0 (0.0%) | 0 (0.0%) |
| $7,500 to $9,999 | 0 (0.0%) | 0 (0.0%) |
| $10,000 to $12,499 | 0 (0.0%) | 0 (0.0%) |
| $12,500 to $14,999 | 0 (0.0%) | 0 (0.0%) |
| $15,000 to $17,499 | 0 (0.0%) | 0 (0.0%) |
| $17,500 to $19,999 | 0 (0.0%) | 0 (0.0%) |
| $20,000 to $22,499 | 0 (0.0%) | 0 (0.0%) |
| $22,500 to $24,999 | 0 (0.0%) | 0 (0.0%) |
| $25,000 to $29,999 | 0 (0.0%) | 0 (0.0%) |
| $30,000 to $34,999 | 0 (0.0%) | 0 (0.0%) |
| $35,000 to $39,999 | 0 (0.0%) | 0 (0.0%) |
| $40,000 to $44,999 | 0 (0.0%) | 0 (0.0%) |
| $45,000 to $49,999 | 9 (36.0%) | 0 (0.0%) |
| $50,000 to $54,999 | 0 (0.0%) | 6 (14.0%) |
| $55,000 to $64,999 | 8 (32.0%) | 9 (20.9%) |
| $65,000 to $74,999 | 8 (32.0%) | 7 (16.3%) |
| $75,000 to $99,999 | 0 (0.0%) | 0 (0.0%) |
| $100,000+ | 0 (0.0%) | 9 (20.9%) |
| Total | 25 (100.0%) | 43 (100.0%) |
Earnings by Sex by Educational Attainment in South Amana
| Educational Attainment | Male Income | Female Income |
| Less than High School | - | - |
| High School Diploma | - | - |
| College or Associate's Degree | - | - |
| Bachelor's Degree | - | - |
| Graduate Degree | - | - |
| Total | $56,094 | $65,179 |
Family Income in South Amana
Family Income Brackets in South Amana
According to the South Amana family income data, there are 16 families falling into the less than $10,000 income range, which is the most common income bracket and makes up 34.0% of all families.
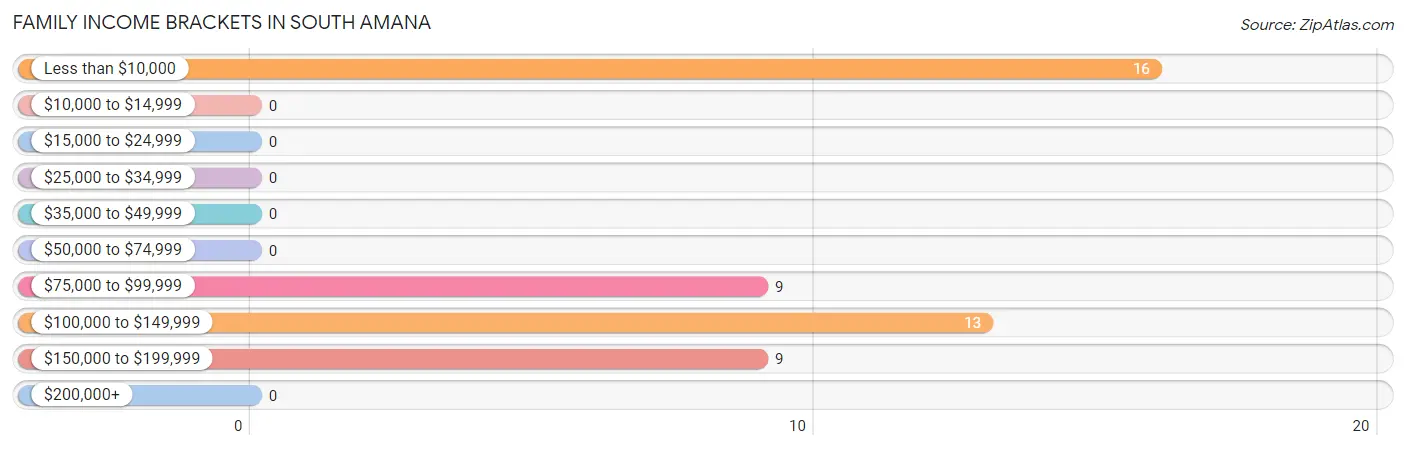
| Income Bracket | # Families | % Families |
| Less than $10,000 | 16 | 34.0% |
| $10,000 to $14,999 | 0 | 0.0% |
| $15,000 to $24,999 | 0 | 0.0% |
| $25,000 to $34,999 | 0 | 0.0% |
| $35,000 to $49,999 | 0 | 0.0% |
| $50,000 to $74,999 | 0 | 0.0% |
| $75,000 to $99,999 | 9 | 19.1% |
| $100,000 to $149,999 | 13 | 27.7% |
| $150,000 to $199,999 | 9 | 19.1% |
| $200,000+ | 0 | 0.0% |
Family Income by Famaliy Size in South Amana
| Income Bracket | # Families | Median Income |
| 2-Person Families | 25 (53.2%) | $0 |
| 3-Person Families | 9 (19.2%) | $0 |
| 4-Person Families | 7 (14.9%) | $0 |
| 5-Person Families | 6 (12.8%) | $0 |
| 6-Person Families | 0 (0.0%) | $0 |
| 7+ Person Families | 0 (0.0%) | $0 |
| Total | 47 (100.0%) | $0 |
Family Income by Number of Earners in South Amana
| Number of Earners | # Families | Median Income |
| No Earners | 16 (34.0%) | $0 |
| 1 Earner | 9 (19.2%) | $0 |
| 2 Earners | 16 (34.0%) | $0 |
| 3+ Earners | 6 (12.8%) | $0 |
| Total | 47 (100.0%) | $0 |
Household Income in South Amana
Household Income Brackets in South Amana
With 16 households falling in the category, the less than $10,000 income range is the most frequent in South Amana, accounting for 34.0% of all households.
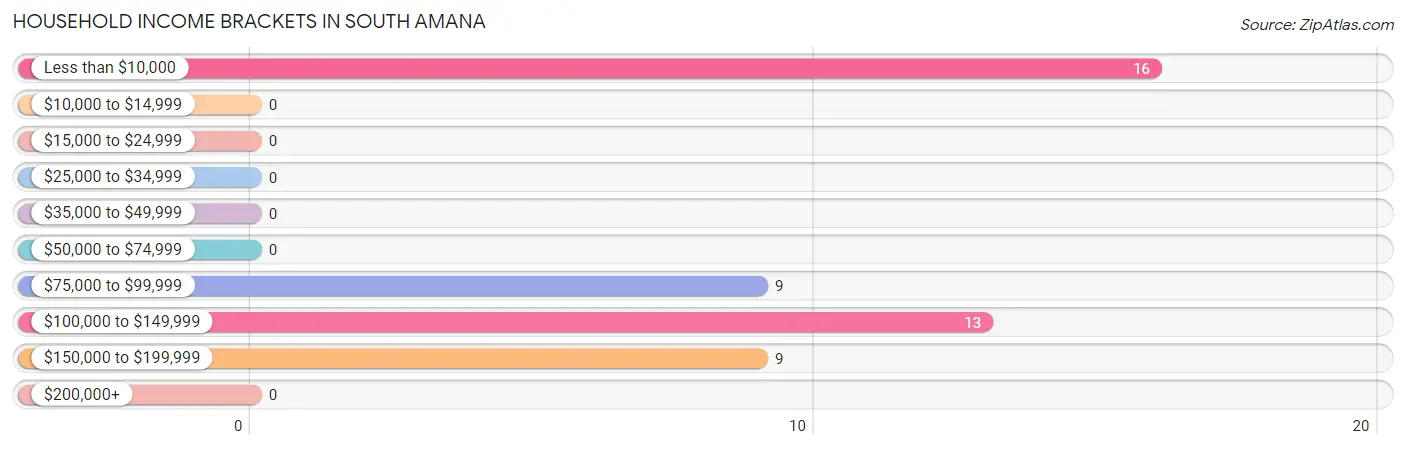
| Income Bracket | # Households | % Households |
| Less than $10,000 | 16 | 34.0% |
| $10,000 to $14,999 | 0 | 0.0% |
| $15,000 to $24,999 | 0 | 0.0% |
| $25,000 to $34,999 | 0 | 0.0% |
| $35,000 to $49,999 | 0 | 0.0% |
| $50,000 to $74,999 | 0 | 0.0% |
| $75,000 to $99,999 | 9 | 19.1% |
| $100,000 to $149,999 | 13 | 27.7% |
| $150,000 to $199,999 | 9 | 19.1% |
| $200,000+ | 0 | 0.0% |
Household Income by Householder Age in South Amana
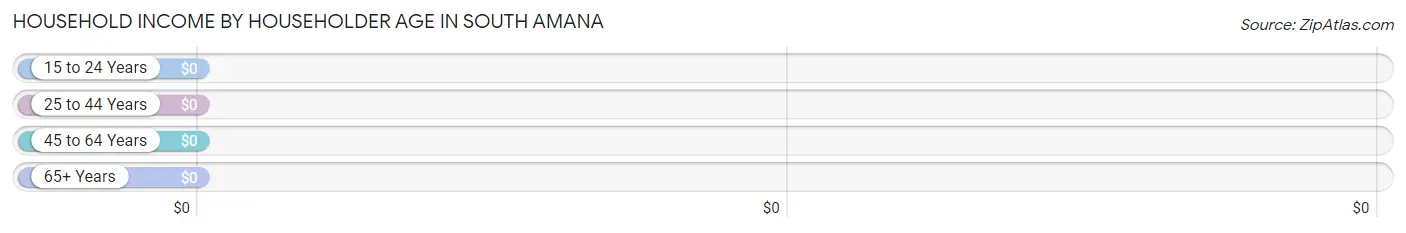
| Income Bracket | # Households | Median Income |
| 15 to 24 Years | 0 (0.0%) | $0 |
| 25 to 44 Years | 16 (34.0%) | $0 |
| 45 to 64 Years | 22 (46.8%) | $0 |
| 65+ Years | 9 (19.2%) | $0 |
| Total | 47 (100.0%) | $0 |
Poverty in South Amana
Income Below Poverty by Sex and Age in South Amana
With 29.2% poverty level for males and 18.6% for females among the residents of South Amana, 55 to 64 year old males and 45 to 54 year old females are the most vulnerable to poverty, with 19 males (100.0%) and 16 females (72.7%) in their respective age groups living below the poverty level.
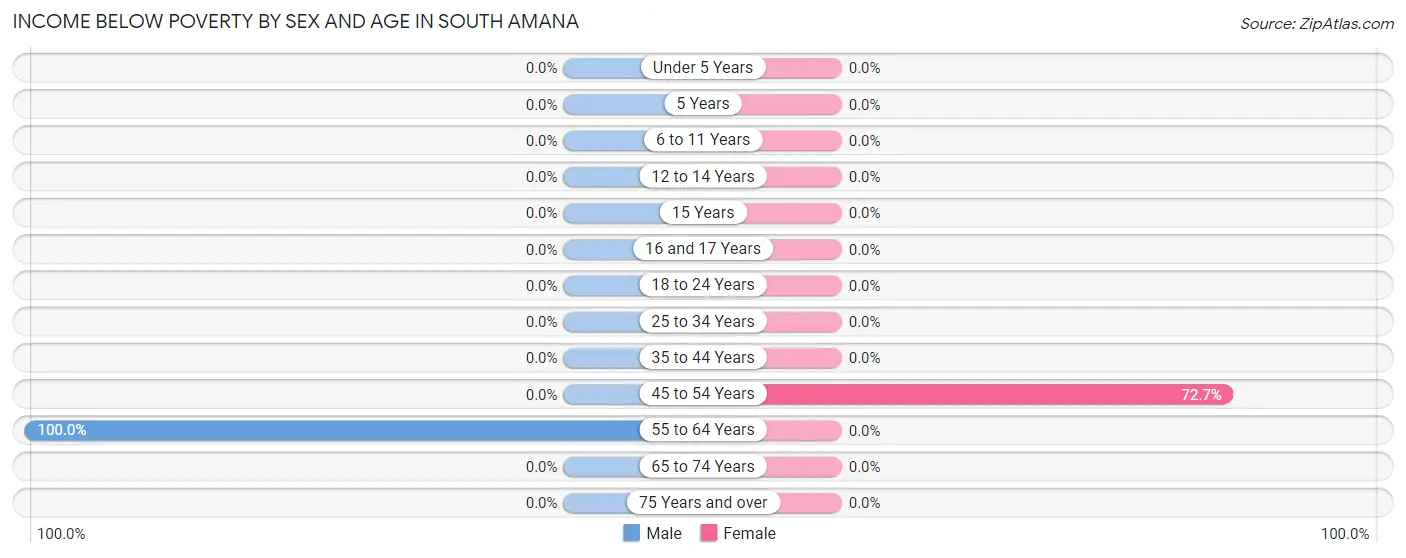
| Age Bracket | Male | Female |
| Under 5 Years | 0 (0.0%) | 0 (0.0%) |
| 5 Years | 0 (0.0%) | 0 (0.0%) |
| 6 to 11 Years | 0 (0.0%) | 0 (0.0%) |
| 12 to 14 Years | 0 (0.0%) | 0 (0.0%) |
| 15 Years | 0 (0.0%) | 0 (0.0%) |
| 16 and 17 Years | 0 (0.0%) | 0 (0.0%) |
| 18 to 24 Years | 0 (0.0%) | 0 (0.0%) |
| 25 to 34 Years | 0 (0.0%) | 0 (0.0%) |
| 35 to 44 Years | 0 (0.0%) | 0 (0.0%) |
| 45 to 54 Years | 0 (0.0%) | 16 (72.7%) |
| 55 to 64 Years | 19 (100.0%) | 0 (0.0%) |
| 65 to 74 Years | 0 (0.0%) | 0 (0.0%) |
| 75 Years and over | 0 (0.0%) | 0 (0.0%) |
| Total | 19 (29.2%) | 16 (18.6%) |
Income Above Poverty by Sex and Age in South Amana
According to the poverty statistics in South Amana, males aged 12 to 14 years and females aged under 5 years are the age groups that are most secure financially, with 100.0% of males and 100.0% of females in these age groups living above the poverty line.
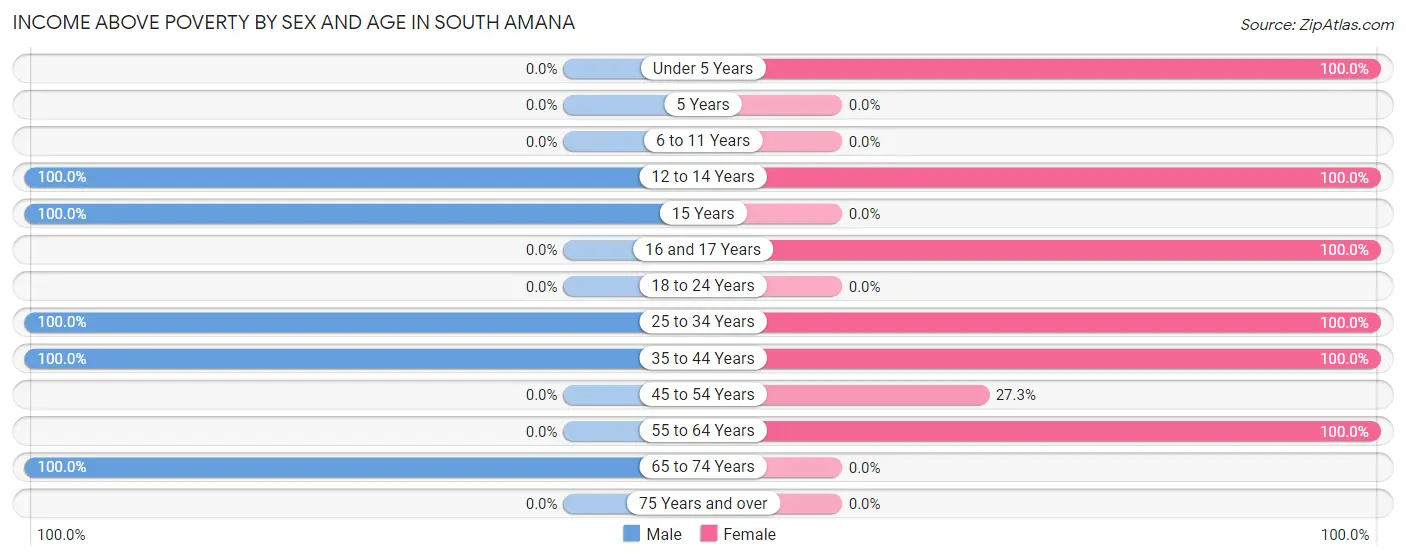
| Age Bracket | Male | Female |
| Under 5 Years | 0 (0.0%) | 11 (100.0%) |
| 5 Years | 0 (0.0%) | 0 (0.0%) |
| 6 to 11 Years | 0 (0.0%) | 0 (0.0%) |
| 12 to 14 Years | 5 (100.0%) | 16 (100.0%) |
| 15 Years | 7 (100.0%) | 0 (0.0%) |
| 16 and 17 Years | 0 (0.0%) | 12 (100.0%) |
| 18 to 24 Years | 0 (0.0%) | 0 (0.0%) |
| 25 to 34 Years | 8 (100.0%) | 9 (100.0%) |
| 35 to 44 Years | 17 (100.0%) | 7 (100.0%) |
| 45 to 54 Years | 0 (0.0%) | 6 (27.3%) |
| 55 to 64 Years | 0 (0.0%) | 9 (100.0%) |
| 65 to 74 Years | 9 (100.0%) | 0 (0.0%) |
| 75 Years and over | 0 (0.0%) | 0 (0.0%) |
| Total | 46 (70.8%) | 70 (81.4%) |
Income Below Poverty Among Married-Couple Families in South Amana
The poverty statistics for married-couple families in South Amana show that 34.0% or 16 of the total 47 families live below the poverty line. Families with no children have the highest poverty rate of 64.0%, comprising of 16 families. On the other hand, families with 1 or 2 children have the lowest poverty rate of 0.0%, which includes 0 families.
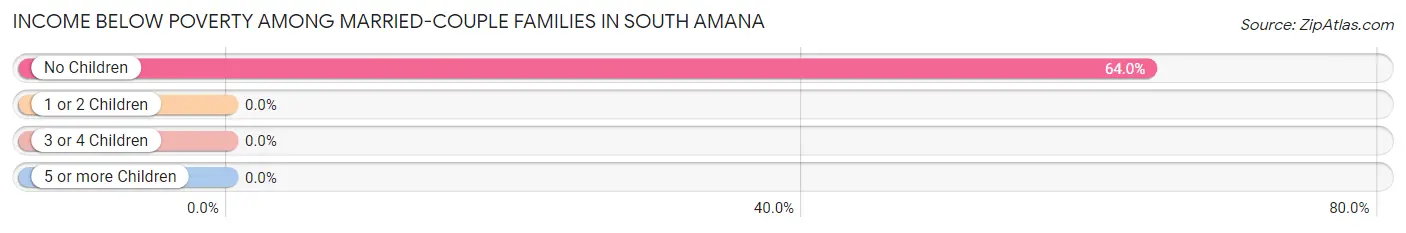
| Children | Above Poverty | Below Poverty |
| No Children | 9 (36.0%) | 16 (64.0%) |
| 1 or 2 Children | 16 (100.0%) | 0 (0.0%) |
| 3 or 4 Children | 6 (100.0%) | 0 (0.0%) |
| 5 or more Children | 0 (0.0%) | 0 (0.0%) |
| Total | 31 (66.0%) | 16 (34.0%) |
Income Below Poverty Among Single-Parent Households in South Amana
| Children | Single Father | Single Mother |
| No Children | 0 (0.0%) | 0 (0.0%) |
| 1 or 2 Children | 0 (0.0%) | 0 (0.0%) |
| 3 or 4 Children | 0 (0.0%) | 0 (0.0%) |
| 5 or more Children | 0 (0.0%) | 0 (0.0%) |
| Total | 0 (0.0%) | 0 (0.0%) |
Income Below Poverty Among Married-Couple vs Single-Parent Households in South Amana
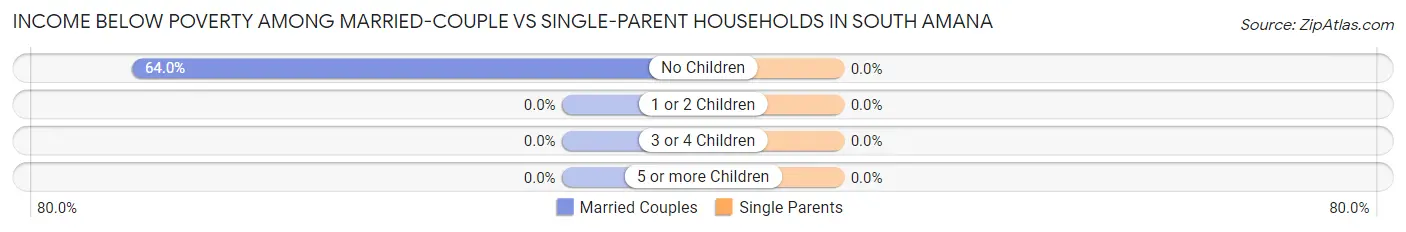
| Children | Married-Couple Families | Single-Parent Households |
| No Children | 16 (64.0%) | 0 (0.0%) |
| 1 or 2 Children | 0 (0.0%) | 0 (0.0%) |
| 3 or 4 Children | 0 (0.0%) | 0 (0.0%) |
| 5 or more Children | 0 (0.0%) | 0 (0.0%) |
| Total | 16 (34.0%) | 0 (0.0%) |
Race in South Amana
The most populous races in South Amana are , and White / Caucasian (151 | 100.0%).
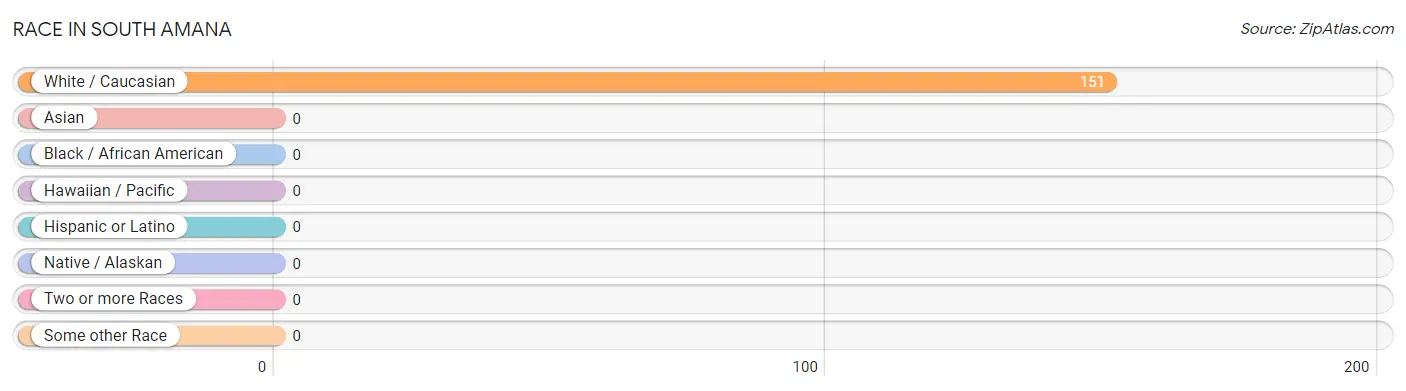
| Race | # Population | % Population |
| Asian | 0 | 0.0% |
| Black / African American | 0 | 0.0% |
| Hawaiian / Pacific | 0 | 0.0% |
| Hispanic or Latino | 0 | 0.0% |
| Native / Alaskan | 0 | 0.0% |
| White / Caucasian | 151 | 100.0% |
| Two or more Races | 0 | 0.0% |
| Some other Race | 0 | 0.0% |
| Total | 151 | 100.0% |
Ancestry in South Amana
The most populous ancestries reported in South Amana are German (72 | 47.7%), English (29 | 19.2%), Norwegian (26 | 17.2%), French (16 | 10.6%), and Czech (9 | 6.0%), together accounting for 100.7% of all South Amana residents.
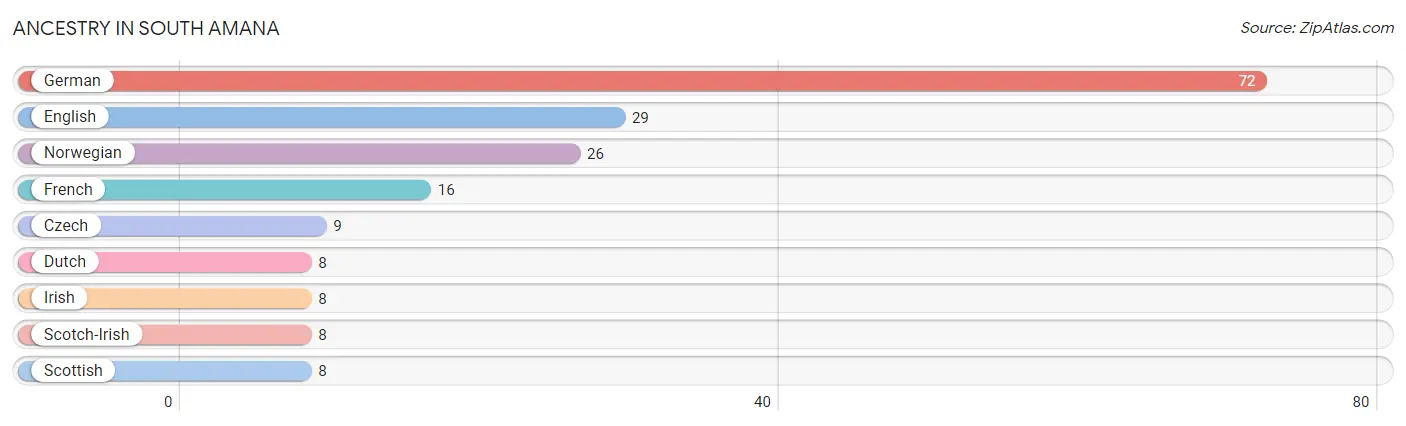
| Ancestry | # Population | % Population |
| Czech | 9 | 6.0% |
| Dutch | 8 | 5.3% |
| English | 29 | 19.2% |
| French | 16 | 10.6% |
| German | 72 | 47.7% |
| Irish | 8 | 5.3% |
| Norwegian | 26 | 17.2% |
| Scotch-Irish | 8 | 5.3% |
| Scottish | 8 | 5.3% | View All 9 Rows |
Immigrants in South Amana

| Immigration Origin | # Population | % Population | View All 0 Rows |
Sex and Age in South Amana
Sex and Age in South Amana
The most populous age groups in South Amana are 60 to 64 Years (19 | 29.2%) for men and 50 to 54 Years (22 | 25.6%) for women.
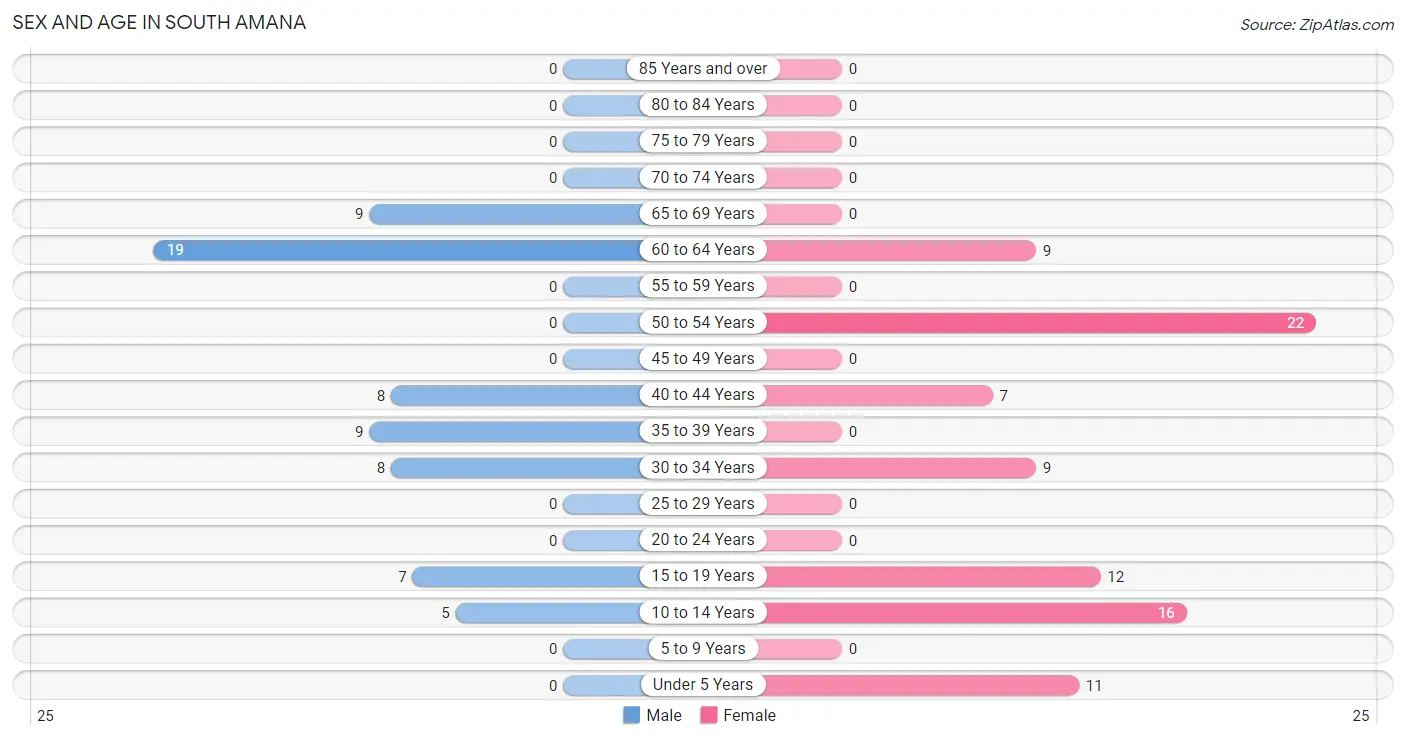
| Age Bracket | Male | Female |
| Under 5 Years | 0 (0.0%) | 11 (12.8%) |
| 5 to 9 Years | 0 (0.0%) | 0 (0.0%) |
| 10 to 14 Years | 5 (7.7%) | 16 (18.6%) |
| 15 to 19 Years | 7 (10.8%) | 12 (14.0%) |
| 20 to 24 Years | 0 (0.0%) | 0 (0.0%) |
| 25 to 29 Years | 0 (0.0%) | 0 (0.0%) |
| 30 to 34 Years | 8 (12.3%) | 9 (10.5%) |
| 35 to 39 Years | 9 (13.9%) | 0 (0.0%) |
| 40 to 44 Years | 8 (12.3%) | 7 (8.1%) |
| 45 to 49 Years | 0 (0.0%) | 0 (0.0%) |
| 50 to 54 Years | 0 (0.0%) | 22 (25.6%) |
| 55 to 59 Years | 0 (0.0%) | 0 (0.0%) |
| 60 to 64 Years | 19 (29.2%) | 9 (10.5%) |
| 65 to 69 Years | 9 (13.9%) | 0 (0.0%) |
| 70 to 74 Years | 0 (0.0%) | 0 (0.0%) |
| 75 to 79 Years | 0 (0.0%) | 0 (0.0%) |
| 80 to 84 Years | 0 (0.0%) | 0 (0.0%) |
| 85 Years and over | 0 (0.0%) | 0 (0.0%) |
| Total | 65 (100.0%) | 86 (100.0%) |
Families and Households in South Amana
Median Family Size in South Amana
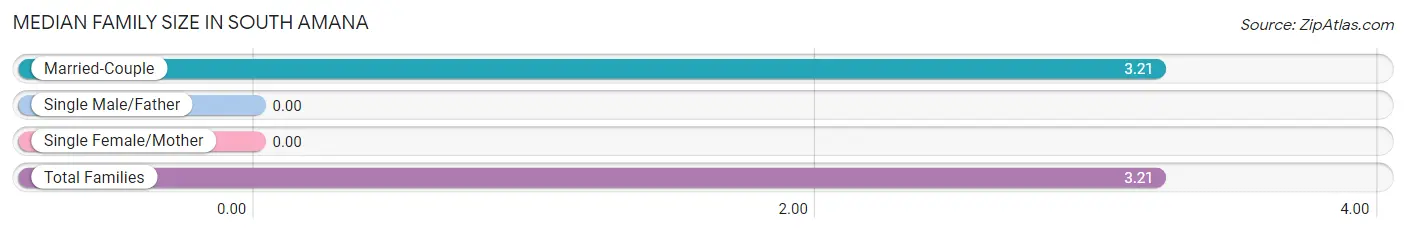
| Family Type | # Families | Family Size |
| Married-Couple | 47 (100.0%) | 3.21 |
| Single Male/Father | 0 (0.0%) | - |
| Single Female/Mother | 0 (0.0%) | - |
| Total Families | 47 (100.0%) | 3.21 |
Median Household Size in South Amana
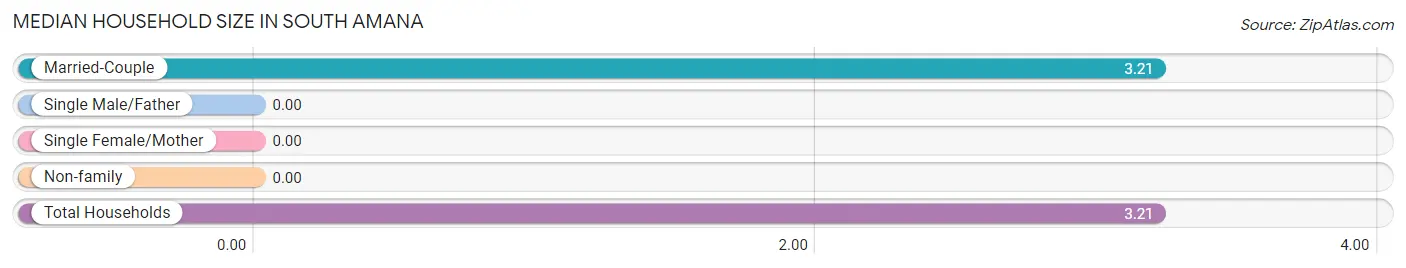
| Household Type | # Households | Household Size |
| Married-Couple | 47 (100.0%) | 3.21 |
| Single Male/Father | 0 (0.0%) | - |
| Single Female/Mother | 0 (0.0%) | - |
| Non-family | 0 (0.0%) | - |
| Total Households | 47 (100.0%) | 3.21 |
Household Size by Marriage Status in South Amana
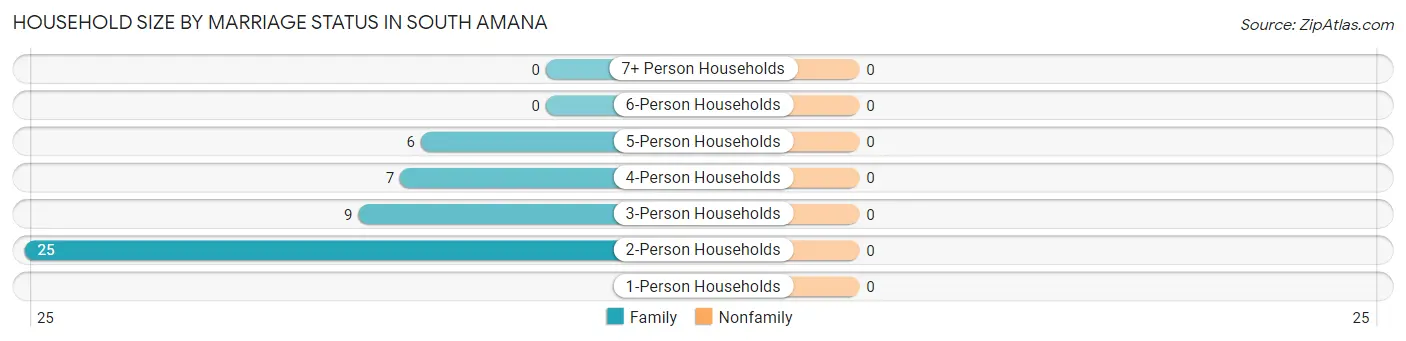
| Household Size | Family Households | Nonfamily Households |
| 1-Person Households | - | 0 (0.0%) |
| 2-Person Households | 25 (53.2%) | 0 (0.0%) |
| 3-Person Households | 9 (19.2%) | 0 (0.0%) |
| 4-Person Households | 7 (14.9%) | 0 (0.0%) |
| 5-Person Households | 6 (12.8%) | 0 (0.0%) |
| 6-Person Households | 0 (0.0%) | 0 (0.0%) |
| 7+ Person Households | 0 (0.0%) | 0 (0.0%) |
| Total | 47 (100.0%) | 0 (0.0%) |
Female Fertility in South Amana
Fertility by Age in South Amana
| Age Bracket | Women with Births | Births / 1,000 Women |
| 15 to 19 years | 0 (0.0%) | 0.0 |
| 20 to 34 years | 0 (0.0%) | 0.0 |
| 35 to 50 years | 0 (0.0%) | 0.0 |
| Total | 0 (0.0%) | 0.0 |
Fertility by Age by Marriage Status in South Amana
| Age Bracket | Married | Unmarried |
| 15 to 19 years | 0 (0.0%) | 0 (0.0%) |
| 20 to 34 years | 0 (0.0%) | 0 (0.0%) |
| 35 to 50 years | 0 (0.0%) | 0 (0.0%) |
| Total | 0 (0.0%) | 0 (0.0%) |
Fertility by Education in South Amana
| Educational Attainment | Women with Births | Births / 1,000 Women |
| Less than High School | 0 (0.0%) | 0.0 |
| High School Diploma | 0 (0.0%) | 0.0 |
| College or Associate's Degree | 0 (0.0%) | 0.0 |
| Bachelor's Degree | 0 (0.0%) | 0.0 |
| Graduate Degree | 0 (0.0%) | 0.0 |
| Total | 0 (0.0%) | 0.0 |
Fertility by Education by Marriage Status in South Amana
| Educational Attainment | Married | Unmarried |
| Less than High School | 0 (0.0%) | 0 (0.0%) |
| High School Diploma | 0 (0.0%) | 0 (0.0%) |
| College or Associate's Degree | 0 (0.0%) | 0 (0.0%) |
| Bachelor's Degree | 0 (0.0%) | 0 (0.0%) |
| Graduate Degree | 0 (0.0%) | 0 (0.0%) |
| Total | 0 (0.0%) | 0 (0.0%) |
Employment Characteristics in South Amana
Employment by Class of Employer in South Amana
Among the 68 employed individuals in South Amana, private company employees (45 | 66.2%), state government employees (15 | 22.1%), and local government employees (8 | 11.8%) make up the most common classes of employment.
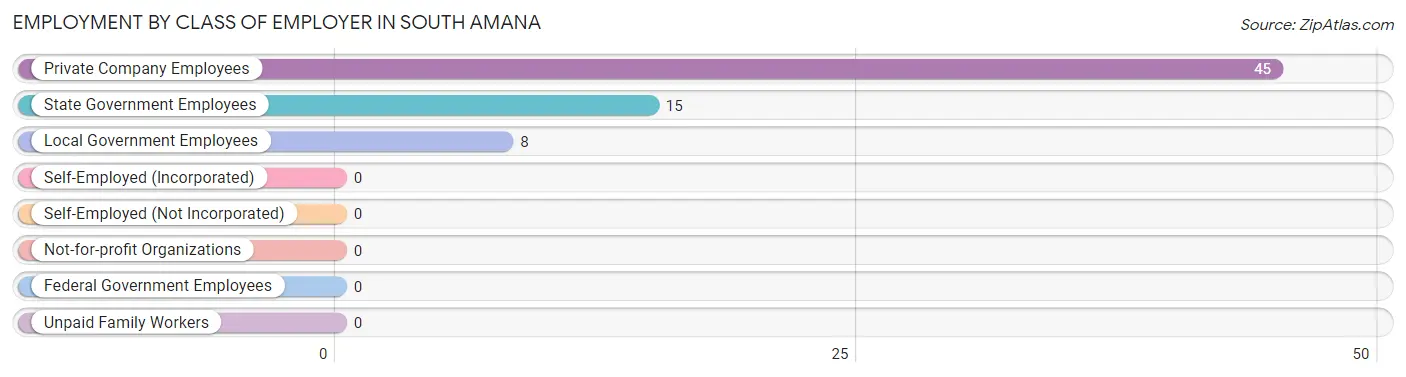
| Employer Class | # Employees | % Employees |
| Private Company Employees | 45 | 66.2% |
| Self-Employed (Incorporated) | 0 | 0.0% |
| Self-Employed (Not Incorporated) | 0 | 0.0% |
| Not-for-profit Organizations | 0 | 0.0% |
| Local Government Employees | 8 | 11.8% |
| State Government Employees | 15 | 22.1% |
| Federal Government Employees | 0 | 0.0% |
| Unpaid Family Workers | 0 | 0.0% |
| Total | 68 | 100.0% |
Employment Status by Age in South Amana
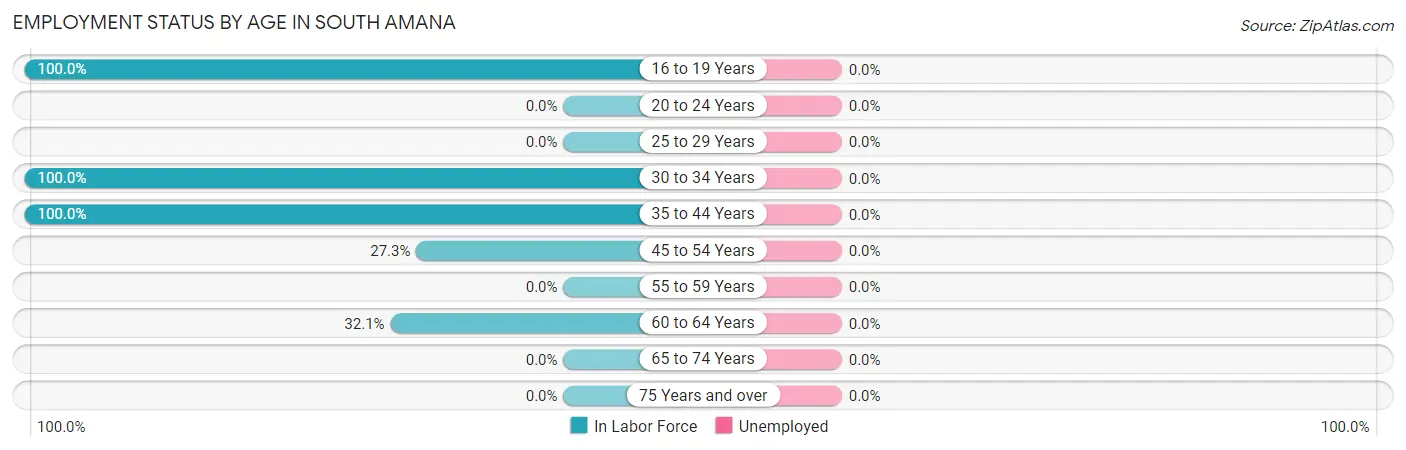
| Age Bracket | In Labor Force | Unemployed |
| 16 to 19 Years | 12 (100.0%) | 0 (0.0%) |
| 20 to 24 Years | 0 (0.0%) | 0 (0.0%) |
| 25 to 29 Years | 0 (0.0%) | 0 (0.0%) |
| 30 to 34 Years | 17 (100.0%) | 0 (0.0%) |
| 35 to 44 Years | 24 (100.0%) | 0 (0.0%) |
| 45 to 54 Years | 6 (27.3%) | 0 (0.0%) |
| 55 to 59 Years | 0 (0.0%) | 0 (0.0%) |
| 60 to 64 Years | 9 (32.1%) | 0 (0.0%) |
| 65 to 74 Years | 0 (0.0%) | 0 (0.0%) |
| 75 Years and over | 0 (0.0%) | 0 (0.0%) |
| Total | 68 (60.7%) | 0 (0.0%) |
Employment Status by Educational Attainment in South Amana
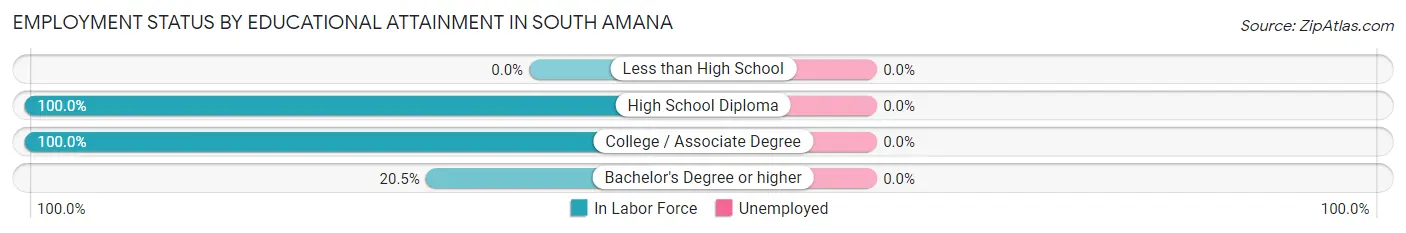
| Educational Attainment | In Labor Force | Unemployed |
| Less than High School | 0 (0.0%) | 0 (0.0%) |
| High School Diploma | 18 (100.0%) | 0 (0.0%) |
| College / Associate Degree | 29 (100.0%) | 0 (0.0%) |
| Bachelor's Degree or higher | 9 (20.5%) | 0 (0.0%) |
| Total | 56 (61.5%) | 0 (0.0%) |
Employment Occupations by Sex in South Amana
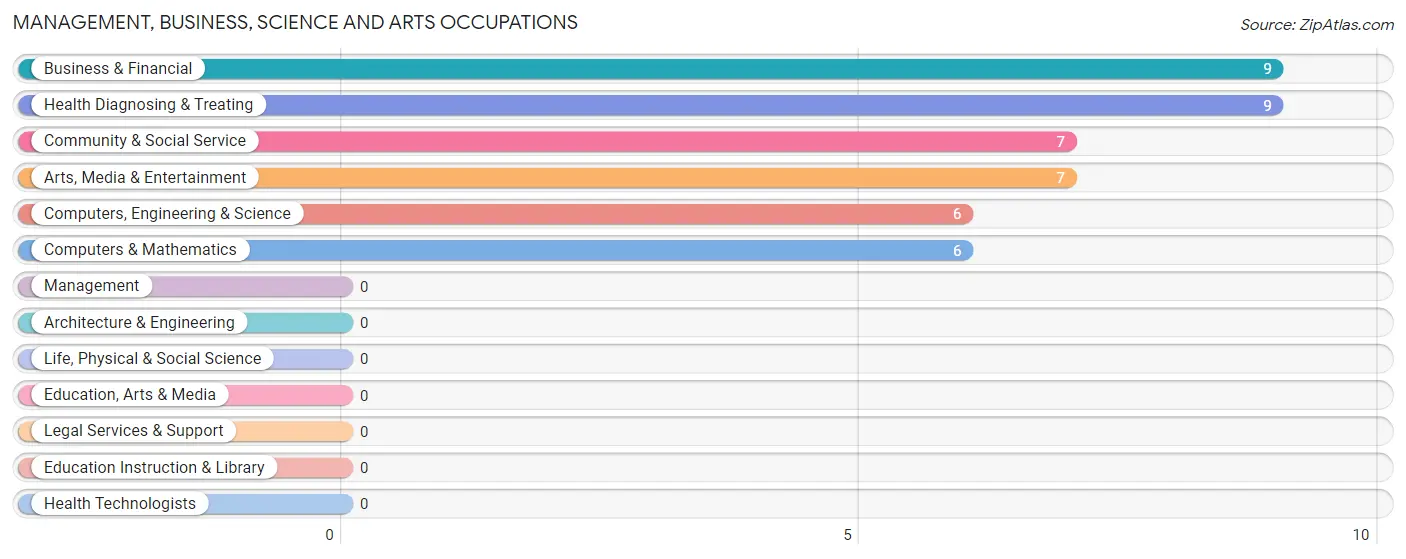
Management, Business, Science and Arts Occupations
The most common Management, Business, Science and Arts occupations in South Amana are Business & Financial (9 | 13.2%), Health Diagnosing & Treating (9 | 13.2%), Community & Social Service (7 | 10.3%), Arts, Media & Entertainment (7 | 10.3%), and Computers, Engineering & Science (6 | 8.8%).
Management, Business, Science and Arts Occupations by Sex
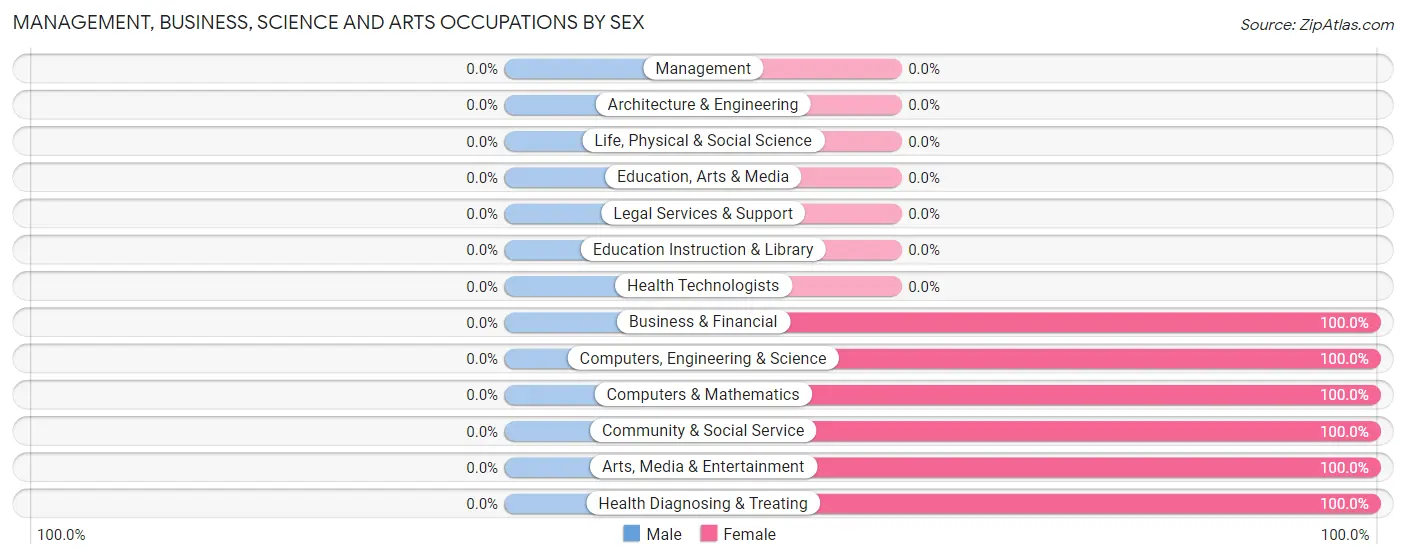
| Occupation | Male | Female |
| Management | 0 (0.0%) | 0 (0.0%) |
| Business & Financial | 0 (0.0%) | 9 (100.0%) |
| Computers, Engineering & Science | 0 (0.0%) | 6 (100.0%) |
| Computers & Mathematics | 0 (0.0%) | 6 (100.0%) |
| Architecture & Engineering | 0 (0.0%) | 0 (0.0%) |
| Life, Physical & Social Science | 0 (0.0%) | 0 (0.0%) |
| Community & Social Service | 0 (0.0%) | 7 (100.0%) |
| Education, Arts & Media | 0 (0.0%) | 0 (0.0%) |
| Legal Services & Support | 0 (0.0%) | 0 (0.0%) |
| Education Instruction & Library | 0 (0.0%) | 0 (0.0%) |
| Arts, Media & Entertainment | 0 (0.0%) | 7 (100.0%) |
| Health Diagnosing & Treating | 0 (0.0%) | 9 (100.0%) |
| Health Technologists | 0 (0.0%) | 0 (0.0%) |
| Total (Category) | 0 (0.0%) | 31 (100.0%) |
| Total (Overall) | 25 (36.8%) | 43 (63.2%) |
Services Occupations
The most common Services occupations in South Amana are Security & Protection (8 | 11.8%), and Firefighting & Prevention (8 | 11.8%).
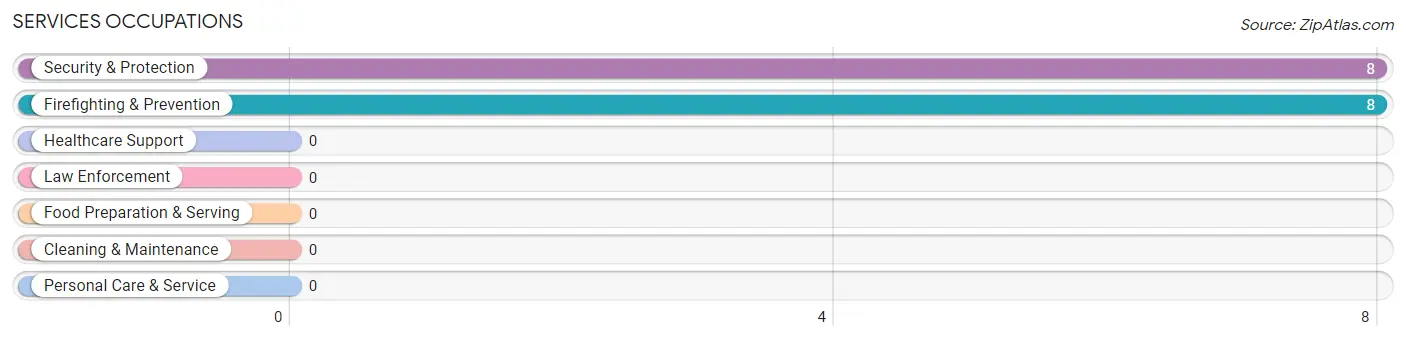
Services Occupations by Sex
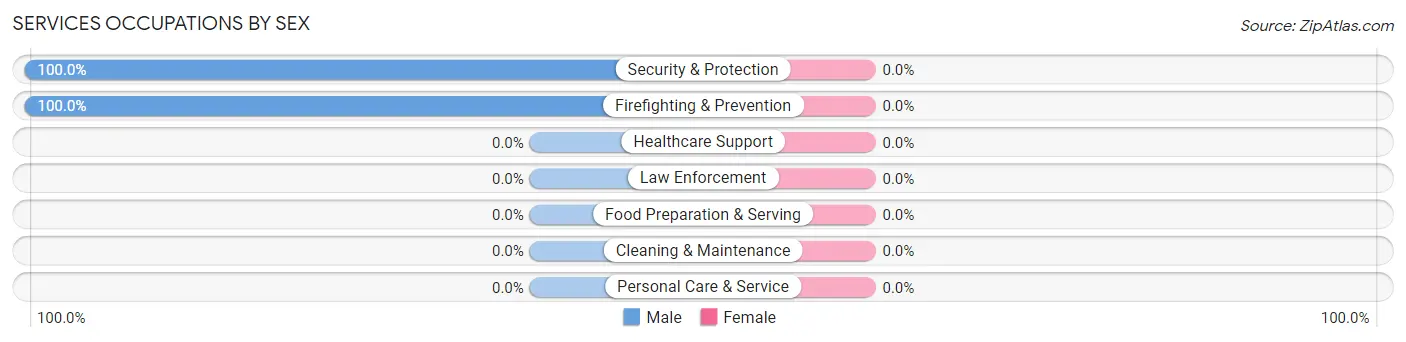
| Occupation | Male | Female |
| Healthcare Support | 0 (0.0%) | 0 (0.0%) |
| Security & Protection | 8 (100.0%) | 0 (0.0%) |
| Firefighting & Prevention | 8 (100.0%) | 0 (0.0%) |
| Law Enforcement | 0 (0.0%) | 0 (0.0%) |
| Food Preparation & Serving | 0 (0.0%) | 0 (0.0%) |
| Cleaning & Maintenance | 0 (0.0%) | 0 (0.0%) |
| Personal Care & Service | 0 (0.0%) | 0 (0.0%) |
| Total (Category) | 8 (100.0%) | 0 (0.0%) |
| Total (Overall) | 25 (36.8%) | 43 (63.2%) |
Sales and Office Occupations
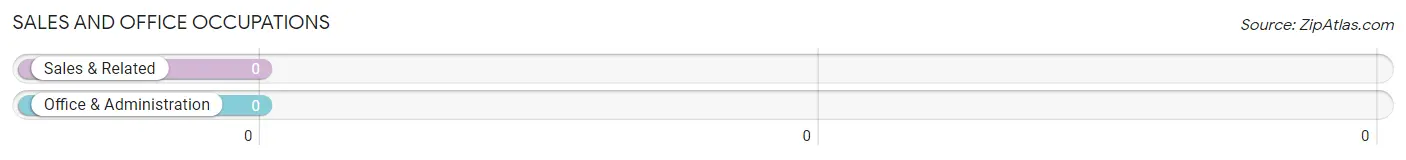
Sales and Office Occupations by Sex
| Occupation | Male | Female |
| Sales & Related | 0 (0.0%) | 0 (0.0%) |
| Office & Administration | 0 (0.0%) | 0 (0.0%) |
| Total (Category) | 0 (0.0%) | 0 (0.0%) |
| Total (Overall) | 25 (36.8%) | 43 (63.2%) |
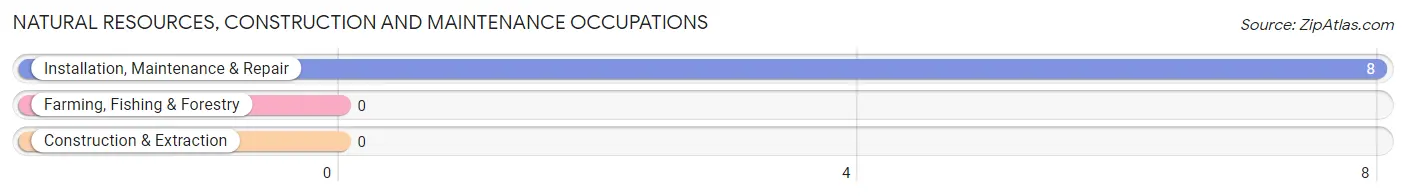
Natural Resources, Construction and Maintenance Occupations
The most common Natural Resources, Construction and Maintenance occupations in South Amana are , and Installation, Maintenance & Repair (8 | 11.8%).
Natural Resources, Construction and Maintenance Occupations by Sex
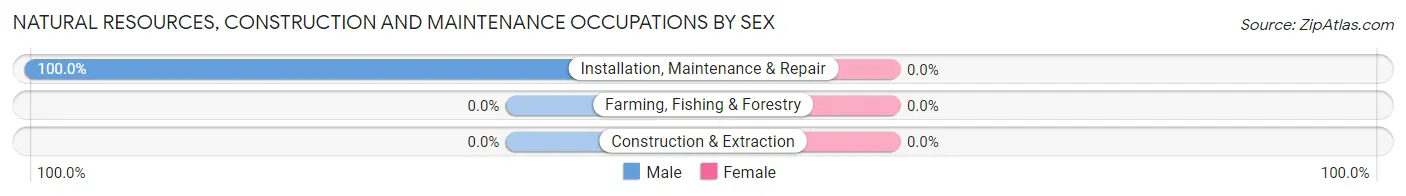
| Occupation | Male | Female |
| Farming, Fishing & Forestry | 0 (0.0%) | 0 (0.0%) |
| Construction & Extraction | 0 (0.0%) | 0 (0.0%) |
| Installation, Maintenance & Repair | 8 (100.0%) | 0 (0.0%) |
| Total (Category) | 8 (100.0%) | 0 (0.0%) |
| Total (Overall) | 25 (36.8%) | 43 (63.2%) |
Production, Transportation and Moving Occupations
The most common Production, Transportation and Moving occupations in South Amana are Material Moving (12 | 17.6%), and Production (9 | 13.2%).
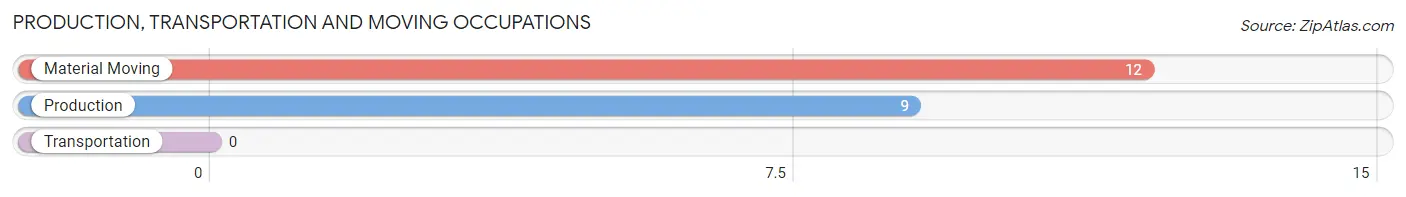
Production, Transportation and Moving Occupations by Sex
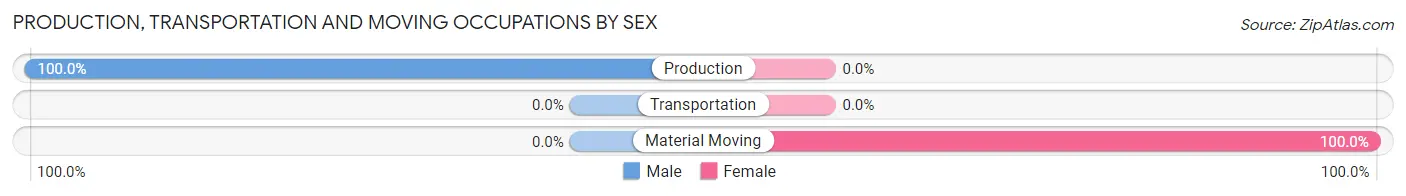
| Occupation | Male | Female |
| Production | 9 (100.0%) | 0 (0.0%) |
| Transportation | 0 (0.0%) | 0 (0.0%) |
| Material Moving | 0 (0.0%) | 12 (100.0%) |
| Total (Category) | 9 (42.9%) | 12 (57.1%) |
| Total (Overall) | 25 (36.8%) | 43 (63.2%) |
Employment Industries by Sex in South Amana
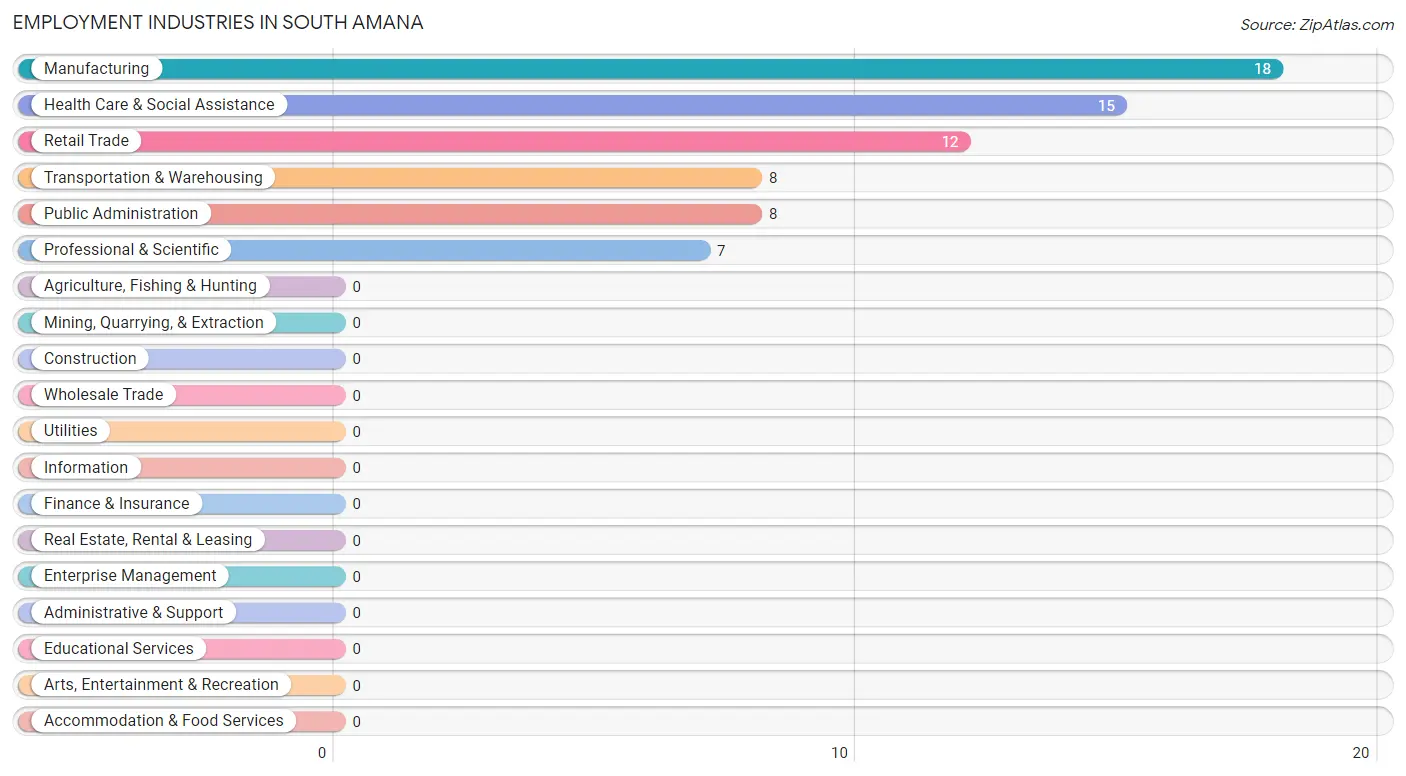
Employment Industries in South Amana
The major employment industries in South Amana include Manufacturing (18 | 26.5%), Health Care & Social Assistance (15 | 22.1%), Retail Trade (12 | 17.6%), Transportation & Warehousing (8 | 11.8%), and Public Administration (8 | 11.8%).
Employment Industries by Sex in South Amana
The South Amana industries that see more men than women are Transportation & Warehousing (100.0%), Public Administration (100.0%), and Manufacturing (50.0%), whereas the industries that tend to have a higher number of women are Retail Trade (100.0%), Professional & Scientific (100.0%), and Health Care & Social Assistance (100.0%).
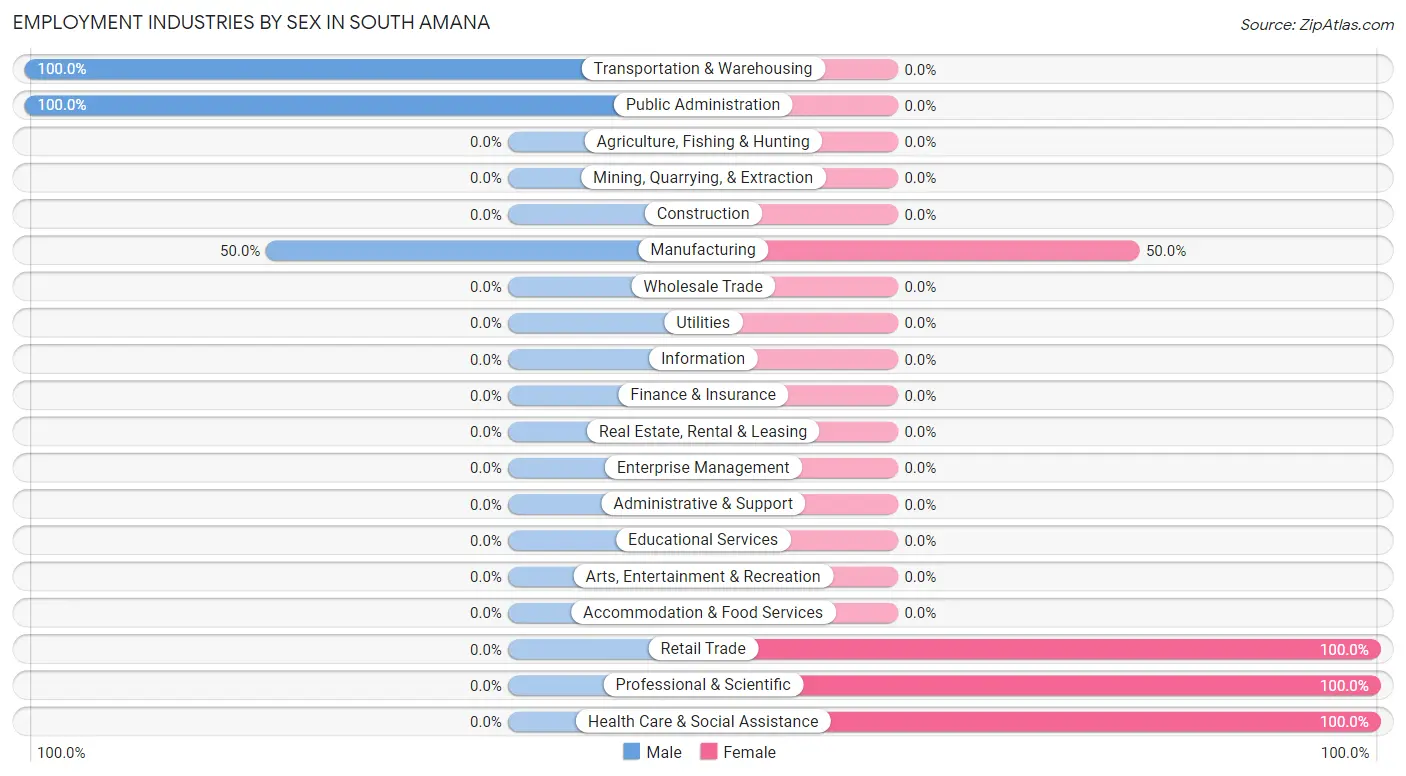
| Industry | Male | Female |
| Agriculture, Fishing & Hunting | 0 (0.0%) | 0 (0.0%) |
| Mining, Quarrying, & Extraction | 0 (0.0%) | 0 (0.0%) |
| Construction | 0 (0.0%) | 0 (0.0%) |
| Manufacturing | 9 (50.0%) | 9 (50.0%) |
| Wholesale Trade | 0 (0.0%) | 0 (0.0%) |
| Retail Trade | 0 (0.0%) | 12 (100.0%) |
| Transportation & Warehousing | 8 (100.0%) | 0 (0.0%) |
| Utilities | 0 (0.0%) | 0 (0.0%) |
| Information | 0 (0.0%) | 0 (0.0%) |
| Finance & Insurance | 0 (0.0%) | 0 (0.0%) |
| Real Estate, Rental & Leasing | 0 (0.0%) | 0 (0.0%) |
| Professional & Scientific | 0 (0.0%) | 7 (100.0%) |
| Enterprise Management | 0 (0.0%) | 0 (0.0%) |
| Administrative & Support | 0 (0.0%) | 0 (0.0%) |
| Educational Services | 0 (0.0%) | 0 (0.0%) |
| Health Care & Social Assistance | 0 (0.0%) | 15 (100.0%) |
| Arts, Entertainment & Recreation | 0 (0.0%) | 0 (0.0%) |
| Accommodation & Food Services | 0 (0.0%) | 0 (0.0%) |
| Public Administration | 8 (100.0%) | 0 (0.0%) |
| Total | 25 (36.8%) | 43 (63.2%) |
Education in South Amana
School Enrollment in South Amana
The most common levels of schooling among the 51 students in South Amana are middle school (21 | 41.2%), high school (19 | 37.2%), and nursery / preschool (11 | 21.6%).
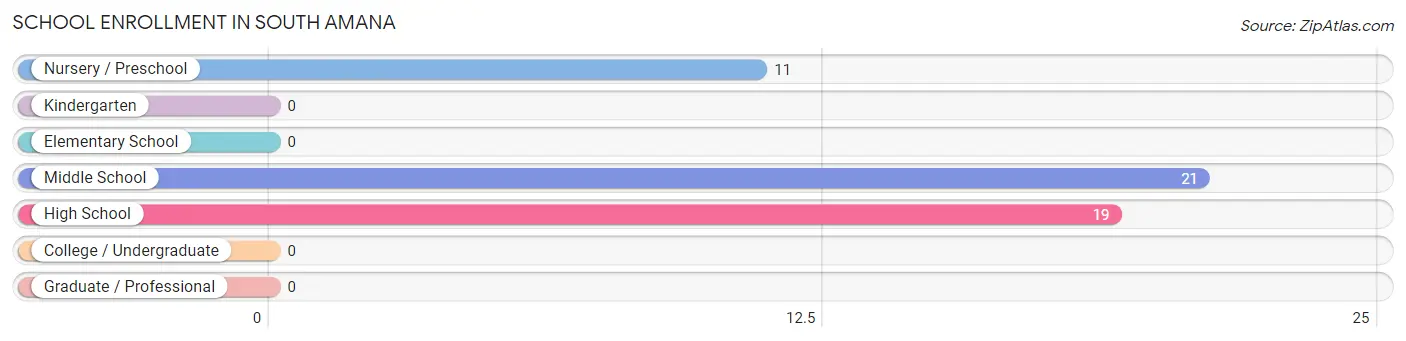
| School Level | # Students | % Students |
| Nursery / Preschool | 11 | 21.6% |
| Kindergarten | 0 | 0.0% |
| Elementary School | 0 | 0.0% |
| Middle School | 21 | 41.2% |
| High School | 19 | 37.2% |
| College / Undergraduate | 0 | 0.0% |
| Graduate / Professional | 0 | 0.0% |
| Total | 51 | 100.0% |
School Enrollment by Age by Funding Source in South Amana
Out of a total of 51 students who are enrolled in schools in South Amana, 16 (31.4%) attend a private institution, while the remaining 35 (68.6%) are enrolled in public schools. The age group of 3 to 4 year olds has the highest likelihood of being enrolled in private schools, with 11 (100.0% in the age bracket) enrolled. Conversely, the age group of 15 to 17 year olds has the lowest likelihood of being enrolled in a private school, with 19 (100.0% in the age bracket) attending a public institution.
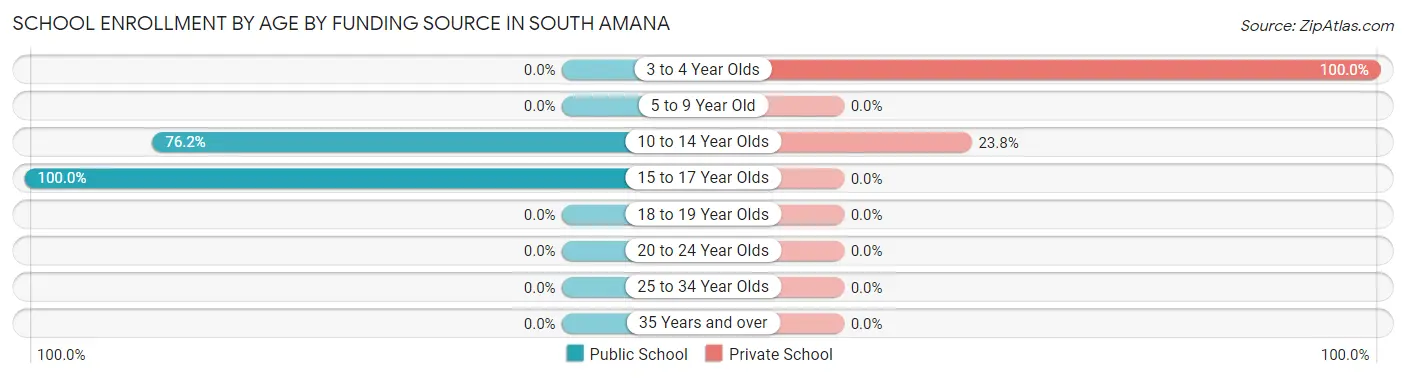
| Age Bracket | Public School | Private School |
| 3 to 4 Year Olds | 0 (0.0%) | 11 (100.0%) |
| 5 to 9 Year Old | 0 (0.0%) | 0 (0.0%) |
| 10 to 14 Year Olds | 16 (76.2%) | 5 (23.8%) |
| 15 to 17 Year Olds | 19 (100.0%) | 0 (0.0%) |
| 18 to 19 Year Olds | 0 (0.0%) | 0 (0.0%) |
| 20 to 24 Year Olds | 0 (0.0%) | 0 (0.0%) |
| 25 to 34 Year Olds | 0 (0.0%) | 0 (0.0%) |
| 35 Years and over | 0 (0.0%) | 0 (0.0%) |
| Total | 35 (68.6%) | 16 (31.4%) |
Educational Attainment by Field of Study in South Amana
Business (25 | 56.8%), and engineering (19 | 43.2%) are the most common fields of study among 44 individuals in South Amana who have obtained a bachelor's degree or higher.
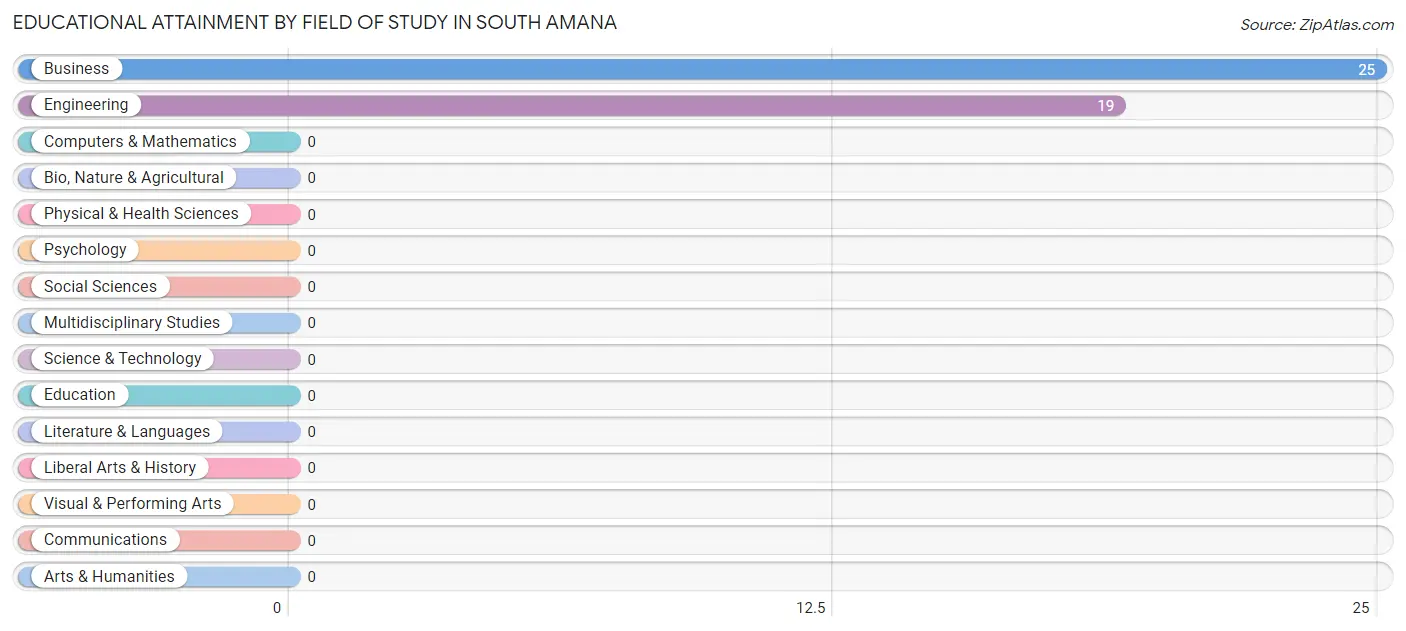
| Field of Study | # Graduates | % Graduates |
| Computers & Mathematics | 0 | 0.0% |
| Bio, Nature & Agricultural | 0 | 0.0% |
| Physical & Health Sciences | 0 | 0.0% |
| Psychology | 0 | 0.0% |
| Social Sciences | 0 | 0.0% |
| Engineering | 19 | 43.2% |
| Multidisciplinary Studies | 0 | 0.0% |
| Science & Technology | 0 | 0.0% |
| Business | 25 | 56.8% |
| Education | 0 | 0.0% |
| Literature & Languages | 0 | 0.0% |
| Liberal Arts & History | 0 | 0.0% |
| Visual & Performing Arts | 0 | 0.0% |
| Communications | 0 | 0.0% |
| Arts & Humanities | 0 | 0.0% |
| Total | 44 | 100.0% |
Transportation & Commute in South Amana
Vehicle Availability by Sex in South Amana
The most prevalent vehicle ownership categories in South Amana are males with 3 vehicles (17, accounting for 68.0%) and females with 3 vehicles (27, making up 39.5%).
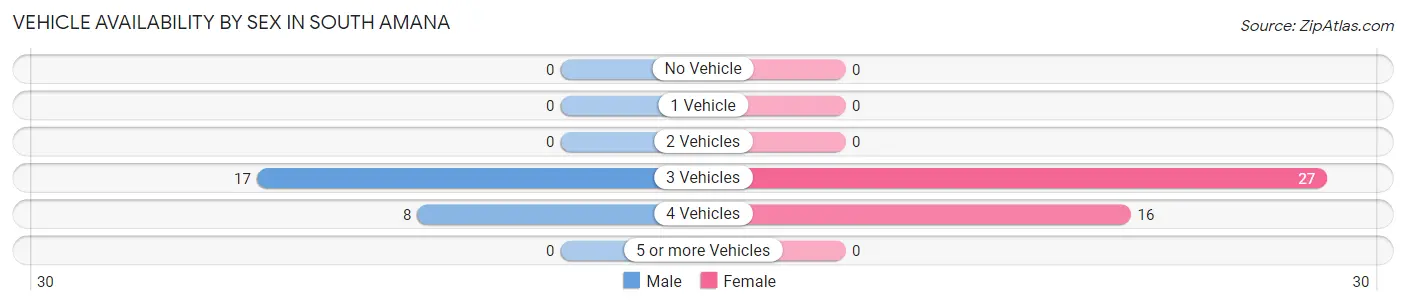
| Vehicles Available | Male | Female |
| No Vehicle | 0 (0.0%) | 0 (0.0%) |
| 1 Vehicle | 0 (0.0%) | 0 (0.0%) |
| 2 Vehicles | 0 (0.0%) | 0 (0.0%) |
| 3 Vehicles | 17 (68.0%) | 27 (62.8%) |
| 4 Vehicles | 8 (32.0%) | 16 (37.2%) |
| 5 or more Vehicles | 0 (0.0%) | 0 (0.0%) |
| Total | 25 (100.0%) | 43 (100.0%) |
Commute Time in South Amana
The most frequently occuring commute durations in South Amana are 35 to 39 minutes (17 commuters, 30.4%), 25 to 29 minutes (13 commuters, 23.2%), and 10 to 14 minutes (9 commuters, 16.1%).
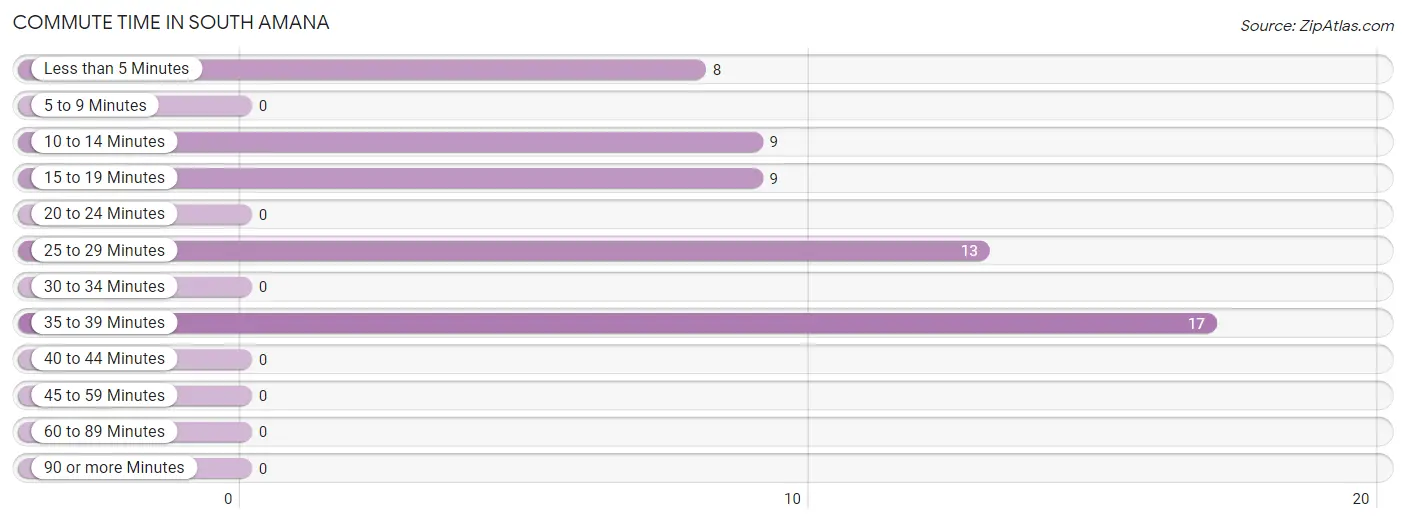
| Commute Time | # Commuters | % Commuters |
| Less than 5 Minutes | 8 | 14.3% |
| 5 to 9 Minutes | 0 | 0.0% |
| 10 to 14 Minutes | 9 | 16.1% |
| 15 to 19 Minutes | 9 | 16.1% |
| 20 to 24 Minutes | 0 | 0.0% |
| 25 to 29 Minutes | 13 | 23.2% |
| 30 to 34 Minutes | 0 | 0.0% |
| 35 to 39 Minutes | 17 | 30.4% |
| 40 to 44 Minutes | 0 | 0.0% |
| 45 to 59 Minutes | 0 | 0.0% |
| 60 to 89 Minutes | 0 | 0.0% |
| 90 or more Minutes | 0 | 0.0% |
Commute Time by Sex in South Amana
The most common commute times in South Amana are 10 to 14 minutes (9 commuters, 36.0%) for males and 25 to 29 minutes (13 commuters, 41.9%) for females.
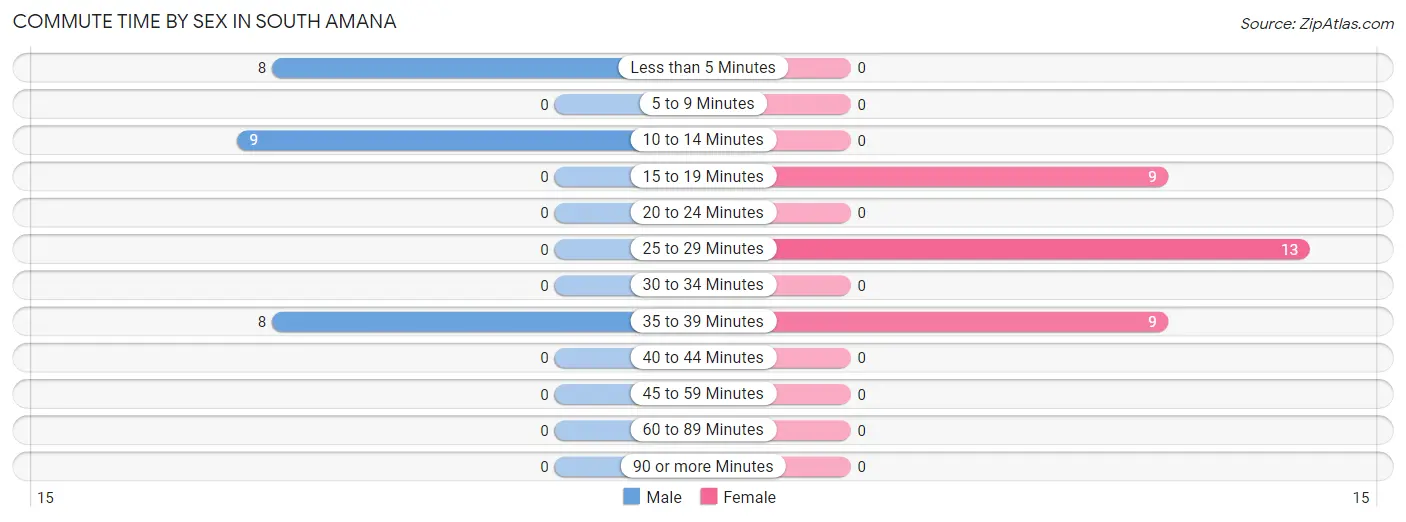
| Commute Time | Male | Female |
| Less than 5 Minutes | 8 (32.0%) | 0 (0.0%) |
| 5 to 9 Minutes | 0 (0.0%) | 0 (0.0%) |
| 10 to 14 Minutes | 9 (36.0%) | 0 (0.0%) |
| 15 to 19 Minutes | 0 (0.0%) | 9 (29.0%) |
| 20 to 24 Minutes | 0 (0.0%) | 0 (0.0%) |
| 25 to 29 Minutes | 0 (0.0%) | 13 (41.9%) |
| 30 to 34 Minutes | 0 (0.0%) | 0 (0.0%) |
| 35 to 39 Minutes | 8 (32.0%) | 9 (29.0%) |
| 40 to 44 Minutes | 0 (0.0%) | 0 (0.0%) |
| 45 to 59 Minutes | 0 (0.0%) | 0 (0.0%) |
| 60 to 89 Minutes | 0 (0.0%) | 0 (0.0%) |
| 90 or more Minutes | 0 (0.0%) | 0 (0.0%) |
Time of Departure to Work by Sex in South Amana
The most frequent times of departure to work in South Amana are 7:30 AM to 7:59 AM (9, 36.0%) for males and 7:00 AM to 7:29 AM (15, 48.4%) for females.
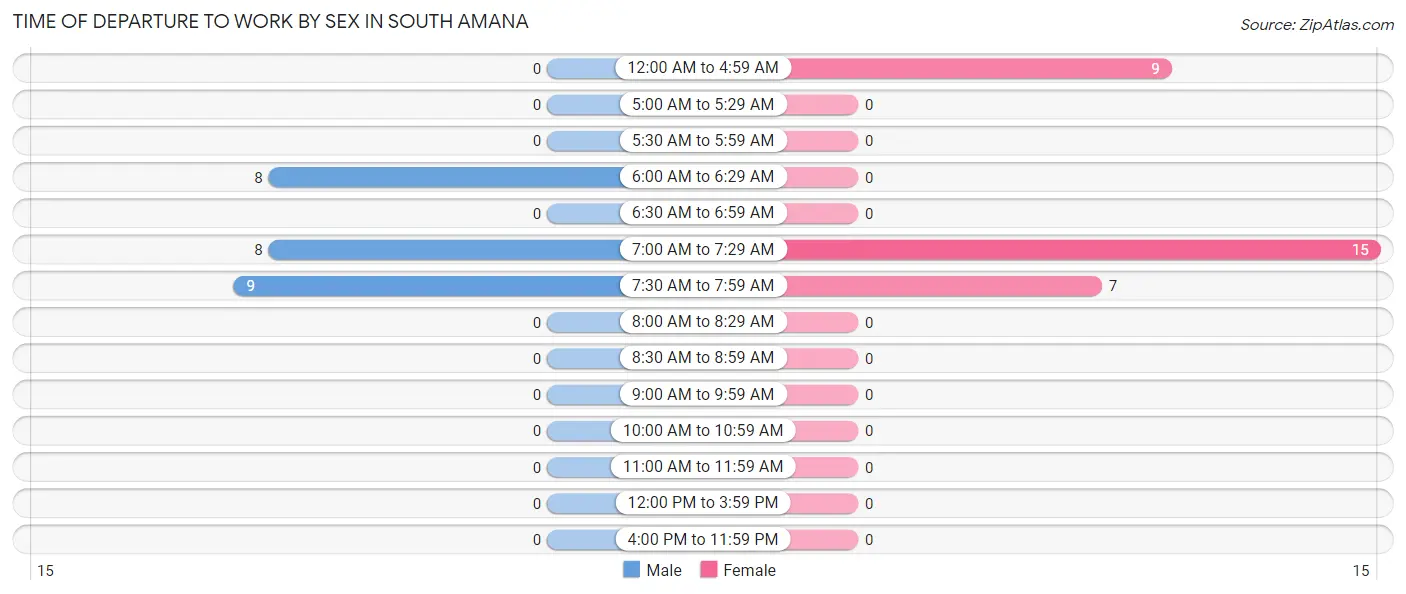
| Time of Departure | Male | Female |
| 12:00 AM to 4:59 AM | 0 (0.0%) | 9 (29.0%) |
| 5:00 AM to 5:29 AM | 0 (0.0%) | 0 (0.0%) |
| 5:30 AM to 5:59 AM | 0 (0.0%) | 0 (0.0%) |
| 6:00 AM to 6:29 AM | 8 (32.0%) | 0 (0.0%) |
| 6:30 AM to 6:59 AM | 0 (0.0%) | 0 (0.0%) |
| 7:00 AM to 7:29 AM | 8 (32.0%) | 15 (48.4%) |
| 7:30 AM to 7:59 AM | 9 (36.0%) | 7 (22.6%) |
| 8:00 AM to 8:29 AM | 0 (0.0%) | 0 (0.0%) |
| 8:30 AM to 8:59 AM | 0 (0.0%) | 0 (0.0%) |
| 9:00 AM to 9:59 AM | 0 (0.0%) | 0 (0.0%) |
| 10:00 AM to 10:59 AM | 0 (0.0%) | 0 (0.0%) |
| 11:00 AM to 11:59 AM | 0 (0.0%) | 0 (0.0%) |
| 12:00 PM to 3:59 PM | 0 (0.0%) | 0 (0.0%) |
| 4:00 PM to 11:59 PM | 0 (0.0%) | 0 (0.0%) |
| Total | 25 (100.0%) | 31 (100.0%) |
Housing Occupancy in South Amana
Occupancy by Ownership in South Amana
Of the total 47 dwellings in South Amana, owner-occupied units account for 47 (100.0%), while renter-occupied units make up 0 (0.0%).
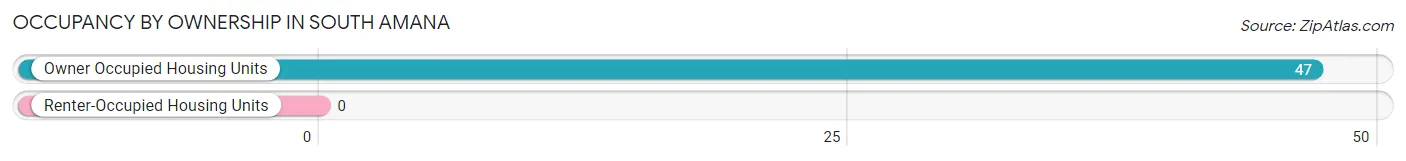
| Occupancy | # Housing Units | % Housing Units |
| Owner Occupied Housing Units | 47 | 100.0% |
| Renter-Occupied Housing Units | 0 | 0.0% |
| Total Occupied Housing Units | 47 | 100.0% |
Occupancy by Household Size in South Amana
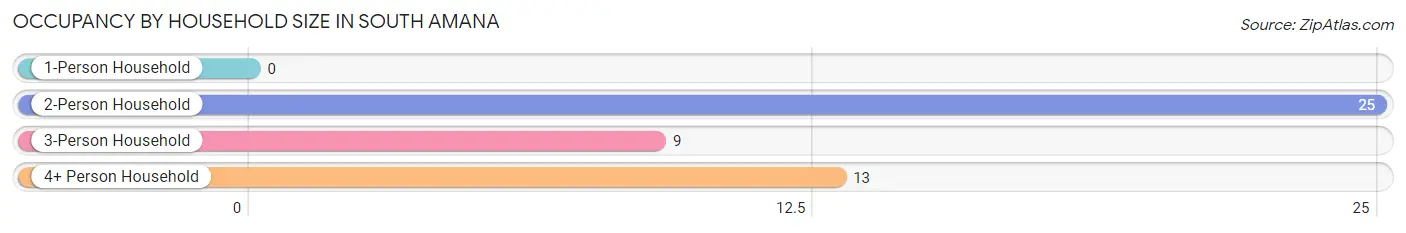
| Household Size | # Housing Units | % Housing Units |
| 1-Person Household | 0 | 0.0% |
| 2-Person Household | 25 | 53.2% |
| 3-Person Household | 9 | 19.2% |
| 4+ Person Household | 13 | 27.7% |
| Total Housing Units | 47 | 100.0% |
Occupancy by Ownership by Household Size in South Amana
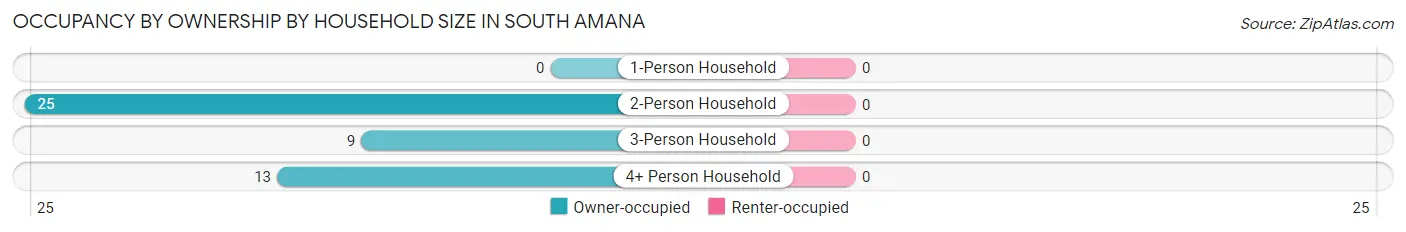
| Household Size | Owner-occupied | Renter-occupied |
| 1-Person Household | 0 (0.0%) | 0 (0.0%) |
| 2-Person Household | 25 (100.0%) | 0 (0.0%) |
| 3-Person Household | 9 (100.0%) | 0 (0.0%) |
| 4+ Person Household | 13 (100.0%) | 0 (0.0%) |
| Total Housing Units | 47 (100.0%) | 0 (0.0%) |
Occupancy by Educational Attainment in South Amana
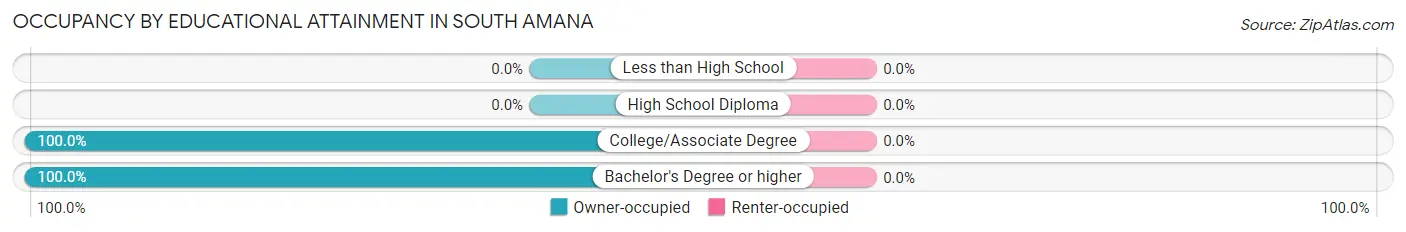
| Household Size | Owner-occupied | Renter-occupied |
| Less than High School | 0 (0.0%) | 0 (0.0%) |
| High School Diploma | 0 (0.0%) | 0 (0.0%) |
| College/Associate Degree | 22 (100.0%) | 0 (0.0%) |
| Bachelor's Degree or higher | 25 (100.0%) | 0 (0.0%) |
Occupancy by Age of Householder in South Amana
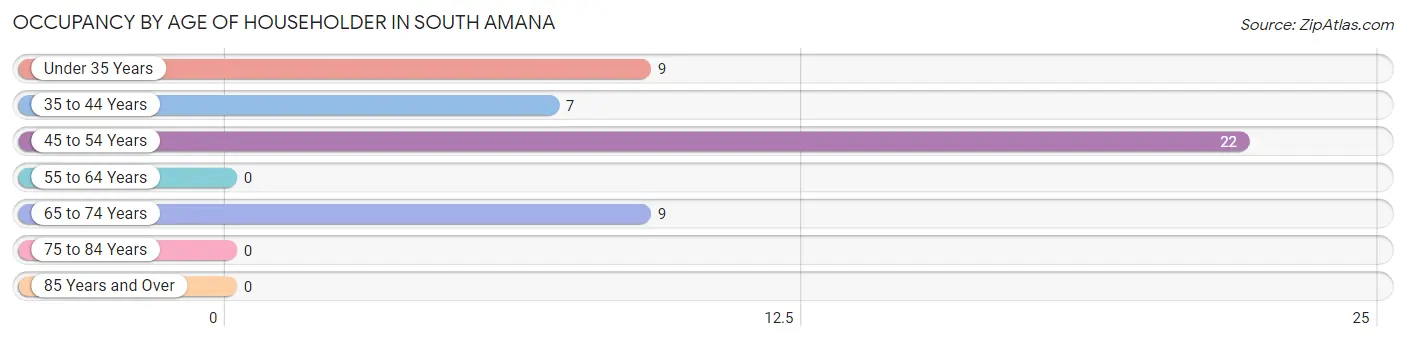
| Age Bracket | # Households | % Households |
| Under 35 Years | 9 | 19.2% |
| 35 to 44 Years | 7 | 14.9% |
| 45 to 54 Years | 22 | 46.8% |
| 55 to 64 Years | 0 | 0.0% |
| 65 to 74 Years | 9 | 19.2% |
| 75 to 84 Years | 0 | 0.0% |
| 85 Years and Over | 0 | 0.0% |
| Total | 47 | 100.0% |
Housing Finances in South Amana
Median Income by Occupancy in South Amana
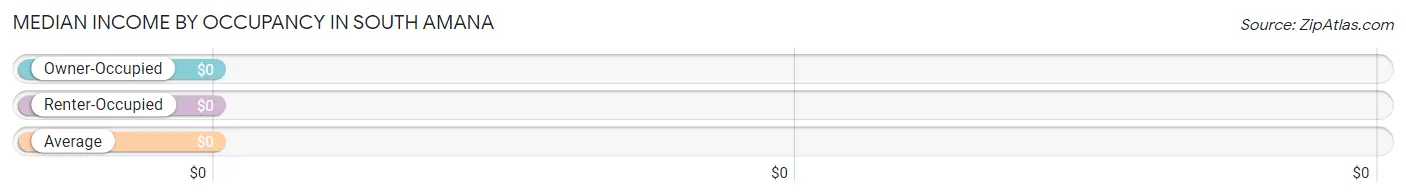
| Occupancy Type | # Households | Median Income |
| Owner-Occupied | 47 (100.0%) | $0 |
| Renter-Occupied | 0 (0.0%) | $0 |
| Average | 47 (100.0%) | $0 |
Occupancy by Householder Income Bracket in South Amana
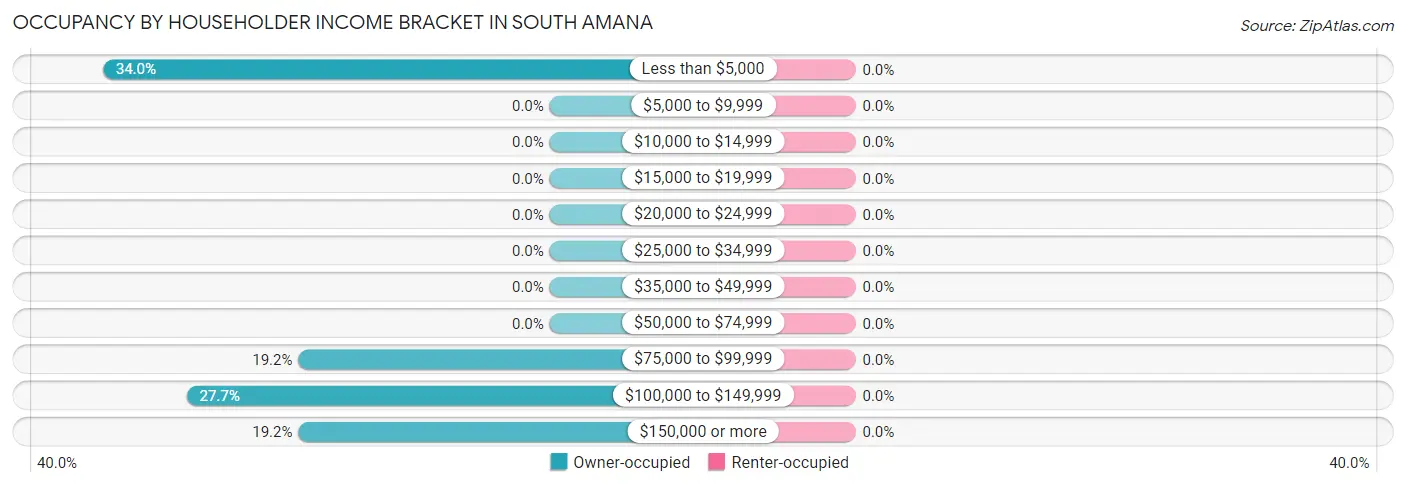
| Income Bracket | Owner-occupied | Renter-occupied |
| Less than $5,000 | 16 (34.0%) | 0 (0.0%) |
| $5,000 to $9,999 | 0 (0.0%) | 0 (0.0%) |
| $10,000 to $14,999 | 0 (0.0%) | 0 (0.0%) |
| $15,000 to $19,999 | 0 (0.0%) | 0 (0.0%) |
| $20,000 to $24,999 | 0 (0.0%) | 0 (0.0%) |
| $25,000 to $34,999 | 0 (0.0%) | 0 (0.0%) |
| $35,000 to $49,999 | 0 (0.0%) | 0 (0.0%) |
| $50,000 to $74,999 | 0 (0.0%) | 0 (0.0%) |
| $75,000 to $99,999 | 9 (19.2%) | 0 (0.0%) |
| $100,000 to $149,999 | 13 (27.7%) | 0 (0.0%) |
| $150,000 or more | 9 (19.2%) | 0 (0.0%) |
| Total | 47 (100.0%) | 0 (0.0%) |
Monthly Housing Cost Tiers in South Amana
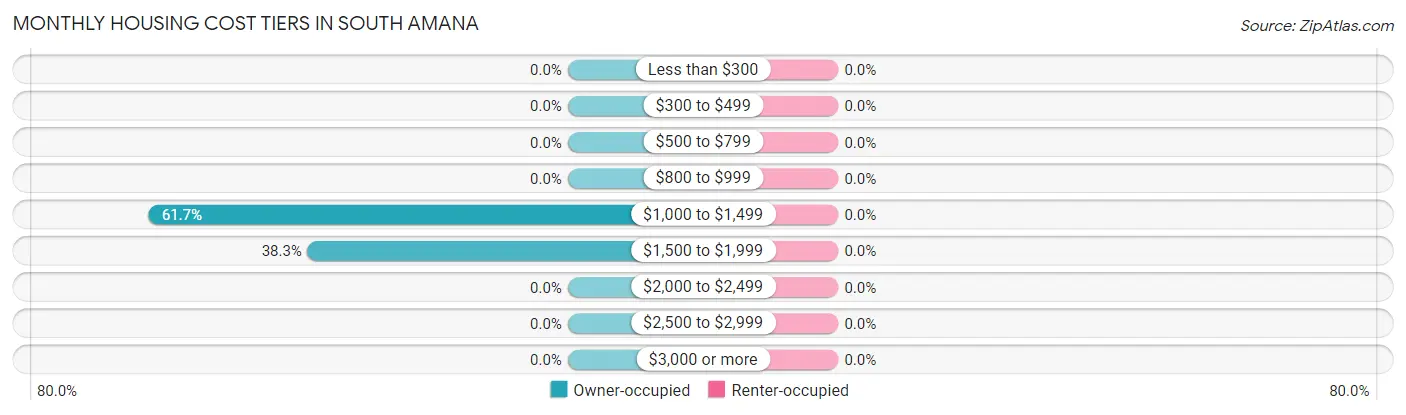
| Monthly Cost | Owner-occupied | Renter-occupied |
| Less than $300 | 0 (0.0%) | 0 (0.0%) |
| $300 to $499 | 0 (0.0%) | 0 (0.0%) |
| $500 to $799 | 0 (0.0%) | 0 (0.0%) |
| $800 to $999 | 0 (0.0%) | 0 (0.0%) |
| $1,000 to $1,499 | 29 (61.7%) | 0 (0.0%) |
| $1,500 to $1,999 | 18 (38.3%) | 0 (0.0%) |
| $2,000 to $2,499 | 0 (0.0%) | 0 (0.0%) |
| $2,500 to $2,999 | 0 (0.0%) | 0 (0.0%) |
| $3,000 or more | 0 (0.0%) | 0 (0.0%) |
| Total | 47 (100.0%) | 0 (0.0%) |
Physical Housing Characteristics in South Amana
Housing Structures in South Amana
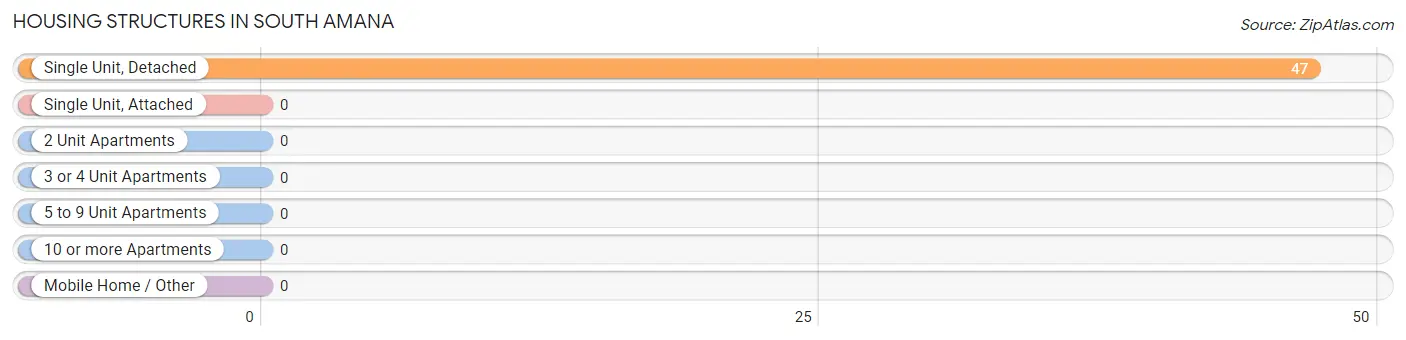
| Structure Type | # Housing Units | % Housing Units |
| Single Unit, Detached | 47 | 100.0% |
| Single Unit, Attached | 0 | 0.0% |
| 2 Unit Apartments | 0 | 0.0% |
| 3 or 4 Unit Apartments | 0 | 0.0% |
| 5 to 9 Unit Apartments | 0 | 0.0% |
| 10 or more Apartments | 0 | 0.0% |
| Mobile Home / Other | 0 | 0.0% |
| Total | 47 | 100.0% |
Housing Structures by Occupancy in South Amana
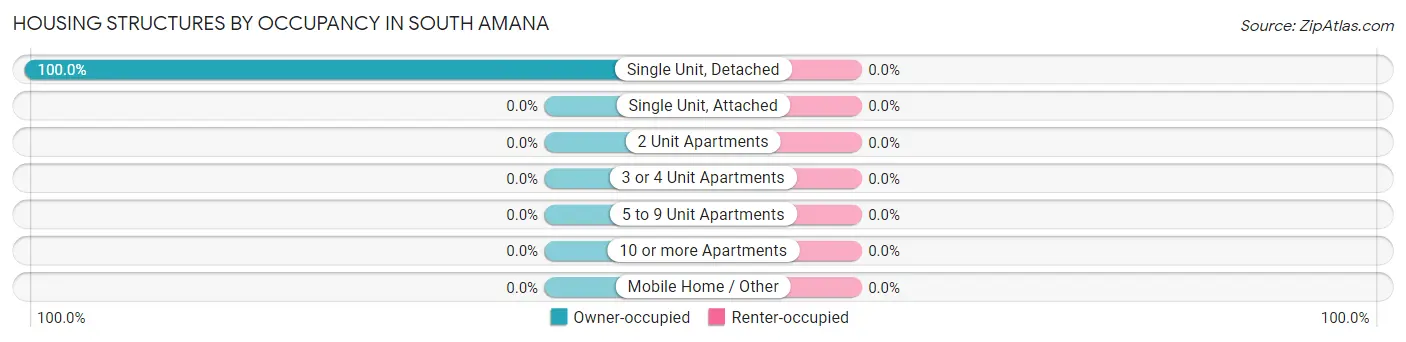
| Structure Type | Owner-occupied | Renter-occupied |
| Single Unit, Detached | 47 (100.0%) | 0 (0.0%) |
| Single Unit, Attached | 0 (0.0%) | 0 (0.0%) |
| 2 Unit Apartments | 0 (0.0%) | 0 (0.0%) |
| 3 or 4 Unit Apartments | 0 (0.0%) | 0 (0.0%) |
| 5 to 9 Unit Apartments | 0 (0.0%) | 0 (0.0%) |
| 10 or more Apartments | 0 (0.0%) | 0 (0.0%) |
| Mobile Home / Other | 0 (0.0%) | 0 (0.0%) |
| Total | 47 (100.0%) | 0 (0.0%) |
Housing Structures by Number of Rooms in South Amana
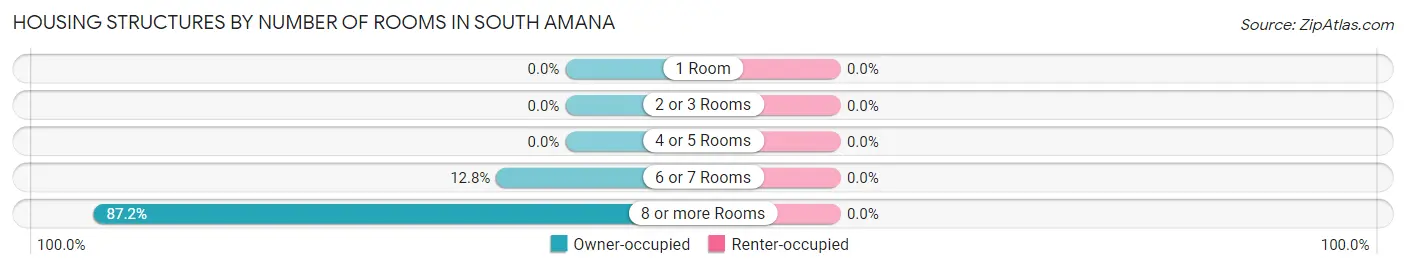
| Number of Rooms | Owner-occupied | Renter-occupied |
| 1 Room | 0 (0.0%) | 0 (0.0%) |
| 2 or 3 Rooms | 0 (0.0%) | 0 (0.0%) |
| 4 or 5 Rooms | 0 (0.0%) | 0 (0.0%) |
| 6 or 7 Rooms | 6 (12.8%) | 0 (0.0%) |
| 8 or more Rooms | 41 (87.2%) | 0 (0.0%) |
| Total | 47 (100.0%) | 0 (0.0%) |
Housing Structure by Heating Type in South Amana
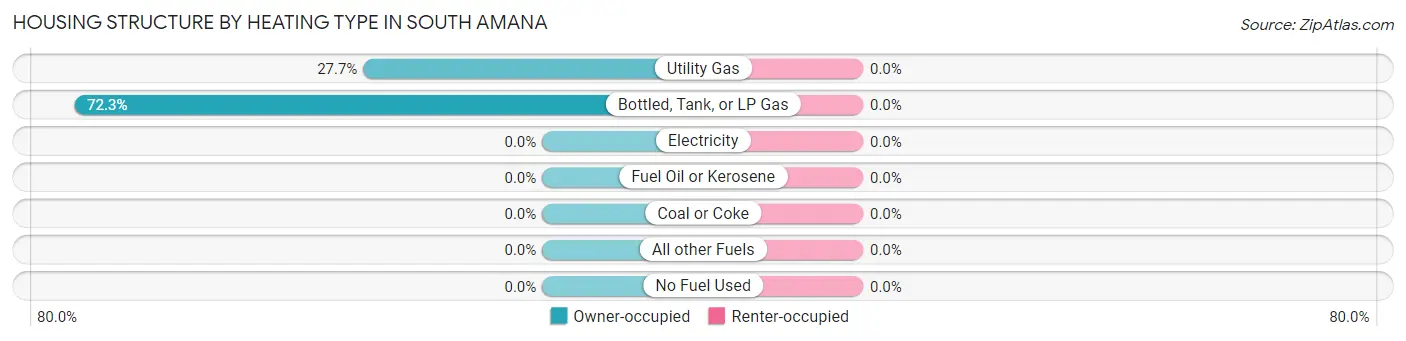
| Heating Type | Owner-occupied | Renter-occupied |
| Utility Gas | 13 (27.7%) | 0 (0.0%) |
| Bottled, Tank, or LP Gas | 34 (72.3%) | 0 (0.0%) |
| Electricity | 0 (0.0%) | 0 (0.0%) |
| Fuel Oil or Kerosene | 0 (0.0%) | 0 (0.0%) |
| Coal or Coke | 0 (0.0%) | 0 (0.0%) |
| All other Fuels | 0 (0.0%) | 0 (0.0%) |
| No Fuel Used | 0 (0.0%) | 0 (0.0%) |
| Total | 47 (100.0%) | 0 (0.0%) |
Household Vehicle Usage in South Amana
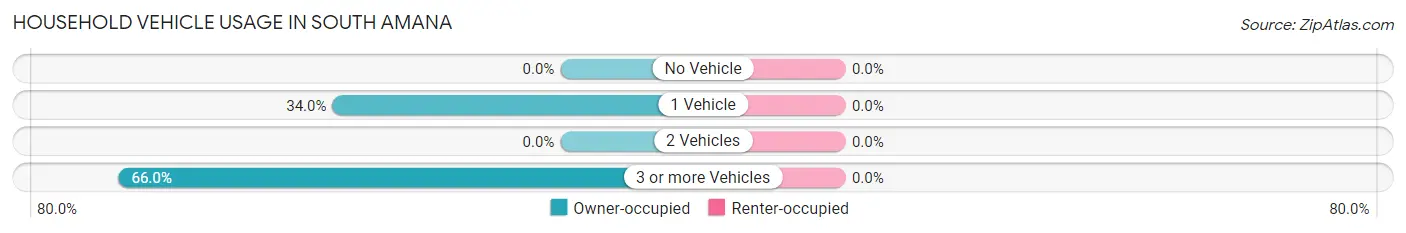
| Vehicles per Household | Owner-occupied | Renter-occupied |
| No Vehicle | 0 (0.0%) | 0 (0.0%) |
| 1 Vehicle | 16 (34.0%) | 0 (0.0%) |
| 2 Vehicles | 0 (0.0%) | 0 (0.0%) |
| 3 or more Vehicles | 31 (66.0%) | 0 (0.0%) |
| Total | 47 (100.0%) | 0 (0.0%) |
Real Estate & Mortgages in South Amana
Real Estate and Mortgage Overview in South Amana
| Characteristic | Without Mortgage | With Mortgage |
| Housing Units | 16 | 31 |
| Median Property Value | - | - |
| Median Household Income | - | - |
| Monthly Housing Costs | - | - |
| Real Estate Taxes | - | - |
Property Value by Mortgage Status in South Amana
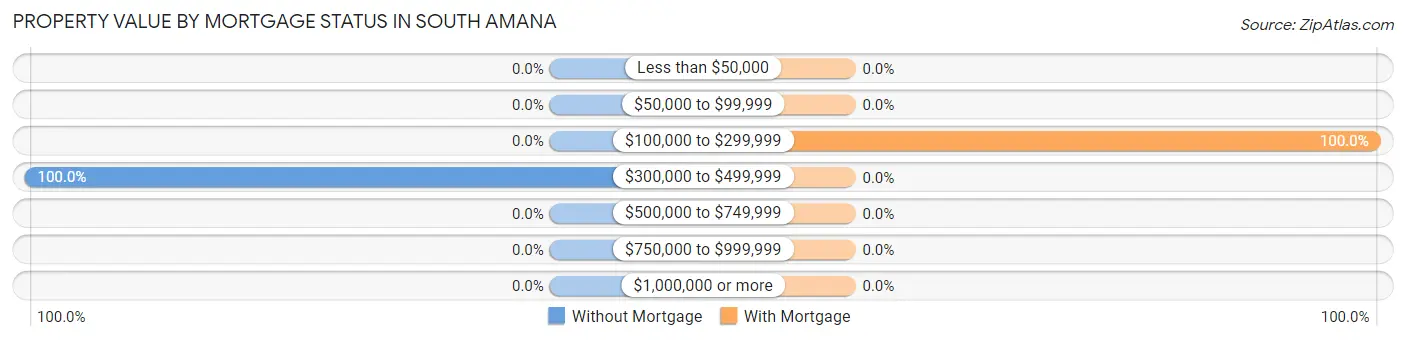
| Property Value | Without Mortgage | With Mortgage |
| Less than $50,000 | 0 (0.0%) | 0 (0.0%) |
| $50,000 to $99,999 | 0 (0.0%) | 0 (0.0%) |
| $100,000 to $299,999 | 0 (0.0%) | 31 (100.0%) |
| $300,000 to $499,999 | 16 (100.0%) | 0 (0.0%) |
| $500,000 to $749,999 | 0 (0.0%) | 0 (0.0%) |
| $750,000 to $999,999 | 0 (0.0%) | 0 (0.0%) |
| $1,000,000 or more | 0 (0.0%) | 0 (0.0%) |
| Total | 16 (100.0%) | 31 (100.0%) |
Household Income by Mortgage Status in South Amana
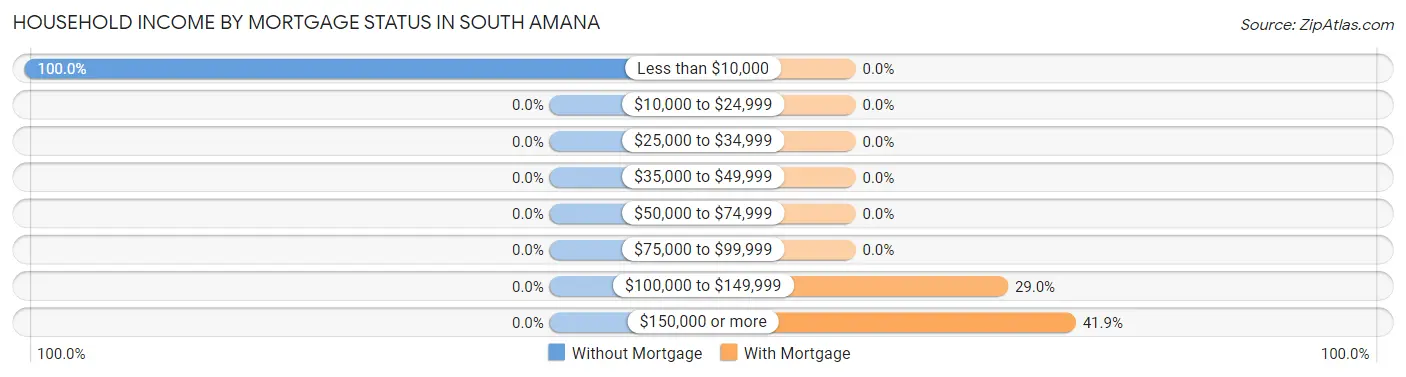
| Household Income | Without Mortgage | With Mortgage |
| Less than $10,000 | 16 (100.0%) | 0 (0.0%) |
| $10,000 to $24,999 | 0 (0.0%) | 0 (0.0%) |
| $25,000 to $34,999 | 0 (0.0%) | 0 (0.0%) |
| $35,000 to $49,999 | 0 (0.0%) | 0 (0.0%) |
| $50,000 to $74,999 | 0 (0.0%) | 0 (0.0%) |
| $75,000 to $99,999 | 0 (0.0%) | 0 (0.0%) |
| $100,000 to $149,999 | 0 (0.0%) | 9 (29.0%) |
| $150,000 or more | 0 (0.0%) | 13 (41.9%) |
| Total | 16 (100.0%) | 31 (100.0%) |
Property Value to Household Income Ratio in South Amana
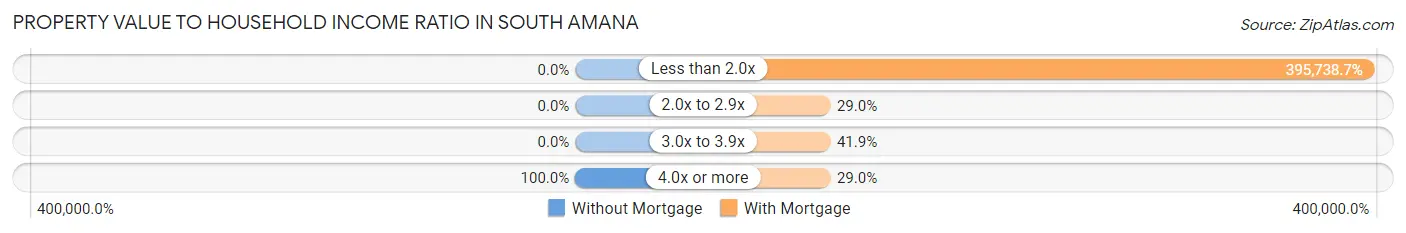
| Value-to-Income Ratio | Without Mortgage | With Mortgage |
| Less than 2.0x | 0 (0.0%) | 122,679 (395,738.7%) |
| 2.0x to 2.9x | 0 (0.0%) | 9 (29.0%) |
| 3.0x to 3.9x | 0 (0.0%) | 13 (41.9%) |
| 4.0x or more | 16 (100.0%) | 9 (29.0%) |
| Total | 16 (100.0%) | 31 (100.0%) |
Real Estate Taxes by Mortgage Status in South Amana
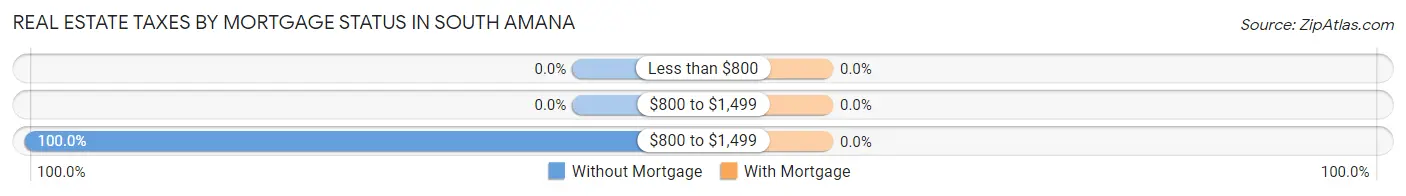
| Property Taxes | Without Mortgage | With Mortgage |
| Less than $800 | 0 (0.0%) | 0 (0.0%) |
| $800 to $1,499 | 0 (0.0%) | 0 (0.0%) |
| $800 to $1,499 | 16 (100.0%) | 0 (0.0%) |
| Total | 16 (100.0%) | 31 (100.0%) |
Health & Disability in South Amana
Health Insurance Coverage by Age in South Amana
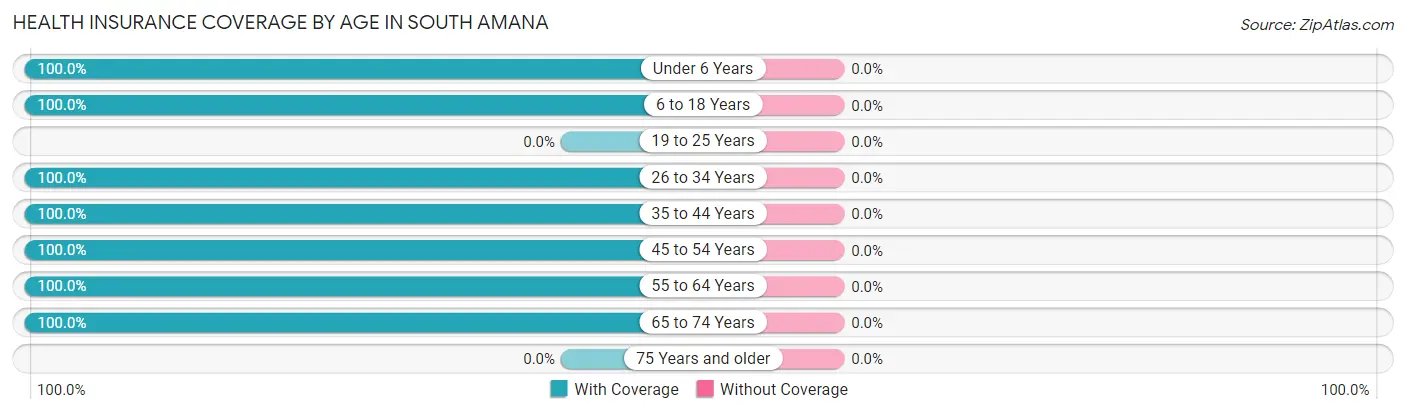
| Age Bracket | With Coverage | Without Coverage |
| Under 6 Years | 11 (100.0%) | 0 (0.0%) |
| 6 to 18 Years | 40 (100.0%) | 0 (0.0%) |
| 19 to 25 Years | 0 (0.0%) | 0 (0.0%) |
| 26 to 34 Years | 17 (100.0%) | 0 (0.0%) |
| 35 to 44 Years | 24 (100.0%) | 0 (0.0%) |
| 45 to 54 Years | 22 (100.0%) | 0 (0.0%) |
| 55 to 64 Years | 28 (100.0%) | 0 (0.0%) |
| 65 to 74 Years | 9 (100.0%) | 0 (0.0%) |
| 75 Years and older | 0 (0.0%) | 0 (0.0%) |
| Total | 151 (100.0%) | 0 (0.0%) |
Health Insurance Coverage by Citizenship Status in South Amana
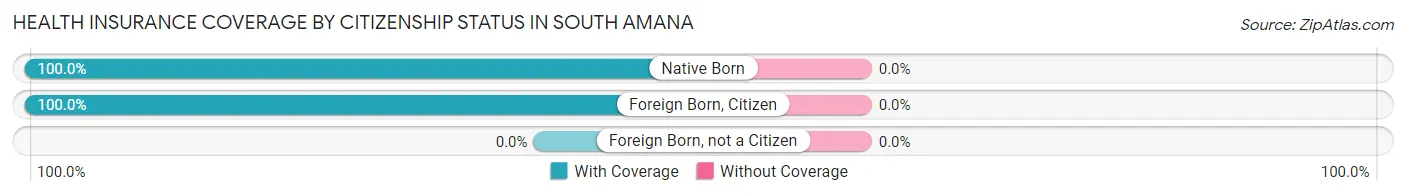
| Citizenship Status | With Coverage | Without Coverage |
| Native Born | 11 (100.0%) | 0 (0.0%) |
| Foreign Born, Citizen | 40 (100.0%) | 0 (0.0%) |
| Foreign Born, not a Citizen | 0 (0.0%) | 0 (0.0%) |
Health Insurance Coverage by Household Income in South Amana
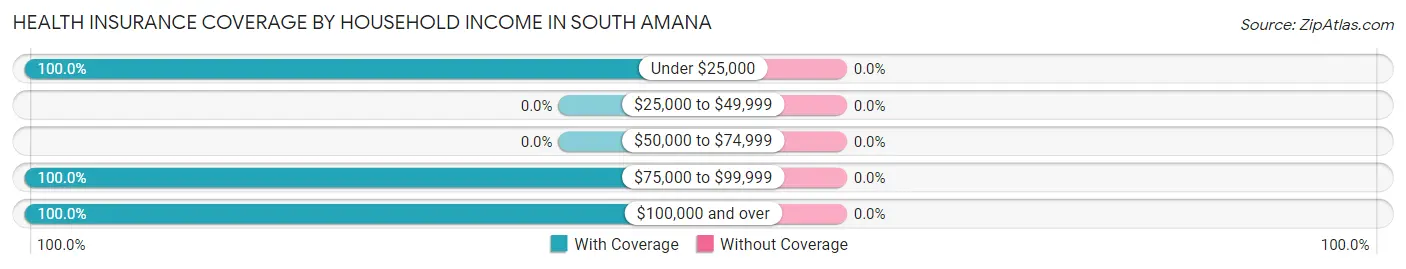
| Household Income | With Coverage | Without Coverage |
| Under $25,000 | 35 (100.0%) | 0 (0.0%) |
| $25,000 to $49,999 | 0 (0.0%) | 0 (0.0%) |
| $50,000 to $74,999 | 0 (0.0%) | 0 (0.0%) |
| $75,000 to $99,999 | 18 (100.0%) | 0 (0.0%) |
| $100,000 and over | 98 (100.0%) | 0 (0.0%) |
Public vs Private Health Insurance Coverage by Age in South Amana
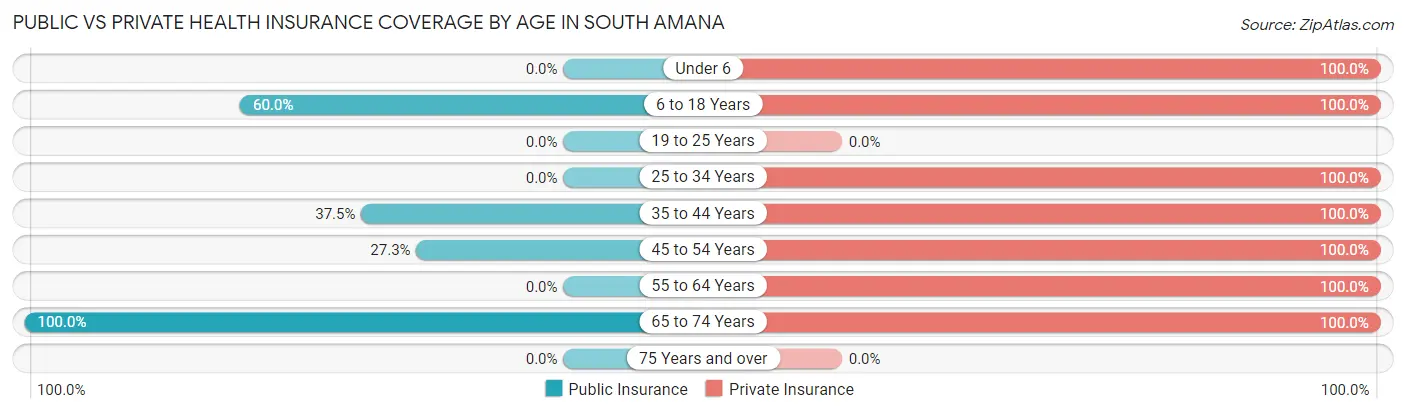
| Age Bracket | Public Insurance | Private Insurance |
| Under 6 | 0 (0.0%) | 11 (100.0%) |
| 6 to 18 Years | 24 (60.0%) | 40 (100.0%) |
| 19 to 25 Years | 0 (0.0%) | 0 (0.0%) |
| 25 to 34 Years | 0 (0.0%) | 17 (100.0%) |
| 35 to 44 Years | 9 (37.5%) | 24 (100.0%) |
| 45 to 54 Years | 6 (27.3%) | 22 (100.0%) |
| 55 to 64 Years | 0 (0.0%) | 28 (100.0%) |
| 65 to 74 Years | 9 (100.0%) | 9 (100.0%) |
| 75 Years and over | 0 (0.0%) | 0 (0.0%) |
| Total | 48 (31.8%) | 151 (100.0%) |
Disability Status by Sex by Age in South Amana
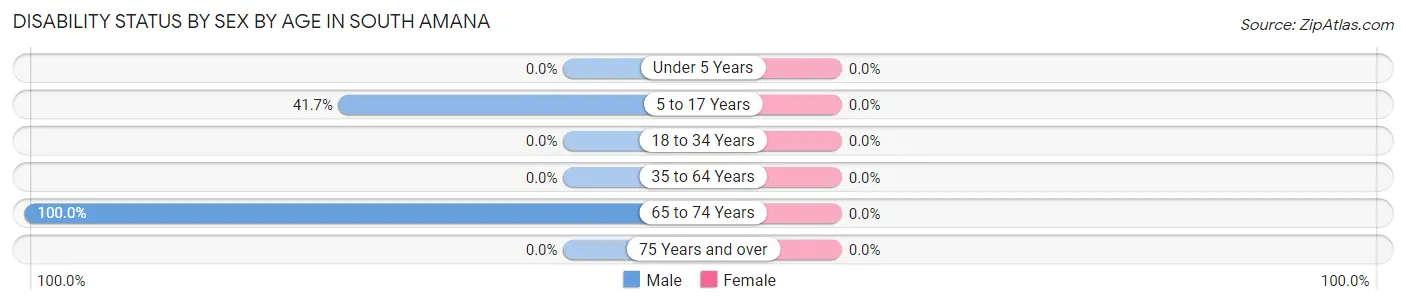
| Age Bracket | Male | Female |
| Under 5 Years | 0 (0.0%) | 0 (0.0%) |
| 5 to 17 Years | 5 (41.7%) | 0 (0.0%) |
| 18 to 34 Years | 0 (0.0%) | 0 (0.0%) |
| 35 to 64 Years | 0 (0.0%) | 0 (0.0%) |
| 65 to 74 Years | 9 (100.0%) | 0 (0.0%) |
| 75 Years and over | 0 (0.0%) | 0 (0.0%) |
Disability Class by Sex by Age in South Amana
Disability Class: Hearing Difficulty
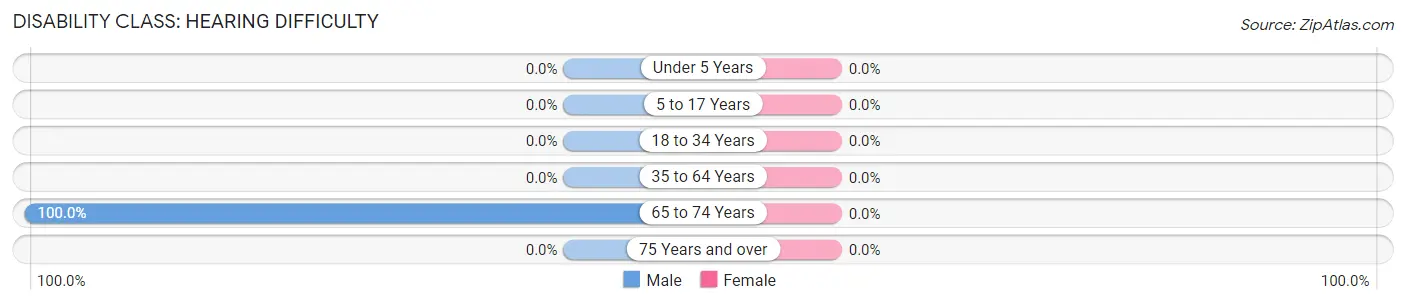
| Age Bracket | Male | Female |
| Under 5 Years | 0 (0.0%) | 0 (0.0%) |
| 5 to 17 Years | 0 (0.0%) | 0 (0.0%) |
| 18 to 34 Years | 0 (0.0%) | 0 (0.0%) |
| 35 to 64 Years | 0 (0.0%) | 0 (0.0%) |
| 65 to 74 Years | 9 (100.0%) | 0 (0.0%) |
| 75 Years and over | 0 (0.0%) | 0 (0.0%) |
Disability Class: Vision Difficulty
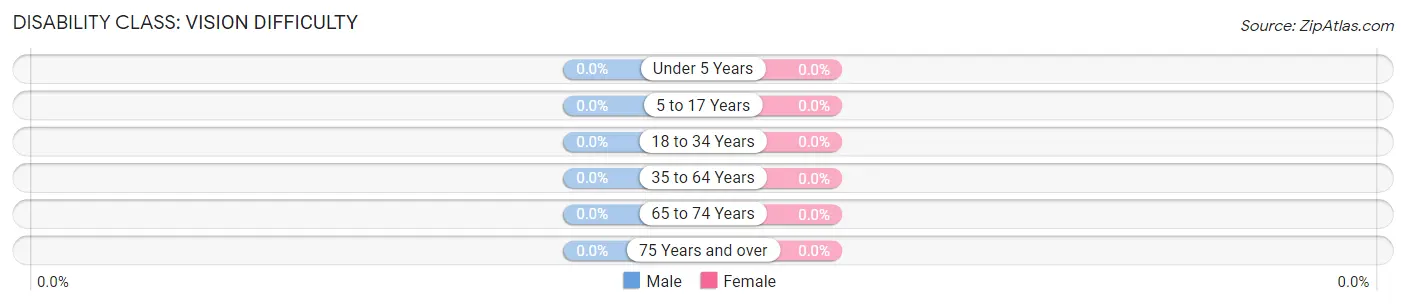
| Age Bracket | Male | Female |
| Under 5 Years | 0 (0.0%) | 0 (0.0%) |
| 5 to 17 Years | 0 (0.0%) | 0 (0.0%) |
| 18 to 34 Years | 0 (0.0%) | 0 (0.0%) |
| 35 to 64 Years | 0 (0.0%) | 0 (0.0%) |
| 65 to 74 Years | 0 (0.0%) | 0 (0.0%) |
| 75 Years and over | 0 (0.0%) | 0 (0.0%) |
Disability Class: Cognitive Difficulty
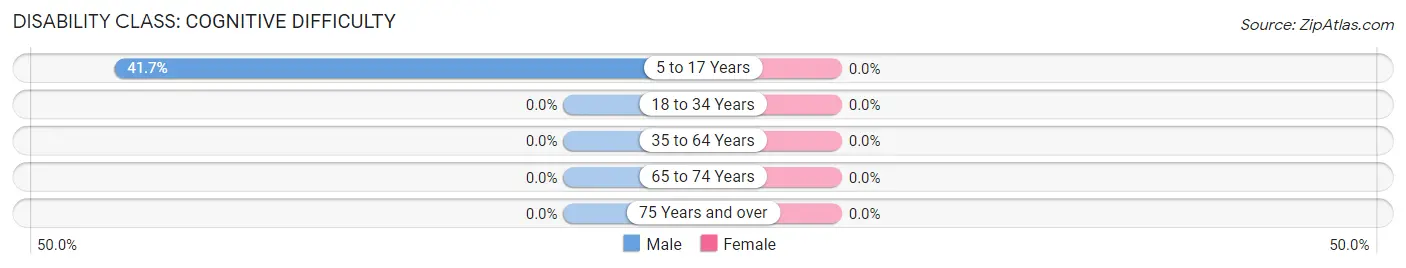
| Age Bracket | Male | Female |
| 5 to 17 Years | 5 (41.7%) | 0 (0.0%) |
| 18 to 34 Years | 0 (0.0%) | 0 (0.0%) |
| 35 to 64 Years | 0 (0.0%) | 0 (0.0%) |
| 65 to 74 Years | 0 (0.0%) | 0 (0.0%) |
| 75 Years and over | 0 (0.0%) | 0 (0.0%) |
Disability Class: Ambulatory Difficulty
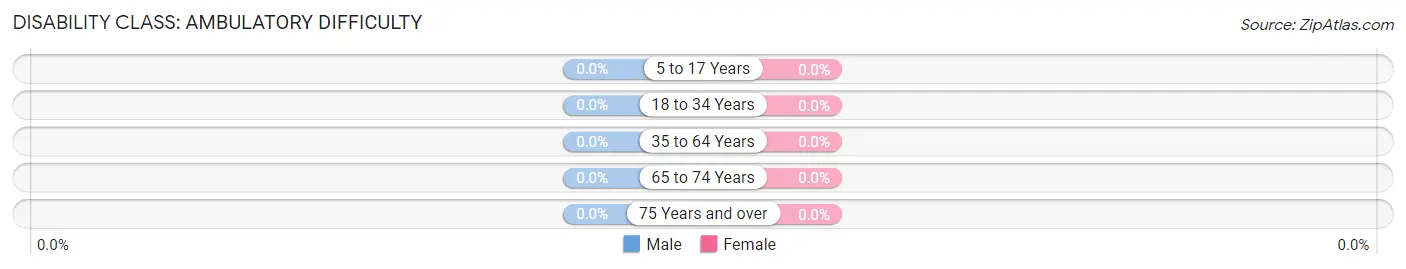
| Age Bracket | Male | Female |
| 5 to 17 Years | 0 (0.0%) | 0 (0.0%) |
| 18 to 34 Years | 0 (0.0%) | 0 (0.0%) |
| 35 to 64 Years | 0 (0.0%) | 0 (0.0%) |
| 65 to 74 Years | 0 (0.0%) | 0 (0.0%) |
| 75 Years and over | 0 (0.0%) | 0 (0.0%) |
Disability Class: Self-Care Difficulty
| Age Bracket | Male | Female |
| 5 to 17 Years | 0 (0.0%) | 0 (0.0%) |
| 18 to 34 Years | 0 (0.0%) | 0 (0.0%) |
| 35 to 64 Years | 0 (0.0%) | 0 (0.0%) |
| 65 to 74 Years | 0 (0.0%) | 0 (0.0%) |
| 75 Years and over | 0 (0.0%) | 0 (0.0%) |
Technology Access in South Amana
Computing Device Access in South Amana
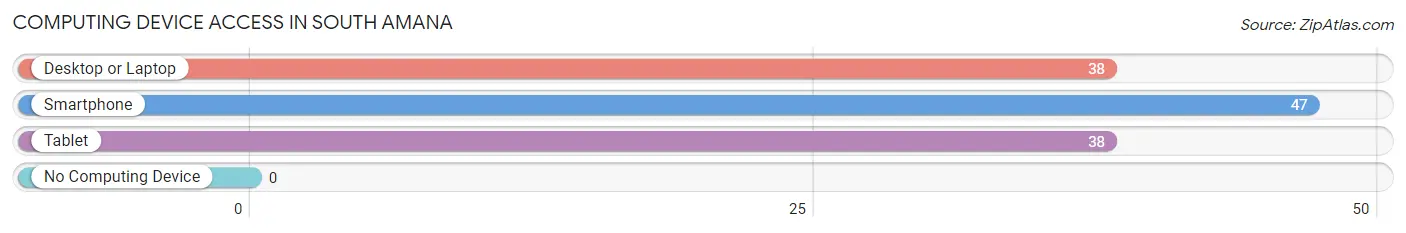
| Device Type | # Households | % Households |
| Desktop or Laptop | 38 | 80.8% |
| Smartphone | 47 | 100.0% |
| Tablet | 38 | 80.8% |
| No Computing Device | 0 | 0.0% |
| Total | 47 | 100.0% |
Internet Access in South Amana
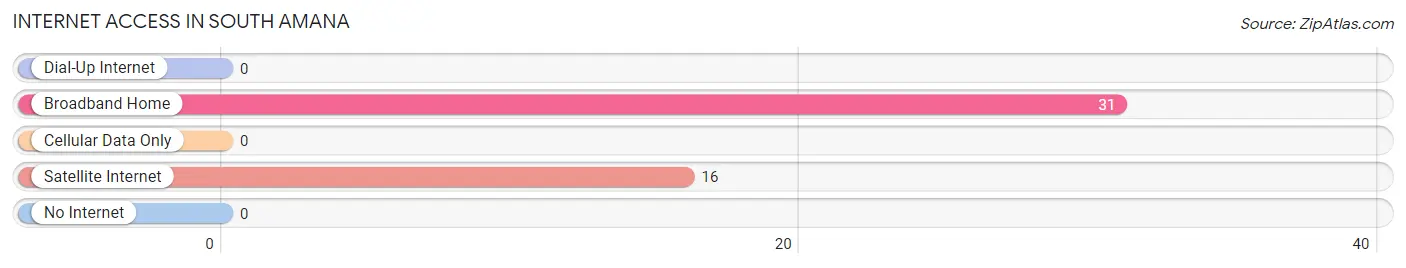
| Internet Type | # Households | % Households |
| Dial-Up Internet | 0 | 0.0% |
| Broadband Home | 31 | 66.0% |
| Cellular Data Only | 0 | 0.0% |
| Satellite Internet | 16 | 34.0% |
| No Internet | 0 | 0.0% |
| Total | 47 | 100.0% |
South Amana Summary
History
South Amana is a small town located in Iowa County, Iowa, United States. It is part of the Amana Colonies, a group of seven villages founded by German Pietists in the mid-19th century. The Amana Colonies were established in 1855 by a group of German Pietists who had emigrated from Germany to the United States in search of religious freedom. The group was led by Christian Metz, who had been inspired by the writings of Johann Friedrich Rock, a German theologian and philosopher. The Amana Colonies were founded on the principles of communal living, with all members of the community sharing in the work and the rewards.
The Amana Colonies were originally located in New York, but in 1855 the group moved to Iowa, where they purchased 6,000 acres of land. The seven villages that make up the Amana Colonies are Amana, East Amana, High Amana, Middle Amana, South Amana, West Amana, and Homestead. South Amana was founded in 1856 and is the second oldest of the seven villages.
Geography
South Amana is located in Iowa County, Iowa, United States. It is situated in the Amana Colonies, a group of seven villages located in the rolling hills of east-central Iowa. The village is located approximately 25 miles west of Cedar Rapids and 40 miles south of Iowa City. South Amana is bordered by the villages of East Amana to the north, High Amana to the east, Middle Amana to the south, and West Amana to the west.
The village of South Amana is situated on the banks of the Iowa River, which flows through the Amana Colonies. The village is surrounded by rolling hills and farmland, and is home to several small lakes and ponds. The climate in South Amana is typical of the Midwest, with hot summers and cold winters.
Economy
The economy of South Amana is largely based on agriculture and tourism. The village is home to several small farms, which produce a variety of crops, including corn, soybeans, and hay. The village also has several small businesses, including a grocery store, a bakery, a restaurant, and a bed and breakfast.
Tourism is an important part of the economy of South Amana. The village is home to several historic sites, including the Amana Heritage Museum, the Amana Woolen Mill, and the Amana Church. The village also hosts several festivals and events throughout the year, including the Amana Colonies Festival, the Amana Arts Festival, and the Amana Christmas Festival.
Demographics
As of the 2010 census, the population of South Amana was 545. The population is largely of German descent, with over 90% of the population identifying as German. The median age of the population is 44.7 years, and the median household income is $45,000. The village is served by the Amana Community School District, which includes an elementary school, a middle school, and a high school.
Common Questions
What is Per Capita Income in South Amana?
Per Capita income in South Amana is $27,111.
What is Income or Wage Gap in South Amana?
Income or Wage Gap in South Amana is 8.0%.
Women in South Amana earn 92.0 cents for every dollar earned by a man.
What is Inequality or Gini Index in South Amana?
Inequality or Gini Index in South Amana is 0.46.
What is the Total Population of South Amana?
Total Population of South Amana is 151.
What is the Total Male Population of South Amana?
Total Male Population of South Amana is 65.
What is the Total Female Population of South Amana?
Total Female Population of South Amana is 86.
What is the Ratio of Males per 100 Females in South Amana?
There are 75.58 Males per 100 Females in South Amana.
What is the Ratio of Females per 100 Males in South Amana?
There are 132.31 Females per 100 Males in South Amana.
What is the Median Population Age in South Amana?
Median Population Age in South Amana is 39.8 Years.
What is the Average Family Size in South Amana
Average Family Size in South Amana is 3.2 People.
What is the Average Household Size in South Amana
Average Household Size in South Amana is 3.2 People.
How Large is the Labor Force in South Amana?
There are 68 People in the Labor Forcein in South Amana.
What is the Percentage of People in the Labor Force in South Amana?
60.7% of People are in the Labor Force in South Amana.