Saylorville, IA Map & Demographics
Saylorville Map
Saylorville Overview
$46,755
PER CAPITA INCOME
$93,589
AVG FAMILY INCOME
$75,571
AVG HOUSEHOLD INCOME
12.1%
WAGE / INCOME GAP [ % ]
87.9¢/ $1
WAGE / INCOME GAP [ $ ]
0.46
INEQUALITY / GINI INDEX
2,837
TOTAL POPULATION
1,434
MALE POPULATION
1,403
FEMALE POPULATION
102.21
MALES / 100 FEMALES
97.84
FEMALES / 100 MALES
47.0
MEDIAN AGE
2.8
AVG FAMILY SIZE
2.3
AVG HOUSEHOLD SIZE
1,570
LABOR FORCE [ PEOPLE ]
70.4%
PERCENT IN LABOR FORCE
10.4%
UNEMPLOYMENT RATE
Income in Saylorville
Income Overview in Saylorville
Per Capita Income in Saylorville is $46,755, while median incomes of families and households are $93,589 and $75,571 respectively.
| Characteristic | Number | Measure |
| Per Capita Income | 2,837 | $46,755 |
| Median Family Income | 846 | $93,589 |
| Mean Family Income | 846 | $130,650 |
| Median Household Income | 1,228 | $75,571 |
| Mean Household Income | 1,228 | $105,832 |
| Income Deficit | 846 | $0 |
| Wage / Income Gap (%) | 2,837 | 12.13% |
| Wage / Income Gap ($) | 2,837 | 87.87¢ per $1 |
| Gini / Inequality Index | 2,837 | 0.46 |
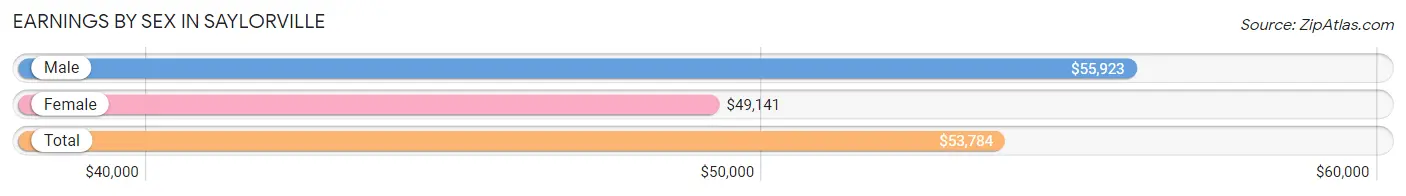
Earnings by Sex in Saylorville
Average Earnings in Saylorville are $53,784, $55,923 for men and $49,141 for women, a difference of 12.1%.
| Sex | Number | Average Earnings |
| Male | 861 (53.1%) | $55,923 |
| Female | 761 (46.9%) | $49,141 |
| Total | 1,622 (100.0%) | $53,784 |
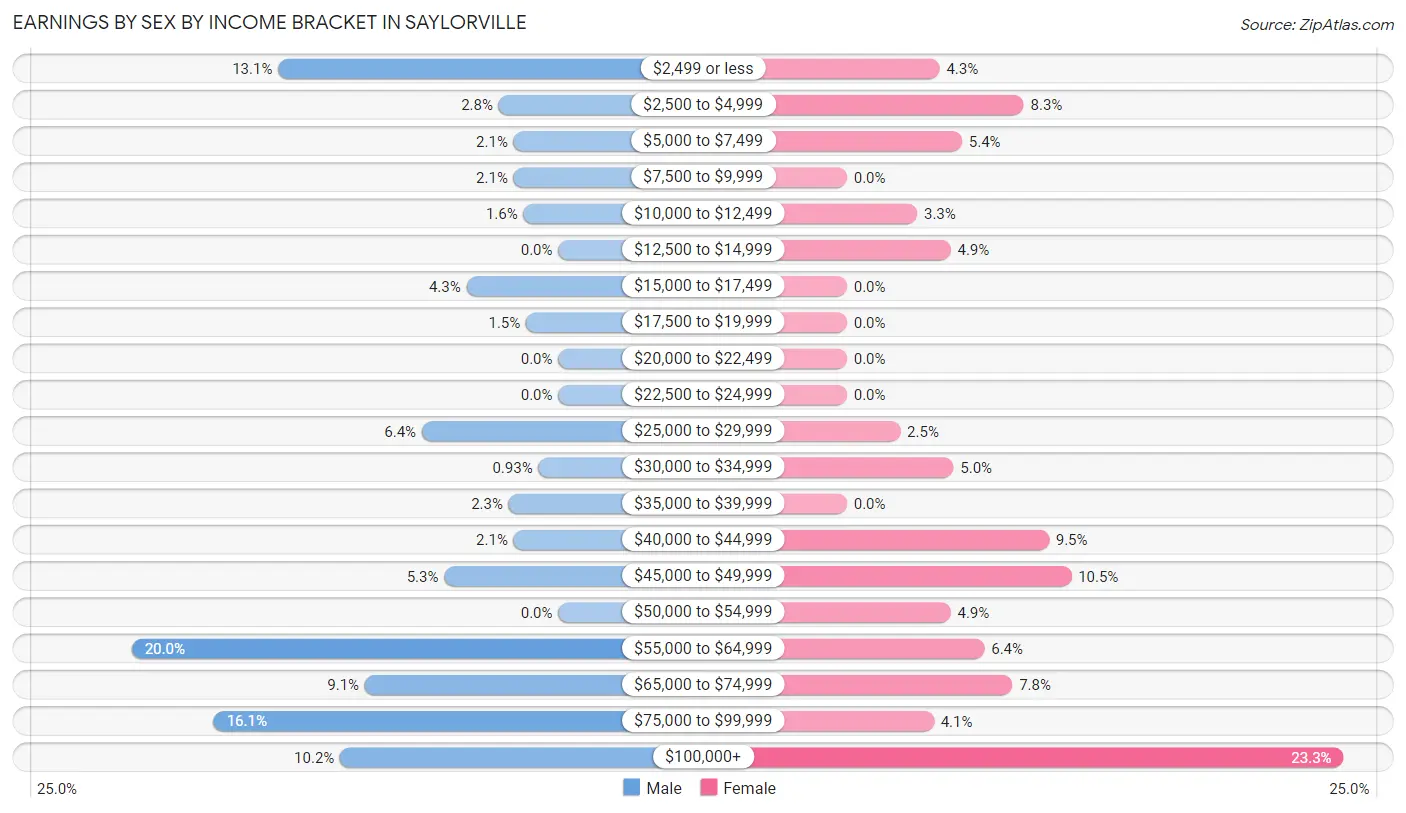
Earnings by Sex by Income Bracket in Saylorville
The most common earnings brackets in Saylorville are $55,000 to $64,999 for men (172 | 20.0%) and $100,000+ for women (177 | 23.3%).
| Income | Male | Female |
| $2,499 or less | 113 (13.1%) | 33 (4.3%) |
| $2,500 to $4,999 | 24 (2.8%) | 63 (8.3%) |
| $5,000 to $7,499 | 18 (2.1%) | 41 (5.4%) |
| $7,500 to $9,999 | 18 (2.1%) | 0 (0.0%) |
| $10,000 to $12,499 | 14 (1.6%) | 25 (3.3%) |
| $12,500 to $14,999 | 0 (0.0%) | 37 (4.9%) |
| $15,000 to $17,499 | 37 (4.3%) | 0 (0.0%) |
| $17,500 to $19,999 | 13 (1.5%) | 0 (0.0%) |
| $20,000 to $22,499 | 0 (0.0%) | 0 (0.0%) |
| $22,500 to $24,999 | 0 (0.0%) | 0 (0.0%) |
| $25,000 to $29,999 | 55 (6.4%) | 19 (2.5%) |
| $30,000 to $34,999 | 8 (0.9%) | 38 (5.0%) |
| $35,000 to $39,999 | 20 (2.3%) | 0 (0.0%) |
| $40,000 to $44,999 | 18 (2.1%) | 72 (9.5%) |
| $45,000 to $49,999 | 46 (5.3%) | 80 (10.5%) |
| $50,000 to $54,999 | 0 (0.0%) | 37 (4.9%) |
| $55,000 to $64,999 | 172 (20.0%) | 49 (6.4%) |
| $65,000 to $74,999 | 78 (9.1%) | 59 (7.7%) |
| $75,000 to $99,999 | 139 (16.1%) | 31 (4.1%) |
| $100,000+ | 88 (10.2%) | 177 (23.3%) |
| Total | 861 (100.0%) | 761 (100.0%) |
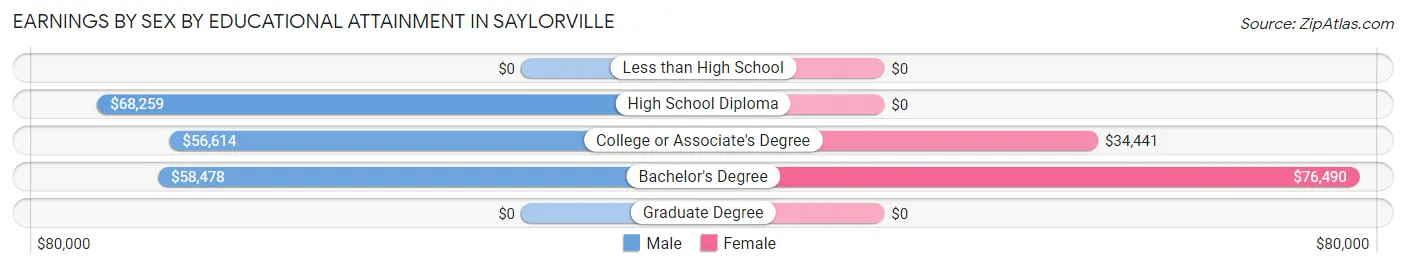
Earnings by Sex by Educational Attainment in Saylorville
Average earnings in Saylorville are $57,527 for men and $52,973 for women, a difference of 7.9%. Men with an educational attainment of high school diploma enjoy the highest average annual earnings of $68,259, while those with college or associate's degree education earn the least with $56,614. Women with an educational attainment of bachelor's degree earn the most with the average annual earnings of $76,490, while those with college or associate's degree education have the smallest earnings of $34,441.
| Educational Attainment | Male Income | Female Income |
| Less than High School | - | - |
| High School Diploma | $68,259 | $0 |
| College or Associate's Degree | $56,614 | $34,441 |
| Bachelor's Degree | $58,478 | $76,490 |
| Graduate Degree | - | - |
| Total | $57,527 | $52,973 |
Family Income in Saylorville
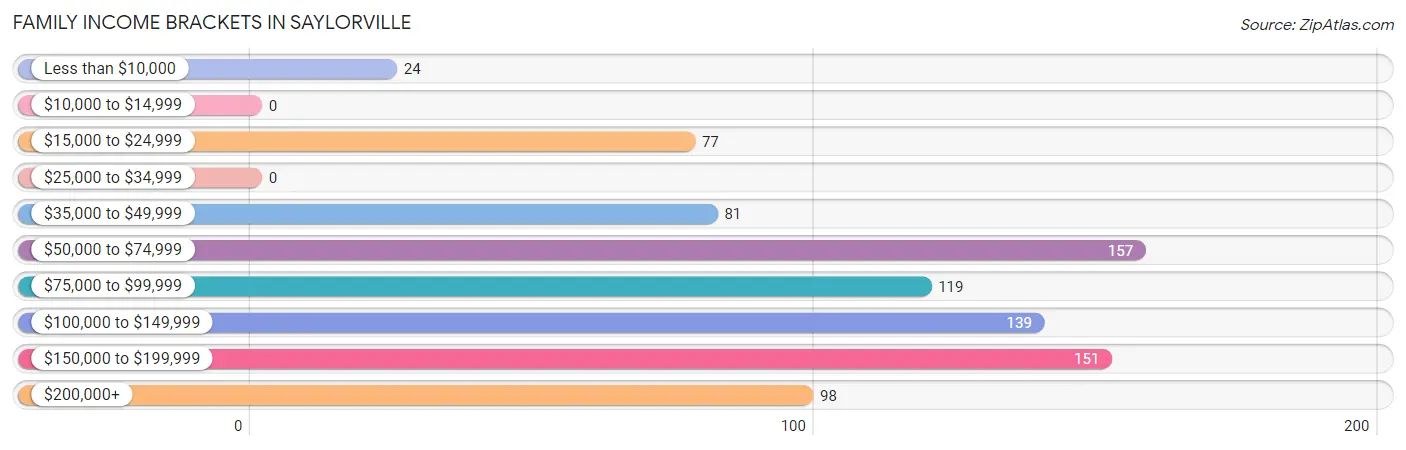
Family Income Brackets in Saylorville
According to the Saylorville family income data, there are 157 families falling into the $50,000 to $74,999 income range, which is the most common income bracket and makes up 18.6% of all families.
| Income Bracket | # Families | % Families |
| Less than $10,000 | 24 | 2.8% |
| $10,000 to $14,999 | 0 | 0.0% |
| $15,000 to $24,999 | 77 | 9.1% |
| $25,000 to $34,999 | 0 | 0.0% |
| $35,000 to $49,999 | 81 | 9.6% |
| $50,000 to $74,999 | 157 | 18.6% |
| $75,000 to $99,999 | 119 | 14.1% |
| $100,000 to $149,999 | 139 | 16.4% |
| $150,000 to $199,999 | 151 | 17.8% |
| $200,000+ | 98 | 11.6% |
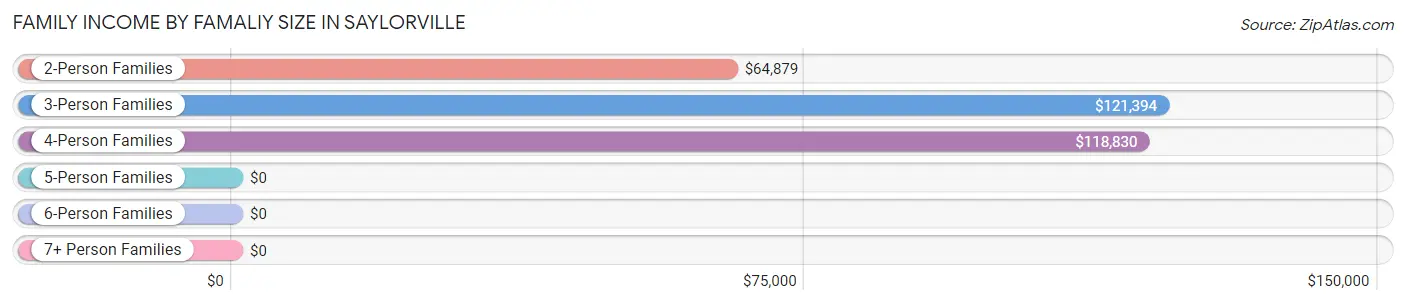
Family Income by Famaliy Size in Saylorville
3-person families (247 | 29.2%) account for the highest median family income in Saylorville with $121,394 per family, while 3-person families (247 | 29.2%) have the highest median income of $40,465 per family member.
| Income Bracket | # Families | Median Income |
| 2-Person Families | 424 (50.1%) | $64,879 |
| 3-Person Families | 247 (29.2%) | $121,394 |
| 4-Person Families | 124 (14.7%) | $118,830 |
| 5-Person Families | 23 (2.7%) | $0 |
| 6-Person Families | 0 (0.0%) | $0 |
| 7+ Person Families | 28 (3.3%) | $0 |
| Total | 846 (100.0%) | $93,589 |
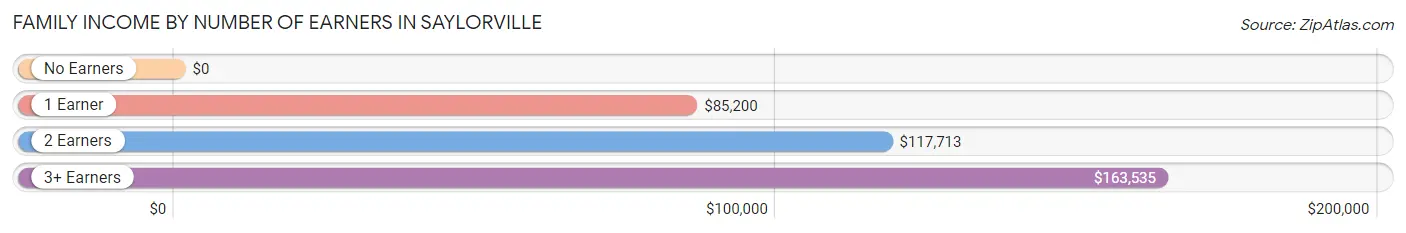
Family Income by Number of Earners in Saylorville
| Number of Earners | # Families | Median Income |
| No Earners | 171 (20.2%) | $0 |
| 1 Earner | 200 (23.6%) | $85,200 |
| 2 Earners | 328 (38.8%) | $117,713 |
| 3+ Earners | 147 (17.4%) | $163,535 |
| Total | 846 (100.0%) | $93,589 |
Household Income in Saylorville
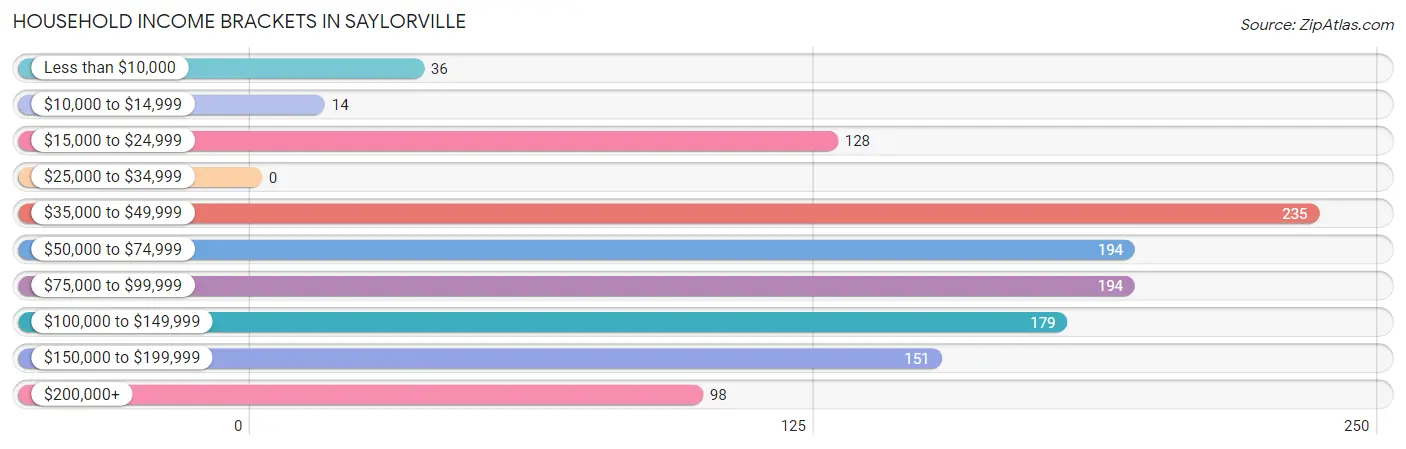
Household Income Brackets in Saylorville
With 235 households falling in the category, the $35,000 to $49,999 income range is the most frequent in Saylorville, accounting for 19.1% of all households.
| Income Bracket | # Households | % Households |
| Less than $10,000 | 36 | 2.9% |
| $10,000 to $14,999 | 14 | 1.1% |
| $15,000 to $24,999 | 128 | 10.4% |
| $25,000 to $34,999 | 0 | 0.0% |
| $35,000 to $49,999 | 235 | 19.1% |
| $50,000 to $74,999 | 194 | 15.8% |
| $75,000 to $99,999 | 194 | 15.8% |
| $100,000 to $149,999 | 179 | 14.6% |
| $150,000 to $199,999 | 151 | 12.3% |
| $200,000+ | 98 | 8.0% |
Household Income by Householder Age in Saylorville
The median household income in Saylorville is $75,571, with the highest median household income of $109,875 found in the 45 to 64 years age bracket for the primary householder. A total of 445 households (36.2%) fall into this category. Meanwhile, the 15 to 24 years age bracket for the primary householder has the lowest median household income of $0, with 13 households (1.1%) in this group.
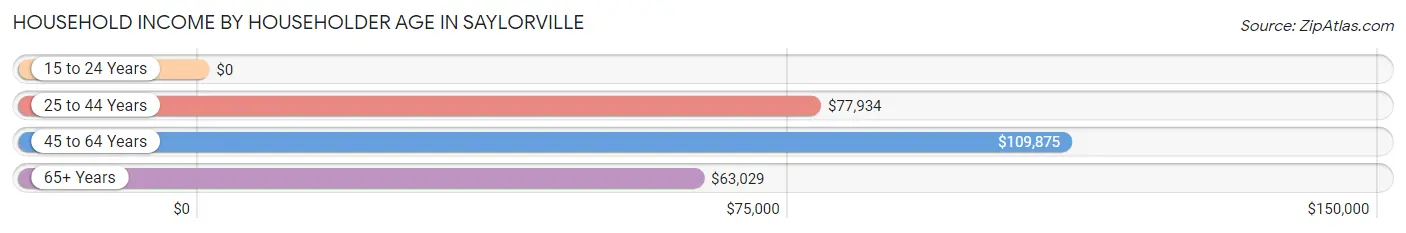
| Income Bracket | # Households | Median Income |
| 15 to 24 Years | 13 (1.1%) | $0 |
| 25 to 44 Years | 345 (28.1%) | $77,934 |
| 45 to 64 Years | 445 (36.2%) | $109,875 |
| 65+ Years | 425 (34.6%) | $63,029 |
| Total | 1,228 (100.0%) | $75,571 |
Poverty in Saylorville
Income Below Poverty by Sex and Age in Saylorville
With 4.0% poverty level for males and 3.1% for females among the residents of Saylorville, 16 and 17 year old males and 45 to 54 year old females are the most vulnerable to poverty, with 18 males (13.7%) and 24 females (12.2%) in their respective age groups living below the poverty level.
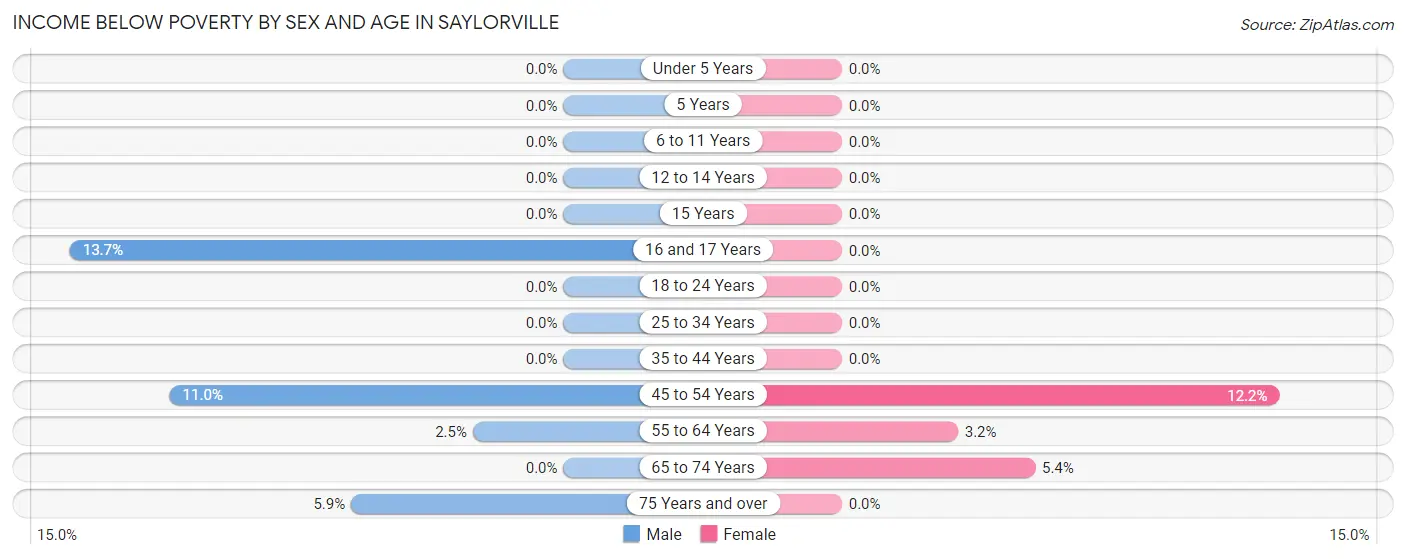
| Age Bracket | Male | Female |
| Under 5 Years | 0 (0.0%) | 0 (0.0%) |
| 5 Years | 0 (0.0%) | 0 (0.0%) |
| 6 to 11 Years | 0 (0.0%) | 0 (0.0%) |
| 12 to 14 Years | 0 (0.0%) | 0 (0.0%) |
| 15 Years | 0 (0.0%) | 0 (0.0%) |
| 16 and 17 Years | 18 (13.7%) | 0 (0.0%) |
| 18 to 24 Years | 0 (0.0%) | 0 (0.0%) |
| 25 to 34 Years | 0 (0.0%) | 0 (0.0%) |
| 35 to 44 Years | 0 (0.0%) | 0 (0.0%) |
| 45 to 54 Years | 24 (11.0%) | 24 (12.2%) |
| 55 to 64 Years | 4 (2.5%) | 5 (3.2%) |
| 65 to 74 Years | 0 (0.0%) | 14 (5.4%) |
| 75 Years and over | 11 (5.9%) | 0 (0.0%) |
| Total | 57 (4.0%) | 43 (3.1%) |
Income Above Poverty by Sex and Age in Saylorville
According to the poverty statistics in Saylorville, males aged under 5 years and females aged under 5 years are the age groups that are most secure financially, with 100.0% of males and 100.0% of females in these age groups living above the poverty line.
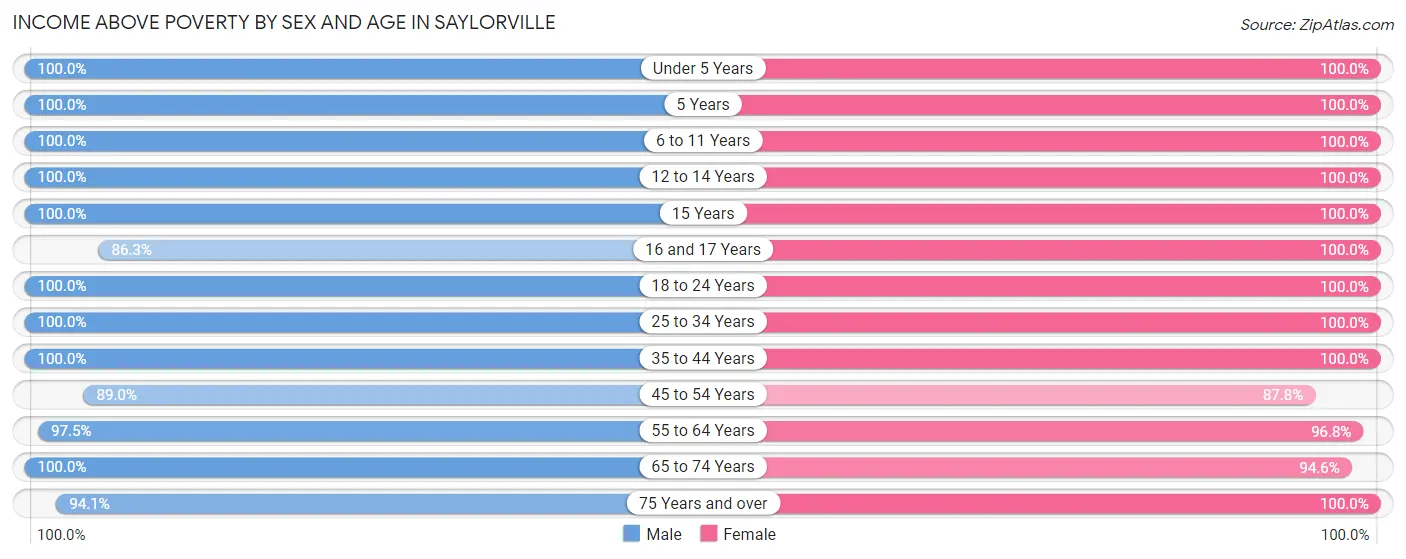
| Age Bracket | Male | Female |
| Under 5 Years | 120 (100.0%) | 62 (100.0%) |
| 5 Years | 21 (100.0%) | 73 (100.0%) |
| 6 to 11 Years | 26 (100.0%) | 133 (100.0%) |
| 12 to 14 Years | 42 (100.0%) | 18 (100.0%) |
| 15 Years | 54 (100.0%) | 41 (100.0%) |
| 16 and 17 Years | 113 (86.3%) | 9 (100.0%) |
| 18 to 24 Years | 29 (100.0%) | 60 (100.0%) |
| 25 to 34 Years | 85 (100.0%) | 110 (100.0%) |
| 35 to 44 Years | 156 (100.0%) | 196 (100.0%) |
| 45 to 54 Years | 195 (89.0%) | 173 (87.8%) |
| 55 to 64 Years | 155 (97.5%) | 150 (96.8%) |
| 65 to 74 Years | 206 (100.0%) | 246 (94.6%) |
| 75 Years and over | 175 (94.1%) | 72 (100.0%) |
| Total | 1,377 (96.0%) | 1,343 (96.9%) |
Income Below Poverty Among Married-Couple Families in Saylorville
The poverty statistics for married-couple families in Saylorville show that 3.9% or 29 of the total 749 families live below the poverty line. Families with no children have the highest poverty rate of 6.9%, comprising of 29 families. On the other hand, families with 1 or 2 children have the lowest poverty rate of 0.0%, which includes 0 families.
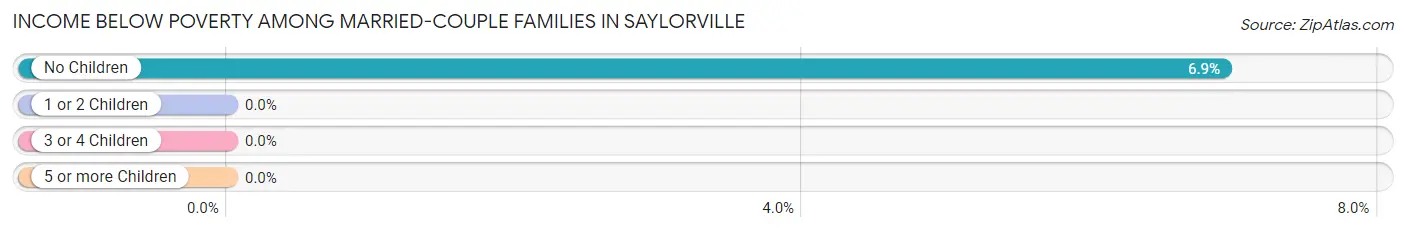
| Children | Above Poverty | Below Poverty |
| No Children | 390 (93.1%) | 29 (6.9%) |
| 1 or 2 Children | 302 (100.0%) | 0 (0.0%) |
| 3 or 4 Children | 0 (0.0%) | 0 (0.0%) |
| 5 or more Children | 28 (100.0%) | 0 (0.0%) |
| Total | 720 (96.1%) | 29 (3.9%) |
Income Below Poverty Among Single-Parent Households in Saylorville
| Children | Single Father | Single Mother |
| No Children | 0 (0.0%) | 0 (0.0%) |
| 1 or 2 Children | 0 (0.0%) | 0 (0.0%) |
| 3 or 4 Children | 0 (0.0%) | 0 (0.0%) |
| 5 or more Children | 0 (0.0%) | 0 (0.0%) |
| Total | 0 (0.0%) | 0 (0.0%) |
Income Below Poverty Among Married-Couple vs Single-Parent Households in Saylorville
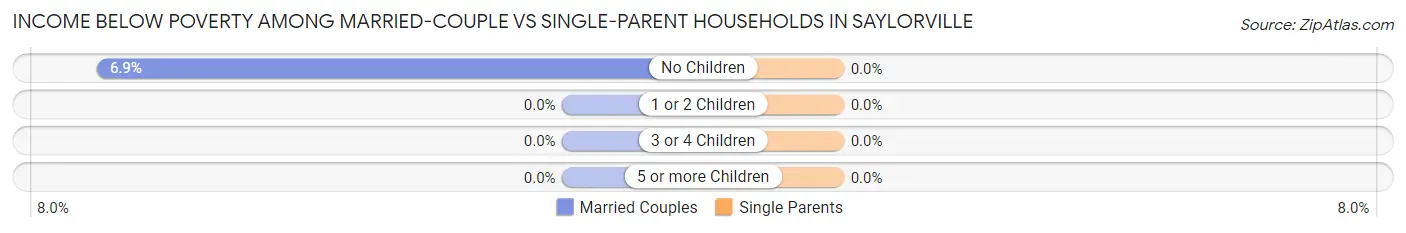
| Children | Married-Couple Families | Single-Parent Households |
| No Children | 29 (6.9%) | 0 (0.0%) |
| 1 or 2 Children | 0 (0.0%) | 0 (0.0%) |
| 3 or 4 Children | 0 (0.0%) | 0 (0.0%) |
| 5 or more Children | 0 (0.0%) | 0 (0.0%) |
| Total | 29 (3.9%) | 0 (0.0%) |
Race in Saylorville
The most populous races in Saylorville are White / Caucasian (2,443 | 86.1%), Two or more Races (191 | 6.7%), and Black / African American (156 | 5.5%).
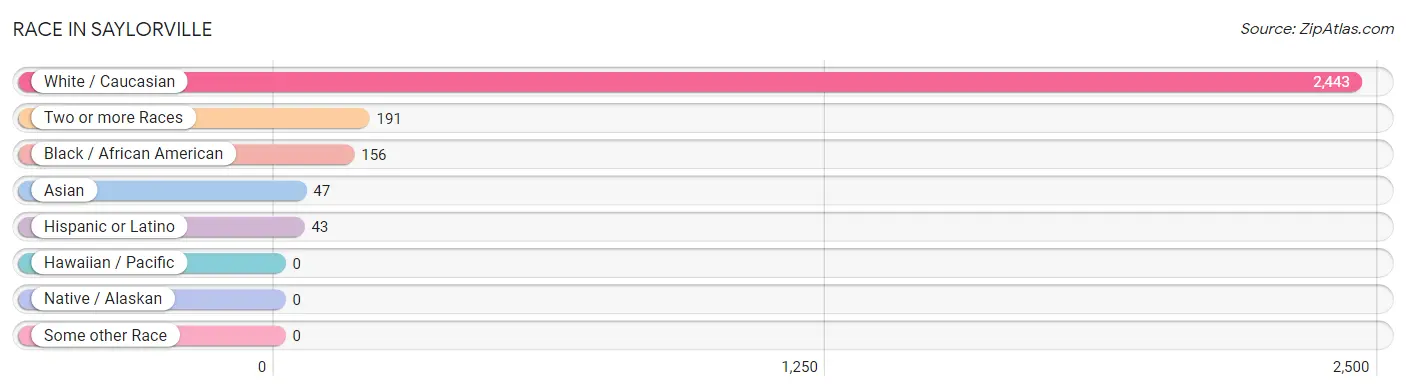
| Race | # Population | % Population |
| Asian | 47 | 1.7% |
| Black / African American | 156 | 5.5% |
| Hawaiian / Pacific | 0 | 0.0% |
| Hispanic or Latino | 43 | 1.5% |
| Native / Alaskan | 0 | 0.0% |
| White / Caucasian | 2,443 | 86.1% |
| Two or more Races | 191 | 6.7% |
| Some other Race | 0 | 0.0% |
| Total | 2,837 | 100.0% |
Ancestry in Saylorville
The most populous ancestries reported in Saylorville are German (987 | 34.8%), Irish (780 | 27.5%), Burmese (238 | 8.4%), American (220 | 7.7%), and English (214 | 7.5%), together accounting for 86.0% of all Saylorville residents.
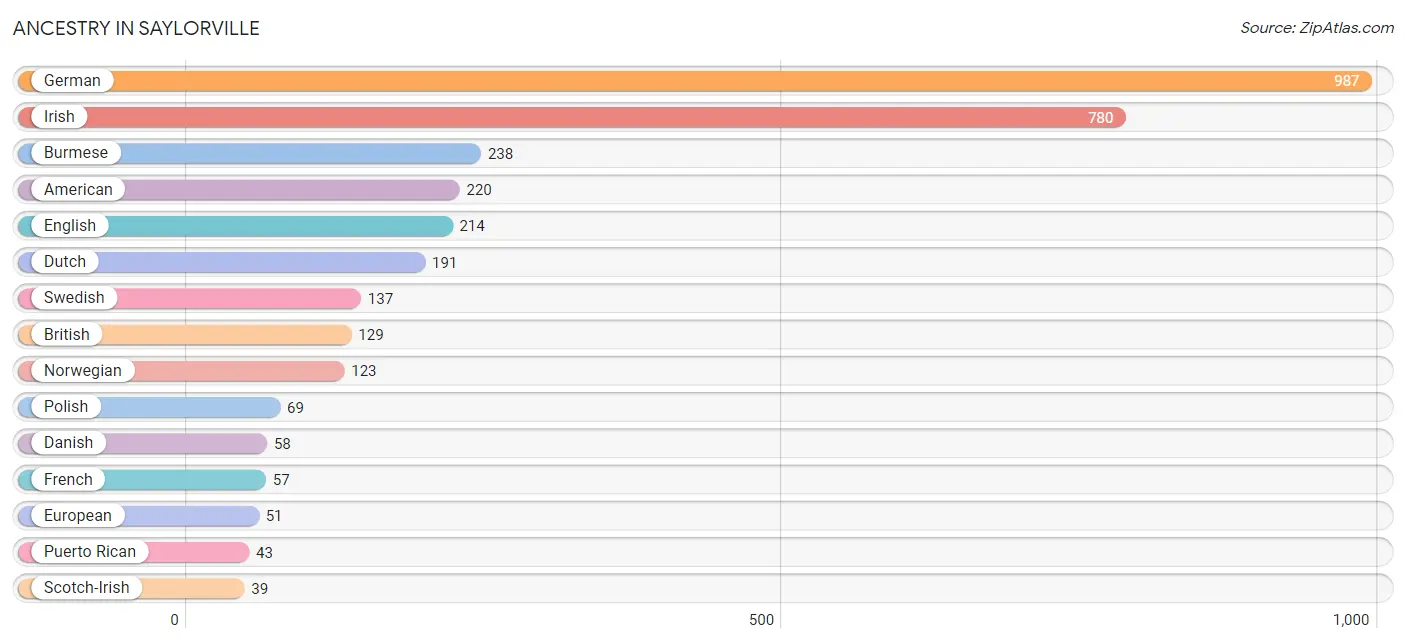
| Ancestry | # Population | % Population |
| American | 220 | 7.7% |
| British | 129 | 4.5% |
| Burmese | 238 | 8.4% |
| Czech | 23 | 0.8% |
| Danish | 58 | 2.0% |
| Dutch | 191 | 6.7% |
| English | 214 | 7.5% |
| European | 51 | 1.8% |
| French | 57 | 2.0% |
| German | 987 | 34.8% |
| Irish | 780 | 27.5% |
| Italian | 19 | 0.7% |
| Norwegian | 123 | 4.3% |
| Polish | 69 | 2.4% |
| Puerto Rican | 43 | 1.5% |
| Russian | 25 | 0.9% |
| Scotch-Irish | 39 | 1.4% |
| Scottish | 17 | 0.6% |
| Swedish | 137 | 4.8% |
| Welsh | 21 | 0.7% | View All 20 Rows |
Immigrants in Saylorville
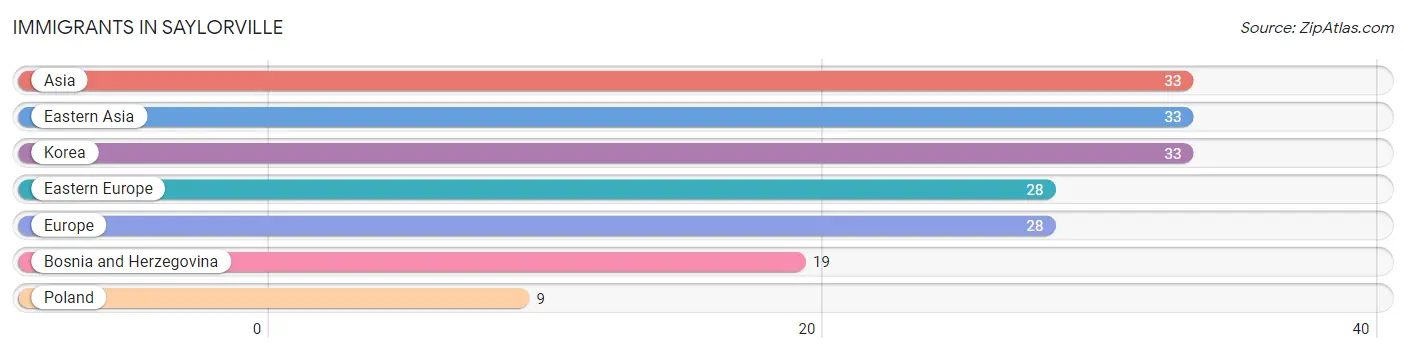
The most numerous immigrant groups reported in Saylorville came from Asia (33 | 1.2%), Eastern Asia (33 | 1.2%), Korea (33 | 1.2%), Eastern Europe (28 | 1.0%), and Europe (28 | 1.0%), together accounting for 5.5% of all Saylorville residents.
| Immigration Origin | # Population | % Population |
| Asia | 33 | 1.2% |
| Bosnia and Herzegovina | 19 | 0.7% |
| Eastern Asia | 33 | 1.2% |
| Eastern Europe | 28 | 1.0% |
| Europe | 28 | 1.0% |
| Korea | 33 | 1.2% |
| Poland | 9 | 0.3% | View All 7 Rows |
Sex and Age in Saylorville
Sex and Age in Saylorville
The most populous age groups in Saylorville are 15 to 19 Years (201 | 14.0%) for men and 5 to 9 Years (206 | 14.7%) for women.
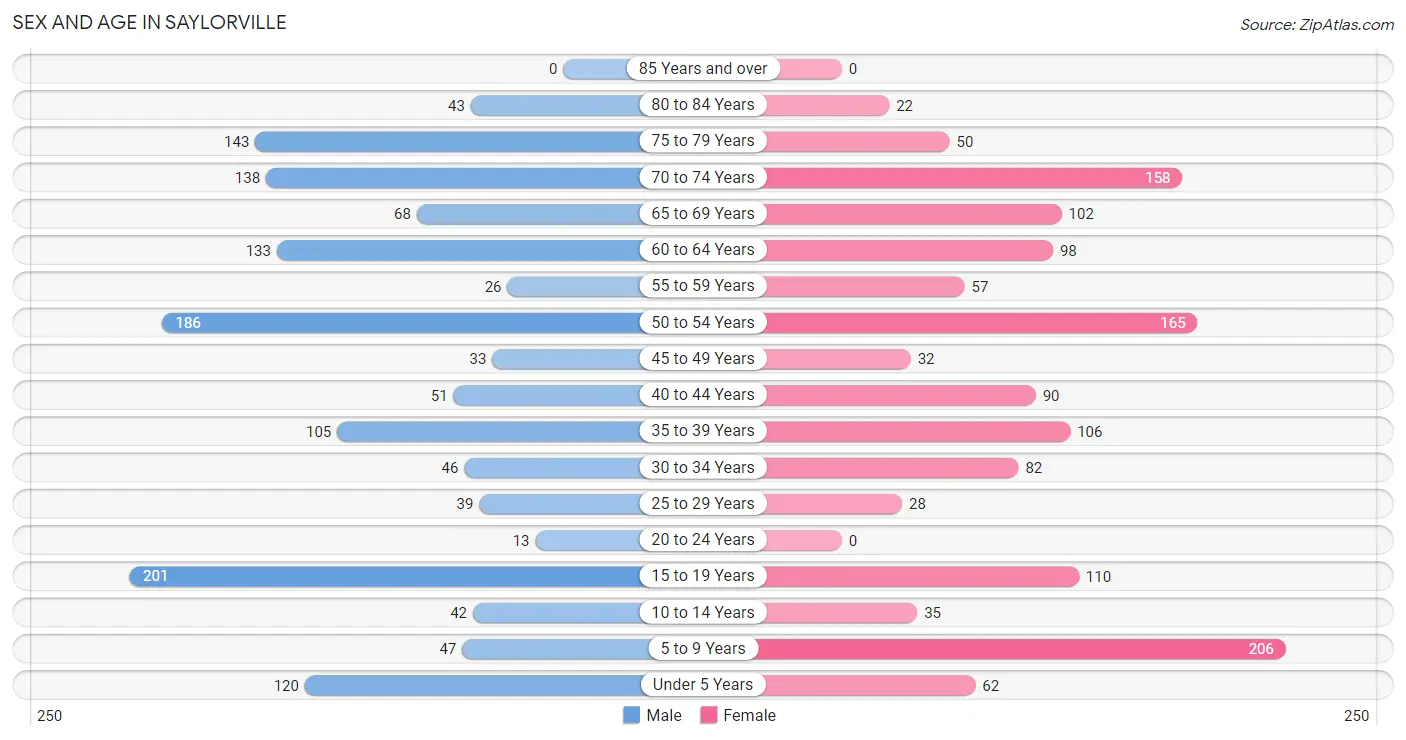
| Age Bracket | Male | Female |
| Under 5 Years | 120 (8.4%) | 62 (4.4%) |
| 5 to 9 Years | 47 (3.3%) | 206 (14.7%) |
| 10 to 14 Years | 42 (2.9%) | 35 (2.5%) |
| 15 to 19 Years | 201 (14.0%) | 110 (7.8%) |
| 20 to 24 Years | 13 (0.9%) | 0 (0.0%) |
| 25 to 29 Years | 39 (2.7%) | 28 (2.0%) |
| 30 to 34 Years | 46 (3.2%) | 82 (5.8%) |
| 35 to 39 Years | 105 (7.3%) | 106 (7.6%) |
| 40 to 44 Years | 51 (3.6%) | 90 (6.4%) |
| 45 to 49 Years | 33 (2.3%) | 32 (2.3%) |
| 50 to 54 Years | 186 (13.0%) | 165 (11.8%) |
| 55 to 59 Years | 26 (1.8%) | 57 (4.1%) |
| 60 to 64 Years | 133 (9.3%) | 98 (7.0%) |
| 65 to 69 Years | 68 (4.7%) | 102 (7.3%) |
| 70 to 74 Years | 138 (9.6%) | 158 (11.3%) |
| 75 to 79 Years | 143 (10.0%) | 50 (3.6%) |
| 80 to 84 Years | 43 (3.0%) | 22 (1.6%) |
| 85 Years and over | 0 (0.0%) | 0 (0.0%) |
| Total | 1,434 (100.0%) | 1,403 (100.0%) |
Families and Households in Saylorville
Median Family Size in Saylorville
The median family size in Saylorville is 2.84 persons per family, with single female/mother families (87 | 10.3%) accounting for the largest median family size of 3.41 persons per family. On the other hand, single male/father families (10 | 1.2%) represent the smallest median family size with 2.00 persons per family.
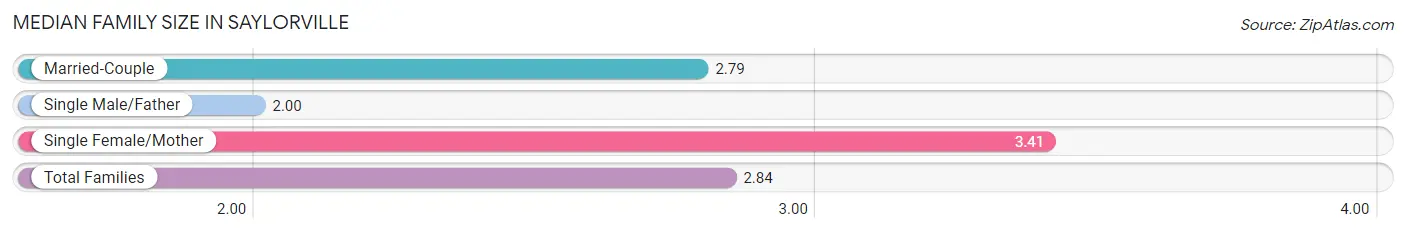
| Family Type | # Families | Family Size |
| Married-Couple | 749 (88.5%) | 2.79 |
| Single Male/Father | 10 (1.2%) | 2.00 |
| Single Female/Mother | 87 (10.3%) | 3.41 |
| Total Families | 846 (100.0%) | 2.84 |
Median Household Size in Saylorville
The median household size in Saylorville is 2.31 persons per household, with single female/mother households (87 | 7.1%) accounting for the largest median household size of 3.41 persons per household. non-family households (382 | 31.1%) represent the smallest median household size with 1.13 persons per household.
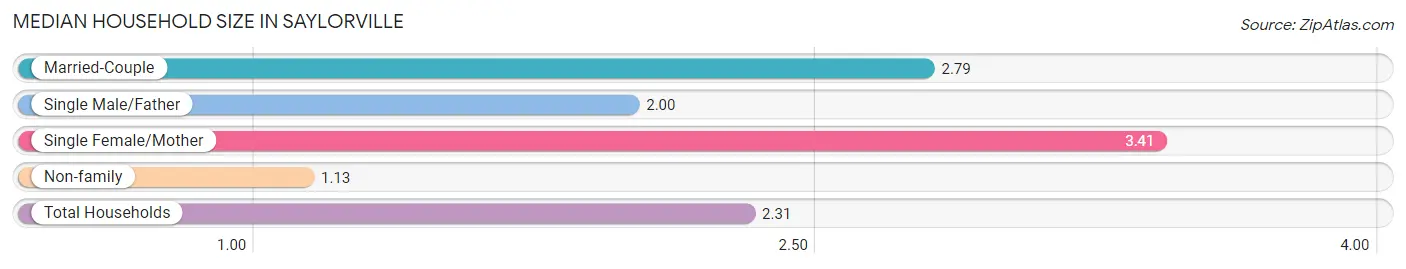
| Household Type | # Households | Household Size |
| Married-Couple | 749 (61.0%) | 2.79 |
| Single Male/Father | 10 (0.8%) | 2.00 |
| Single Female/Mother | 87 (7.1%) | 3.41 |
| Non-family | 382 (31.1%) | 1.13 |
| Total Households | 1,228 (100.0%) | 2.31 |
Household Size by Marriage Status in Saylorville
Out of a total of 1,228 households in Saylorville, 846 (68.9%) are family households, while 382 (31.1%) are nonfamily households. The most numerous type of family households are 2-person households, comprising 424, and the most common type of nonfamily households are 1-person households, comprising 364.
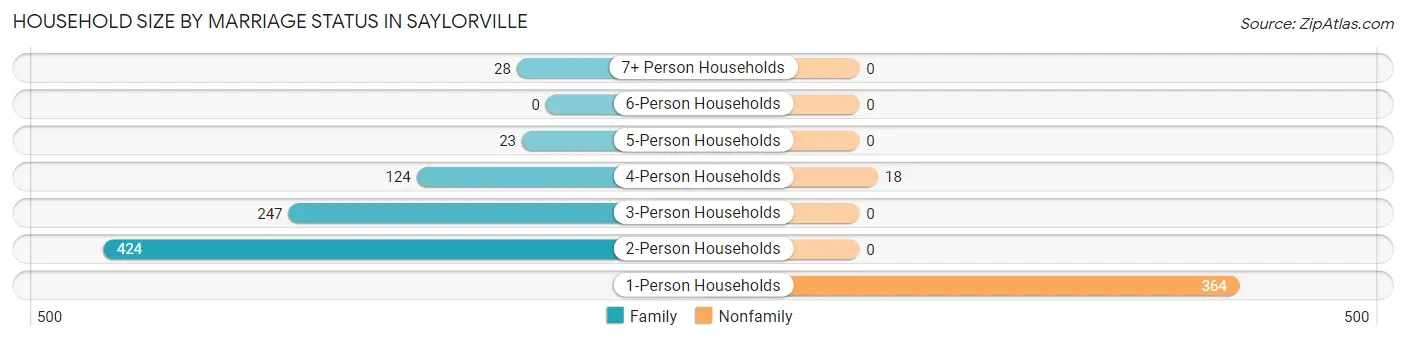
| Household Size | Family Households | Nonfamily Households |
| 1-Person Households | - | 364 (29.6%) |
| 2-Person Households | 424 (34.5%) | 0 (0.0%) |
| 3-Person Households | 247 (20.1%) | 0 (0.0%) |
| 4-Person Households | 124 (10.1%) | 18 (1.5%) |
| 5-Person Households | 23 (1.9%) | 0 (0.0%) |
| 6-Person Households | 0 (0.0%) | 0 (0.0%) |
| 7+ Person Households | 28 (2.3%) | 0 (0.0%) |
| Total | 846 (68.9%) | 382 (31.1%) |
Female Fertility in Saylorville
Fertility by Age in Saylorville
Average fertility rate in Saylorville is 52.0 births per 1,000 women. Women in the age bracket of 35 to 50 years have the highest fertility rate with 98.0 births per 1,000 women. Women in the age bracket of 35 to 50 years acount for 100.0% of all women with births.
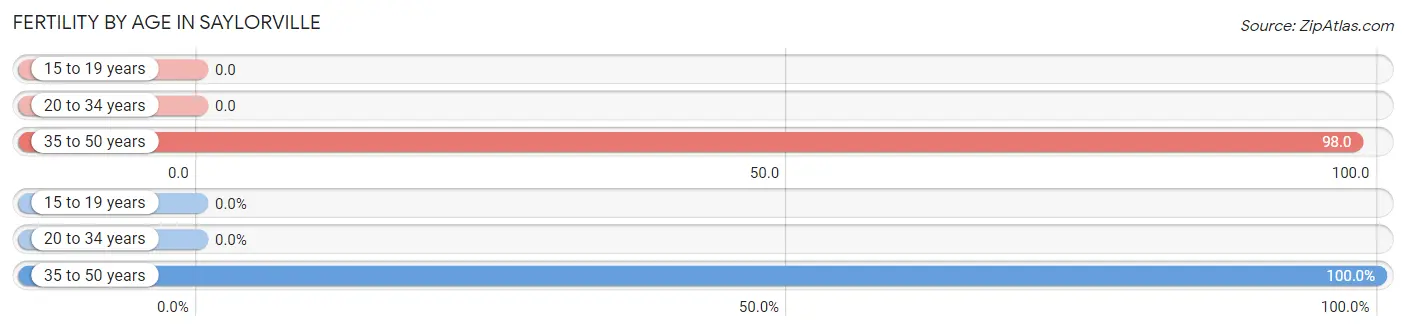
| Age Bracket | Women with Births | Births / 1,000 Women |
| 15 to 19 years | 0 (0.0%) | 0.0 |
| 20 to 34 years | 0 (0.0%) | 0.0 |
| 35 to 50 years | 24 (100.0%) | 98.0 |
| Total | 24 (100.0%) | 52.0 |
Fertility by Age by Marriage Status in Saylorville
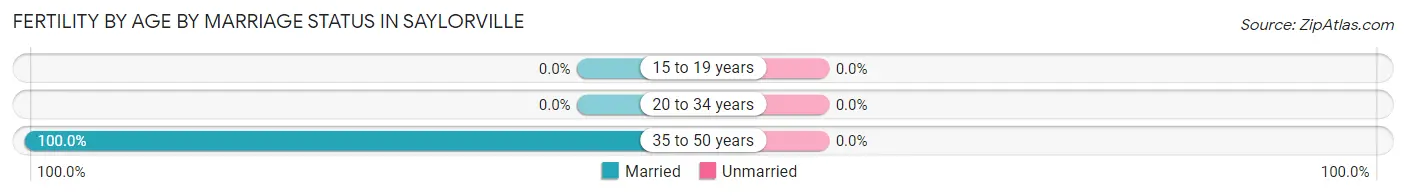
| Age Bracket | Married | Unmarried |
| 15 to 19 years | 0 (0.0%) | 0 (0.0%) |
| 20 to 34 years | 0 (0.0%) | 0 (0.0%) |
| 35 to 50 years | 24 (100.0%) | 0 (0.0%) |
| Total | 24 (100.0%) | 0 (0.0%) |
Fertility by Education in Saylorville
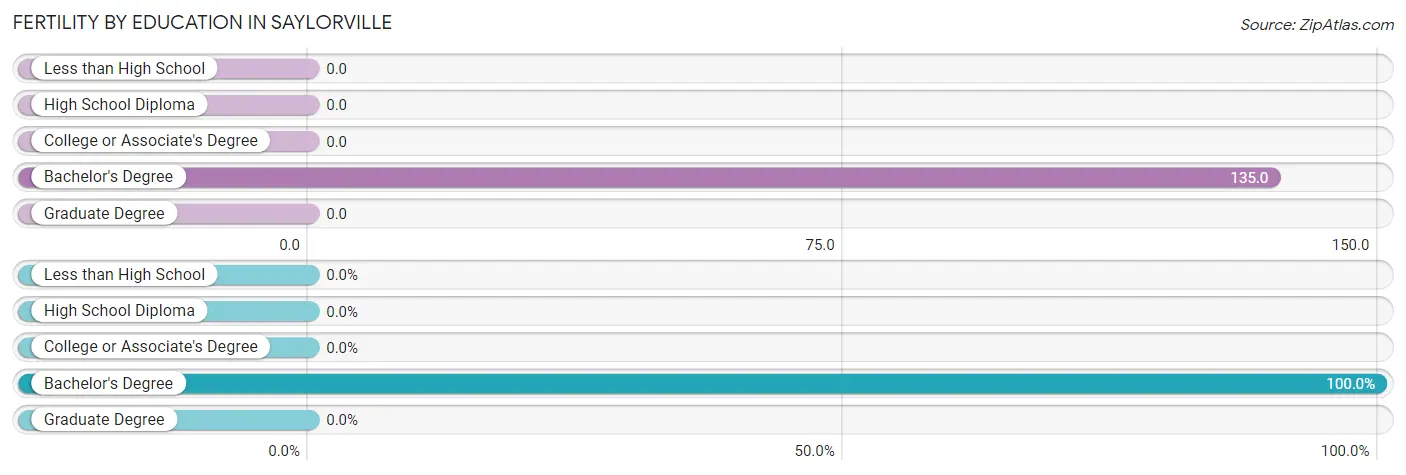
| Educational Attainment | Women with Births | Births / 1,000 Women |
| Less than High School | 0 (0.0%) | 0.0 |
| High School Diploma | 0 (0.0%) | 0.0 |
| College or Associate's Degree | 0 (0.0%) | 0.0 |
| Bachelor's Degree | 24 (100.0%) | 135.0 |
| Graduate Degree | 0 (0.0%) | 0.0 |
| Total | 24 (100.0%) | 52.0 |
Fertility by Education by Marriage Status in Saylorville
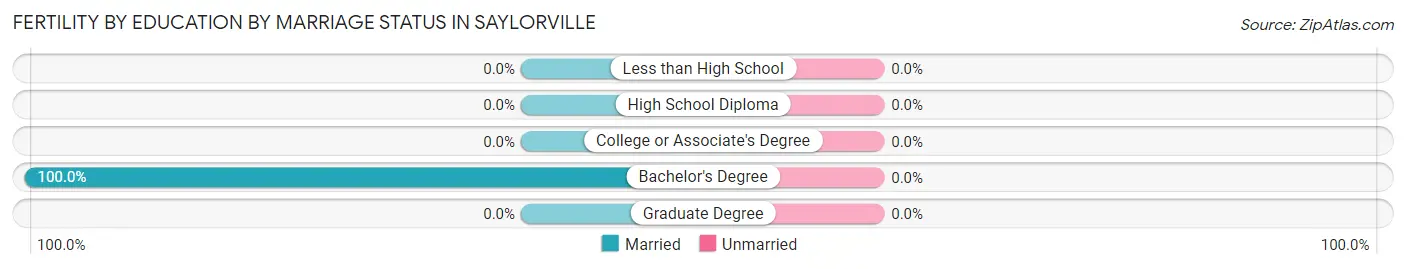
| Educational Attainment | Married | Unmarried |
| Less than High School | 0 (0.0%) | 0 (0.0%) |
| High School Diploma | 0 (0.0%) | 0 (0.0%) |
| College or Associate's Degree | 0 (0.0%) | 0 (0.0%) |
| Bachelor's Degree | 24 (100.0%) | 0 (0.0%) |
| Graduate Degree | 0 (0.0%) | 0 (0.0%) |
| Total | 24 (100.0%) | 0 (0.0%) |
Employment Characteristics in Saylorville
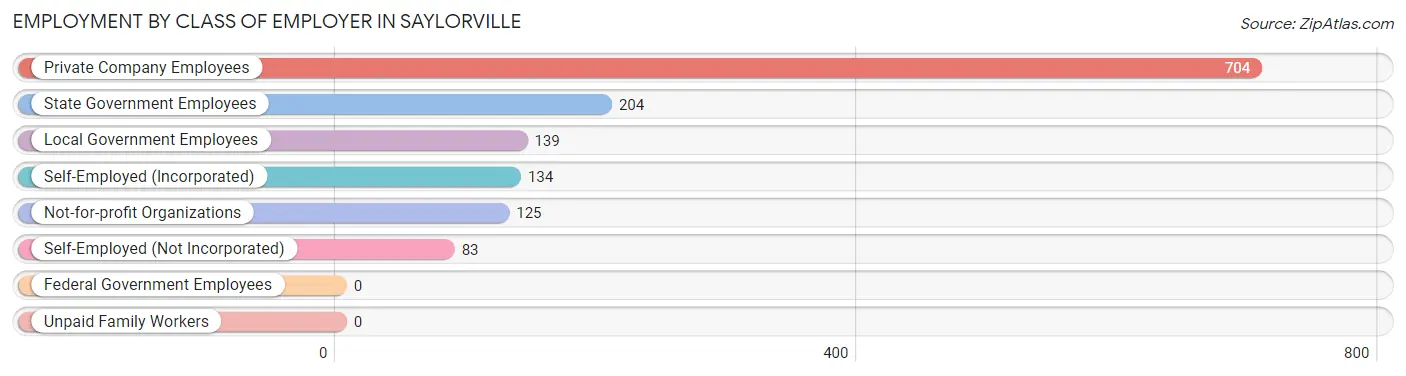
Employment by Class of Employer in Saylorville
Among the 1,389 employed individuals in Saylorville, private company employees (704 | 50.7%), state government employees (204 | 14.7%), and local government employees (139 | 10.0%) make up the most common classes of employment.
| Employer Class | # Employees | % Employees |
| Private Company Employees | 704 | 50.7% |
| Self-Employed (Incorporated) | 134 | 9.7% |
| Self-Employed (Not Incorporated) | 83 | 6.0% |
| Not-for-profit Organizations | 125 | 9.0% |
| Local Government Employees | 139 | 10.0% |
| State Government Employees | 204 | 14.7% |
| Federal Government Employees | 0 | 0.0% |
| Unpaid Family Workers | 0 | 0.0% |
| Total | 1,389 | 100.0% |
Employment Status by Age in Saylorville
According to the labor force statistics for Saylorville, out of the total population over 16 years of age (2,230), 70.4% or 1,570 individuals are in the labor force, with 10.4% or 163 of them unemployed. The age group with the highest labor force participation rate is 20 to 24 years, with 100.0% or 13 individuals in the labor force. Within the labor force, the 30 to 34 years age range has the highest percentage of unemployed individuals, with 27.3% or 35 of them being unemployed.
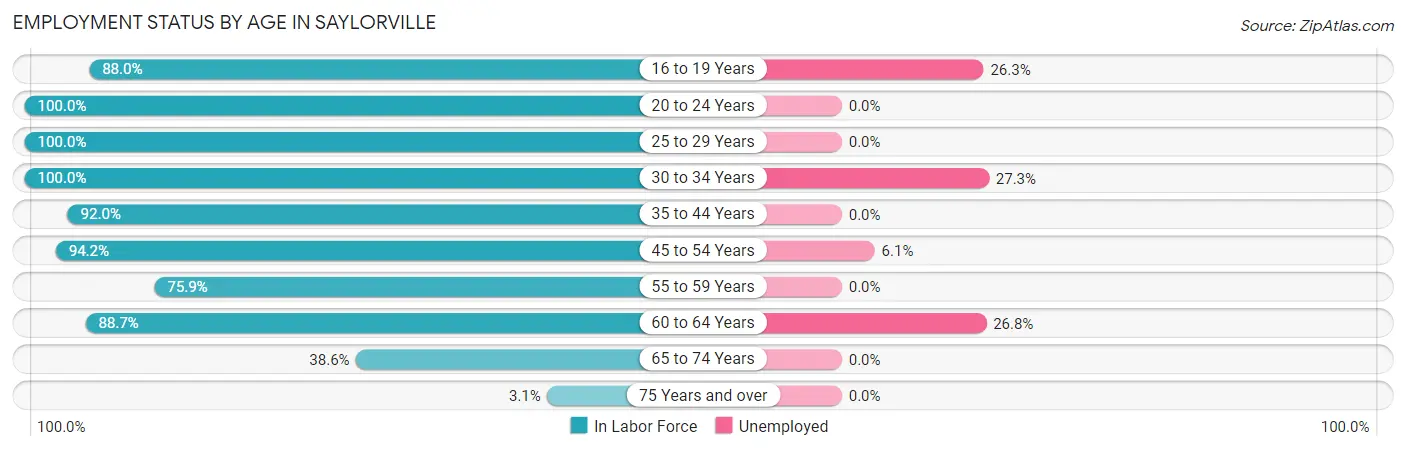
| Age Bracket | In Labor Force | Unemployed |
| 16 to 19 Years | 190 (88.0%) | 50 (26.3%) |
| 20 to 24 Years | 13 (100.0%) | 0 (0.0%) |
| 25 to 29 Years | 67 (100.0%) | 0 (0.0%) |
| 30 to 34 Years | 128 (100.0%) | 35 (27.3%) |
| 35 to 44 Years | 324 (92.0%) | 0 (0.0%) |
| 45 to 54 Years | 392 (94.2%) | 24 (6.1%) |
| 55 to 59 Years | 63 (75.9%) | 0 (0.0%) |
| 60 to 64 Years | 205 (88.7%) | 55 (26.8%) |
| 65 to 74 Years | 180 (38.6%) | 0 (0.0%) |
| 75 Years and over | 8 (3.1%) | 0 (0.0%) |
| Total | 1,570 (70.4%) | 163 (10.4%) |
Employment Status by Educational Attainment in Saylorville
According to labor force statistics for Saylorville, 92.3% of individuals (1,179) out of the total population between 25 and 64 years of age (1,277) are in the labor force, with 9.7% or 114 of them being unemployed. The group with the highest labor force participation rate are those with the educational attainment of high school diploma, with 100.0% or 236 individuals in the labor force. Within the labor force, individuals with high school diploma education have the highest percentage of unemployment, with 23.3% or 55 of them being unemployed.
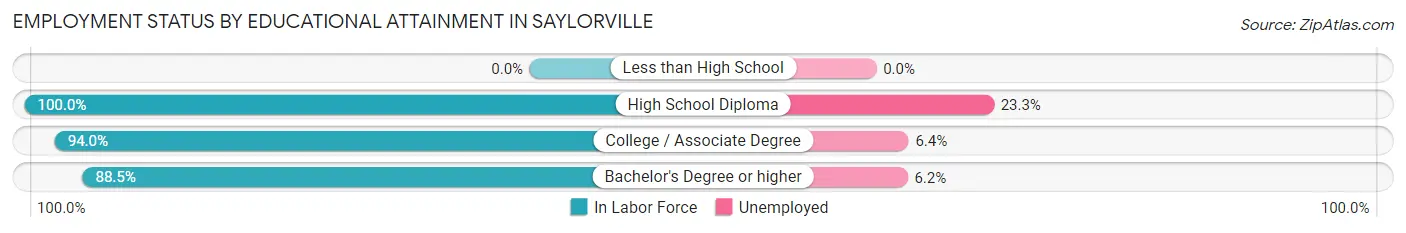
| Educational Attainment | In Labor Force | Unemployed |
| Less than High School | 0 (0.0%) | 0 (0.0%) |
| High School Diploma | 236 (100.0%) | 55 (23.3%) |
| College / Associate Degree | 376 (94.0%) | 26 (6.4%) |
| Bachelor's Degree or higher | 567 (88.5%) | 40 (6.2%) |
| Total | 1,179 (92.3%) | 124 (9.7%) |
Employment Occupations by Sex in Saylorville
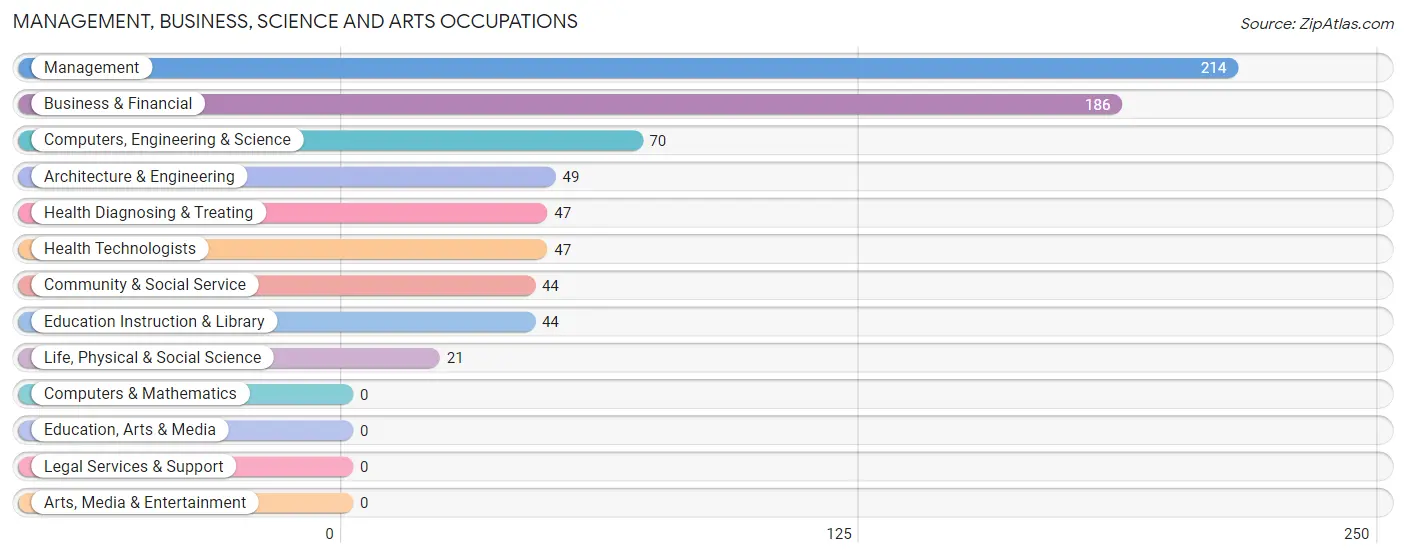
Management, Business, Science and Arts Occupations
The most common Management, Business, Science and Arts occupations in Saylorville are Management (214 | 15.2%), Business & Financial (186 | 13.2%), Computers, Engineering & Science (70 | 5.0%), Architecture & Engineering (49 | 3.5%), and Health Diagnosing & Treating (47 | 3.3%).
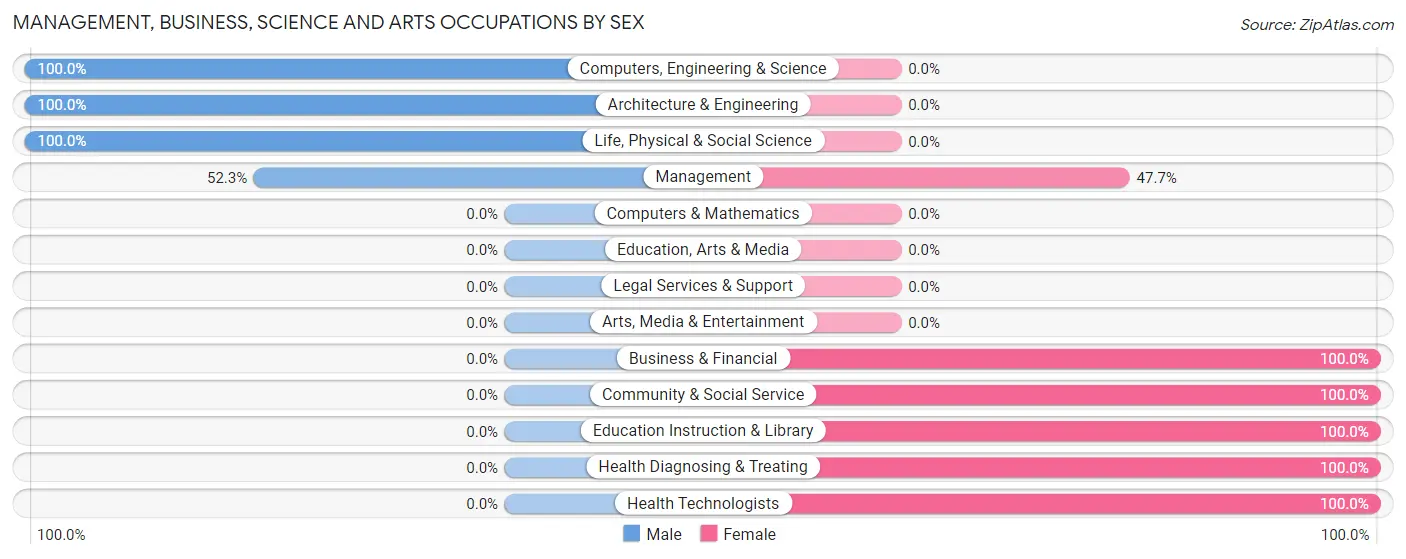
Management, Business, Science and Arts Occupations by Sex
Within the Management, Business, Science and Arts occupations in Saylorville, the most male-oriented occupations are Computers, Engineering & Science (100.0%), Architecture & Engineering (100.0%), and Life, Physical & Social Science (100.0%), while the most female-oriented occupations are Business & Financial (100.0%), Community & Social Service (100.0%), and Education Instruction & Library (100.0%).
| Occupation | Male | Female |
| Management | 112 (52.3%) | 102 (47.7%) |
| Business & Financial | 0 (0.0%) | 186 (100.0%) |
| Computers, Engineering & Science | 70 (100.0%) | 0 (0.0%) |
| Computers & Mathematics | 0 (0.0%) | 0 (0.0%) |
| Architecture & Engineering | 49 (100.0%) | 0 (0.0%) |
| Life, Physical & Social Science | 21 (100.0%) | 0 (0.0%) |
| Community & Social Service | 0 (0.0%) | 44 (100.0%) |
| Education, Arts & Media | 0 (0.0%) | 0 (0.0%) |
| Legal Services & Support | 0 (0.0%) | 0 (0.0%) |
| Education Instruction & Library | 0 (0.0%) | 44 (100.0%) |
| Arts, Media & Entertainment | 0 (0.0%) | 0 (0.0%) |
| Health Diagnosing & Treating | 0 (0.0%) | 47 (100.0%) |
| Health Technologists | 0 (0.0%) | 47 (100.0%) |
| Total (Category) | 182 (32.4%) | 379 (67.6%) |
| Total (Overall) | 669 (47.6%) | 737 (52.4%) |
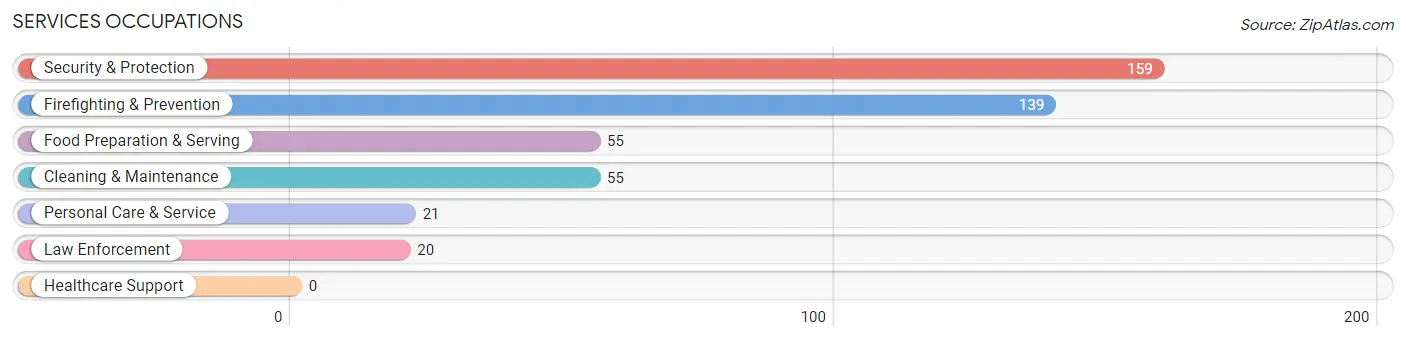
Services Occupations
The most common Services occupations in Saylorville are Security & Protection (159 | 11.3%), Firefighting & Prevention (139 | 9.9%), Food Preparation & Serving (55 | 3.9%), Cleaning & Maintenance (55 | 3.9%), and Personal Care & Service (21 | 1.5%).
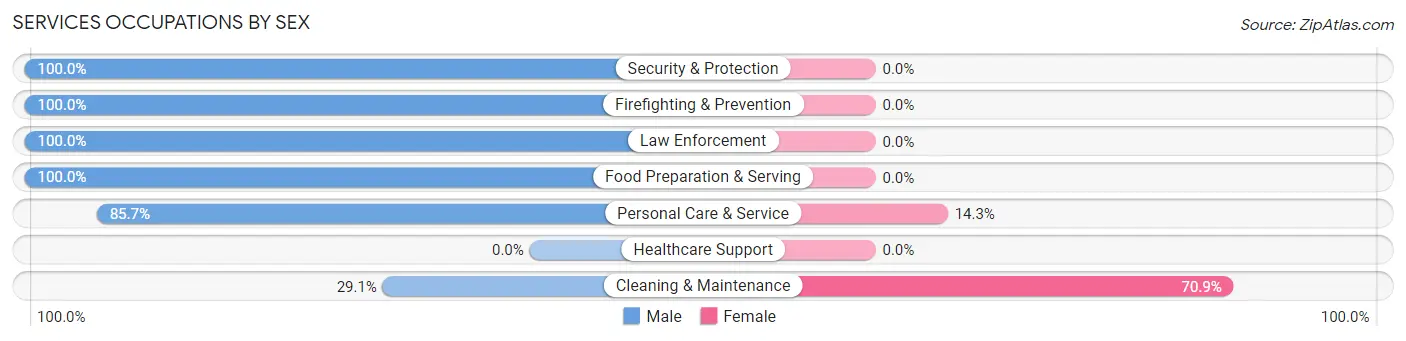
Services Occupations by Sex
Within the Services occupations in Saylorville, the most male-oriented occupations are Security & Protection (100.0%), Firefighting & Prevention (100.0%), and Law Enforcement (100.0%), while the most female-oriented occupations are Cleaning & Maintenance (70.9%), and Personal Care & Service (14.3%).
| Occupation | Male | Female |
| Healthcare Support | 0 (0.0%) | 0 (0.0%) |
| Security & Protection | 159 (100.0%) | 0 (0.0%) |
| Firefighting & Prevention | 139 (100.0%) | 0 (0.0%) |
| Law Enforcement | 20 (100.0%) | 0 (0.0%) |
| Food Preparation & Serving | 55 (100.0%) | 0 (0.0%) |
| Cleaning & Maintenance | 16 (29.1%) | 39 (70.9%) |
| Personal Care & Service | 18 (85.7%) | 3 (14.3%) |
| Total (Category) | 248 (85.5%) | 42 (14.5%) |
| Total (Overall) | 669 (47.6%) | 737 (52.4%) |
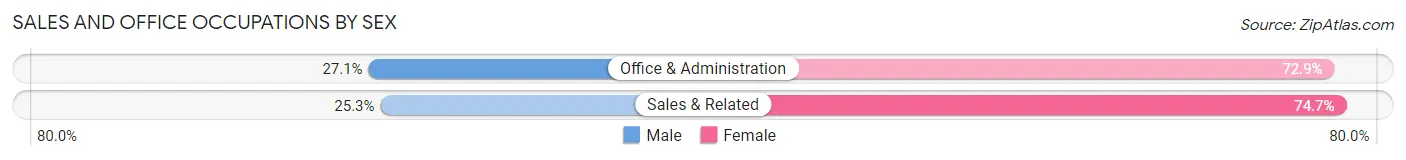
Sales and Office Occupations
The most common Sales and Office occupations in Saylorville are Sales & Related (182 | 12.9%), and Office & Administration (155 | 11.0%).

Sales and Office Occupations by Sex
| Occupation | Male | Female |
| Sales & Related | 46 (25.3%) | 136 (74.7%) |
| Office & Administration | 42 (27.1%) | 113 (72.9%) |
| Total (Category) | 88 (26.1%) | 249 (73.9%) |
| Total (Overall) | 669 (47.6%) | 737 (52.4%) |
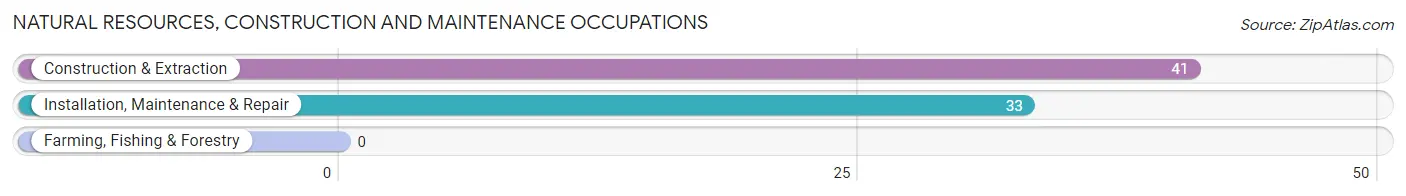
Natural Resources, Construction and Maintenance Occupations
The most common Natural Resources, Construction and Maintenance occupations in Saylorville are Construction & Extraction (41 | 2.9%), and Installation, Maintenance & Repair (33 | 2.4%).
Natural Resources, Construction and Maintenance Occupations by Sex
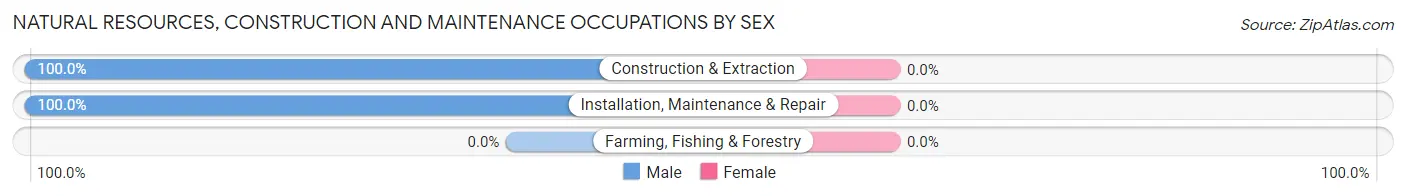
| Occupation | Male | Female |
| Farming, Fishing & Forestry | 0 (0.0%) | 0 (0.0%) |
| Construction & Extraction | 41 (100.0%) | 0 (0.0%) |
| Installation, Maintenance & Repair | 33 (100.0%) | 0 (0.0%) |
| Total (Category) | 74 (100.0%) | 0 (0.0%) |
| Total (Overall) | 669 (47.6%) | 737 (52.4%) |
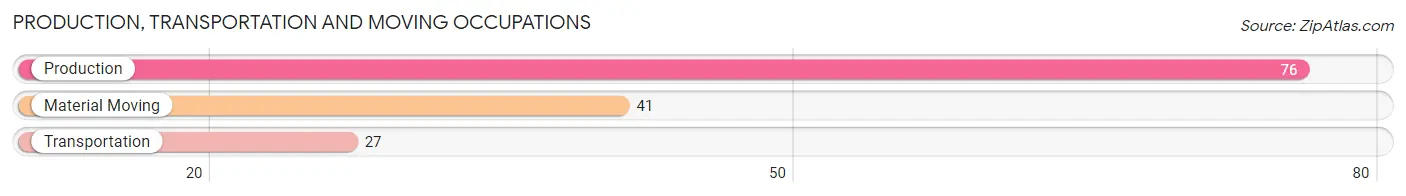
Production, Transportation and Moving Occupations
The most common Production, Transportation and Moving occupations in Saylorville are Production (76 | 5.4%), Material Moving (41 | 2.9%), and Transportation (27 | 1.9%).
Production, Transportation and Moving Occupations by Sex
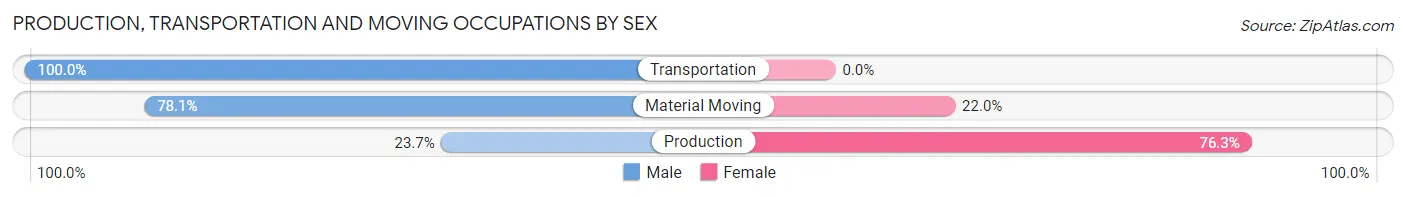
| Occupation | Male | Female |
| Production | 18 (23.7%) | 58 (76.3%) |
| Transportation | 27 (100.0%) | 0 (0.0%) |
| Material Moving | 32 (78.0%) | 9 (22.0%) |
| Total (Category) | 77 (53.5%) | 67 (46.5%) |
| Total (Overall) | 669 (47.6%) | 737 (52.4%) |
Employment Industries by Sex in Saylorville
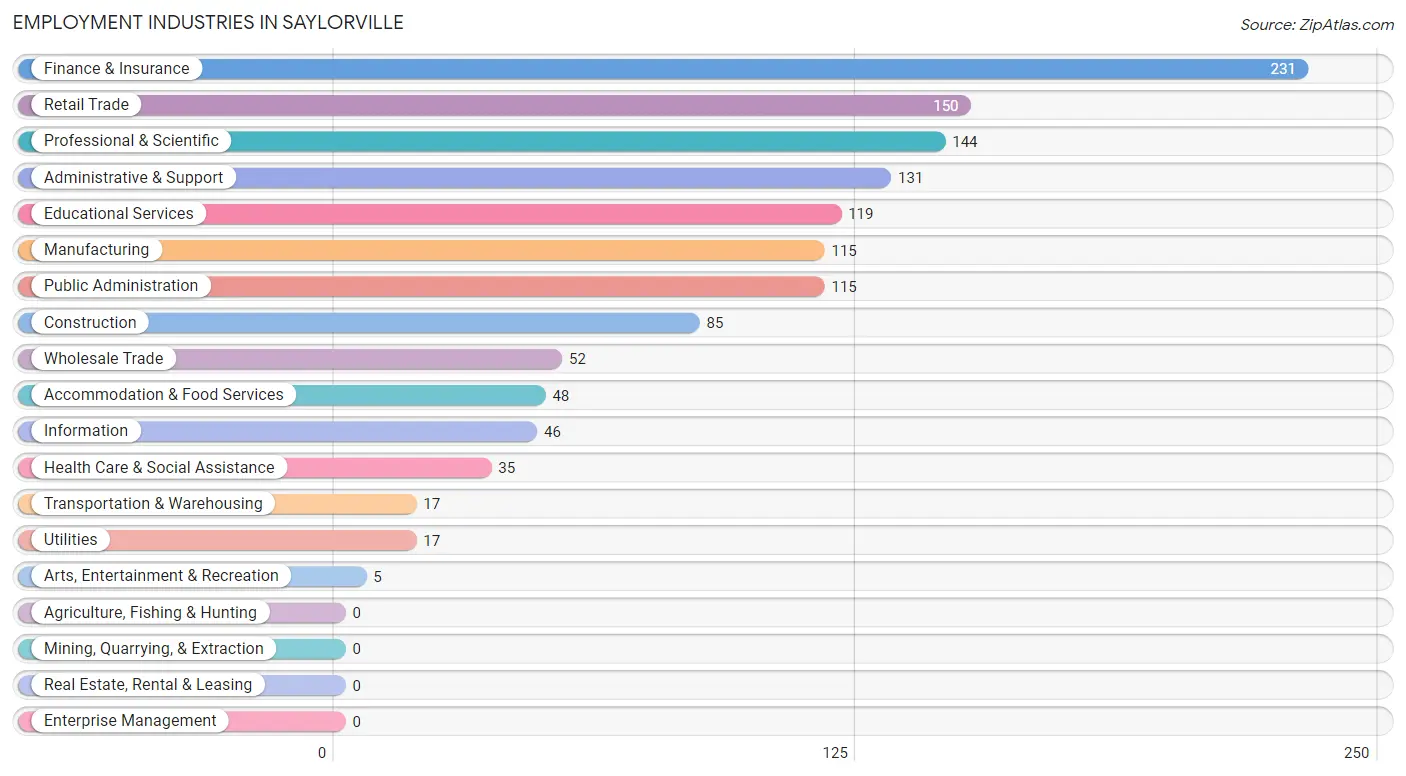
Employment Industries in Saylorville
The major employment industries in Saylorville include Finance & Insurance (231 | 16.4%), Retail Trade (150 | 10.7%), Professional & Scientific (144 | 10.2%), Administrative & Support (131 | 9.3%), and Educational Services (119 | 8.5%).
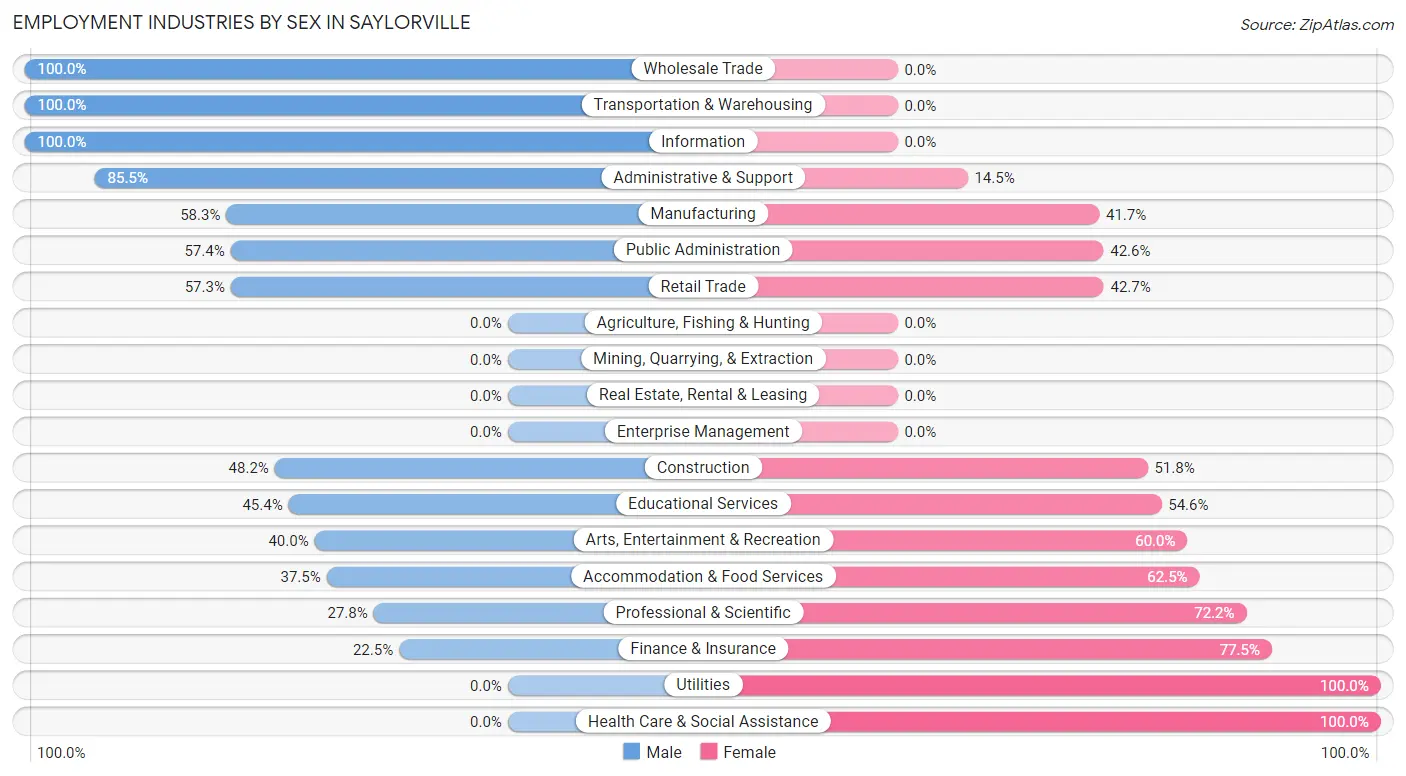
Employment Industries by Sex in Saylorville
The Saylorville industries that see more men than women are Wholesale Trade (100.0%), Transportation & Warehousing (100.0%), and Information (100.0%), whereas the industries that tend to have a higher number of women are Utilities (100.0%), Health Care & Social Assistance (100.0%), and Finance & Insurance (77.5%).
| Industry | Male | Female |
| Agriculture, Fishing & Hunting | 0 (0.0%) | 0 (0.0%) |
| Mining, Quarrying, & Extraction | 0 (0.0%) | 0 (0.0%) |
| Construction | 41 (48.2%) | 44 (51.8%) |
| Manufacturing | 67 (58.3%) | 48 (41.7%) |
| Wholesale Trade | 52 (100.0%) | 0 (0.0%) |
| Retail Trade | 86 (57.3%) | 64 (42.7%) |
| Transportation & Warehousing | 17 (100.0%) | 0 (0.0%) |
| Utilities | 0 (0.0%) | 17 (100.0%) |
| Information | 46 (100.0%) | 0 (0.0%) |
| Finance & Insurance | 52 (22.5%) | 179 (77.5%) |
| Real Estate, Rental & Leasing | 0 (0.0%) | 0 (0.0%) |
| Professional & Scientific | 40 (27.8%) | 104 (72.2%) |
| Enterprise Management | 0 (0.0%) | 0 (0.0%) |
| Administrative & Support | 112 (85.5%) | 19 (14.5%) |
| Educational Services | 54 (45.4%) | 65 (54.6%) |
| Health Care & Social Assistance | 0 (0.0%) | 35 (100.0%) |
| Arts, Entertainment & Recreation | 2 (40.0%) | 3 (60.0%) |
| Accommodation & Food Services | 18 (37.5%) | 30 (62.5%) |
| Public Administration | 66 (57.4%) | 49 (42.6%) |
| Total | 669 (47.6%) | 737 (52.4%) |
Education in Saylorville
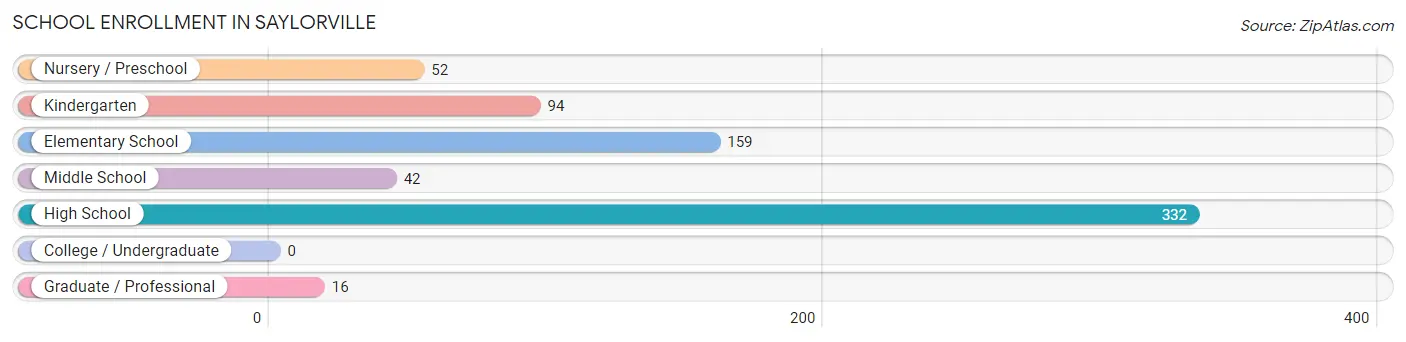
School Enrollment in Saylorville
The most common levels of schooling among the 695 students in Saylorville are high school (332 | 47.8%), elementary school (159 | 22.9%), and kindergarten (94 | 13.5%).
| School Level | # Students | % Students |
| Nursery / Preschool | 52 | 7.5% |
| Kindergarten | 94 | 13.5% |
| Elementary School | 159 | 22.9% |
| Middle School | 42 | 6.0% |
| High School | 332 | 47.8% |
| College / Undergraduate | 0 | 0.0% |
| Graduate / Professional | 16 | 2.3% |
| Total | 695 | 100.0% |
School Enrollment by Age by Funding Source in Saylorville
Out of a total of 695 students who are enrolled in schools in Saylorville, 52 (7.5%) attend a private institution, while the remaining 643 (92.5%) are enrolled in public schools. The age group of 3 to 4 year olds has the highest likelihood of being enrolled in private schools, with 52 (100.0% in the age bracket) enrolled. Conversely, the age group of 5 to 9 year old has the lowest likelihood of being enrolled in a private school, with 253 (100.0% in the age bracket) attending a public institution.
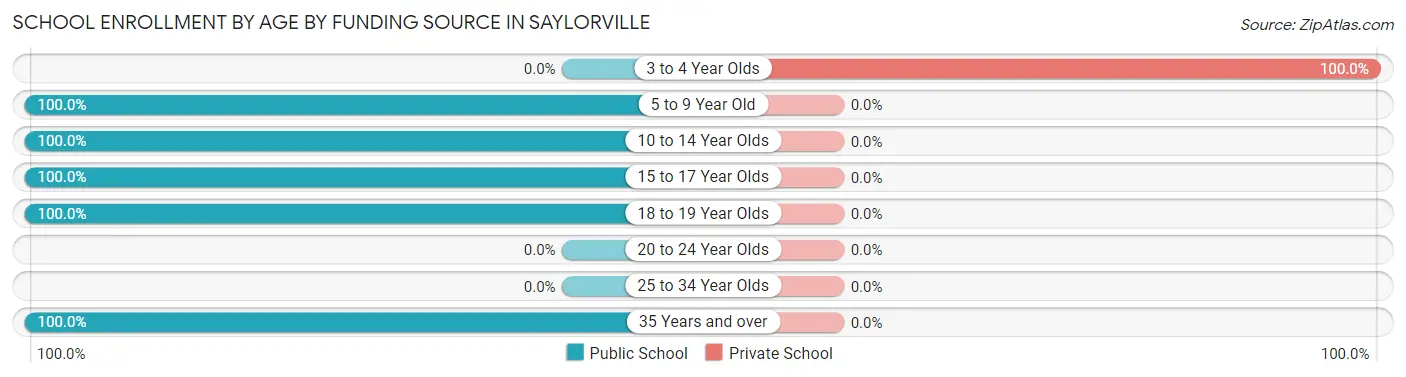
| Age Bracket | Public School | Private School |
| 3 to 4 Year Olds | 0 (0.0%) | 52 (100.0%) |
| 5 to 9 Year Old | 253 (100.0%) | 0 (0.0%) |
| 10 to 14 Year Olds | 77 (100.0%) | 0 (0.0%) |
| 15 to 17 Year Olds | 235 (100.0%) | 0 (0.0%) |
| 18 to 19 Year Olds | 62 (100.0%) | 0 (0.0%) |
| 20 to 24 Year Olds | 0 (0.0%) | 0 (0.0%) |
| 25 to 34 Year Olds | 0 (0.0%) | 0 (0.0%) |
| 35 Years and over | 16 (100.0%) | 0 (0.0%) |
| Total | 643 (92.5%) | 52 (7.5%) |
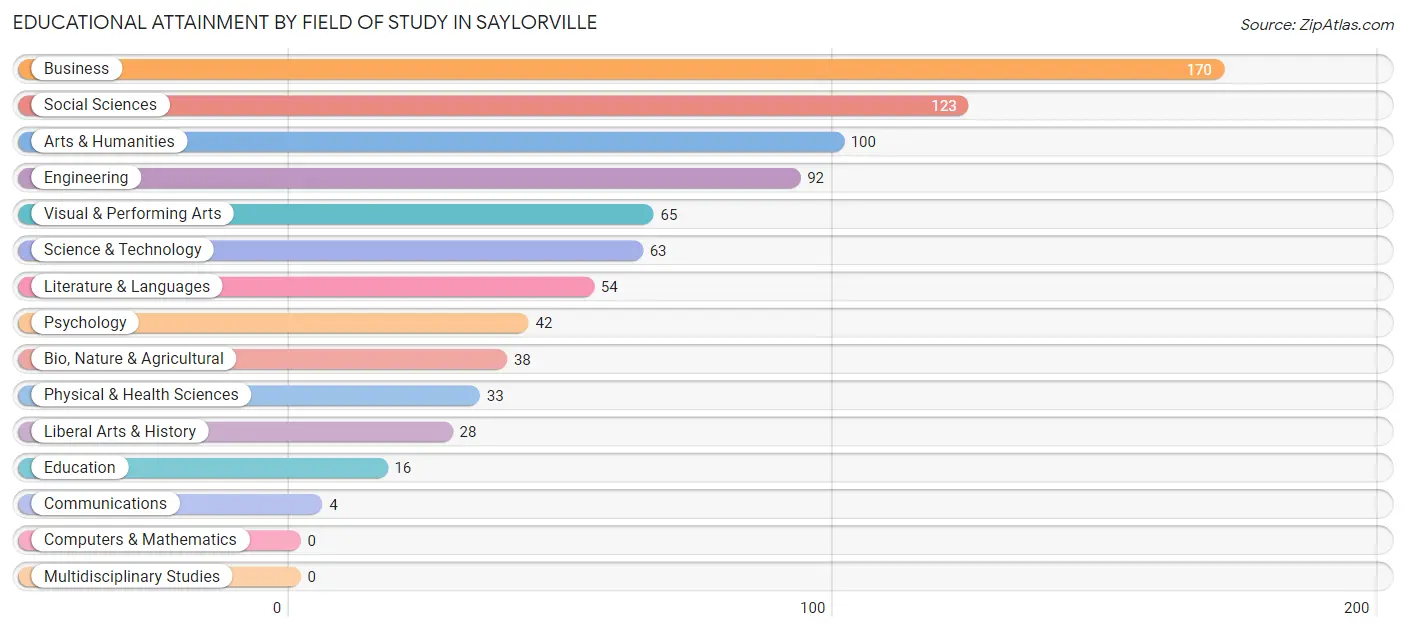
Educational Attainment by Field of Study in Saylorville
Business (170 | 20.5%), social sciences (123 | 14.9%), arts & humanities (100 | 12.1%), engineering (92 | 11.1%), and visual & performing arts (65 | 7.9%) are the most common fields of study among 828 individuals in Saylorville who have obtained a bachelor's degree or higher.
| Field of Study | # Graduates | % Graduates |
| Computers & Mathematics | 0 | 0.0% |
| Bio, Nature & Agricultural | 38 | 4.6% |
| Physical & Health Sciences | 33 | 4.0% |
| Psychology | 42 | 5.1% |
| Social Sciences | 123 | 14.9% |
| Engineering | 92 | 11.1% |
| Multidisciplinary Studies | 0 | 0.0% |
| Science & Technology | 63 | 7.6% |
| Business | 170 | 20.5% |
| Education | 16 | 1.9% |
| Literature & Languages | 54 | 6.5% |
| Liberal Arts & History | 28 | 3.4% |
| Visual & Performing Arts | 65 | 7.9% |
| Communications | 4 | 0.5% |
| Arts & Humanities | 100 | 12.1% |
| Total | 828 | 100.0% |
Transportation & Commute in Saylorville
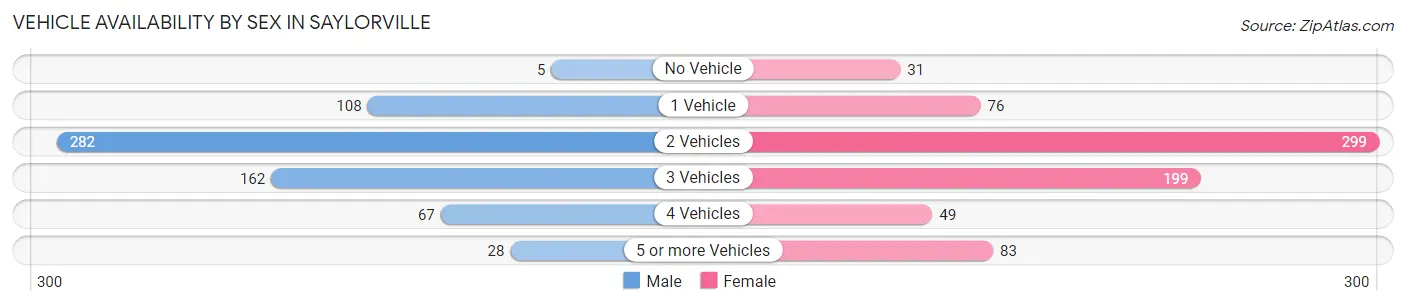
Vehicle Availability by Sex in Saylorville
The most prevalent vehicle ownership categories in Saylorville are males with 2 vehicles (282, accounting for 43.2%) and females with 2 vehicles (299, making up 38.3%).
| Vehicles Available | Male | Female |
| No Vehicle | 5 (0.8%) | 31 (4.2%) |
| 1 Vehicle | 108 (16.6%) | 76 (10.3%) |
| 2 Vehicles | 282 (43.2%) | 299 (40.6%) |
| 3 Vehicles | 162 (24.8%) | 199 (27.0%) |
| 4 Vehicles | 67 (10.3%) | 49 (6.7%) |
| 5 or more Vehicles | 28 (4.3%) | 83 (11.3%) |
| Total | 652 (100.0%) | 737 (100.0%) |
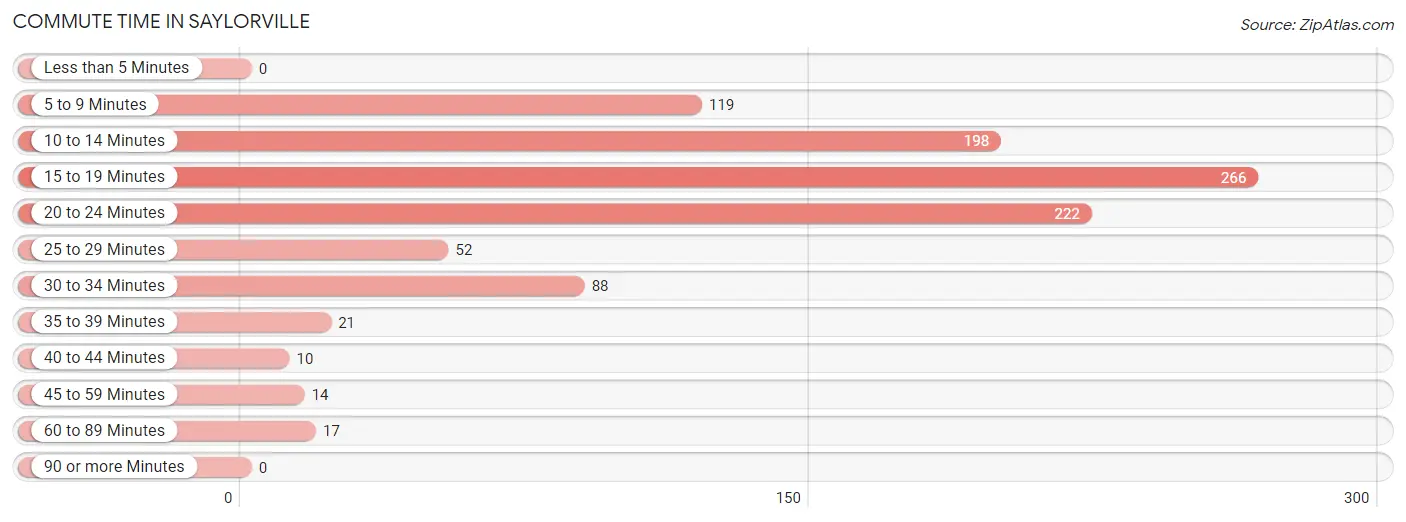
Commute Time in Saylorville
The most frequently occuring commute durations in Saylorville are 15 to 19 minutes (266 commuters, 26.4%), 20 to 24 minutes (222 commuters, 22.1%), and 10 to 14 minutes (198 commuters, 19.7%).
| Commute Time | # Commuters | % Commuters |
| Less than 5 Minutes | 0 | 0.0% |
| 5 to 9 Minutes | 119 | 11.8% |
| 10 to 14 Minutes | 198 | 19.7% |
| 15 to 19 Minutes | 266 | 26.4% |
| 20 to 24 Minutes | 222 | 22.1% |
| 25 to 29 Minutes | 52 | 5.2% |
| 30 to 34 Minutes | 88 | 8.7% |
| 35 to 39 Minutes | 21 | 2.1% |
| 40 to 44 Minutes | 10 | 1.0% |
| 45 to 59 Minutes | 14 | 1.4% |
| 60 to 89 Minutes | 17 | 1.7% |
| 90 or more Minutes | 0 | 0.0% |
Commute Time by Sex in Saylorville
The most common commute times in Saylorville are 20 to 24 minutes (196 commuters, 38.8%) for males and 10 to 14 minutes (154 commuters, 30.7%) for females.
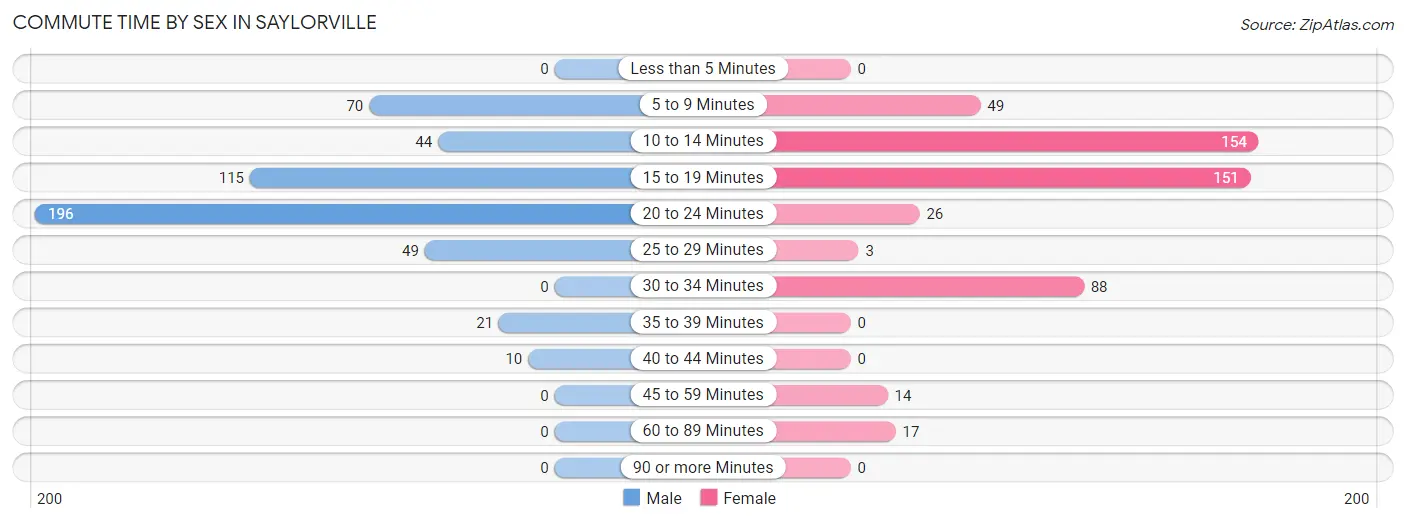
| Commute Time | Male | Female |
| Less than 5 Minutes | 0 (0.0%) | 0 (0.0%) |
| 5 to 9 Minutes | 70 (13.9%) | 49 (9.8%) |
| 10 to 14 Minutes | 44 (8.7%) | 154 (30.7%) |
| 15 to 19 Minutes | 115 (22.8%) | 151 (30.1%) |
| 20 to 24 Minutes | 196 (38.8%) | 26 (5.2%) |
| 25 to 29 Minutes | 49 (9.7%) | 3 (0.6%) |
| 30 to 34 Minutes | 0 (0.0%) | 88 (17.5%) |
| 35 to 39 Minutes | 21 (4.2%) | 0 (0.0%) |
| 40 to 44 Minutes | 10 (2.0%) | 0 (0.0%) |
| 45 to 59 Minutes | 0 (0.0%) | 14 (2.8%) |
| 60 to 89 Minutes | 0 (0.0%) | 17 (3.4%) |
| 90 or more Minutes | 0 (0.0%) | 0 (0.0%) |
Time of Departure to Work by Sex in Saylorville
The most frequent times of departure to work in Saylorville are 7:30 AM to 7:59 AM (190, 37.6%) for males and 7:00 AM to 7:29 AM (148, 29.5%) for females.
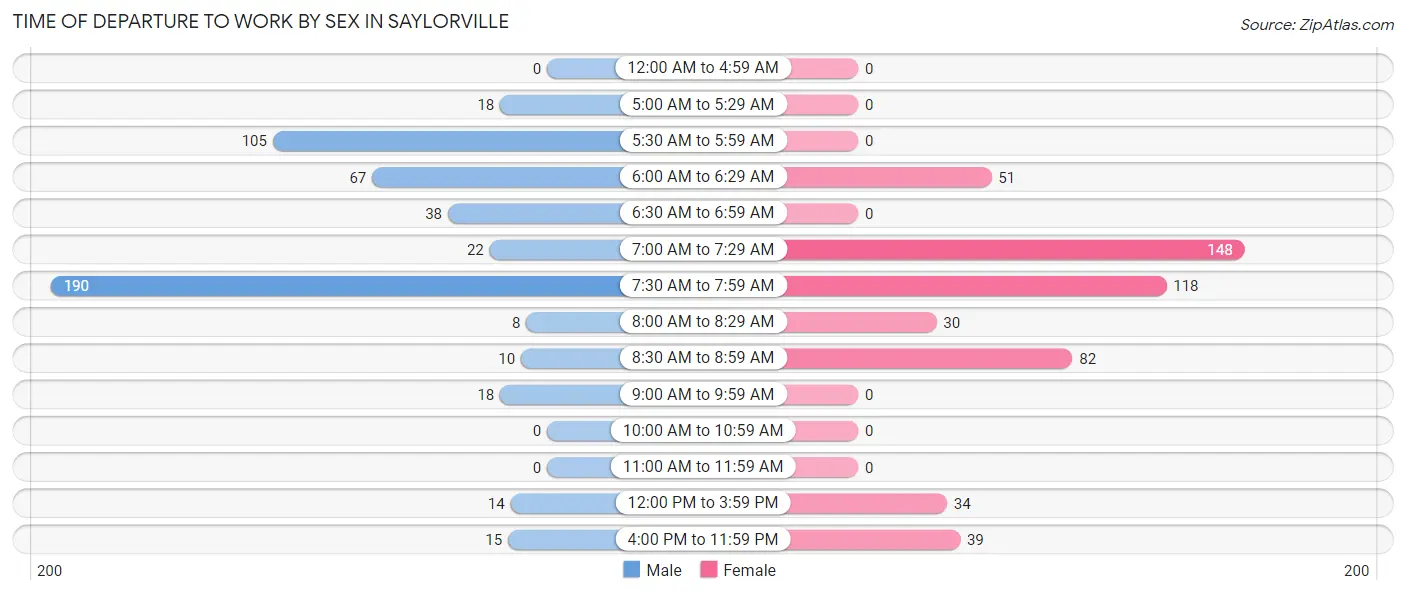
| Time of Departure | Male | Female |
| 12:00 AM to 4:59 AM | 0 (0.0%) | 0 (0.0%) |
| 5:00 AM to 5:29 AM | 18 (3.6%) | 0 (0.0%) |
| 5:30 AM to 5:59 AM | 105 (20.8%) | 0 (0.0%) |
| 6:00 AM to 6:29 AM | 67 (13.3%) | 51 (10.2%) |
| 6:30 AM to 6:59 AM | 38 (7.5%) | 0 (0.0%) |
| 7:00 AM to 7:29 AM | 22 (4.4%) | 148 (29.5%) |
| 7:30 AM to 7:59 AM | 190 (37.6%) | 118 (23.5%) |
| 8:00 AM to 8:29 AM | 8 (1.6%) | 30 (6.0%) |
| 8:30 AM to 8:59 AM | 10 (2.0%) | 82 (16.3%) |
| 9:00 AM to 9:59 AM | 18 (3.6%) | 0 (0.0%) |
| 10:00 AM to 10:59 AM | 0 (0.0%) | 0 (0.0%) |
| 11:00 AM to 11:59 AM | 0 (0.0%) | 0 (0.0%) |
| 12:00 PM to 3:59 PM | 14 (2.8%) | 34 (6.8%) |
| 4:00 PM to 11:59 PM | 15 (3.0%) | 39 (7.8%) |
| Total | 505 (100.0%) | 502 (100.0%) |
Housing Occupancy in Saylorville
Occupancy by Ownership in Saylorville
Of the total 1,228 dwellings in Saylorville, owner-occupied units account for 1,065 (86.7%), while renter-occupied units make up 163 (13.3%).
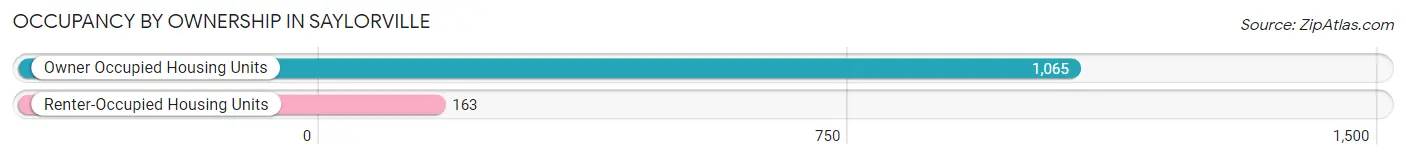
| Occupancy | # Housing Units | % Housing Units |
| Owner Occupied Housing Units | 1,065 | 86.7% |
| Renter-Occupied Housing Units | 163 | 13.3% |
| Total Occupied Housing Units | 1,228 | 100.0% |
Occupancy by Household Size in Saylorville
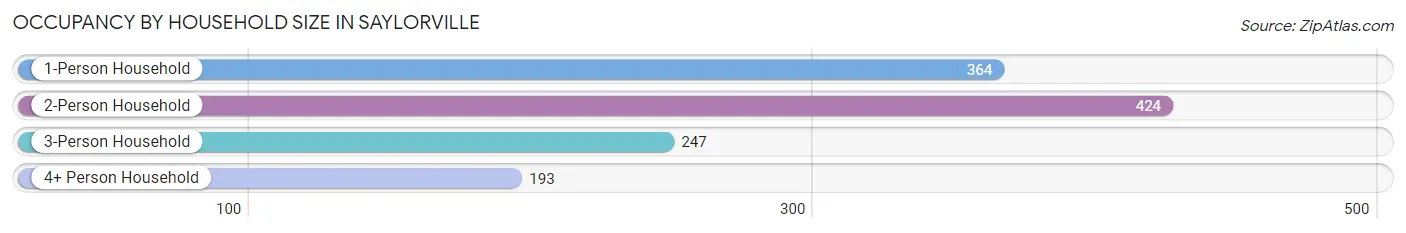
| Household Size | # Housing Units | % Housing Units |
| 1-Person Household | 364 | 29.6% |
| 2-Person Household | 424 | 34.5% |
| 3-Person Household | 247 | 20.1% |
| 4+ Person Household | 193 | 15.7% |
| Total Housing Units | 1,228 | 100.0% |
Occupancy by Ownership by Household Size in Saylorville
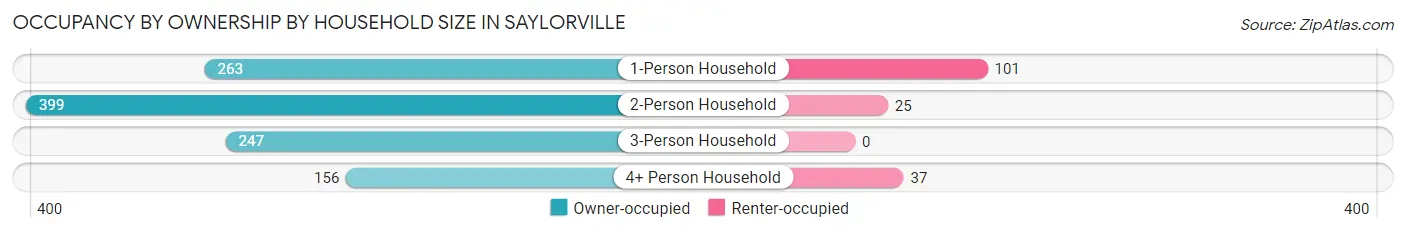
| Household Size | Owner-occupied | Renter-occupied |
| 1-Person Household | 263 (72.3%) | 101 (27.8%) |
| 2-Person Household | 399 (94.1%) | 25 (5.9%) |
| 3-Person Household | 247 (100.0%) | 0 (0.0%) |
| 4+ Person Household | 156 (80.8%) | 37 (19.2%) |
| Total Housing Units | 1,065 (86.7%) | 163 (13.3%) |
Occupancy by Educational Attainment in Saylorville
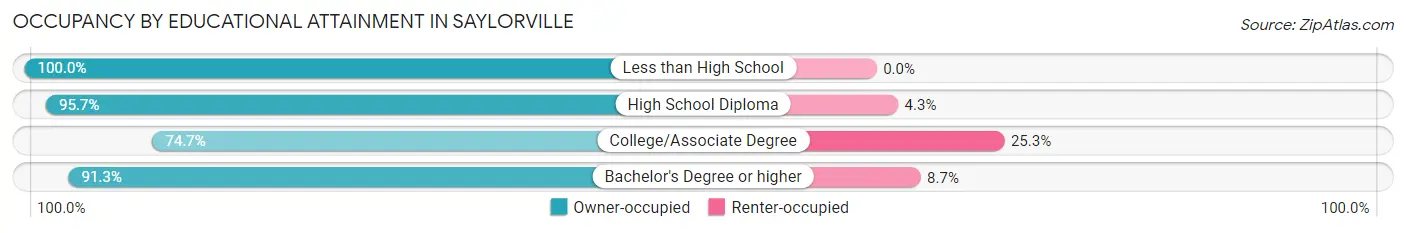
| Household Size | Owner-occupied | Renter-occupied |
| Less than High School | 38 (100.0%) | 0 (0.0%) |
| High School Diploma | 292 (95.7%) | 13 (4.3%) |
| College/Associate Degree | 327 (74.7%) | 111 (25.3%) |
| Bachelor's Degree or higher | 408 (91.3%) | 39 (8.7%) |
Occupancy by Age of Householder in Saylorville
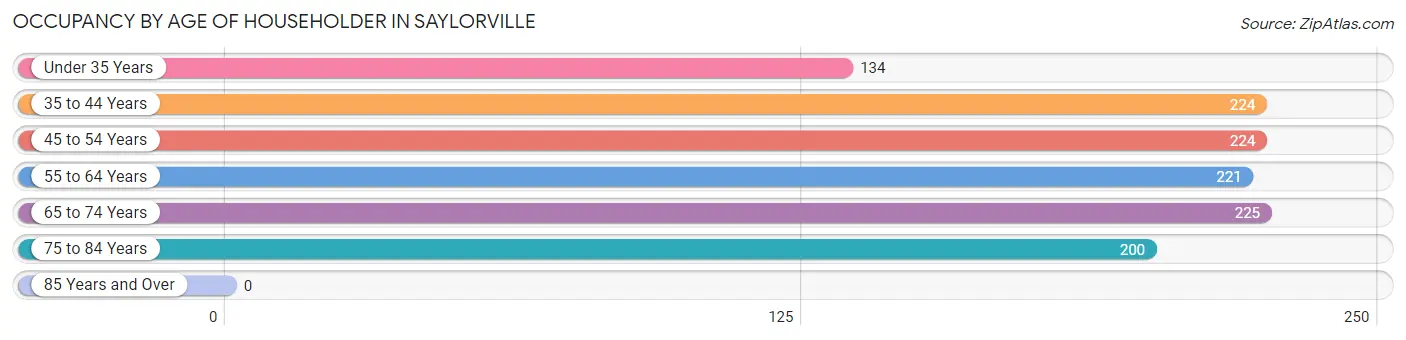
| Age Bracket | # Households | % Households |
| Under 35 Years | 134 | 10.9% |
| 35 to 44 Years | 224 | 18.2% |
| 45 to 54 Years | 224 | 18.2% |
| 55 to 64 Years | 221 | 18.0% |
| 65 to 74 Years | 225 | 18.3% |
| 75 to 84 Years | 200 | 16.3% |
| 85 Years and Over | 0 | 0.0% |
| Total | 1,228 | 100.0% |
Housing Finances in Saylorville
Median Income by Occupancy in Saylorville
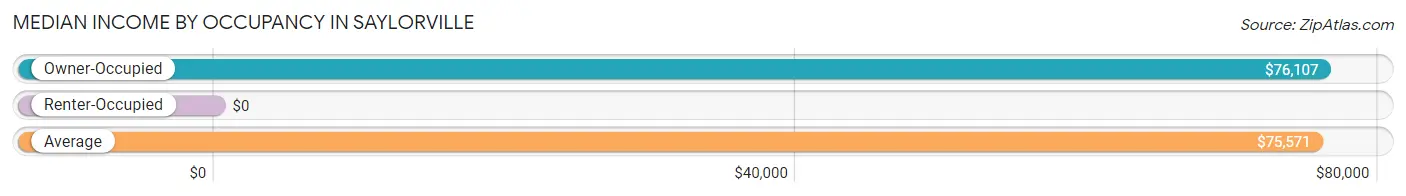
| Occupancy Type | # Households | Median Income |
| Owner-Occupied | 1,065 (86.7%) | $76,107 |
| Renter-Occupied | 163 (13.3%) | $0 |
| Average | 1,228 (100.0%) | $75,571 |
Occupancy by Householder Income Bracket in Saylorville
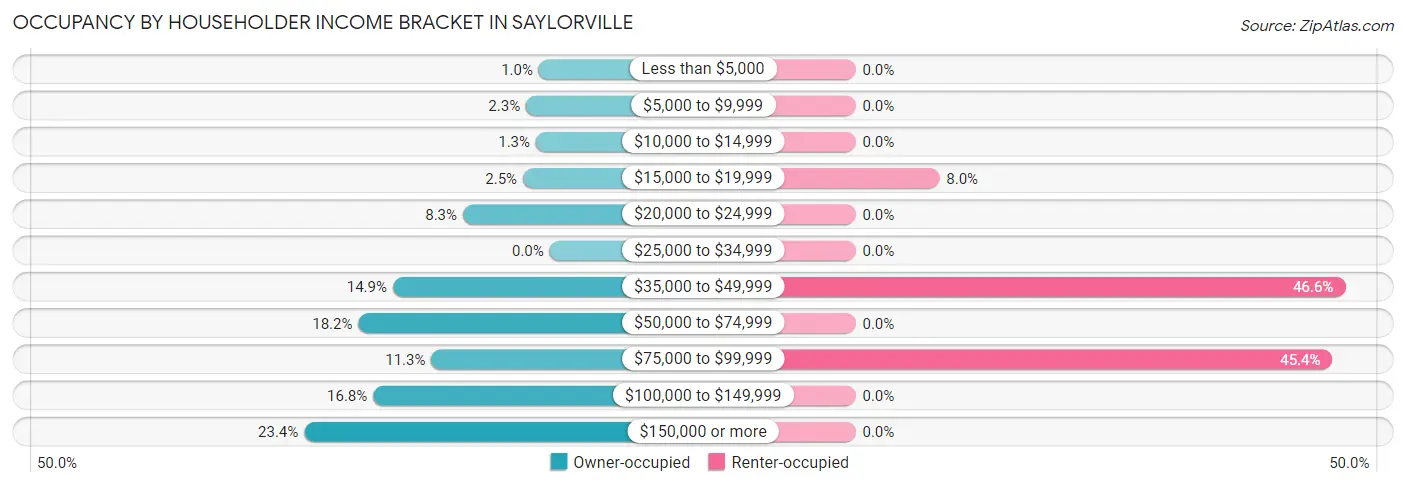
| Income Bracket | Owner-occupied | Renter-occupied |
| Less than $5,000 | 11 (1.0%) | 0 (0.0%) |
| $5,000 to $9,999 | 24 (2.2%) | 0 (0.0%) |
| $10,000 to $14,999 | 14 (1.3%) | 0 (0.0%) |
| $15,000 to $19,999 | 27 (2.5%) | 13 (8.0%) |
| $20,000 to $24,999 | 88 (8.3%) | 0 (0.0%) |
| $25,000 to $34,999 | 0 (0.0%) | 0 (0.0%) |
| $35,000 to $49,999 | 159 (14.9%) | 76 (46.6%) |
| $50,000 to $74,999 | 194 (18.2%) | 0 (0.0%) |
| $75,000 to $99,999 | 120 (11.3%) | 74 (45.4%) |
| $100,000 to $149,999 | 179 (16.8%) | 0 (0.0%) |
| $150,000 or more | 249 (23.4%) | 0 (0.0%) |
| Total | 1,065 (100.0%) | 163 (100.0%) |
Monthly Housing Cost Tiers in Saylorville
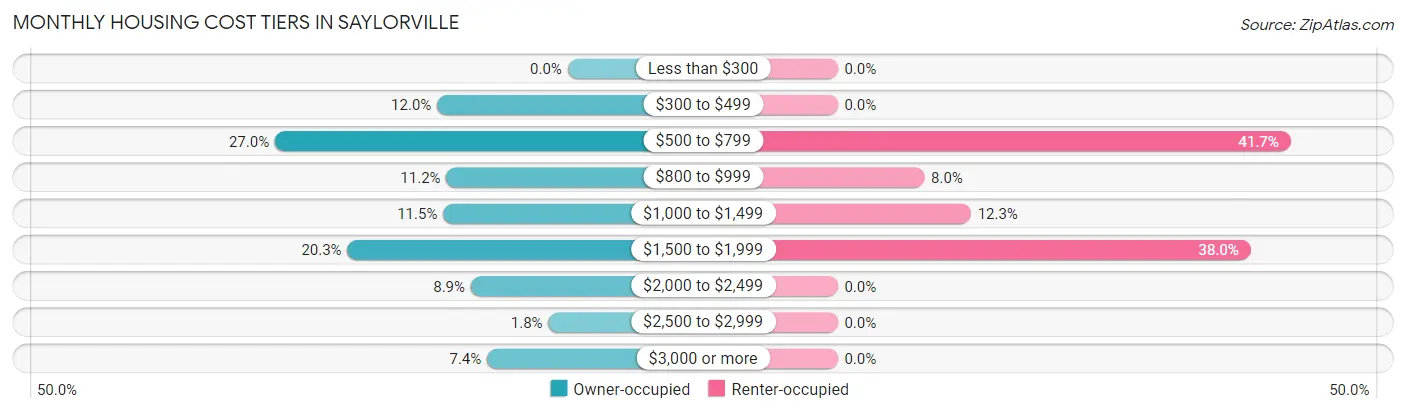
| Monthly Cost | Owner-occupied | Renter-occupied |
| Less than $300 | 0 (0.0%) | 0 (0.0%) |
| $300 to $499 | 128 (12.0%) | 0 (0.0%) |
| $500 to $799 | 287 (27.0%) | 68 (41.7%) |
| $800 to $999 | 119 (11.2%) | 13 (8.0%) |
| $1,000 to $1,499 | 122 (11.5%) | 20 (12.3%) |
| $1,500 to $1,999 | 216 (20.3%) | 62 (38.0%) |
| $2,000 to $2,499 | 95 (8.9%) | 0 (0.0%) |
| $2,500 to $2,999 | 19 (1.8%) | 0 (0.0%) |
| $3,000 or more | 79 (7.4%) | 0 (0.0%) |
| Total | 1,065 (100.0%) | 163 (100.0%) |
Physical Housing Characteristics in Saylorville
Housing Structures in Saylorville
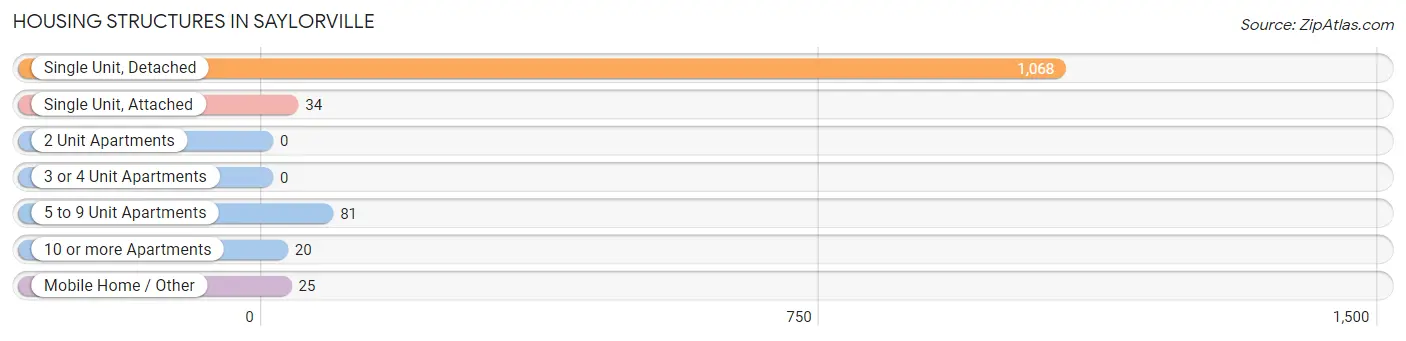
| Structure Type | # Housing Units | % Housing Units |
| Single Unit, Detached | 1,068 | 87.0% |
| Single Unit, Attached | 34 | 2.8% |
| 2 Unit Apartments | 0 | 0.0% |
| 3 or 4 Unit Apartments | 0 | 0.0% |
| 5 to 9 Unit Apartments | 81 | 6.6% |
| 10 or more Apartments | 20 | 1.6% |
| Mobile Home / Other | 25 | 2.0% |
| Total | 1,228 | 100.0% |
Housing Structures by Occupancy in Saylorville
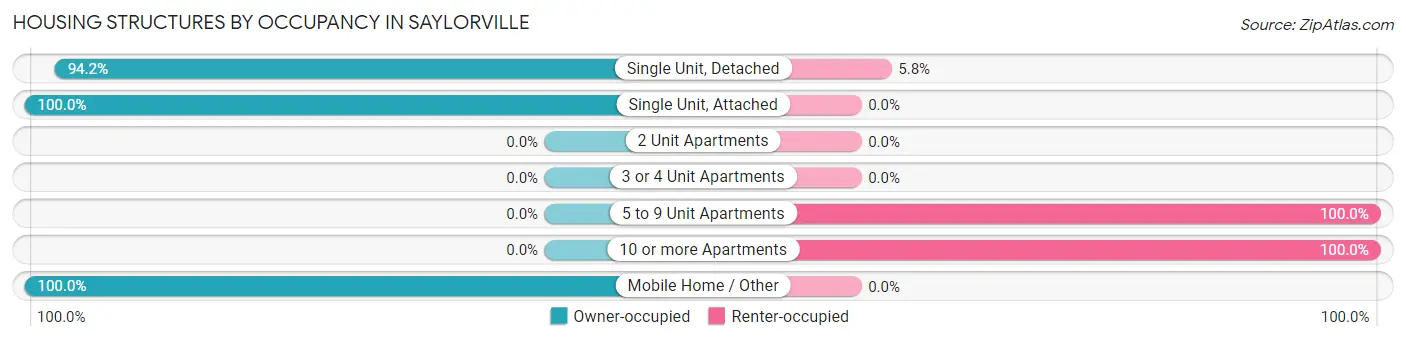
| Structure Type | Owner-occupied | Renter-occupied |
| Single Unit, Detached | 1,006 (94.2%) | 62 (5.8%) |
| Single Unit, Attached | 34 (100.0%) | 0 (0.0%) |
| 2 Unit Apartments | 0 (0.0%) | 0 (0.0%) |
| 3 or 4 Unit Apartments | 0 (0.0%) | 0 (0.0%) |
| 5 to 9 Unit Apartments | 0 (0.0%) | 81 (100.0%) |
| 10 or more Apartments | 0 (0.0%) | 20 (100.0%) |
| Mobile Home / Other | 25 (100.0%) | 0 (0.0%) |
| Total | 1,065 (86.7%) | 163 (13.3%) |
Housing Structures by Number of Rooms in Saylorville
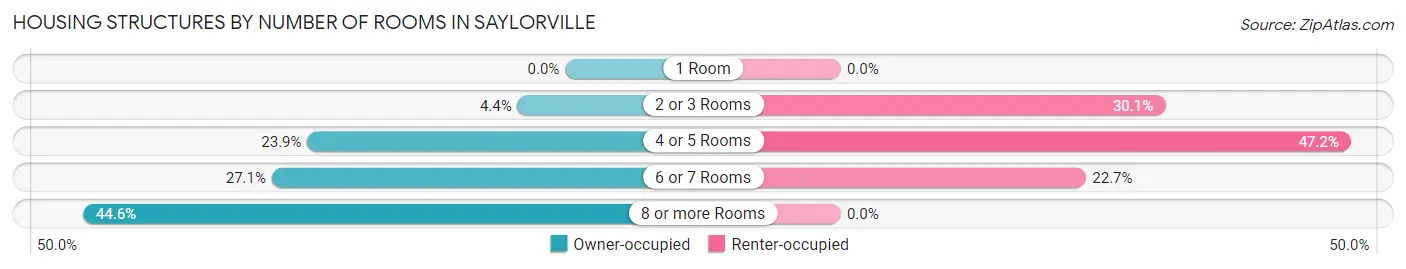
| Number of Rooms | Owner-occupied | Renter-occupied |
| 1 Room | 0 (0.0%) | 0 (0.0%) |
| 2 or 3 Rooms | 47 (4.4%) | 49 (30.1%) |
| 4 or 5 Rooms | 254 (23.8%) | 77 (47.2%) |
| 6 or 7 Rooms | 289 (27.1%) | 37 (22.7%) |
| 8 or more Rooms | 475 (44.6%) | 0 (0.0%) |
| Total | 1,065 (100.0%) | 163 (100.0%) |
Housing Structure by Heating Type in Saylorville
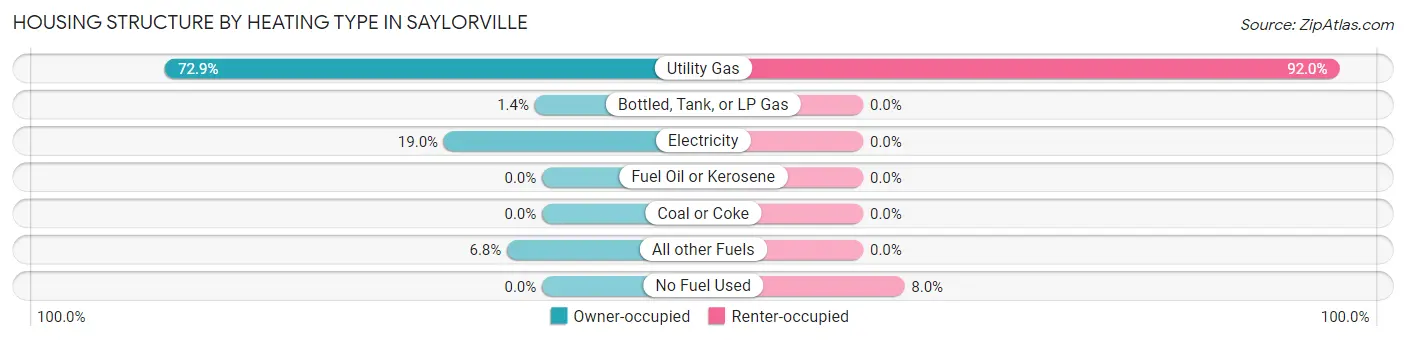
| Heating Type | Owner-occupied | Renter-occupied |
| Utility Gas | 776 (72.9%) | 150 (92.0%) |
| Bottled, Tank, or LP Gas | 15 (1.4%) | 0 (0.0%) |
| Electricity | 202 (19.0%) | 0 (0.0%) |
| Fuel Oil or Kerosene | 0 (0.0%) | 0 (0.0%) |
| Coal or Coke | 0 (0.0%) | 0 (0.0%) |
| All other Fuels | 72 (6.8%) | 0 (0.0%) |
| No Fuel Used | 0 (0.0%) | 13 (8.0%) |
| Total | 1,065 (100.0%) | 163 (100.0%) |
Household Vehicle Usage in Saylorville
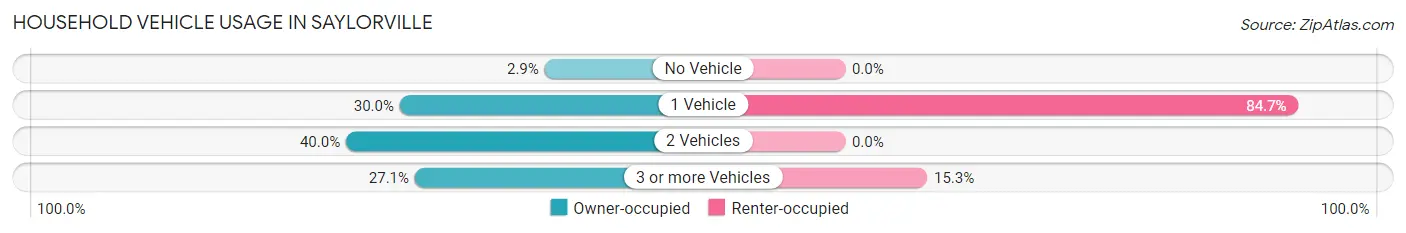
| Vehicles per Household | Owner-occupied | Renter-occupied |
| No Vehicle | 31 (2.9%) | 0 (0.0%) |
| 1 Vehicle | 319 (29.9%) | 138 (84.7%) |
| 2 Vehicles | 426 (40.0%) | 0 (0.0%) |
| 3 or more Vehicles | 289 (27.1%) | 25 (15.3%) |
| Total | 1,065 (100.0%) | 163 (100.0%) |
Real Estate & Mortgages in Saylorville
Real Estate and Mortgage Overview in Saylorville
| Characteristic | Without Mortgage | With Mortgage |
| Housing Units | 564 | 501 |
| Median Property Value | $298,300 | $247,400 |
| Median Household Income | $63,831 | $144 |
| Monthly Housing Costs | $729 | $79 |
| Real Estate Taxes | $3,939 | $0 |
Property Value by Mortgage Status in Saylorville
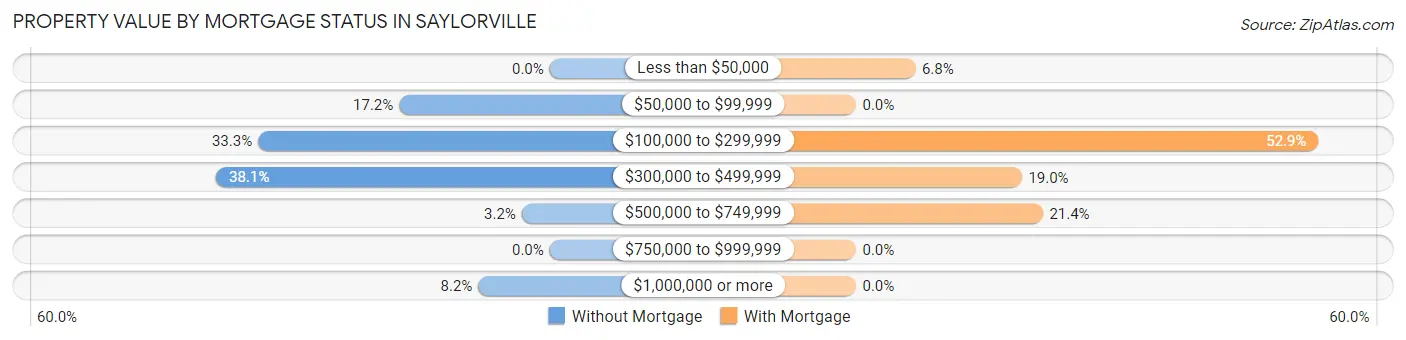
| Property Value | Without Mortgage | With Mortgage |
| Less than $50,000 | 0 (0.0%) | 34 (6.8%) |
| $50,000 to $99,999 | 97 (17.2%) | 0 (0.0%) |
| $100,000 to $299,999 | 188 (33.3%) | 265 (52.9%) |
| $300,000 to $499,999 | 215 (38.1%) | 95 (19.0%) |
| $500,000 to $749,999 | 18 (3.2%) | 107 (21.4%) |
| $750,000 to $999,999 | 0 (0.0%) | 0 (0.0%) |
| $1,000,000 or more | 46 (8.2%) | 0 (0.0%) |
| Total | 564 (100.0%) | 501 (100.0%) |
Household Income by Mortgage Status in Saylorville
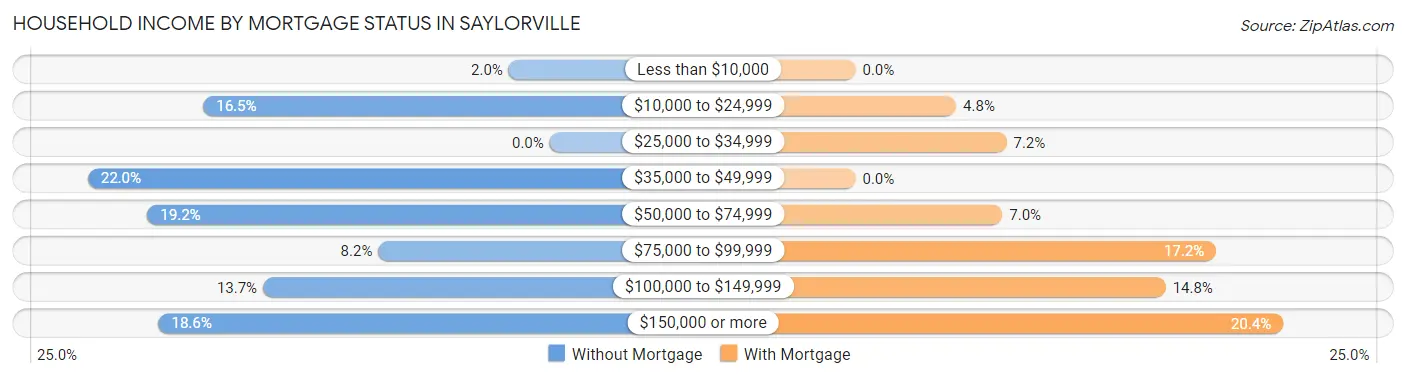
| Household Income | Without Mortgage | With Mortgage |
| Less than $10,000 | 11 (1.9%) | 0 (0.0%) |
| $10,000 to $24,999 | 93 (16.5%) | 24 (4.8%) |
| $25,000 to $34,999 | 0 (0.0%) | 36 (7.2%) |
| $35,000 to $49,999 | 124 (22.0%) | 0 (0.0%) |
| $50,000 to $74,999 | 108 (19.2%) | 35 (7.0%) |
| $75,000 to $99,999 | 46 (8.2%) | 86 (17.2%) |
| $100,000 to $149,999 | 77 (13.7%) | 74 (14.8%) |
| $150,000 or more | 105 (18.6%) | 102 (20.4%) |
| Total | 564 (100.0%) | 501 (100.0%) |
Property Value to Household Income Ratio in Saylorville
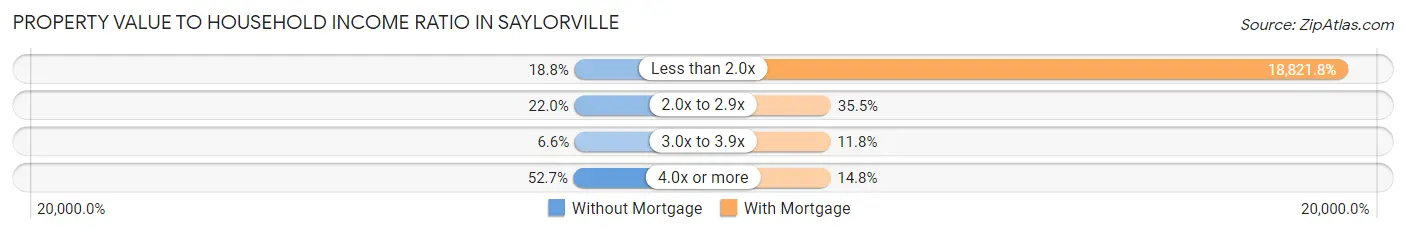
| Value-to-Income Ratio | Without Mortgage | With Mortgage |
| Less than 2.0x | 106 (18.8%) | 94,297 (18,821.8%) |
| 2.0x to 2.9x | 124 (22.0%) | 178 (35.5%) |
| 3.0x to 3.9x | 37 (6.6%) | 59 (11.8%) |
| 4.0x or more | 297 (52.7%) | 74 (14.8%) |
| Total | 564 (100.0%) | 501 (100.0%) |
Real Estate Taxes by Mortgage Status in Saylorville
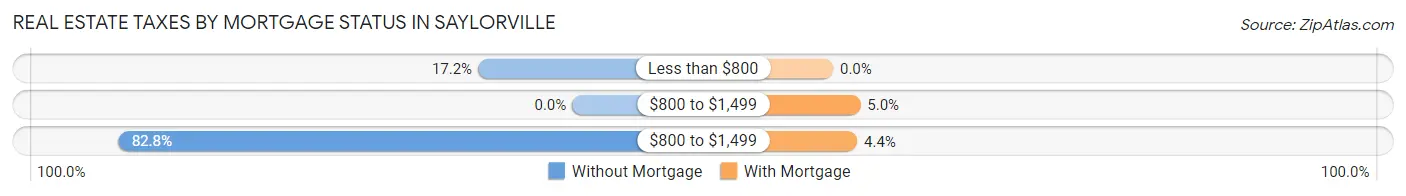
| Property Taxes | Without Mortgage | With Mortgage |
| Less than $800 | 97 (17.2%) | 0 (0.0%) |
| $800 to $1,499 | 0 (0.0%) | 25 (5.0%) |
| $800 to $1,499 | 467 (82.8%) | 22 (4.4%) |
| Total | 564 (100.0%) | 501 (100.0%) |
Health & Disability in Saylorville
Health Insurance Coverage by Age in Saylorville
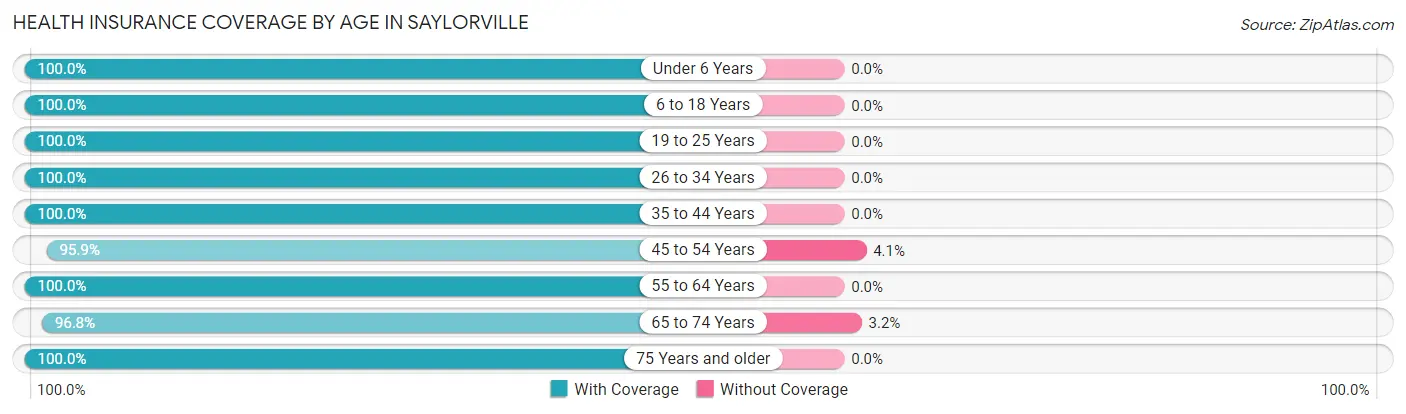
| Age Bracket | With Coverage | Without Coverage |
| Under 6 Years | 276 (100.0%) | 0 (0.0%) |
| 6 to 18 Years | 547 (100.0%) | 0 (0.0%) |
| 19 to 25 Years | 13 (100.0%) | 0 (0.0%) |
| 26 to 34 Years | 195 (100.0%) | 0 (0.0%) |
| 35 to 44 Years | 352 (100.0%) | 0 (0.0%) |
| 45 to 54 Years | 399 (95.9%) | 17 (4.1%) |
| 55 to 64 Years | 314 (100.0%) | 0 (0.0%) |
| 65 to 74 Years | 451 (96.8%) | 15 (3.2%) |
| 75 Years and older | 258 (100.0%) | 0 (0.0%) |
| Total | 2,805 (98.9%) | 32 (1.1%) |
Health Insurance Coverage by Citizenship Status in Saylorville

| Citizenship Status | With Coverage | Without Coverage |
| Native Born | 276 (100.0%) | 0 (0.0%) |
| Foreign Born, Citizen | 547 (100.0%) | 0 (0.0%) |
| Foreign Born, not a Citizen | 13 (100.0%) | 0 (0.0%) |
Health Insurance Coverage by Household Income in Saylorville
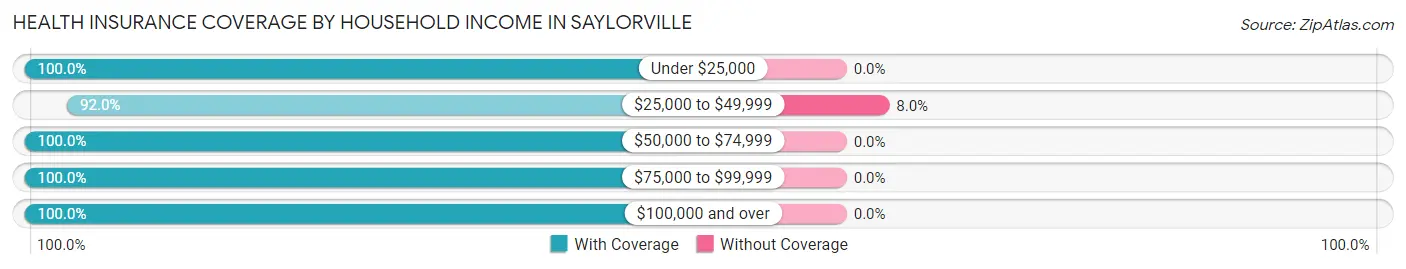
| Household Income | With Coverage | Without Coverage |
| Under $25,000 | 279 (100.0%) | 0 (0.0%) |
| $25,000 to $49,999 | 369 (92.0%) | 32 (8.0%) |
| $50,000 to $74,999 | 539 (100.0%) | 0 (0.0%) |
| $75,000 to $99,999 | 445 (100.0%) | 0 (0.0%) |
| $100,000 and over | 1,173 (100.0%) | 0 (0.0%) |
Public vs Private Health Insurance Coverage by Age in Saylorville
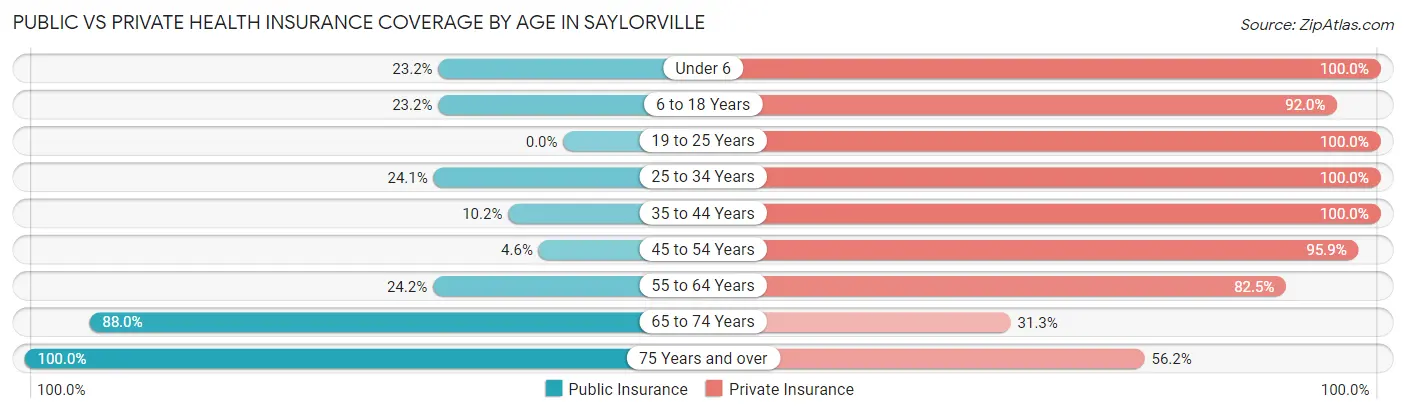
| Age Bracket | Public Insurance | Private Insurance |
| Under 6 | 64 (23.2%) | 276 (100.0%) |
| 6 to 18 Years | 127 (23.2%) | 503 (92.0%) |
| 19 to 25 Years | 0 (0.0%) | 13 (100.0%) |
| 25 to 34 Years | 47 (24.1%) | 195 (100.0%) |
| 35 to 44 Years | 36 (10.2%) | 352 (100.0%) |
| 45 to 54 Years | 19 (4.6%) | 399 (95.9%) |
| 55 to 64 Years | 76 (24.2%) | 259 (82.5%) |
| 65 to 74 Years | 410 (88.0%) | 146 (31.3%) |
| 75 Years and over | 258 (100.0%) | 145 (56.2%) |
| Total | 1,037 (36.5%) | 2,288 (80.6%) |
Disability Status by Sex by Age in Saylorville
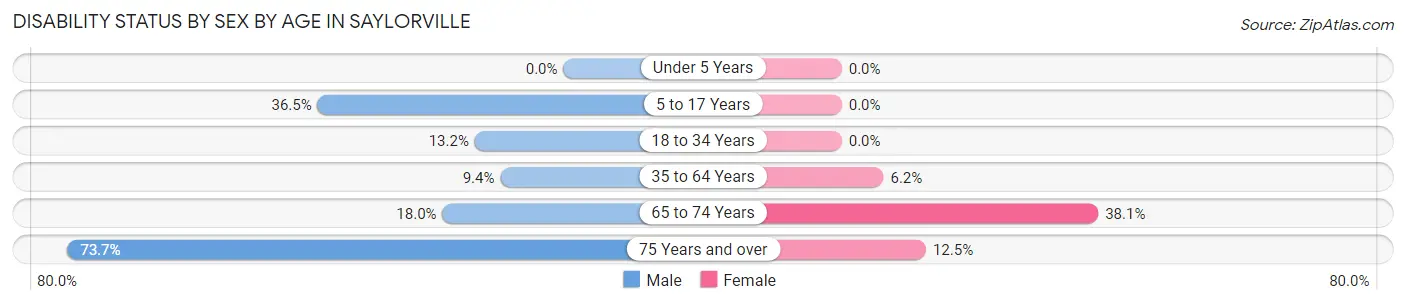
| Age Bracket | Male | Female |
| Under 5 Years | 0 (0.0%) | 0 (0.0%) |
| 5 to 17 Years | 100 (36.5%) | 0 (0.0%) |
| 18 to 34 Years | 15 (13.2%) | 0 (0.0%) |
| 35 to 64 Years | 50 (9.4%) | 34 (6.2%) |
| 65 to 74 Years | 37 (18.0%) | 99 (38.1%) |
| 75 Years and over | 137 (73.7%) | 9 (12.5%) |
Disability Class by Sex by Age in Saylorville
Disability Class: Hearing Difficulty
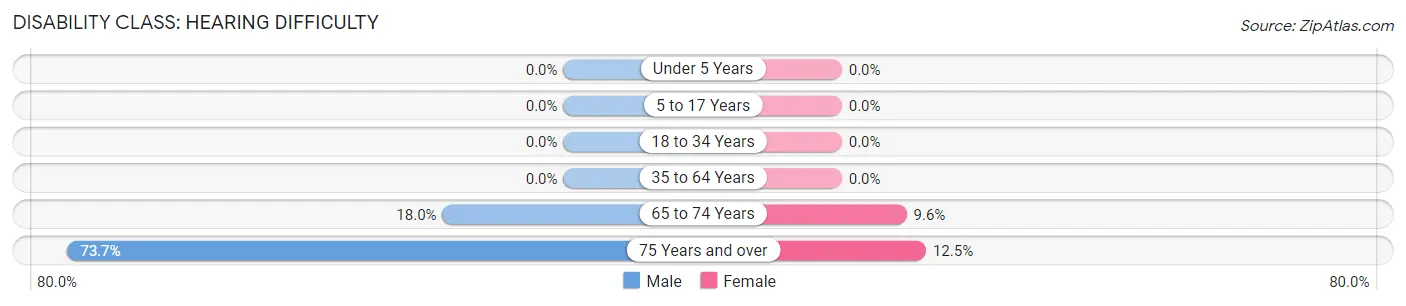
| Age Bracket | Male | Female |
| Under 5 Years | 0 (0.0%) | 0 (0.0%) |
| 5 to 17 Years | 0 (0.0%) | 0 (0.0%) |
| 18 to 34 Years | 0 (0.0%) | 0 (0.0%) |
| 35 to 64 Years | 0 (0.0%) | 0 (0.0%) |
| 65 to 74 Years | 37 (18.0%) | 25 (9.6%) |
| 75 Years and over | 137 (73.7%) | 9 (12.5%) |
Disability Class: Vision Difficulty
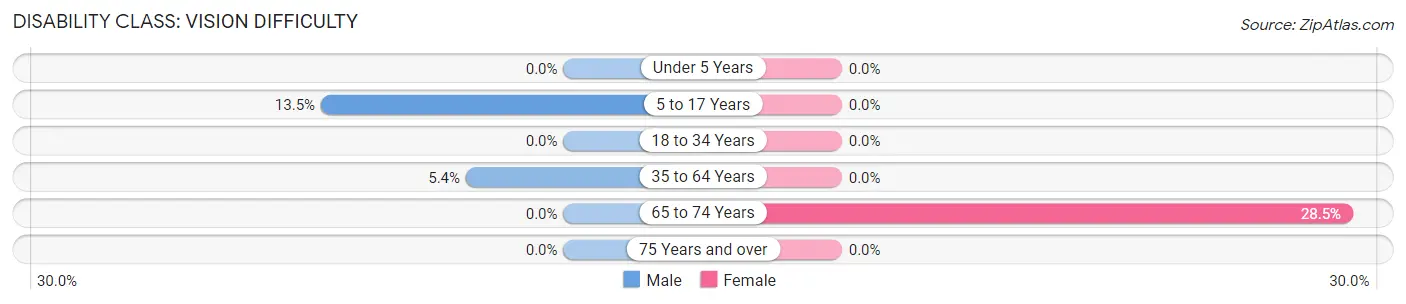
| Age Bracket | Male | Female |
| Under 5 Years | 0 (0.0%) | 0 (0.0%) |
| 5 to 17 Years | 37 (13.5%) | 0 (0.0%) |
| 18 to 34 Years | 0 (0.0%) | 0 (0.0%) |
| 35 to 64 Years | 29 (5.4%) | 0 (0.0%) |
| 65 to 74 Years | 0 (0.0%) | 74 (28.5%) |
| 75 Years and over | 0 (0.0%) | 0 (0.0%) |
Disability Class: Cognitive Difficulty
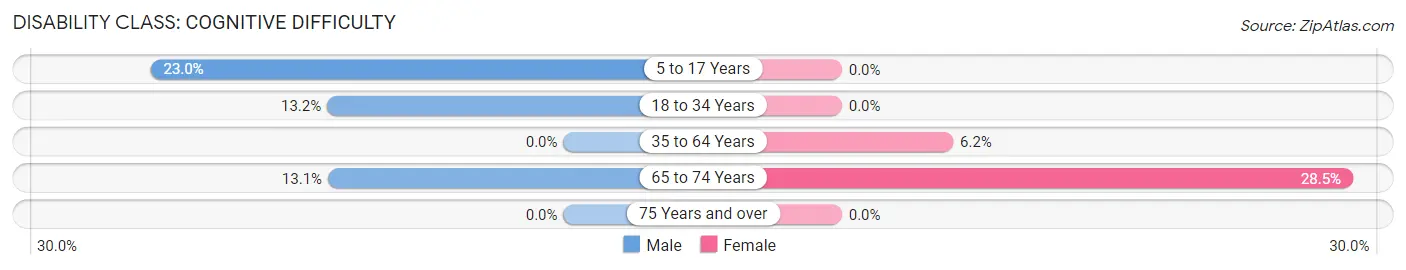
| Age Bracket | Male | Female |
| 5 to 17 Years | 63 (23.0%) | 0 (0.0%) |
| 18 to 34 Years | 15 (13.2%) | 0 (0.0%) |
| 35 to 64 Years | 0 (0.0%) | 34 (6.2%) |
| 65 to 74 Years | 27 (13.1%) | 74 (28.5%) |
| 75 Years and over | 0 (0.0%) | 0 (0.0%) |
Disability Class: Ambulatory Difficulty
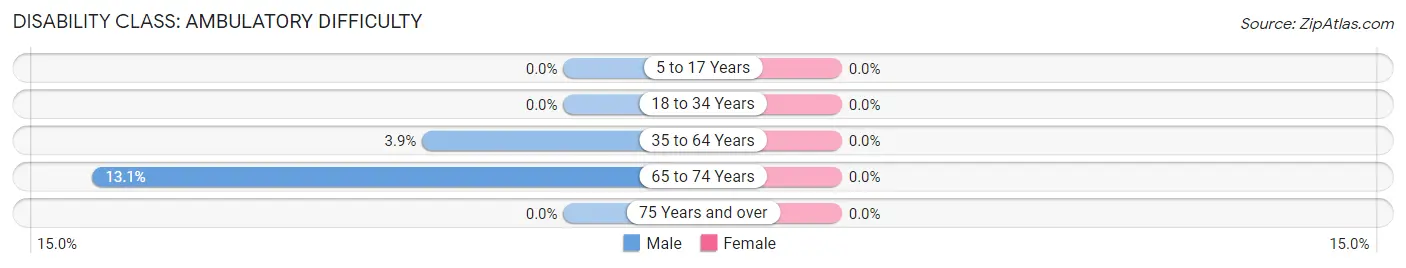
| Age Bracket | Male | Female |
| 5 to 17 Years | 0 (0.0%) | 0 (0.0%) |
| 18 to 34 Years | 0 (0.0%) | 0 (0.0%) |
| 35 to 64 Years | 21 (3.9%) | 0 (0.0%) |
| 65 to 74 Years | 27 (13.1%) | 0 (0.0%) |
| 75 Years and over | 0 (0.0%) | 0 (0.0%) |
Disability Class: Self-Care Difficulty
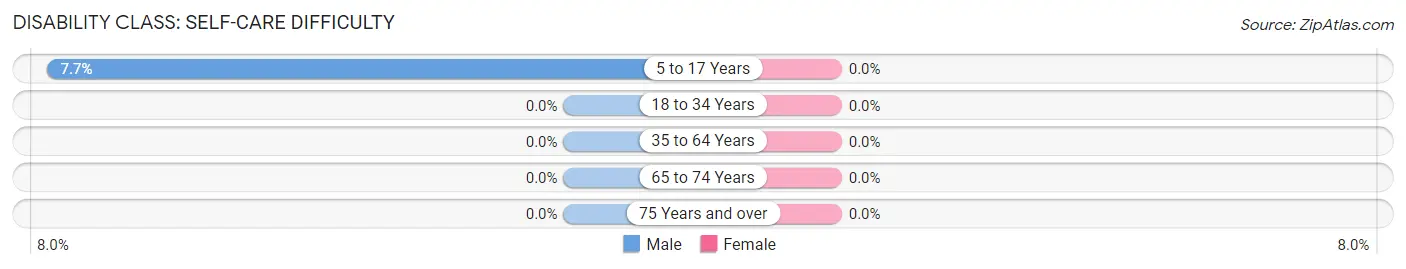
| Age Bracket | Male | Female |
| 5 to 17 Years | 21 (7.7%) | 0 (0.0%) |
| 18 to 34 Years | 0 (0.0%) | 0 (0.0%) |
| 35 to 64 Years | 0 (0.0%) | 0 (0.0%) |
| 65 to 74 Years | 0 (0.0%) | 0 (0.0%) |
| 75 Years and over | 0 (0.0%) | 0 (0.0%) |
Technology Access in Saylorville
Computing Device Access in Saylorville
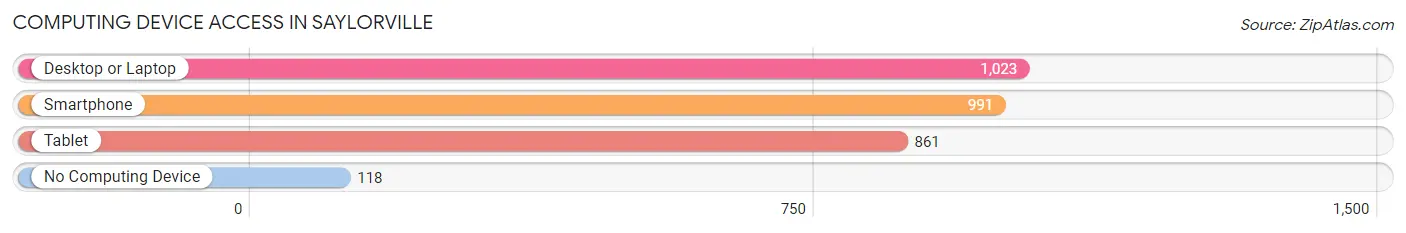
| Device Type | # Households | % Households |
| Desktop or Laptop | 1,023 | 83.3% |
| Smartphone | 991 | 80.7% |
| Tablet | 861 | 70.1% |
| No Computing Device | 118 | 9.6% |
| Total | 1,228 | 100.0% |
Internet Access in Saylorville
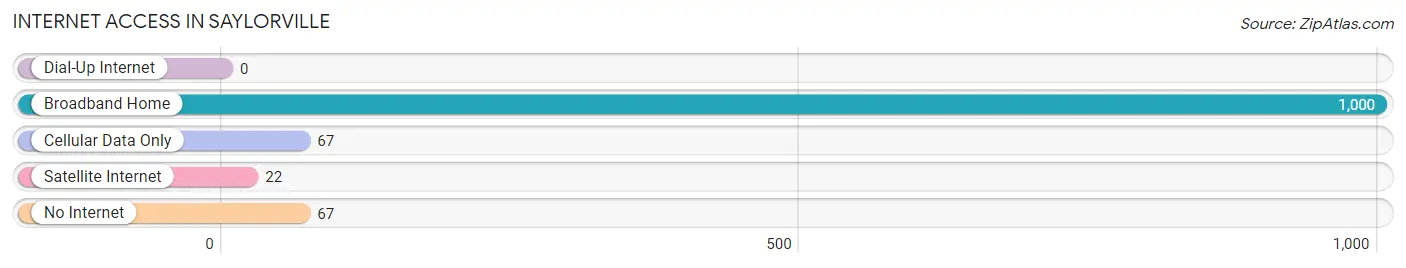
| Internet Type | # Households | % Households |
| Dial-Up Internet | 0 | 0.0% |
| Broadband Home | 1,000 | 81.4% |
| Cellular Data Only | 67 | 5.5% |
| Satellite Internet | 22 | 1.8% |
| No Internet | 67 | 5.5% |
| Total | 1,228 | 100.0% |
Saylorville Summary
Saylorville is a small city located in Polk County, Iowa, United States. It is situated on the north side of the Des Moines River, just north of the city of Des Moines. The population was 1,845 at the 2010 census.
History
Saylorville was founded in 1854 by William Saylor, a farmer from Pennsylvania. He purchased the land from the government and began to develop the area. The town was originally called Saylorville Station, but the name was changed to Saylorville in 1871.
The town grew slowly but steadily over the years, and by the early 1900s it had become a thriving community. The town was home to several businesses, including a general store, a blacksmith shop, a hotel, and a post office.
In the 1950s, the town began to experience a period of growth and development. The population increased from 1,000 in 1950 to 1,845 in 2010.
Geography
Saylorville is located at 41°37'17" North, 93°41'45" West (41.6214, -93.6958). It is situated on the north side of the Des Moines River, just north of the city of Des Moines.
The city has a total area of 1.2 square miles, all of which is land. The terrain is mostly flat, with some rolling hills.
Economy
The economy of Saylorville is largely based on agriculture. The town is home to several farms, which produce a variety of crops, including corn, soybeans, and hay.
The town also has a few small businesses, including a grocery store, a hardware store, and a few restaurants.
Demographics
As of the 2010 census, the population of Saylorville was 1,845. The racial makeup of the town was 97.2% White, 0.7% African American, 0.3% Native American, 0.3% Asian, 0.2% from other races, and 1.5% from two or more races. Hispanic or Latino of any race were 1.2% of the population.
The median income for a household in the town was $45,000, and the median income for a family was $50,000. The per capita income for the town was $20,000. About 8.3% of families and 10.2% of the population were below the poverty line, including 14.3% of those under age 18 and 6.2% of those age 65 or over.
Common Questions
What is Per Capita Income in Saylorville?
Per Capita income in Saylorville is $46,755.
What is the Median Family Income in Saylorville?
Median Family Income in Saylorville is $93,589.
What is the Median Household income in Saylorville?
Median Household Income in Saylorville is $75,571.
What is Income or Wage Gap in Saylorville?
Income or Wage Gap in Saylorville is 12.1%.
Women in Saylorville earn 87.9 cents for every dollar earned by a man.
What is Inequality or Gini Index in Saylorville?
Inequality or Gini Index in Saylorville is 0.46.
What is the Total Population of Saylorville?
Total Population of Saylorville is 2,837.
What is the Total Male Population of Saylorville?
Total Male Population of Saylorville is 1,434.
What is the Total Female Population of Saylorville?
Total Female Population of Saylorville is 1,403.
What is the Ratio of Males per 100 Females in Saylorville?
There are 102.21 Males per 100 Females in Saylorville.
What is the Ratio of Females per 100 Males in Saylorville?
There are 97.84 Females per 100 Males in Saylorville.
What is the Median Population Age in Saylorville?
Median Population Age in Saylorville is 47.0 Years.
What is the Average Family Size in Saylorville
Average Family Size in Saylorville is 2.8 People.
What is the Average Household Size in Saylorville
Average Household Size in Saylorville is 2.3 People.
How Large is the Labor Force in Saylorville?
There are 1,570 People in the Labor Forcein in Saylorville.
What is the Percentage of People in the Labor Force in Saylorville?
70.4% of People are in the Labor Force in Saylorville.
What is the Unemployment Rate in Saylorville?
Unemployment Rate in Saylorville is 10.4%.