Zip Codes with the Highest Percentage of Population Employed in Security & Protection in Davenport, IA
RELATED REPORTS & OPTIONS
Security & Protection
Davenport
Compare Zip Codes
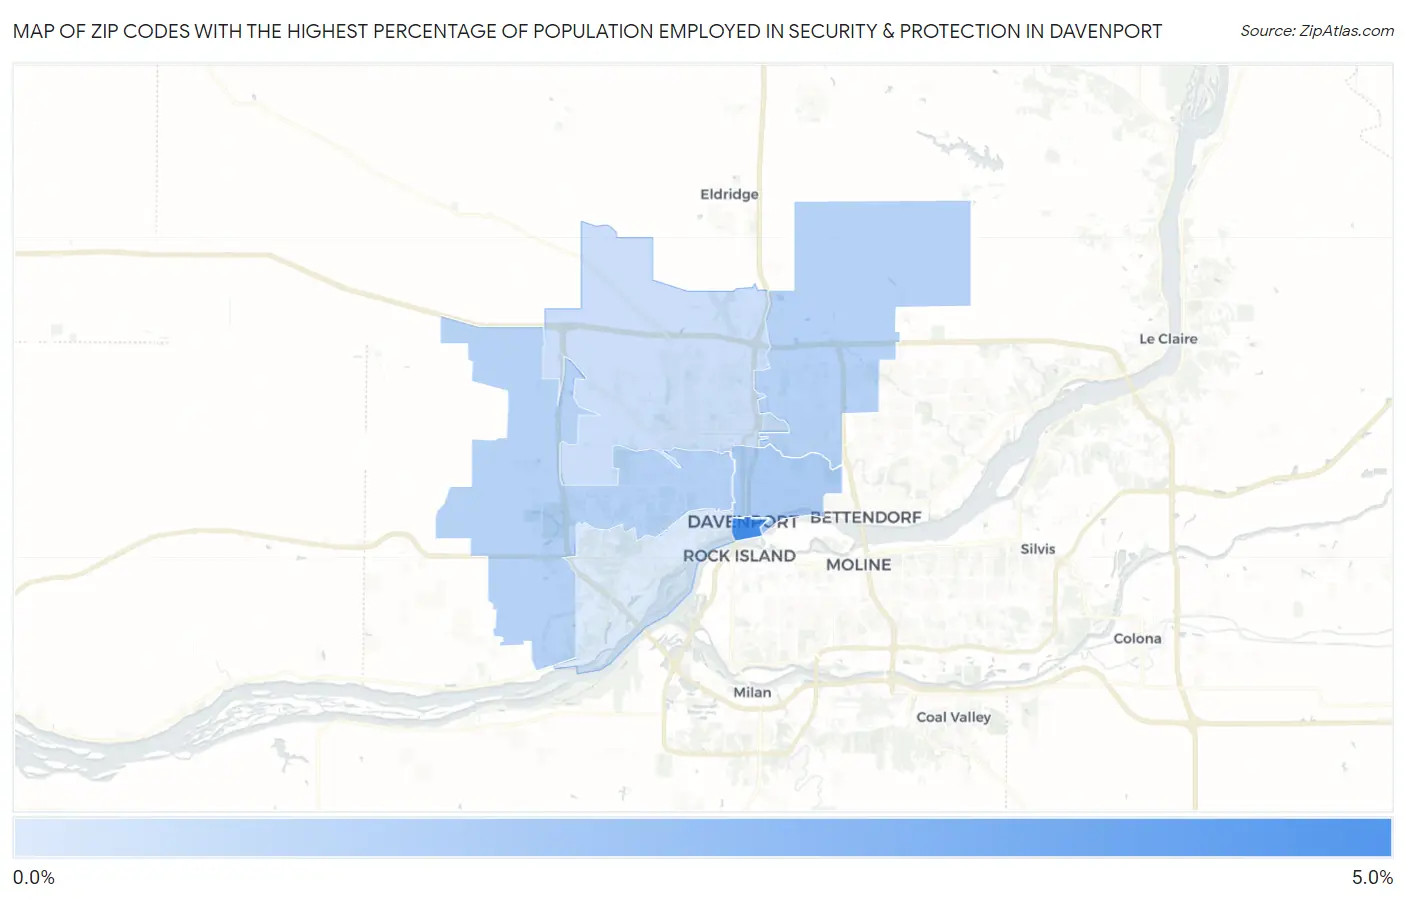
Map of Zip Codes with the Highest Percentage of Population Employed in Security & Protection in Davenport
0.28%
4.1%
Zip Codes with the Highest Percentage of Population Employed in Security & Protection in Davenport, IA
| Zip Code | % Employed | vs State | vs National | |
| 1. | 52801 | 4.1% | 1.4%(+2.68)#41 | 2.1%(+1.90)#4,392 |
| 2. | 52803 | 1.5% | 1.4%(+0.122)#268 | 2.1%(-0.653)#16,246 |
| 3. | 52807 | 1.3% | 1.4%(-0.093)#318 | 2.1%(-0.868)#17,904 |
| 4. | 52804 | 1.3% | 1.4%(-0.099)#320 | 2.1%(-0.874)#17,950 |
| 5. | 52806 | 0.71% | 1.4%(-0.663)#452 | 2.1%(-1.44)#22,009 |
| 6. | 52802 | 0.28% | 1.4%(-1.09)#581 | 2.1%(-1.87)#24,253 |
1
Common Questions
What are the Top 5 Zip Codes with the Highest Percentage of Population Employed in Security & Protection in Davenport, IA?
Top 5 Zip Codes with the Highest Percentage of Population Employed in Security & Protection in Davenport, IA are:
What zip code has the Highest Percentage of Population Employed in Security & Protection in Davenport, IA?
52801 has the Highest Percentage of Population Employed in Security & Protection in Davenport, IA with 4.1%.
What is the Percentage of Population Employed in Security & Protection in Davenport, IA?
Percentage of Population Employed in Security & Protection in Davenport is 1.2%.
What is the Percentage of Population Employed in Security & Protection in Iowa?
Percentage of Population Employed in Security & Protection in Iowa is 1.4%.
What is the Percentage of Population Employed in Security & Protection in the United States?
Percentage of Population Employed in Security & Protection in the United States is 2.1%.