Zip Codes with the Highest Percentage of Population Employed in Security & Protection in Dubuque, IA
RELATED REPORTS & OPTIONS
Security & Protection
Dubuque
Compare Zip Codes
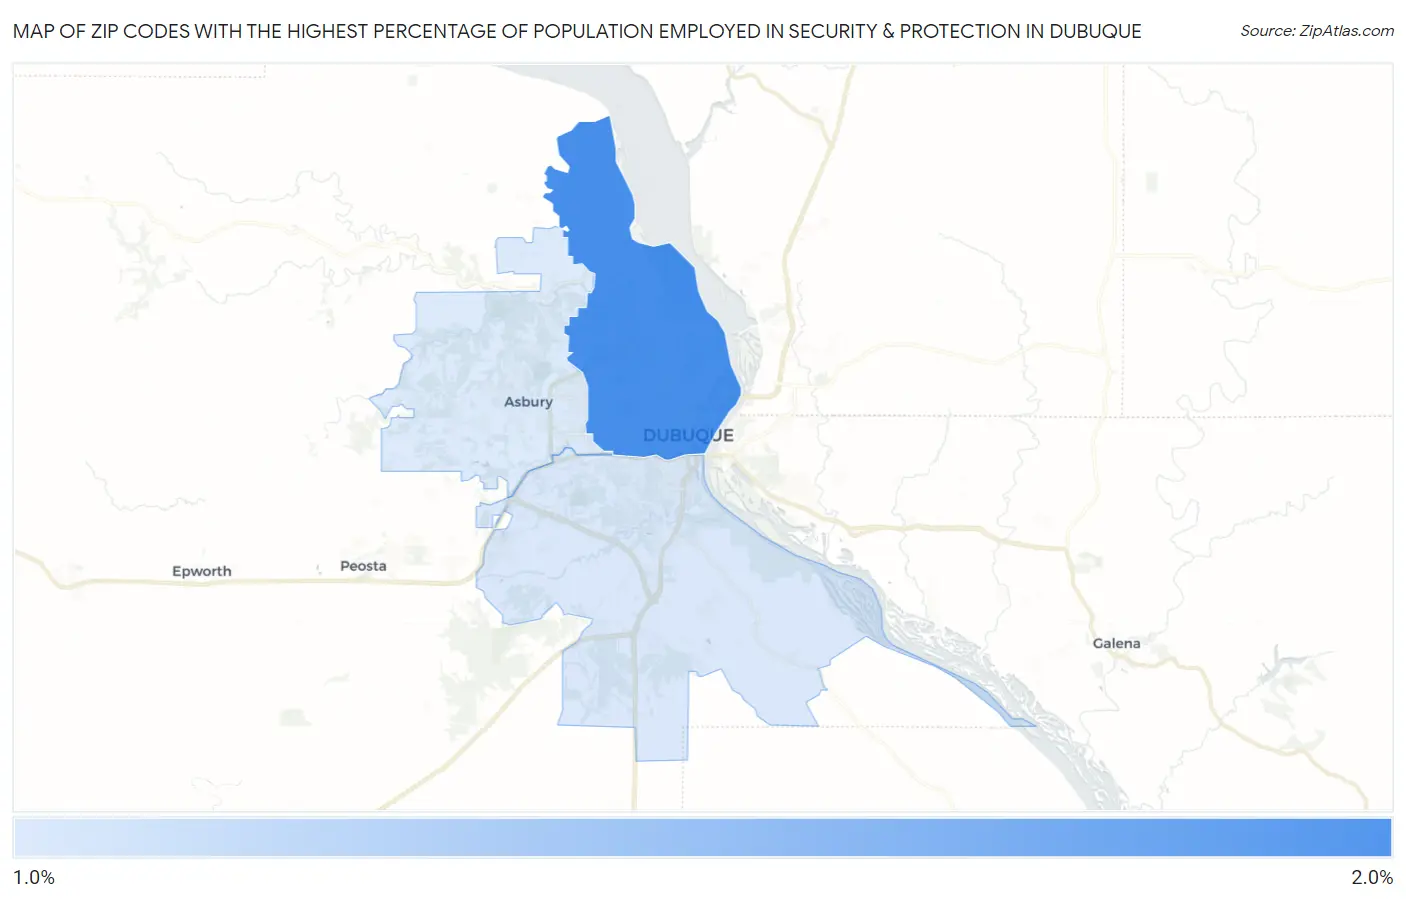
Map of Zip Codes with the Highest Percentage of Population Employed in Security & Protection in Dubuque
1.5%
1.9%
Zip Codes with the Highest Percentage of Population Employed in Security & Protection in Dubuque, IA
| Zip Code | % Employed | vs State | vs National | |
| 1. | 52001 | 1.9% | 1.4%(+0.508)#203 | 2.1%(-0.268)#13,374 |
| 2. | 52003 | 1.5% | 1.4%(+0.157)#259 | 2.1%(-0.619)#15,954 |
| 3. | 52002 | 1.5% | 1.4%(+0.149)#262 | 2.1%(-0.627)#16,021 |
1
Common Questions
What are the Top Zip Codes with the Highest Percentage of Population Employed in Security & Protection in Dubuque, IA?
Top Zip Codes with the Highest Percentage of Population Employed in Security & Protection in Dubuque, IA are:
What zip code has the Highest Percentage of Population Employed in Security & Protection in Dubuque, IA?
52001 has the Highest Percentage of Population Employed in Security & Protection in Dubuque, IA with 1.9%.
What is the Percentage of Population Employed in Security & Protection in Dubuque, IA?
Percentage of Population Employed in Security & Protection in Dubuque is 1.8%.
What is the Percentage of Population Employed in Security & Protection in Iowa?
Percentage of Population Employed in Security & Protection in Iowa is 1.4%.
What is the Percentage of Population Employed in Security & Protection in the United States?
Percentage of Population Employed in Security & Protection in the United States is 2.1%.