New Hartford, IA Map & Demographics
New Hartford Map
New Hartford Overview
$22,936
PER CAPITA INCOME
$83,542
AVG FAMILY INCOME
$64,583
AVG HOUSEHOLD INCOME
40.3%
WAGE / INCOME GAP [ % ]
59.7¢/ $1
WAGE / INCOME GAP [ $ ]
0.30
INEQUALITY / GINI INDEX
758
TOTAL POPULATION
408
MALE POPULATION
350
FEMALE POPULATION
116.57
MALES / 100 FEMALES
85.78
FEMALES / 100 MALES
36.5
MEDIAN AGE
3.1
AVG FAMILY SIZE
2.8
AVG HOUSEHOLD SIZE
385
LABOR FORCE [ PEOPLE ]
65.8%
PERCENT IN LABOR FORCE
6.5%
UNEMPLOYMENT RATE
New Hartford Zip Codes
New Hartford Area Codes
Income in New Hartford
Income Overview in New Hartford
Per Capita Income in New Hartford is $22,936, while median incomes of families and households are $83,542 and $64,583 respectively.
| Characteristic | Number | Measure |
| Per Capita Income | 758 | $22,936 |
| Median Family Income | 213 | $83,542 |
| Mean Family Income | 213 | $70,091 |
| Median Household Income | 273 | $64,583 |
| Mean Household Income | 273 | $65,351 |
| Income Deficit | 213 | $0 |
| Wage / Income Gap (%) | 758 | 40.26% |
| Wage / Income Gap ($) | 758 | 59.74¢ per $1 |
| Gini / Inequality Index | 758 | 0.30 |
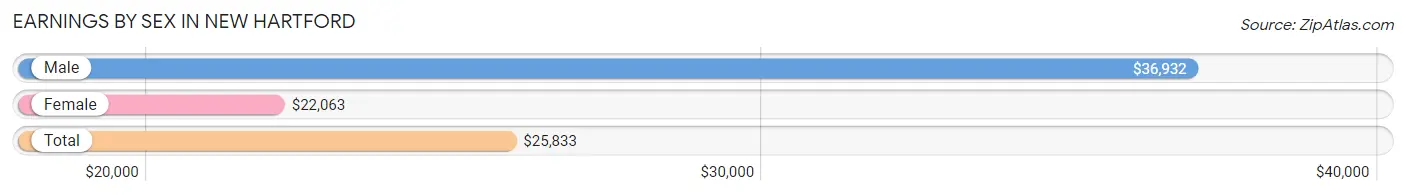
Earnings by Sex in New Hartford
Average Earnings in New Hartford are $25,833, $36,932 for men and $22,063 for women, a difference of 40.3%.
| Sex | Number | Average Earnings |
| Male | 165 (41.0%) | $36,932 |
| Female | 237 (59.0%) | $22,063 |
| Total | 402 (100.0%) | $25,833 |
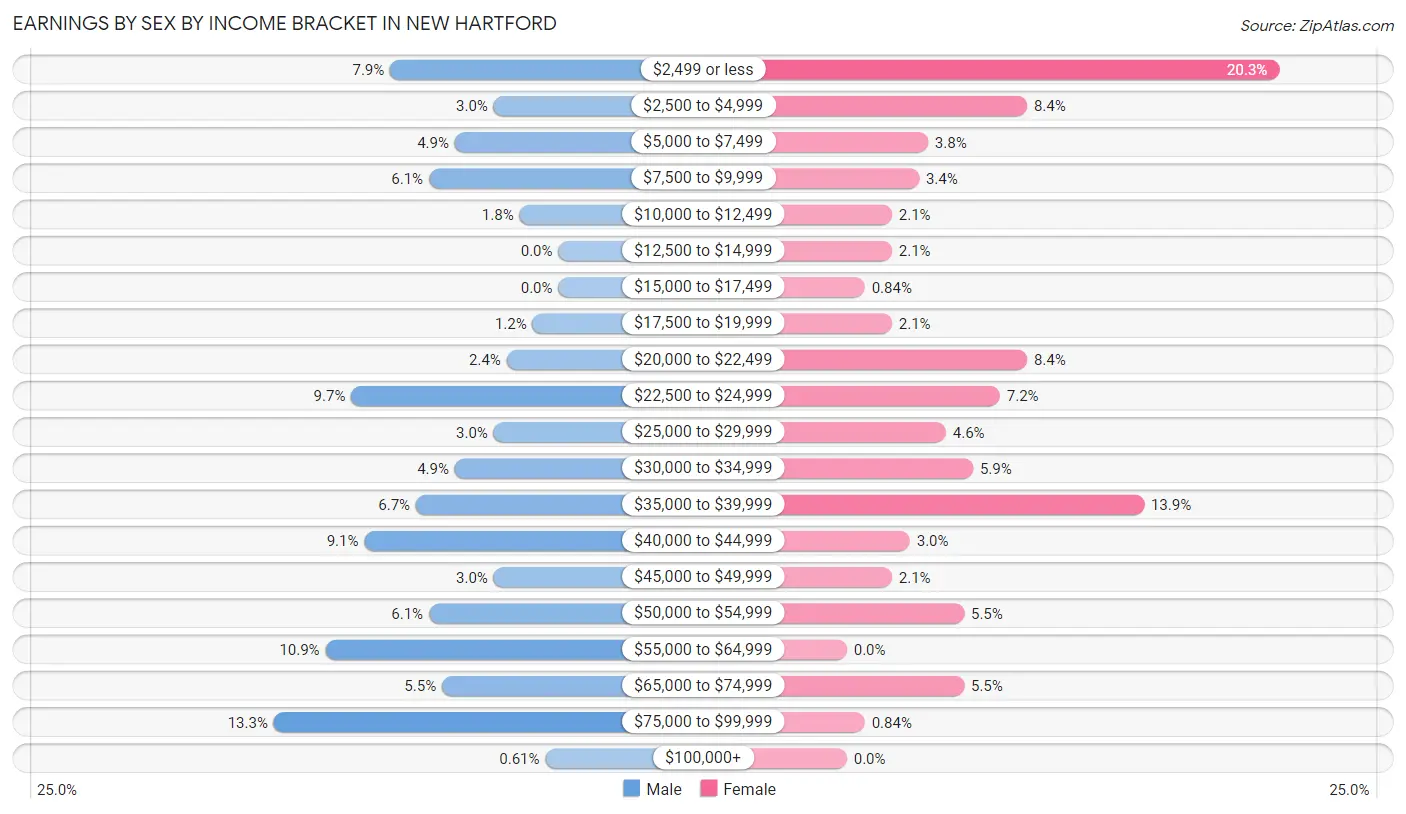
Earnings by Sex by Income Bracket in New Hartford
The most common earnings brackets in New Hartford are $75,000 to $99,999 for men (22 | 13.3%) and $2,499 or less for women (48 | 20.3%).
| Income | Male | Female |
| $2,499 or less | 13 (7.9%) | 48 (20.3%) |
| $2,500 to $4,999 | 5 (3.0%) | 20 (8.4%) |
| $5,000 to $7,499 | 8 (4.9%) | 9 (3.8%) |
| $7,500 to $9,999 | 10 (6.1%) | 8 (3.4%) |
| $10,000 to $12,499 | 3 (1.8%) | 5 (2.1%) |
| $12,500 to $14,999 | 0 (0.0%) | 5 (2.1%) |
| $15,000 to $17,499 | 0 (0.0%) | 2 (0.8%) |
| $17,500 to $19,999 | 2 (1.2%) | 5 (2.1%) |
| $20,000 to $22,499 | 4 (2.4%) | 20 (8.4%) |
| $22,500 to $24,999 | 16 (9.7%) | 17 (7.2%) |
| $25,000 to $29,999 | 5 (3.0%) | 11 (4.6%) |
| $30,000 to $34,999 | 8 (4.9%) | 14 (5.9%) |
| $35,000 to $39,999 | 11 (6.7%) | 33 (13.9%) |
| $40,000 to $44,999 | 15 (9.1%) | 7 (2.9%) |
| $45,000 to $49,999 | 5 (3.0%) | 5 (2.1%) |
| $50,000 to $54,999 | 10 (6.1%) | 13 (5.5%) |
| $55,000 to $64,999 | 18 (10.9%) | 0 (0.0%) |
| $65,000 to $74,999 | 9 (5.4%) | 13 (5.5%) |
| $75,000 to $99,999 | 22 (13.3%) | 2 (0.8%) |
| $100,000+ | 1 (0.6%) | 0 (0.0%) |
| Total | 165 (100.0%) | 237 (100.0%) |
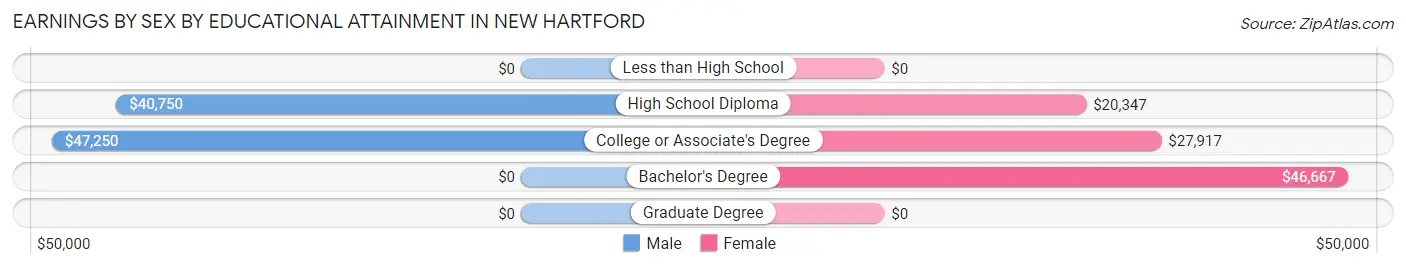
Earnings by Sex by Educational Attainment in New Hartford
Average earnings in New Hartford are $43,500 for men and $24,667 for women, a difference of 43.3%. Men with an educational attainment of college or associate's degree enjoy the highest average annual earnings of $47,250, while those with high school diploma education earn the least with $40,750. Women with an educational attainment of bachelor's degree earn the most with the average annual earnings of $46,667, while those with high school diploma education have the smallest earnings of $20,347.
| Educational Attainment | Male Income | Female Income |
| Less than High School | - | - |
| High School Diploma | $40,750 | $20,347 |
| College or Associate's Degree | $47,250 | $27,917 |
| Bachelor's Degree | - | - |
| Graduate Degree | - | - |
| Total | $43,500 | $24,667 |
Family Income in New Hartford
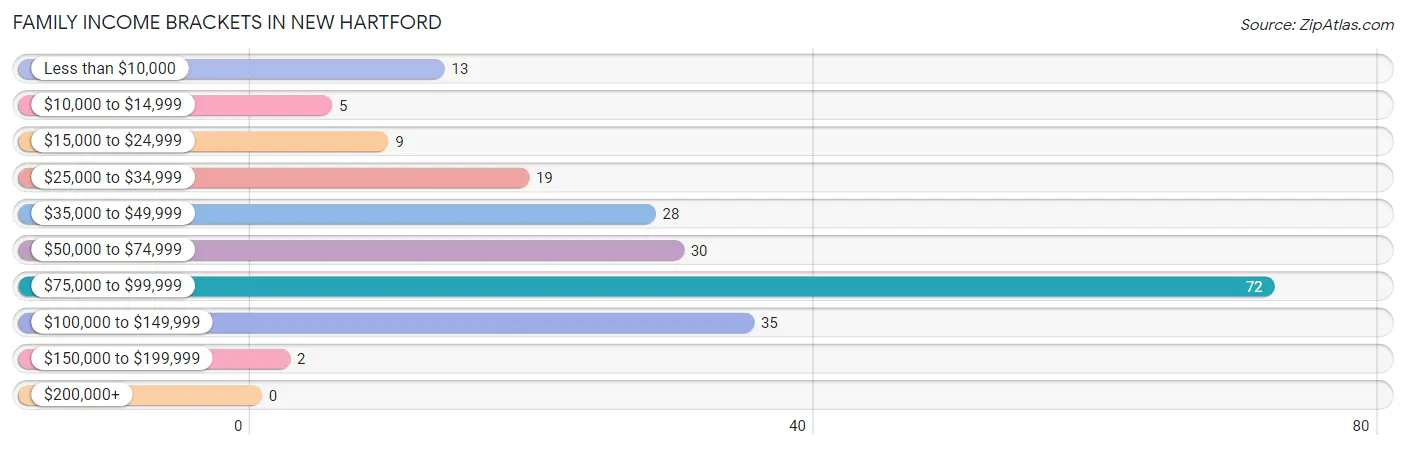
Family Income Brackets in New Hartford
According to the New Hartford family income data, there are 72 families falling into the $75,000 to $99,999 income range, which is the most common income bracket and makes up 33.8% of all families.
| Income Bracket | # Families | % Families |
| Less than $10,000 | 13 | 6.1% |
| $10,000 to $14,999 | 5 | 2.3% |
| $15,000 to $24,999 | 9 | 4.2% |
| $25,000 to $34,999 | 19 | 8.9% |
| $35,000 to $49,999 | 28 | 13.1% |
| $50,000 to $74,999 | 30 | 14.1% |
| $75,000 to $99,999 | 72 | 33.8% |
| $100,000 to $149,999 | 35 | 16.4% |
| $150,000 to $199,999 | 2 | 0.9% |
| $200,000+ | 0 | 0.0% |
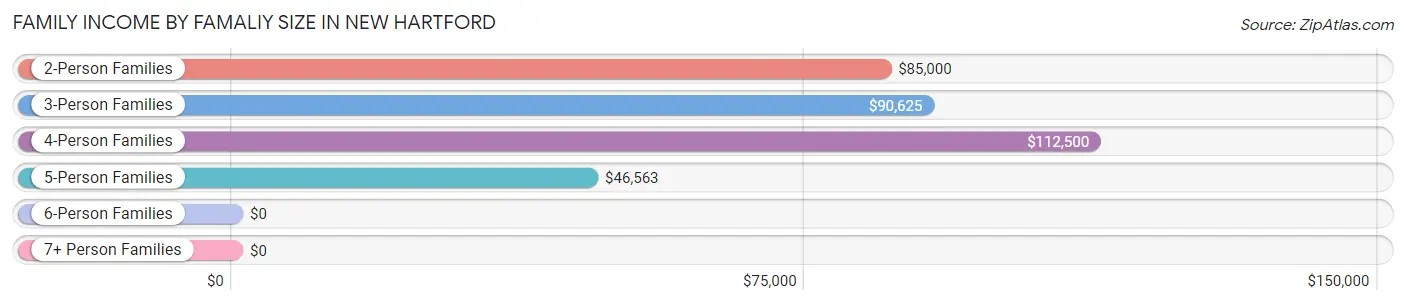
Family Income by Famaliy Size in New Hartford
4-person families (14 | 6.6%) account for the highest median family income in New Hartford with $112,500 per family, while 2-person families (112 | 52.6%) have the highest median income of $42,500 per family member.
| Income Bracket | # Families | Median Income |
| 2-Person Families | 112 (52.6%) | $85,000 |
| 3-Person Families | 37 (17.4%) | $90,625 |
| 4-Person Families | 14 (6.6%) | $112,500 |
| 5-Person Families | 48 (22.5%) | $46,563 |
| 6-Person Families | 2 (0.9%) | $0 |
| 7+ Person Families | 0 (0.0%) | $0 |
| Total | 213 (100.0%) | $83,542 |
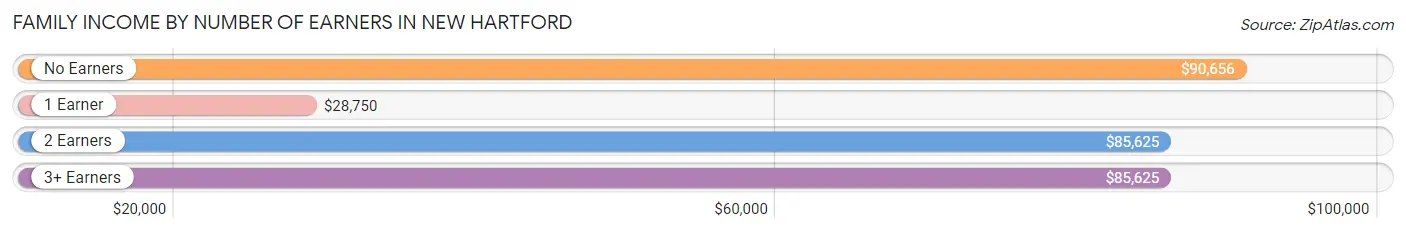
Family Income by Number of Earners in New Hartford
The median family income in New Hartford is $83,542, with families comprising no earners (63) having the highest median family income of $90,656, while families with 1 earner (32) have the lowest median family income of $28,750, accounting for 29.6% and 15.0% of families, respectively.
| Number of Earners | # Families | Median Income |
| No Earners | 63 (29.6%) | $90,656 |
| 1 Earner | 32 (15.0%) | $28,750 |
| 2 Earners | 69 (32.4%) | $85,625 |
| 3+ Earners | 49 (23.0%) | $85,625 |
| Total | 213 (100.0%) | $83,542 |
Household Income in New Hartford
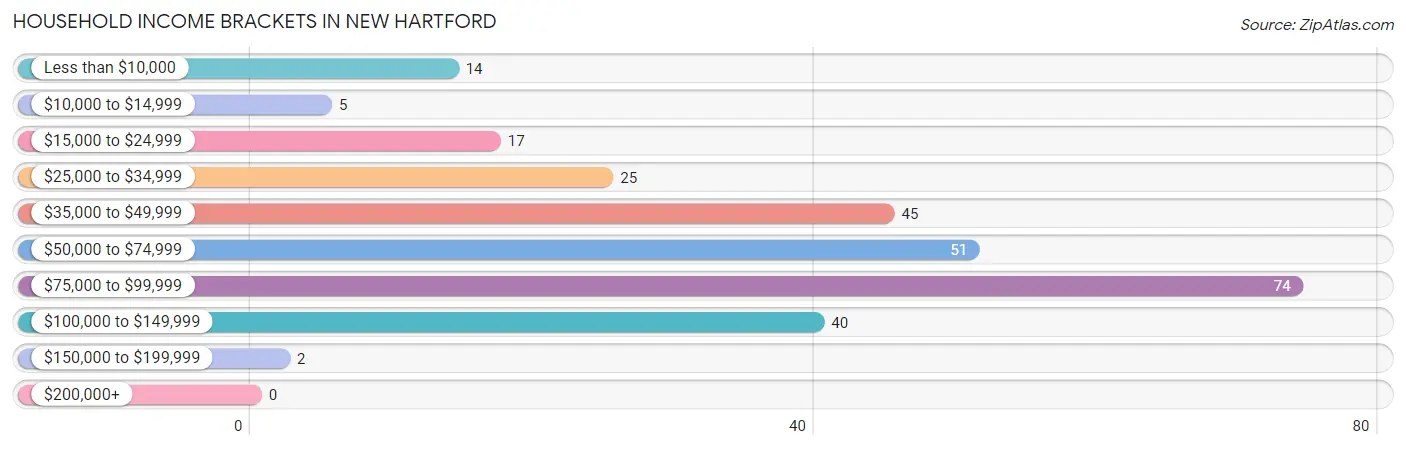
Household Income Brackets in New Hartford
With 74 households falling in the category, the $75,000 to $99,999 income range is the most frequent in New Hartford, accounting for 27.1% of all households.
| Income Bracket | # Households | % Households |
| Less than $10,000 | 14 | 5.1% |
| $10,000 to $14,999 | 5 | 1.8% |
| $15,000 to $24,999 | 17 | 6.2% |
| $25,000 to $34,999 | 25 | 9.2% |
| $35,000 to $49,999 | 45 | 16.5% |
| $50,000 to $74,999 | 51 | 18.7% |
| $75,000 to $99,999 | 74 | 27.1% |
| $100,000 to $149,999 | 40 | 14.7% |
| $150,000 to $199,999 | 2 | 0.7% |
| $200,000+ | 0 | 0.0% |
Household Income by Householder Age in New Hartford
The median household income in New Hartford is $64,583, with the highest median household income of $90,469 found in the 65+ years age bracket for the primary householder. A total of 79 households (28.9%) fall into this category. Meanwhile, the 45 to 64 years age bracket for the primary householder has the lowest median household income of $0, with 73 households (26.7%) in this group.
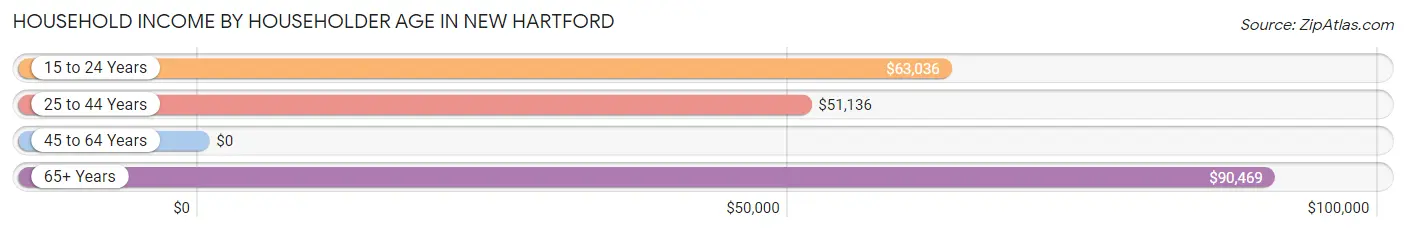
| Income Bracket | # Households | Median Income |
| 15 to 24 Years | 15 (5.5%) | $63,036 |
| 25 to 44 Years | 106 (38.8%) | $51,136 |
| 45 to 64 Years | 73 (26.7%) | $0 |
| 65+ Years | 79 (28.9%) | $90,469 |
| Total | 273 (100.0%) | $64,583 |
Poverty in New Hartford
Income Below Poverty by Sex and Age in New Hartford
With 21.7% poverty level for males and 19.4% for females among the residents of New Hartford, 6 to 11 year old males and under 5 year old females are the most vulnerable to poverty, with 33 males (46.5%) and 4 females (66.7%) in their respective age groups living below the poverty level.
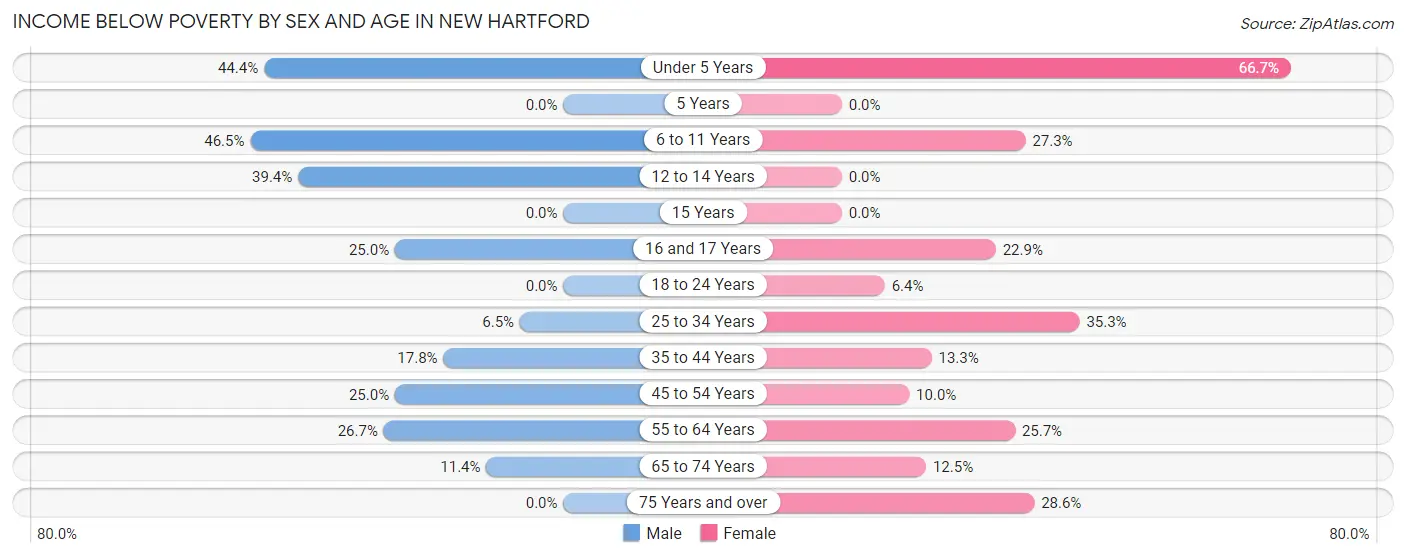
| Age Bracket | Male | Female |
| Under 5 Years | 4 (44.4%) | 4 (66.7%) |
| 5 Years | 0 (0.0%) | 0 (0.0%) |
| 6 to 11 Years | 33 (46.5%) | 6 (27.3%) |
| 12 to 14 Years | 13 (39.4%) | 0 (0.0%) |
| 15 Years | 0 (0.0%) | 0 (0.0%) |
| 16 and 17 Years | 2 (25.0%) | 8 (22.9%) |
| 18 to 24 Years | 0 (0.0%) | 3 (6.4%) |
| 25 to 34 Years | 2 (6.5%) | 12 (35.3%) |
| 35 to 44 Years | 13 (17.8%) | 8 (13.3%) |
| 45 to 54 Years | 9 (25.0%) | 5 (10.0%) |
| 55 to 64 Years | 4 (26.7%) | 18 (25.7%) |
| 65 to 74 Years | 8 (11.4%) | 2 (12.5%) |
| 75 Years and over | 0 (0.0%) | 2 (28.6%) |
| Total | 88 (21.7%) | 68 (19.4%) |
Income Above Poverty by Sex and Age in New Hartford
According to the poverty statistics in New Hartford, males aged 15 years and females aged 5 years are the age groups that are most secure financially, with 100.0% of males and 100.0% of females in these age groups living above the poverty line.
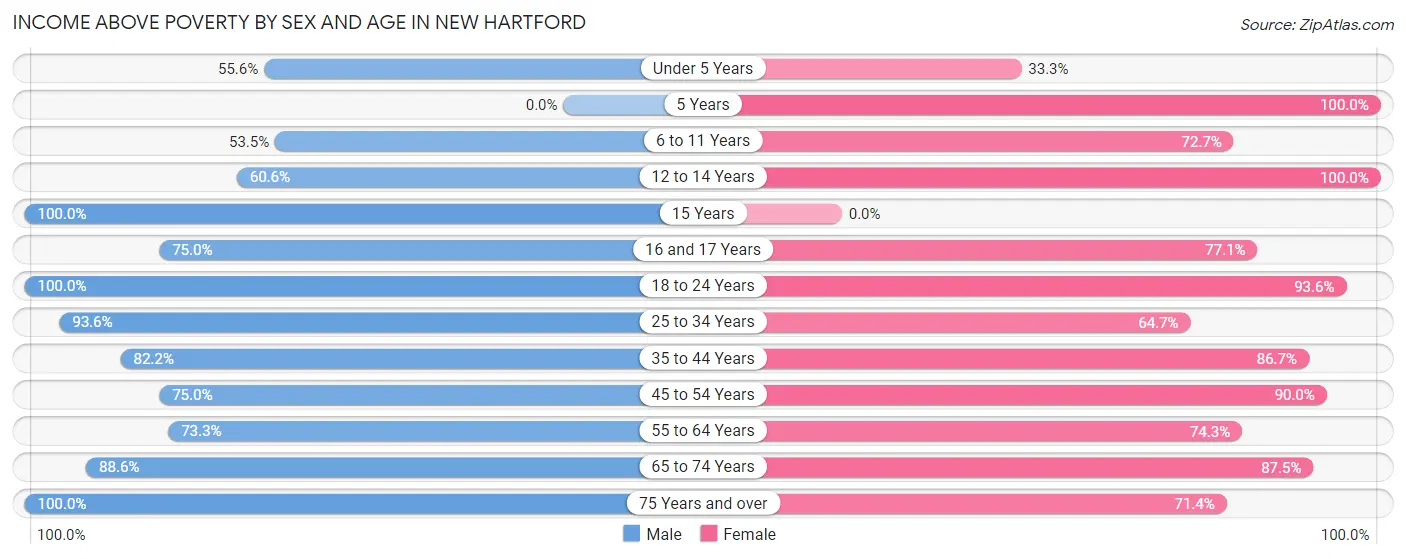
| Age Bracket | Male | Female |
| Under 5 Years | 5 (55.6%) | 2 (33.3%) |
| 5 Years | 0 (0.0%) | 1 (100.0%) |
| 6 to 11 Years | 38 (53.5%) | 16 (72.7%) |
| 12 to 14 Years | 20 (60.6%) | 2 (100.0%) |
| 15 Years | 27 (100.0%) | 0 (0.0%) |
| 16 and 17 Years | 6 (75.0%) | 27 (77.1%) |
| 18 to 24 Years | 30 (100.0%) | 44 (93.6%) |
| 25 to 34 Years | 29 (93.5%) | 22 (64.7%) |
| 35 to 44 Years | 60 (82.2%) | 52 (86.7%) |
| 45 to 54 Years | 27 (75.0%) | 45 (90.0%) |
| 55 to 64 Years | 11 (73.3%) | 52 (74.3%) |
| 65 to 74 Years | 62 (88.6%) | 14 (87.5%) |
| 75 Years and over | 3 (100.0%) | 5 (71.4%) |
| Total | 318 (78.3%) | 282 (80.6%) |
Income Below Poverty Among Married-Couple Families in New Hartford
The poverty statistics for married-couple families in New Hartford show that 11.3% or 20 of the total 177 families live below the poverty line. Families with 1 or 2 children have the highest poverty rate of 30.4%, comprising of 7 families. On the other hand, families with no children have the lowest poverty rate of 5.1%, which includes 6 families.
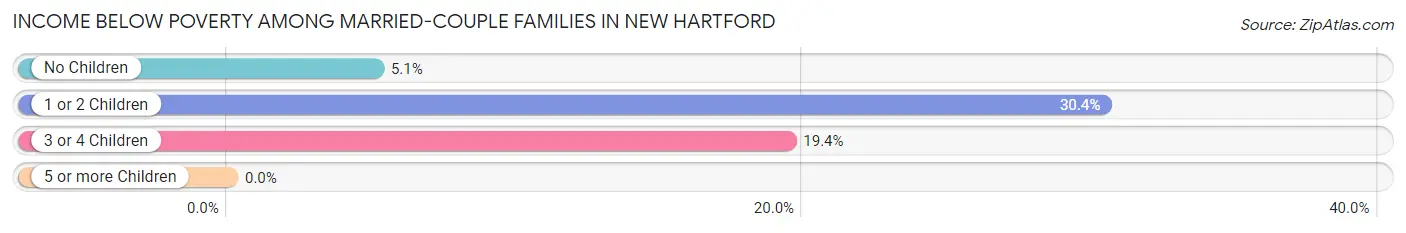
| Children | Above Poverty | Below Poverty |
| No Children | 112 (94.9%) | 6 (5.1%) |
| 1 or 2 Children | 16 (69.6%) | 7 (30.4%) |
| 3 or 4 Children | 29 (80.6%) | 7 (19.4%) |
| 5 or more Children | 0 (0.0%) | 0 (0.0%) |
| Total | 157 (88.7%) | 20 (11.3%) |
Income Below Poverty Among Single-Parent Households in New Hartford
According to the poverty data in New Hartford, 30.0% or 6 single-father households and 62.5% or 10 single-mother households are living below the poverty line. Among single-father households, those with 1 or 2 children have the highest poverty rate, with 6 households (75.0%) experiencing poverty. Likewise, among single-mother households, those with 1 or 2 children have the highest poverty rate, with 10 households (90.9%) falling below the poverty line.
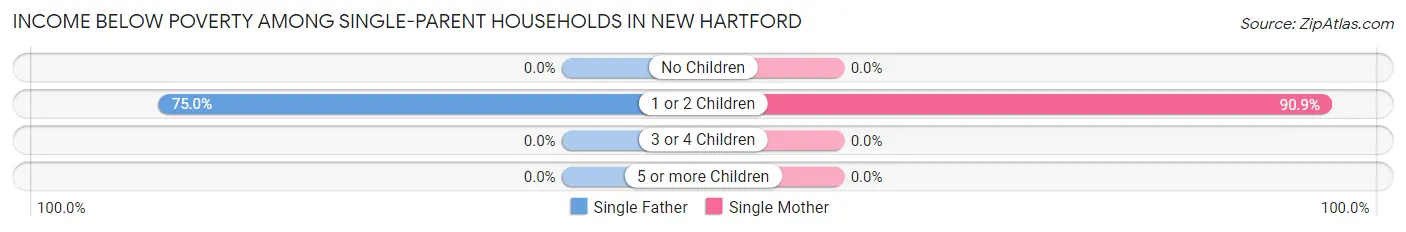
| Children | Single Father | Single Mother |
| No Children | 0 (0.0%) | 0 (0.0%) |
| 1 or 2 Children | 6 (75.0%) | 10 (90.9%) |
| 3 or 4 Children | 0 (0.0%) | 0 (0.0%) |
| 5 or more Children | 0 (0.0%) | 0 (0.0%) |
| Total | 6 (30.0%) | 10 (62.5%) |
Income Below Poverty Among Married-Couple vs Single-Parent Households in New Hartford
The poverty data for New Hartford shows that 20 of the married-couple family households (11.3%) and 16 of the single-parent households (44.4%) are living below the poverty level. Within the married-couple family households, those with 1 or 2 children have the highest poverty rate, with 7 households (30.4%) falling below the poverty line. Among the single-parent households, those with 1 or 2 children have the highest poverty rate, with 16 household (84.2%) living below poverty.
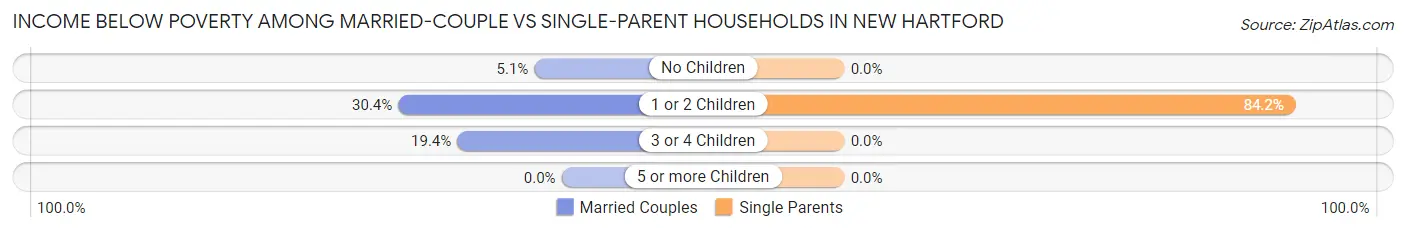
| Children | Married-Couple Families | Single-Parent Households |
| No Children | 6 (5.1%) | 0 (0.0%) |
| 1 or 2 Children | 7 (30.4%) | 16 (84.2%) |
| 3 or 4 Children | 7 (19.4%) | 0 (0.0%) |
| 5 or more Children | 0 (0.0%) | 0 (0.0%) |
| Total | 20 (11.3%) | 16 (44.4%) |
Race in New Hartford
The most populous races in New Hartford are White / Caucasian (726 | 95.8%), Two or more Races (11 | 1.5%), and Black / African American (7 | 0.9%).
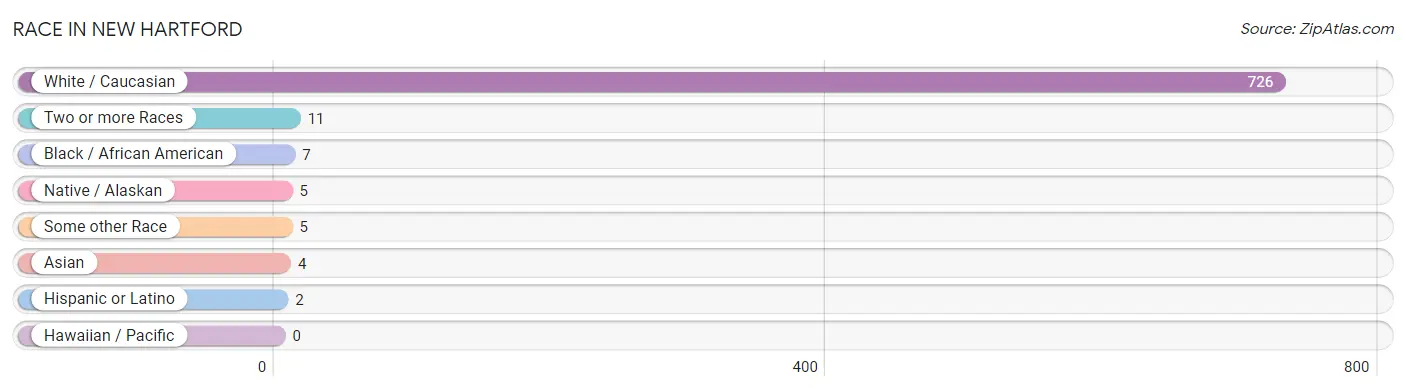
| Race | # Population | % Population |
| Asian | 4 | 0.5% |
| Black / African American | 7 | 0.9% |
| Hawaiian / Pacific | 0 | 0.0% |
| Hispanic or Latino | 2 | 0.3% |
| Native / Alaskan | 5 | 0.7% |
| White / Caucasian | 726 | 95.8% |
| Two or more Races | 11 | 1.5% |
| Some other Race | 5 | 0.7% |
| Total | 758 | 100.0% |
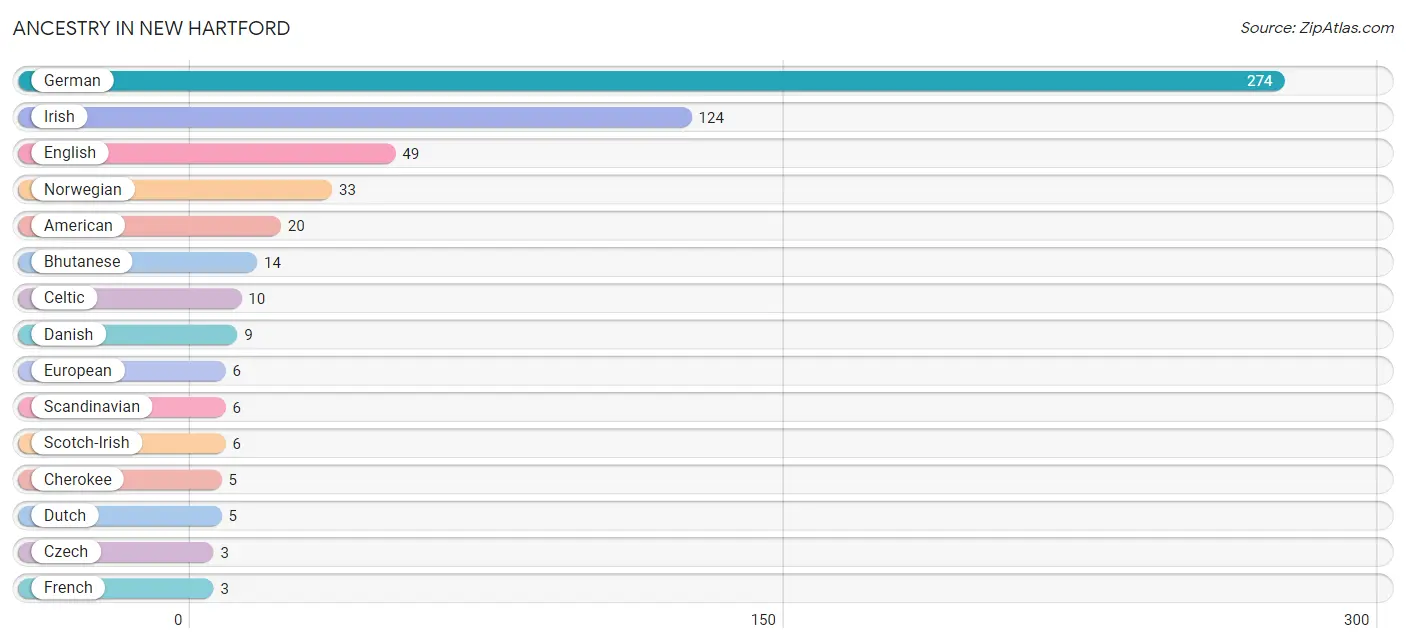
Ancestry in New Hartford
The most populous ancestries reported in New Hartford are German (274 | 36.1%), Irish (124 | 16.4%), English (49 | 6.5%), Norwegian (33 | 4.3%), and American (20 | 2.6%), together accounting for 66.0% of all New Hartford residents.
| Ancestry | # Population | % Population |
| American | 20 | 2.6% |
| Austrian | 1 | 0.1% |
| Bhutanese | 14 | 1.8% |
| Celtic | 10 | 1.3% |
| Cherokee | 5 | 0.7% |
| Czech | 3 | 0.4% |
| Danish | 9 | 1.2% |
| Dutch | 5 | 0.7% |
| English | 49 | 6.5% |
| European | 6 | 0.8% |
| French | 3 | 0.4% |
| German | 274 | 36.1% |
| Irish | 124 | 16.4% |
| Mexican | 2 | 0.3% |
| Norwegian | 33 | 4.3% |
| Polish | 2 | 0.3% |
| Scandinavian | 6 | 0.8% |
| Scotch-Irish | 6 | 0.8% |
| Swedish | 3 | 0.4% |
| Yugoslavian | 2 | 0.3% | View All 20 Rows |
Immigrants in New Hartford
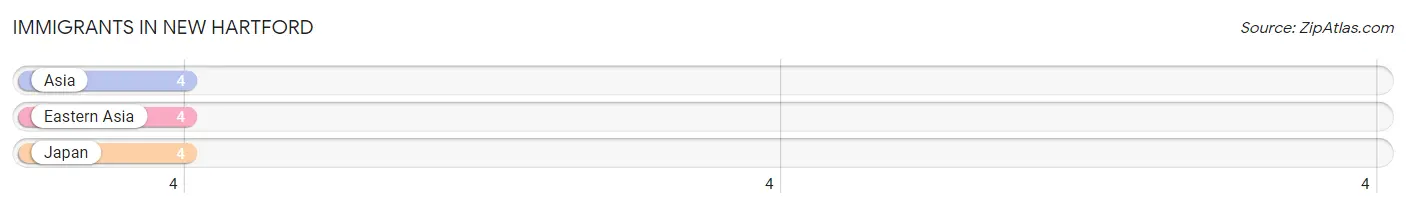
The most numerous immigrant groups reported in New Hartford came from Asia (4 | 0.5%), Eastern Asia (4 | 0.5%), and Japan (4 | 0.5%), together accounting for 1.6% of all New Hartford residents.
| Immigration Origin | # Population | % Population |
| Asia | 4 | 0.5% |
| Eastern Asia | 4 | 0.5% |
| Japan | 4 | 0.5% | View All 3 Rows |
Sex and Age in New Hartford
Sex and Age in New Hartford
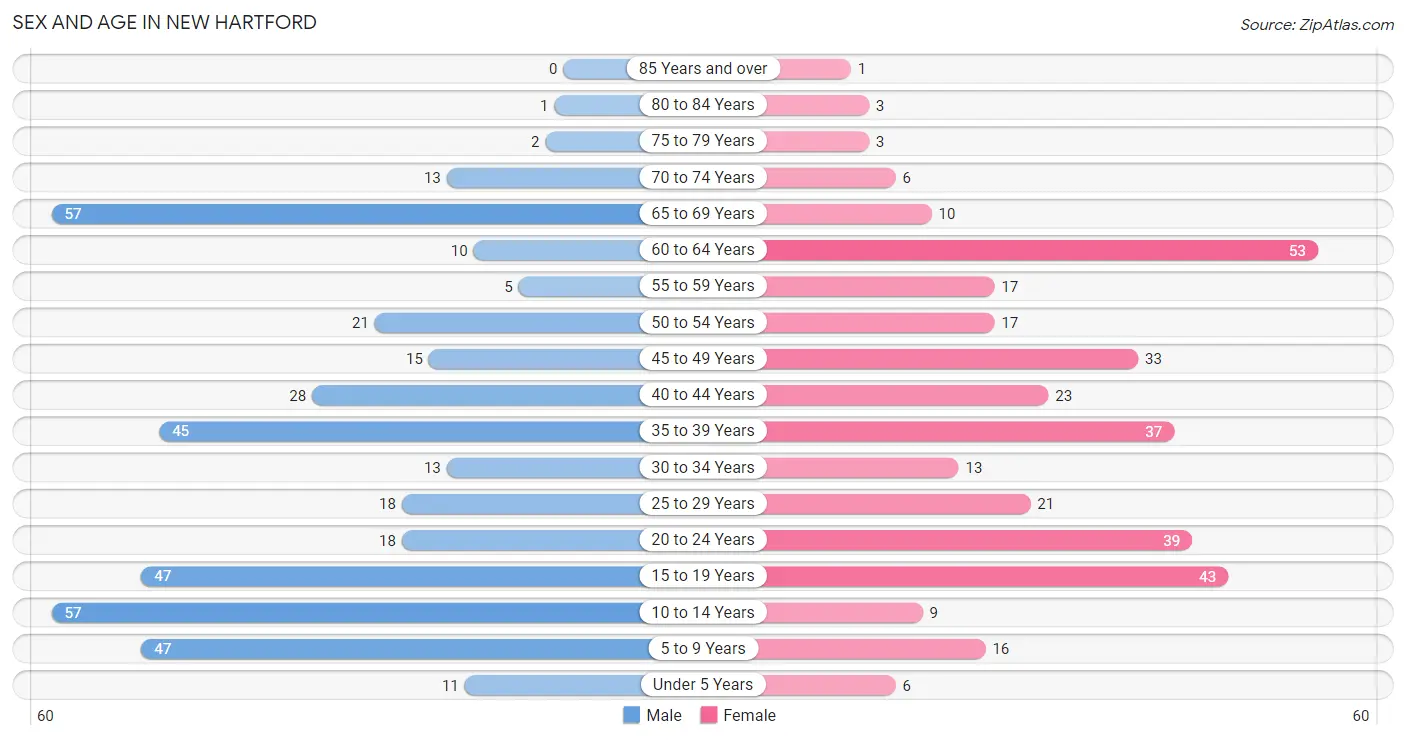
The most populous age groups in New Hartford are 10 to 14 Years (57 | 14.0%) for men and 60 to 64 Years (53 | 15.1%) for women.
| Age Bracket | Male | Female |
| Under 5 Years | 11 (2.7%) | 6 (1.7%) |
| 5 to 9 Years | 47 (11.5%) | 16 (4.6%) |
| 10 to 14 Years | 57 (14.0%) | 9 (2.6%) |
| 15 to 19 Years | 47 (11.5%) | 43 (12.3%) |
| 20 to 24 Years | 18 (4.4%) | 39 (11.1%) |
| 25 to 29 Years | 18 (4.4%) | 21 (6.0%) |
| 30 to 34 Years | 13 (3.2%) | 13 (3.7%) |
| 35 to 39 Years | 45 (11.0%) | 37 (10.6%) |
| 40 to 44 Years | 28 (6.9%) | 23 (6.6%) |
| 45 to 49 Years | 15 (3.7%) | 33 (9.4%) |
| 50 to 54 Years | 21 (5.1%) | 17 (4.9%) |
| 55 to 59 Years | 5 (1.2%) | 17 (4.9%) |
| 60 to 64 Years | 10 (2.5%) | 53 (15.1%) |
| 65 to 69 Years | 57 (14.0%) | 10 (2.9%) |
| 70 to 74 Years | 13 (3.2%) | 6 (1.7%) |
| 75 to 79 Years | 2 (0.5%) | 3 (0.9%) |
| 80 to 84 Years | 1 (0.3%) | 3 (0.9%) |
| 85 Years and over | 0 (0.0%) | 1 (0.3%) |
| Total | 408 (100.0%) | 350 (100.0%) |
Families and Households in New Hartford
Median Family Size in New Hartford
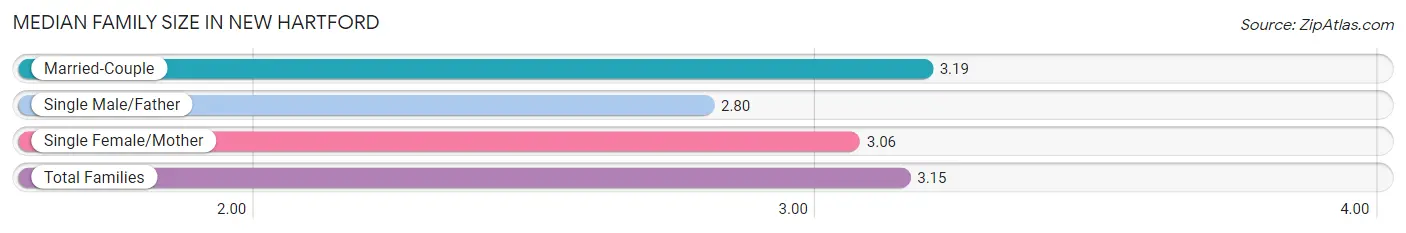
The median family size in New Hartford is 3.15 persons per family, with married-couple families (177 | 83.1%) accounting for the largest median family size of 3.19 persons per family. On the other hand, single male/father families (20 | 9.4%) represent the smallest median family size with 2.80 persons per family.
| Family Type | # Families | Family Size |
| Married-Couple | 177 (83.1%) | 3.19 |
| Single Male/Father | 20 (9.4%) | 2.80 |
| Single Female/Mother | 16 (7.5%) | 3.06 |
| Total Families | 213 (100.0%) | 3.15 |
Median Household Size in New Hartford
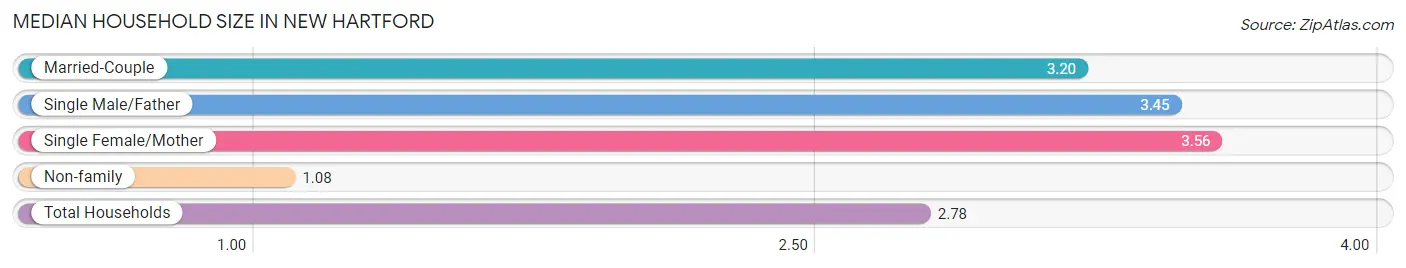
The median household size in New Hartford is 2.78 persons per household, with single female/mother households (16 | 5.9%) accounting for the largest median household size of 3.56 persons per household. non-family households (60 | 22.0%) represent the smallest median household size with 1.08 persons per household.
| Household Type | # Households | Household Size |
| Married-Couple | 177 (64.8%) | 3.20 |
| Single Male/Father | 20 (7.3%) | 3.45 |
| Single Female/Mother | 16 (5.9%) | 3.56 |
| Non-family | 60 (22.0%) | 1.08 |
| Total Households | 273 (100.0%) | 2.78 |
Household Size by Marriage Status in New Hartford
Out of a total of 273 households in New Hartford, 213 (78.0%) are family households, while 60 (22.0%) are nonfamily households. The most numerous type of family households are 2-person households, comprising 108, and the most common type of nonfamily households are 1-person households, comprising 55.
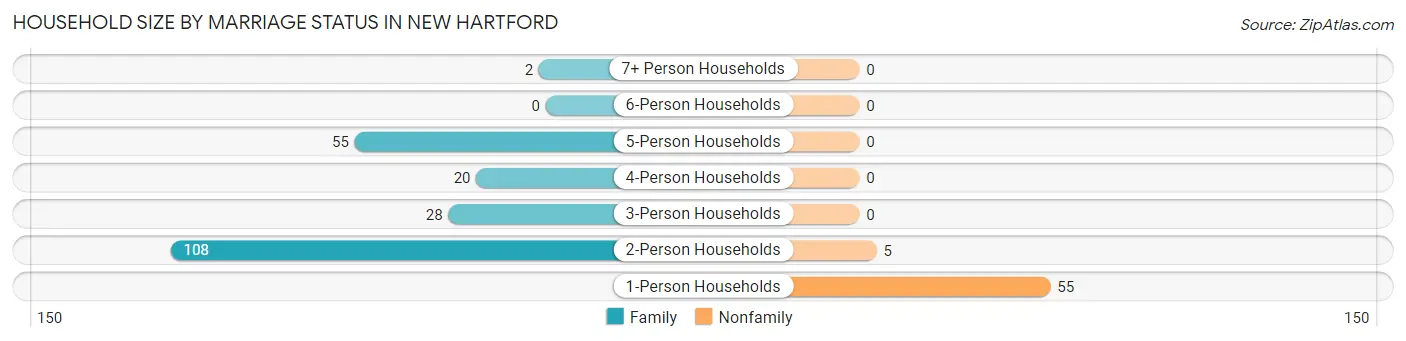
| Household Size | Family Households | Nonfamily Households |
| 1-Person Households | - | 55 (20.2%) |
| 2-Person Households | 108 (39.6%) | 5 (1.8%) |
| 3-Person Households | 28 (10.3%) | 0 (0.0%) |
| 4-Person Households | 20 (7.3%) | 0 (0.0%) |
| 5-Person Households | 55 (20.2%) | 0 (0.0%) |
| 6-Person Households | 0 (0.0%) | 0 (0.0%) |
| 7+ Person Households | 2 (0.7%) | 0 (0.0%) |
| Total | 213 (78.0%) | 60 (22.0%) |
Female Fertility in New Hartford
Fertility by Age in New Hartford
Average fertility rate in New Hartford is 38.0 births per 1,000 women. Women in the age bracket of 20 to 34 years have the highest fertility rate with 110.0 births per 1,000 women. Women in the age bracket of 20 to 34 years acount for 100.0% of all women with births.
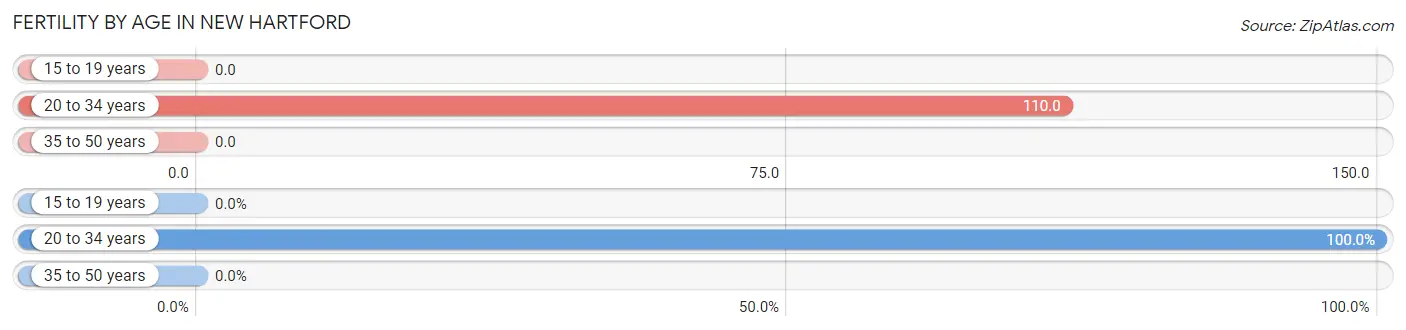
| Age Bracket | Women with Births | Births / 1,000 Women |
| 15 to 19 years | 0 (0.0%) | 0.0 |
| 20 to 34 years | 8 (100.0%) | 110.0 |
| 35 to 50 years | 0 (0.0%) | 0.0 |
| Total | 8 (100.0%) | 38.0 |
Fertility by Age by Marriage Status in New Hartford
37.5% of women with births (8) in New Hartford are married. The highest percentage of unmarried women with births falls into 20 to 34 years age bracket with 62.5% of them unmarried at the time of birth, while the lowest percentage of unmarried women with births belong to 20 to 34 years age bracket with 62.5% of them unmarried.
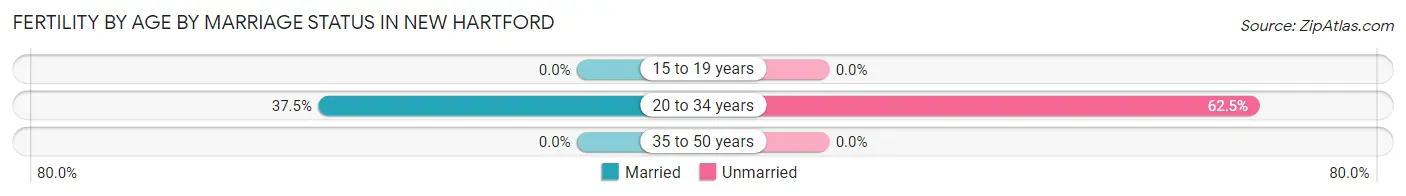
| Age Bracket | Married | Unmarried |
| 15 to 19 years | 0 (0.0%) | 0 (0.0%) |
| 20 to 34 years | 3 (37.5%) | 5 (62.5%) |
| 35 to 50 years | 0 (0.0%) | 0 (0.0%) |
| Total | 3 (37.5%) | 5 (62.5%) |
Fertility by Education in New Hartford
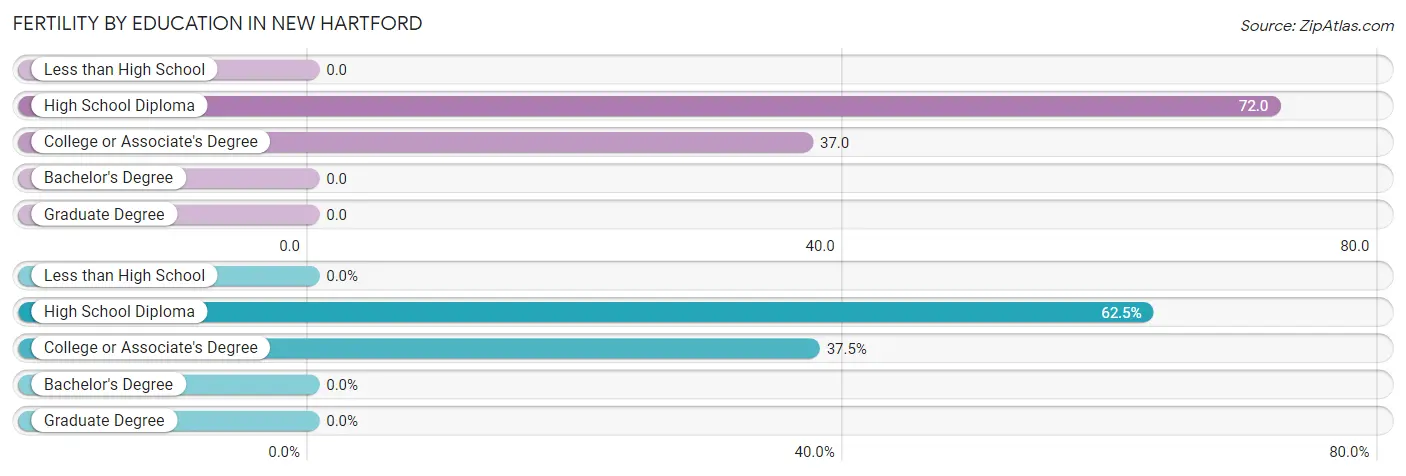
| Educational Attainment | Women with Births | Births / 1,000 Women |
| Less than High School | 0 (0.0%) | 0.0 |
| High School Diploma | 5 (62.5%) | 72.0 |
| College or Associate's Degree | 3 (37.5%) | 37.0 |
| Bachelor's Degree | 0 (0.0%) | 0.0 |
| Graduate Degree | 0 (0.0%) | 0.0 |
| Total | 8 (100.0%) | 38.0 |
Fertility by Education by Marriage Status in New Hartford
62.5% of women with births in New Hartford are unmarried. Women with the educational attainment of college or associate's degree are most likely to be married with 100.0% of them married at childbirth, while women with the educational attainment of high school diploma are least likely to be married with 100.0% of them unmarried at childbirth.
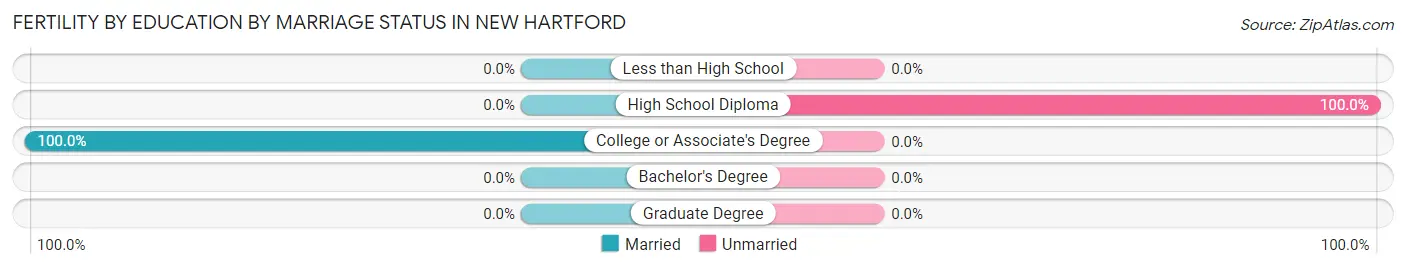
| Educational Attainment | Married | Unmarried |
| Less than High School | 0 (0.0%) | 0 (0.0%) |
| High School Diploma | 0 (0.0%) | 5 (100.0%) |
| College or Associate's Degree | 3 (100.0%) | 0 (0.0%) |
| Bachelor's Degree | 0 (0.0%) | 0 (0.0%) |
| Graduate Degree | 0 (0.0%) | 0 (0.0%) |
| Total | 3 (37.5%) | 5 (62.5%) |
Employment Characteristics in New Hartford
Employment by Class of Employer in New Hartford
Among the 337 employed individuals in New Hartford, private company employees (261 | 77.4%), not-for-profit organizations (24 | 7.1%), and local government employees (22 | 6.5%) make up the most common classes of employment.
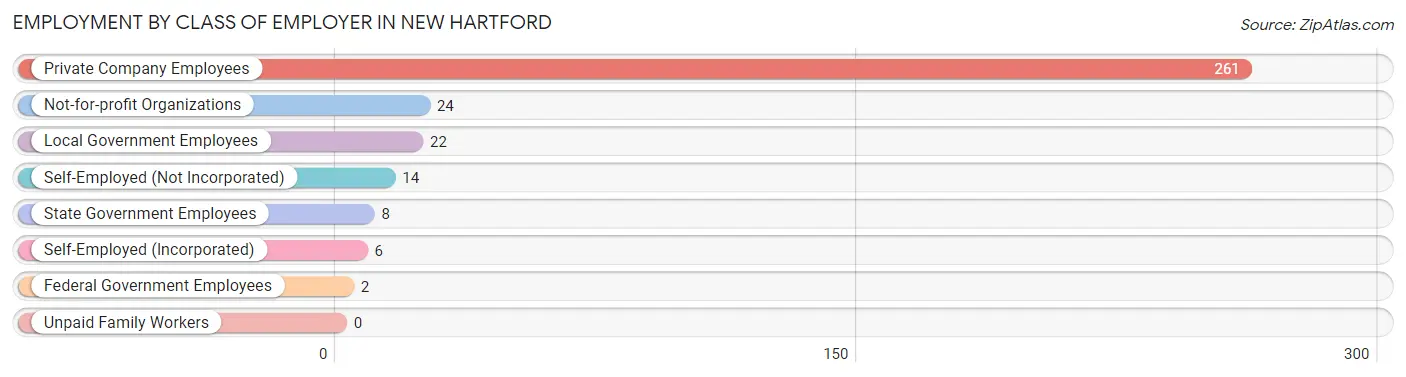
| Employer Class | # Employees | % Employees |
| Private Company Employees | 261 | 77.4% |
| Self-Employed (Incorporated) | 6 | 1.8% |
| Self-Employed (Not Incorporated) | 14 | 4.2% |
| Not-for-profit Organizations | 24 | 7.1% |
| Local Government Employees | 22 | 6.5% |
| State Government Employees | 8 | 2.4% |
| Federal Government Employees | 2 | 0.6% |
| Unpaid Family Workers | 0 | 0.0% |
| Total | 337 | 100.0% |
Employment Status by Age in New Hartford
According to the labor force statistics for New Hartford, out of the total population over 16 years of age (585), 65.8% or 385 individuals are in the labor force, with 6.5% or 25 of them unemployed. The age group with the highest labor force participation rate is 20 to 24 years, with 100.0% or 57 individuals in the labor force. Within the labor force, the 65 to 74 years age range has the highest percentage of unemployed individuals, with 18.2% or 2 of them being unemployed.
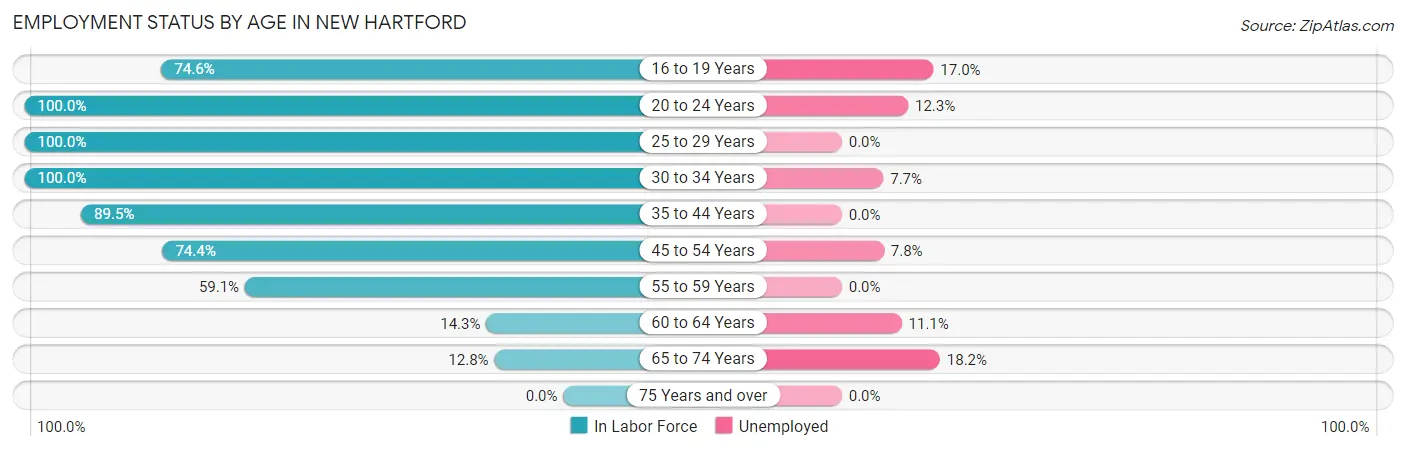
| Age Bracket | In Labor Force | Unemployed |
| 16 to 19 Years | 47 (74.6%) | 8 (17.0%) |
| 20 to 24 Years | 57 (100.0%) | 7 (12.3%) |
| 25 to 29 Years | 39 (100.0%) | 0 (0.0%) |
| 30 to 34 Years | 26 (100.0%) | 2 (7.7%) |
| 35 to 44 Years | 119 (89.5%) | 0 (0.0%) |
| 45 to 54 Years | 64 (74.4%) | 5 (7.8%) |
| 55 to 59 Years | 13 (59.1%) | 0 (0.0%) |
| 60 to 64 Years | 9 (14.3%) | 1 (11.1%) |
| 65 to 74 Years | 11 (12.8%) | 2 (18.2%) |
| 75 Years and over | 0 (0.0%) | 0 (0.0%) |
| Total | 385 (65.8%) | 25 (6.5%) |
Employment Status by Educational Attainment in New Hartford
According to labor force statistics for New Hartford, 73.2% of individuals (270) out of the total population between 25 and 64 years of age (369) are in the labor force, with 3.0% or 8 of them being unemployed. The group with the highest labor force participation rate are those with the educational attainment of bachelor's degree or higher, with 89.8% or 53 individuals in the labor force. Within the labor force, individuals with high school diploma education have the highest percentage of unemployment, with 4.5% or 5 of them being unemployed.
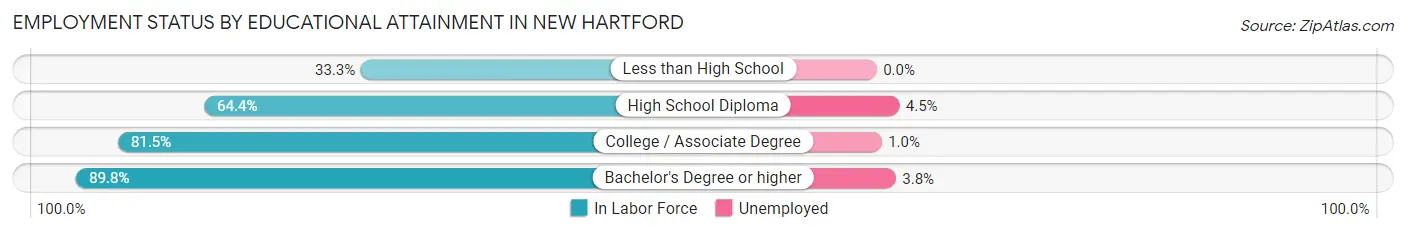
| Educational Attainment | In Labor Force | Unemployed |
| Less than High School | 4 (33.3%) | 0 (0.0%) |
| High School Diploma | 112 (64.4%) | 8 (4.5%) |
| College / Associate Degree | 101 (81.5%) | 1 (1.0%) |
| Bachelor's Degree or higher | 53 (89.8%) | 2 (3.8%) |
| Total | 270 (73.2%) | 11 (3.0%) |
Employment Occupations by Sex in New Hartford
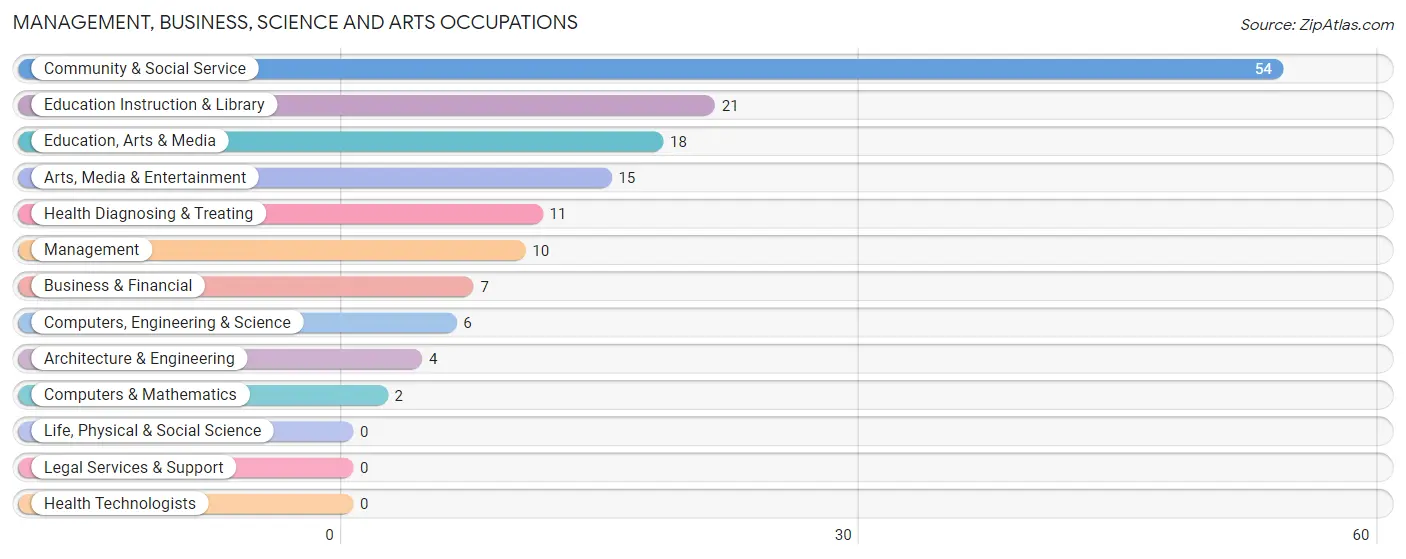
Management, Business, Science and Arts Occupations
The most common Management, Business, Science and Arts occupations in New Hartford are Community & Social Service (54 | 15.0%), Education Instruction & Library (21 | 5.8%), Education, Arts & Media (18 | 5.0%), Arts, Media & Entertainment (15 | 4.2%), and Health Diagnosing & Treating (11 | 3.1%).
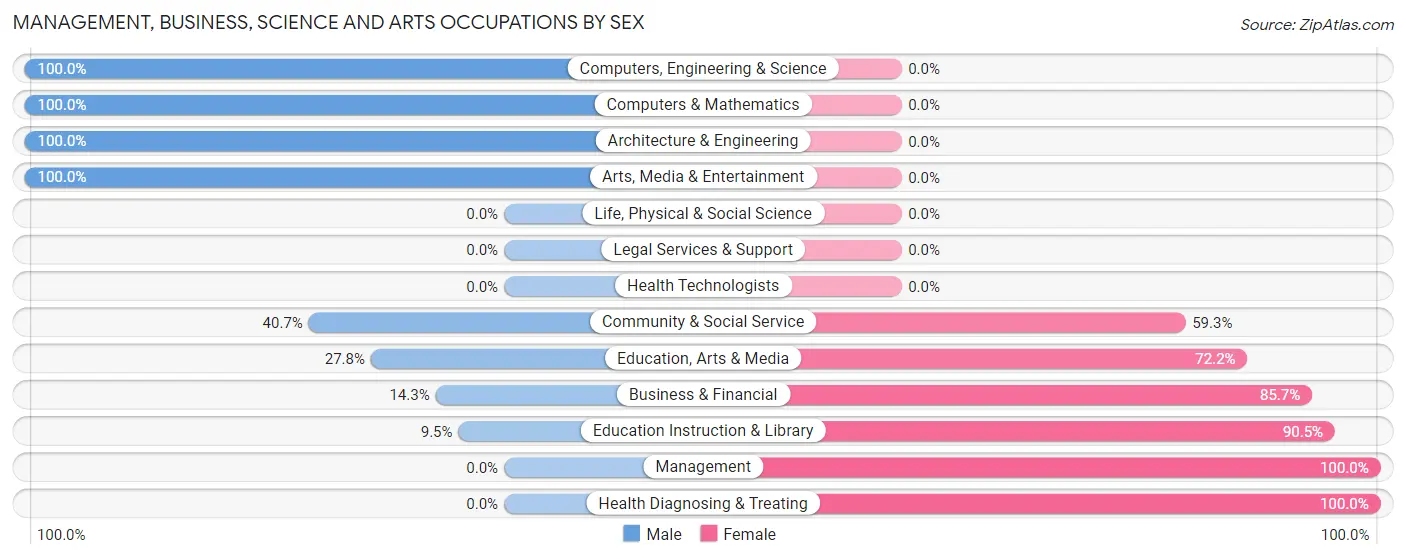
Management, Business, Science and Arts Occupations by Sex
Within the Management, Business, Science and Arts occupations in New Hartford, the most male-oriented occupations are Computers, Engineering & Science (100.0%), Computers & Mathematics (100.0%), and Architecture & Engineering (100.0%), while the most female-oriented occupations are Management (100.0%), Health Diagnosing & Treating (100.0%), and Education Instruction & Library (90.5%).
| Occupation | Male | Female |
| Management | 0 (0.0%) | 10 (100.0%) |
| Business & Financial | 1 (14.3%) | 6 (85.7%) |
| Computers, Engineering & Science | 6 (100.0%) | 0 (0.0%) |
| Computers & Mathematics | 2 (100.0%) | 0 (0.0%) |
| Architecture & Engineering | 4 (100.0%) | 0 (0.0%) |
| Life, Physical & Social Science | 0 (0.0%) | 0 (0.0%) |
| Community & Social Service | 22 (40.7%) | 32 (59.3%) |
| Education, Arts & Media | 5 (27.8%) | 13 (72.2%) |
| Legal Services & Support | 0 (0.0%) | 0 (0.0%) |
| Education Instruction & Library | 2 (9.5%) | 19 (90.5%) |
| Arts, Media & Entertainment | 15 (100.0%) | 0 (0.0%) |
| Health Diagnosing & Treating | 0 (0.0%) | 11 (100.0%) |
| Health Technologists | 0 (0.0%) | 0 (0.0%) |
| Total (Category) | 29 (33.0%) | 59 (67.0%) |
| Total (Overall) | 152 (42.2%) | 208 (57.8%) |
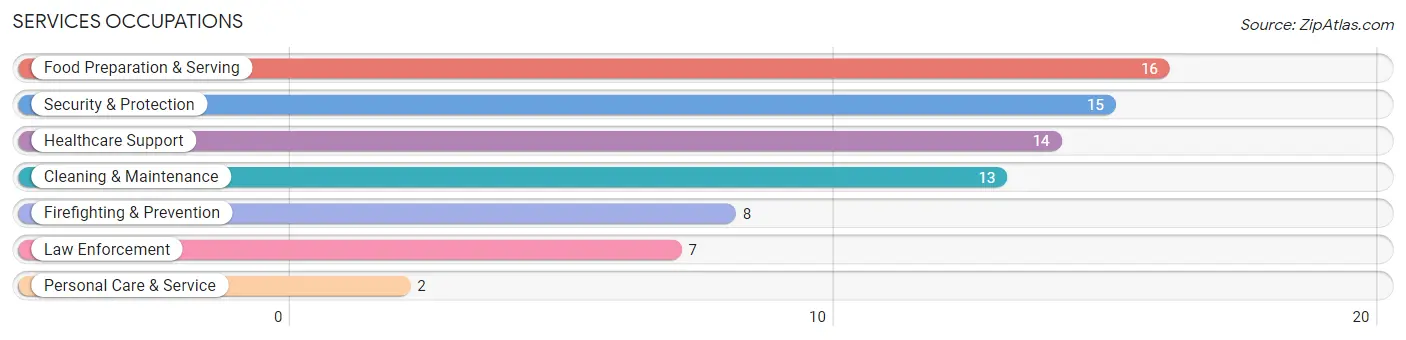
Services Occupations
The most common Services occupations in New Hartford are Food Preparation & Serving (16 | 4.4%), Security & Protection (15 | 4.2%), Healthcare Support (14 | 3.9%), Cleaning & Maintenance (13 | 3.6%), and Firefighting & Prevention (8 | 2.2%).
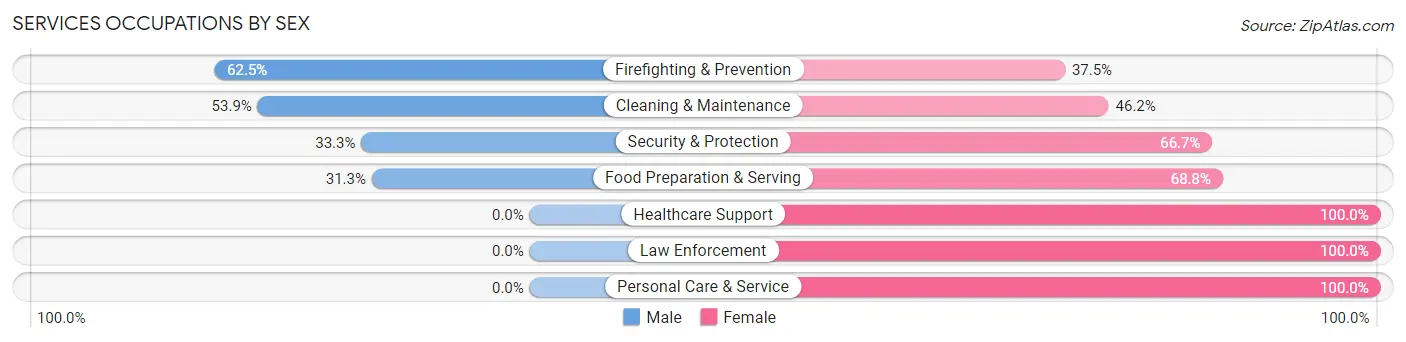
Services Occupations by Sex
Within the Services occupations in New Hartford, the most male-oriented occupations are Firefighting & Prevention (62.5%), Cleaning & Maintenance (53.8%), and Security & Protection (33.3%), while the most female-oriented occupations are Healthcare Support (100.0%), Law Enforcement (100.0%), and Personal Care & Service (100.0%).
| Occupation | Male | Female |
| Healthcare Support | 0 (0.0%) | 14 (100.0%) |
| Security & Protection | 5 (33.3%) | 10 (66.7%) |
| Firefighting & Prevention | 5 (62.5%) | 3 (37.5%) |
| Law Enforcement | 0 (0.0%) | 7 (100.0%) |
| Food Preparation & Serving | 5 (31.2%) | 11 (68.8%) |
| Cleaning & Maintenance | 7 (53.8%) | 6 (46.2%) |
| Personal Care & Service | 0 (0.0%) | 2 (100.0%) |
| Total (Category) | 17 (28.3%) | 43 (71.7%) |
| Total (Overall) | 152 (42.2%) | 208 (57.8%) |
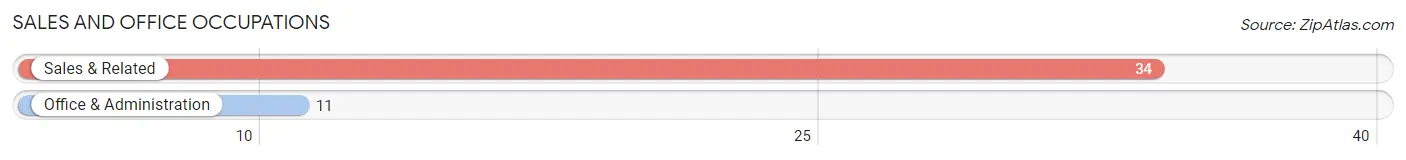
Sales and Office Occupations
The most common Sales and Office occupations in New Hartford are Sales & Related (34 | 9.4%), and Office & Administration (11 | 3.1%).
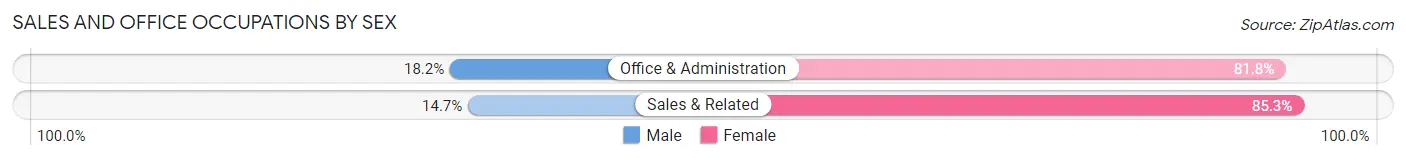
Sales and Office Occupations by Sex
| Occupation | Male | Female |
| Sales & Related | 5 (14.7%) | 29 (85.3%) |
| Office & Administration | 2 (18.2%) | 9 (81.8%) |
| Total (Category) | 7 (15.6%) | 38 (84.4%) |
| Total (Overall) | 152 (42.2%) | 208 (57.8%) |
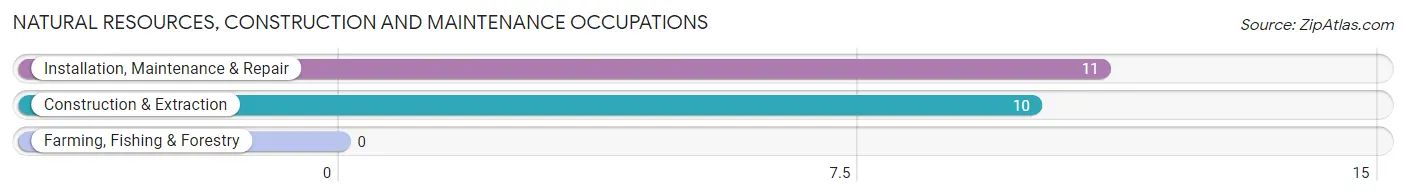
Natural Resources, Construction and Maintenance Occupations
The most common Natural Resources, Construction and Maintenance occupations in New Hartford are Installation, Maintenance & Repair (11 | 3.1%), and Construction & Extraction (10 | 2.8%).
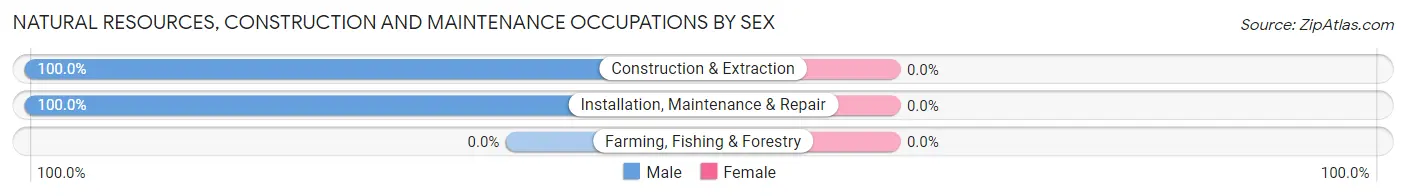
Natural Resources, Construction and Maintenance Occupations by Sex
| Occupation | Male | Female |
| Farming, Fishing & Forestry | 0 (0.0%) | 0 (0.0%) |
| Construction & Extraction | 10 (100.0%) | 0 (0.0%) |
| Installation, Maintenance & Repair | 11 (100.0%) | 0 (0.0%) |
| Total (Category) | 21 (100.0%) | 0 (0.0%) |
| Total (Overall) | 152 (42.2%) | 208 (57.8%) |
Production, Transportation and Moving Occupations
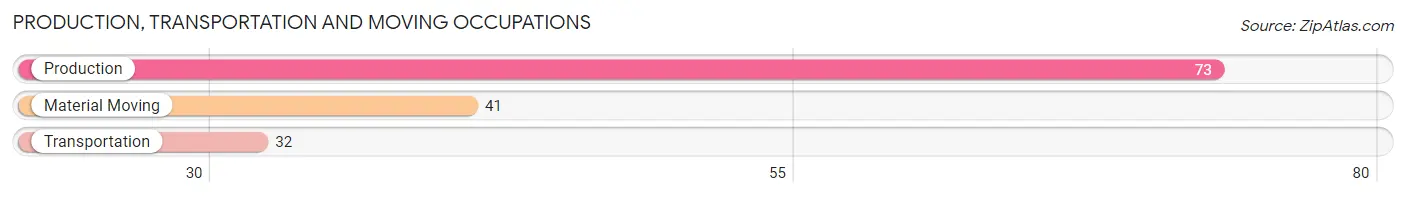
The most common Production, Transportation and Moving occupations in New Hartford are Production (73 | 20.3%), Material Moving (41 | 11.4%), and Transportation (32 | 8.9%).
Production, Transportation and Moving Occupations by Sex
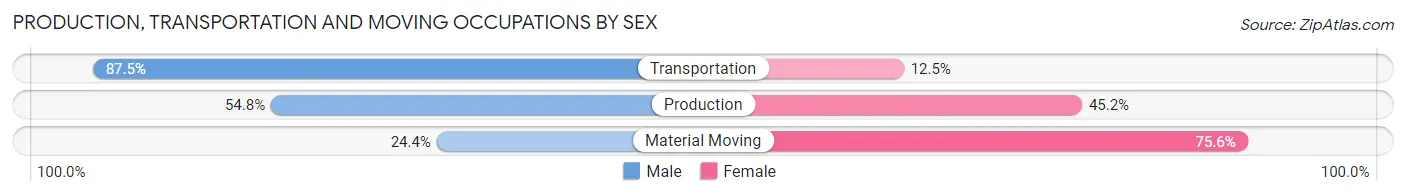
| Occupation | Male | Female |
| Production | 40 (54.8%) | 33 (45.2%) |
| Transportation | 28 (87.5%) | 4 (12.5%) |
| Material Moving | 10 (24.4%) | 31 (75.6%) |
| Total (Category) | 78 (53.4%) | 68 (46.6%) |
| Total (Overall) | 152 (42.2%) | 208 (57.8%) |
Employment Industries by Sex in New Hartford
Employment Industries in New Hartford
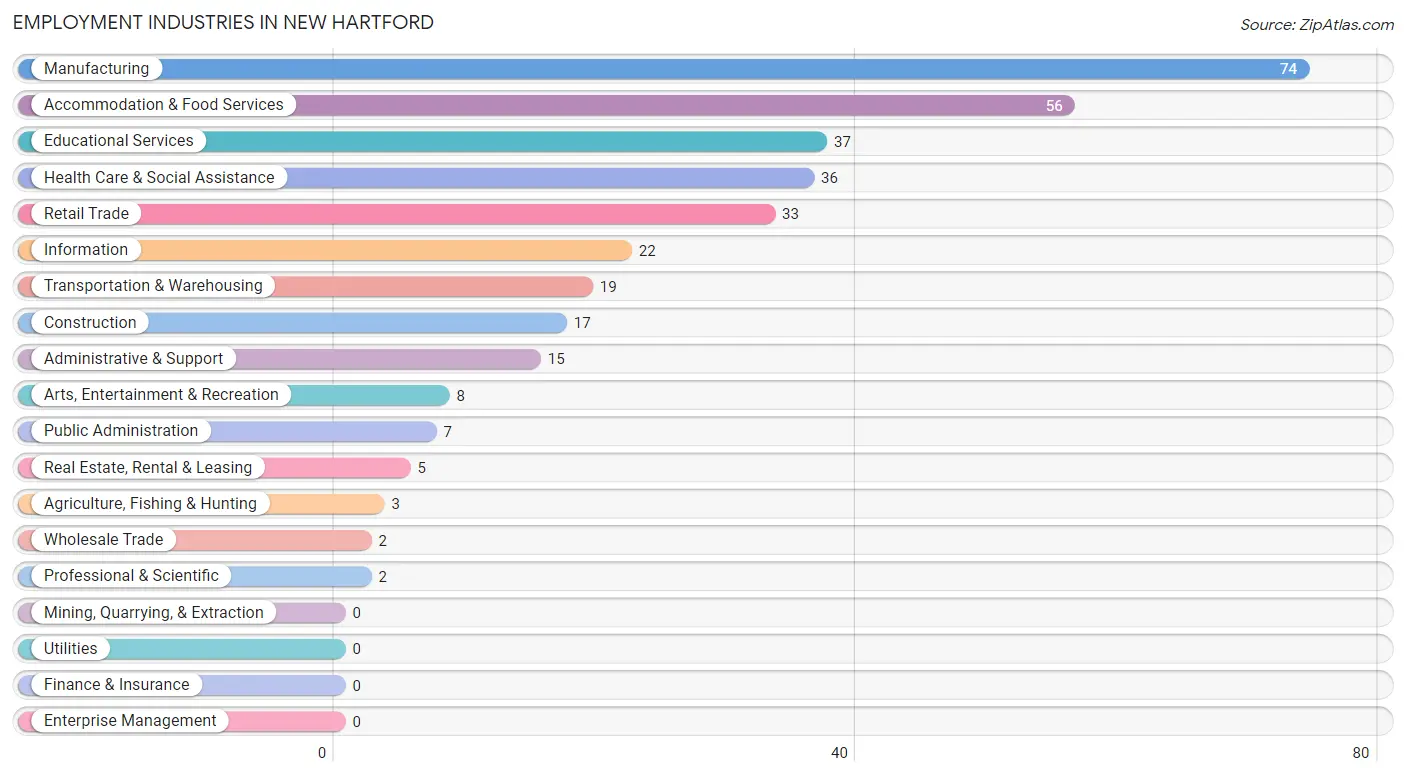
The major employment industries in New Hartford include Manufacturing (74 | 20.6%), Accommodation & Food Services (56 | 15.6%), Educational Services (37 | 10.3%), Health Care & Social Assistance (36 | 10.0%), and Retail Trade (33 | 9.2%).
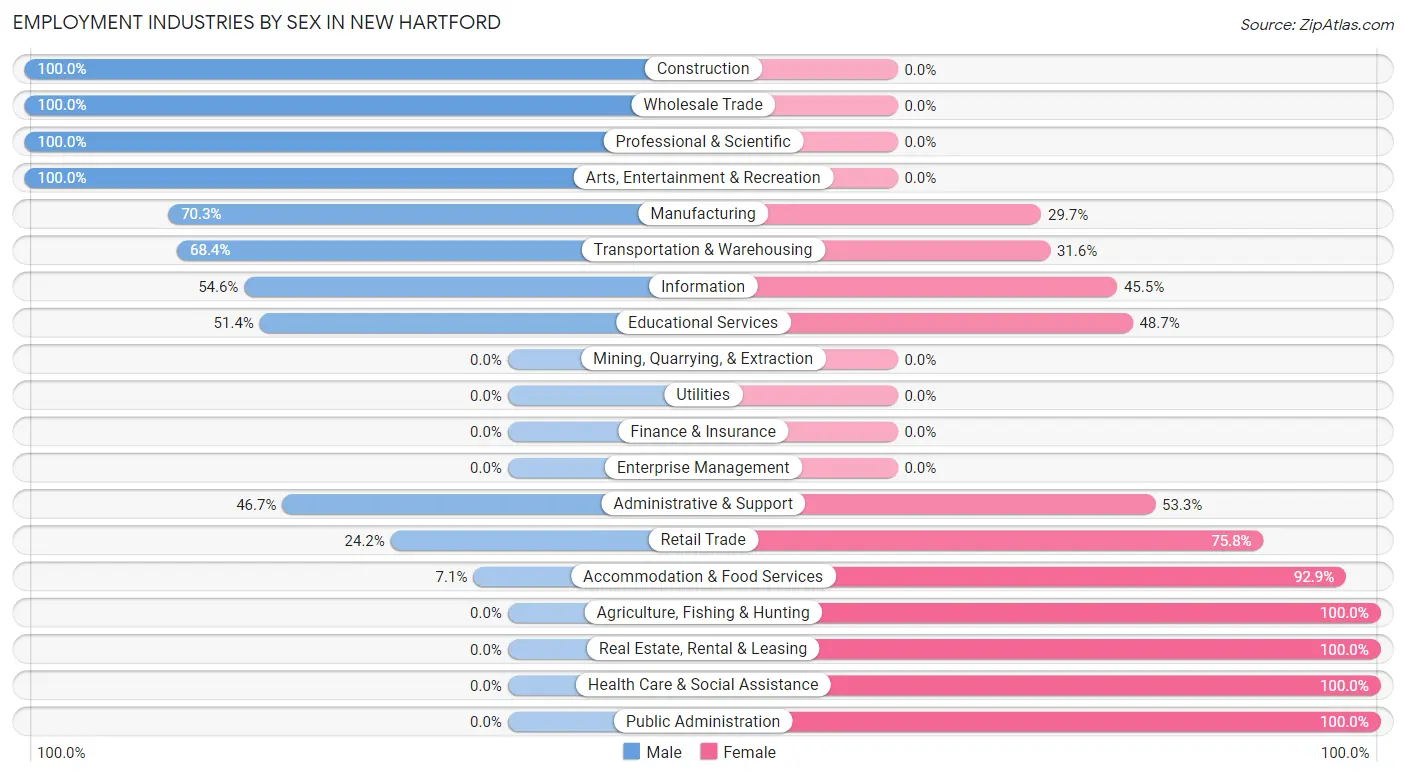
Employment Industries by Sex in New Hartford
The New Hartford industries that see more men than women are Construction (100.0%), Wholesale Trade (100.0%), and Professional & Scientific (100.0%), whereas the industries that tend to have a higher number of women are Agriculture, Fishing & Hunting (100.0%), Real Estate, Rental & Leasing (100.0%), and Health Care & Social Assistance (100.0%).
| Industry | Male | Female |
| Agriculture, Fishing & Hunting | 0 (0.0%) | 3 (100.0%) |
| Mining, Quarrying, & Extraction | 0 (0.0%) | 0 (0.0%) |
| Construction | 17 (100.0%) | 0 (0.0%) |
| Manufacturing | 52 (70.3%) | 22 (29.7%) |
| Wholesale Trade | 2 (100.0%) | 0 (0.0%) |
| Retail Trade | 8 (24.2%) | 25 (75.8%) |
| Transportation & Warehousing | 13 (68.4%) | 6 (31.6%) |
| Utilities | 0 (0.0%) | 0 (0.0%) |
| Information | 12 (54.5%) | 10 (45.5%) |
| Finance & Insurance | 0 (0.0%) | 0 (0.0%) |
| Real Estate, Rental & Leasing | 0 (0.0%) | 5 (100.0%) |
| Professional & Scientific | 2 (100.0%) | 0 (0.0%) |
| Enterprise Management | 0 (0.0%) | 0 (0.0%) |
| Administrative & Support | 7 (46.7%) | 8 (53.3%) |
| Educational Services | 19 (51.3%) | 18 (48.6%) |
| Health Care & Social Assistance | 0 (0.0%) | 36 (100.0%) |
| Arts, Entertainment & Recreation | 8 (100.0%) | 0 (0.0%) |
| Accommodation & Food Services | 4 (7.1%) | 52 (92.9%) |
| Public Administration | 0 (0.0%) | 7 (100.0%) |
| Total | 152 (42.2%) | 208 (57.8%) |
Education in New Hartford
School Enrollment in New Hartford
The most common levels of schooling among the 264 students in New Hartford are high school (83 | 31.4%), middle school (56 | 21.2%), and college / undergraduate (52 | 19.7%).
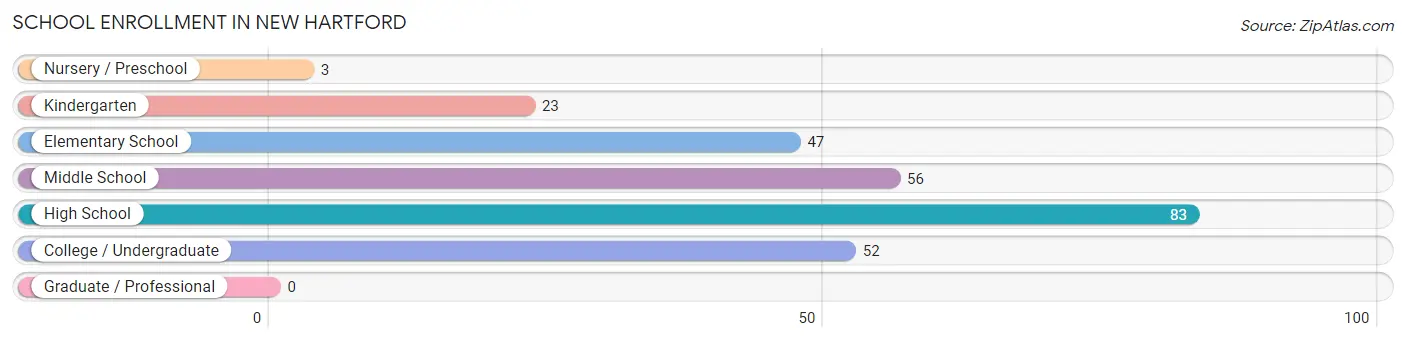
| School Level | # Students | % Students |
| Nursery / Preschool | 3 | 1.1% |
| Kindergarten | 23 | 8.7% |
| Elementary School | 47 | 17.8% |
| Middle School | 56 | 21.2% |
| High School | 83 | 31.4% |
| College / Undergraduate | 52 | 19.7% |
| Graduate / Professional | 0 | 0.0% |
| Total | 264 | 100.0% |
School Enrollment by Age by Funding Source in New Hartford
Out of a total of 264 students who are enrolled in schools in New Hartford, 10 (3.8%) attend a private institution, while the remaining 254 (96.2%) are enrolled in public schools. The age group of 18 to 19 year olds has the highest likelihood of being enrolled in private schools, with 6 (30.0% in the age bracket) enrolled. Conversely, the age group of 3 to 4 year olds has the lowest likelihood of being enrolled in a private school, with 2 (100.0% in the age bracket) attending a public institution.
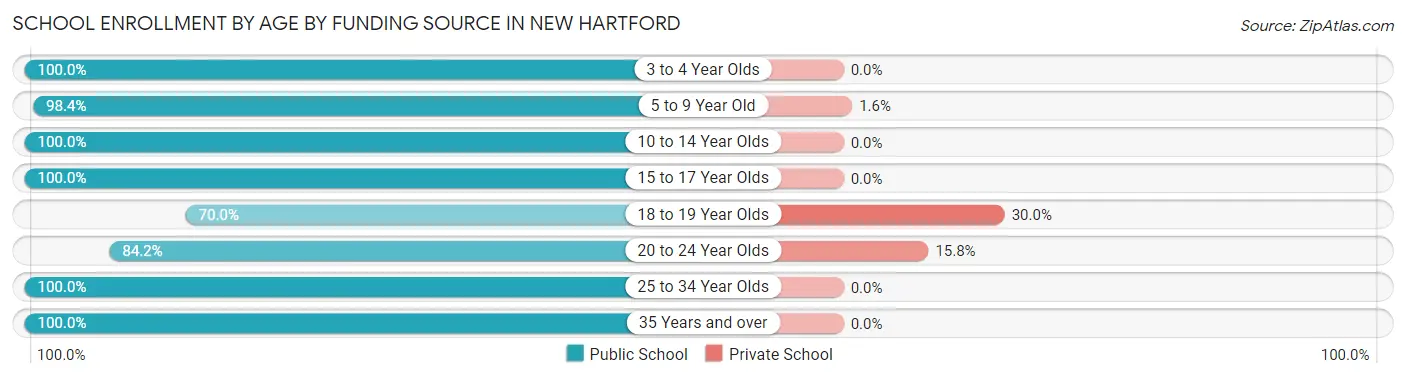
| Age Bracket | Public School | Private School |
| 3 to 4 Year Olds | 2 (100.0%) | 0 (0.0%) |
| 5 to 9 Year Old | 62 (98.4%) | 1 (1.6%) |
| 10 to 14 Year Olds | 66 (100.0%) | 0 (0.0%) |
| 15 to 17 Year Olds | 70 (100.0%) | 0 (0.0%) |
| 18 to 19 Year Olds | 14 (70.0%) | 6 (30.0%) |
| 20 to 24 Year Olds | 16 (84.2%) | 3 (15.8%) |
| 25 to 34 Year Olds | 3 (100.0%) | 0 (0.0%) |
| 35 Years and over | 21 (100.0%) | 0 (0.0%) |
| Total | 254 (96.2%) | 10 (3.8%) |
Educational Attainment by Field of Study in New Hartford
Education (30 | 44.8%), arts & humanities (10 | 14.9%), liberal arts & history (9 | 13.4%), science & technology (5 | 7.5%), and business (5 | 7.5%) are the most common fields of study among 67 individuals in New Hartford who have obtained a bachelor's degree or higher.
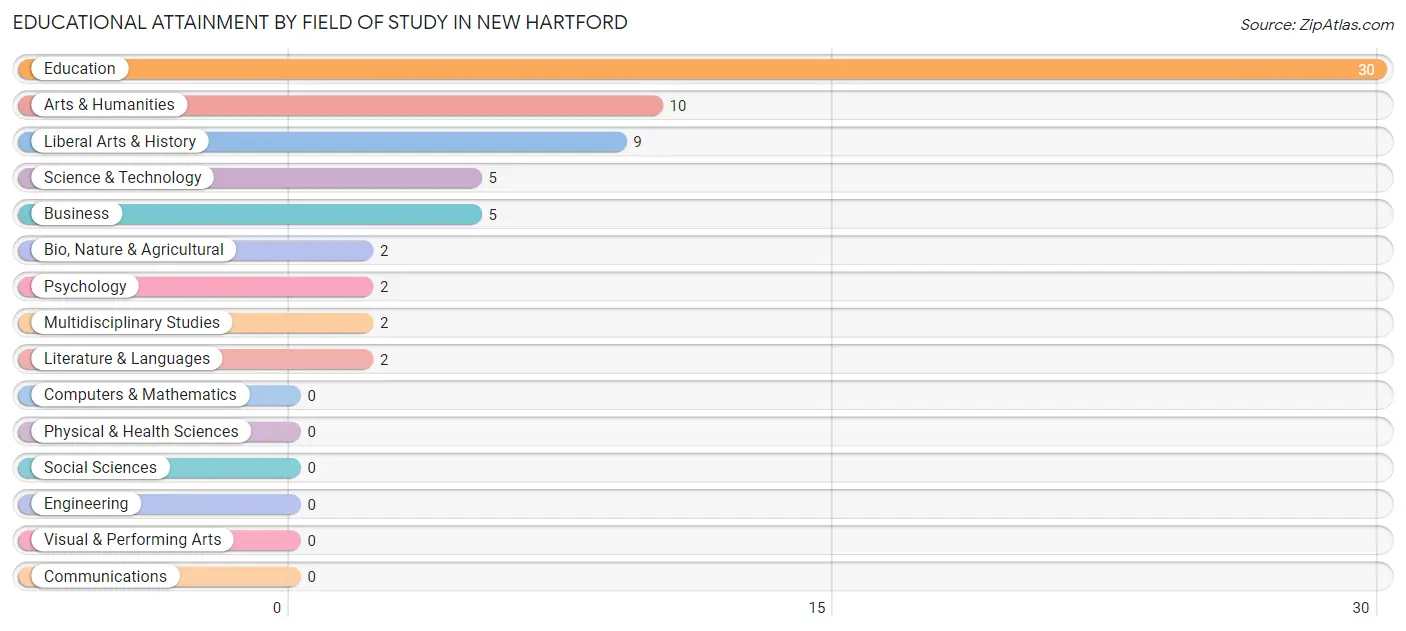
| Field of Study | # Graduates | % Graduates |
| Computers & Mathematics | 0 | 0.0% |
| Bio, Nature & Agricultural | 2 | 3.0% |
| Physical & Health Sciences | 0 | 0.0% |
| Psychology | 2 | 3.0% |
| Social Sciences | 0 | 0.0% |
| Engineering | 0 | 0.0% |
| Multidisciplinary Studies | 2 | 3.0% |
| Science & Technology | 5 | 7.5% |
| Business | 5 | 7.5% |
| Education | 30 | 44.8% |
| Literature & Languages | 2 | 3.0% |
| Liberal Arts & History | 9 | 13.4% |
| Visual & Performing Arts | 0 | 0.0% |
| Communications | 0 | 0.0% |
| Arts & Humanities | 10 | 14.9% |
| Total | 67 | 100.0% |
Transportation & Commute in New Hartford
Vehicle Availability by Sex in New Hartford
The most prevalent vehicle ownership categories in New Hartford are males with 2 vehicles (54, accounting for 40.3%) and females with 2 vehicles (81, making up 26.6%).
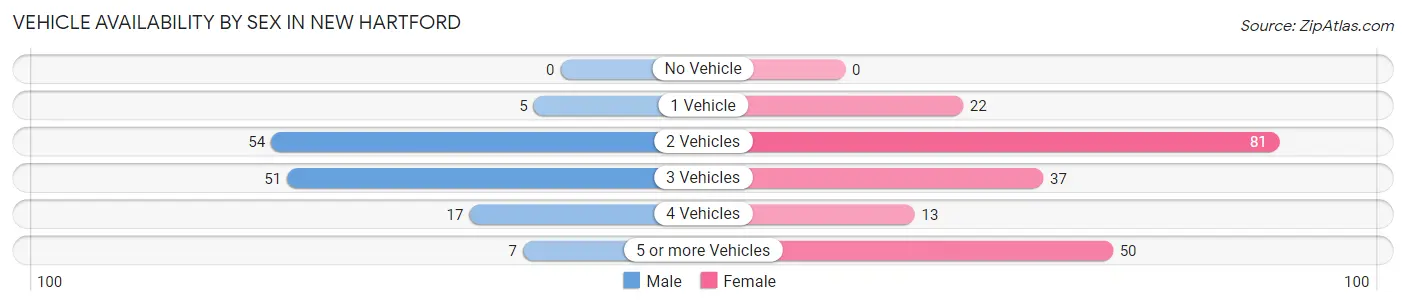
| Vehicles Available | Male | Female |
| No Vehicle | 0 (0.0%) | 0 (0.0%) |
| 1 Vehicle | 5 (3.7%) | 22 (10.8%) |
| 2 Vehicles | 54 (40.3%) | 81 (39.9%) |
| 3 Vehicles | 51 (38.1%) | 37 (18.2%) |
| 4 Vehicles | 17 (12.7%) | 13 (6.4%) |
| 5 or more Vehicles | 7 (5.2%) | 50 (24.6%) |
| Total | 134 (100.0%) | 203 (100.0%) |
Commute Time in New Hartford
The most frequently occuring commute durations in New Hartford are 30 to 34 minutes (103 commuters, 30.8%), 20 to 24 minutes (76 commuters, 22.8%), and 15 to 19 minutes (65 commuters, 19.5%).
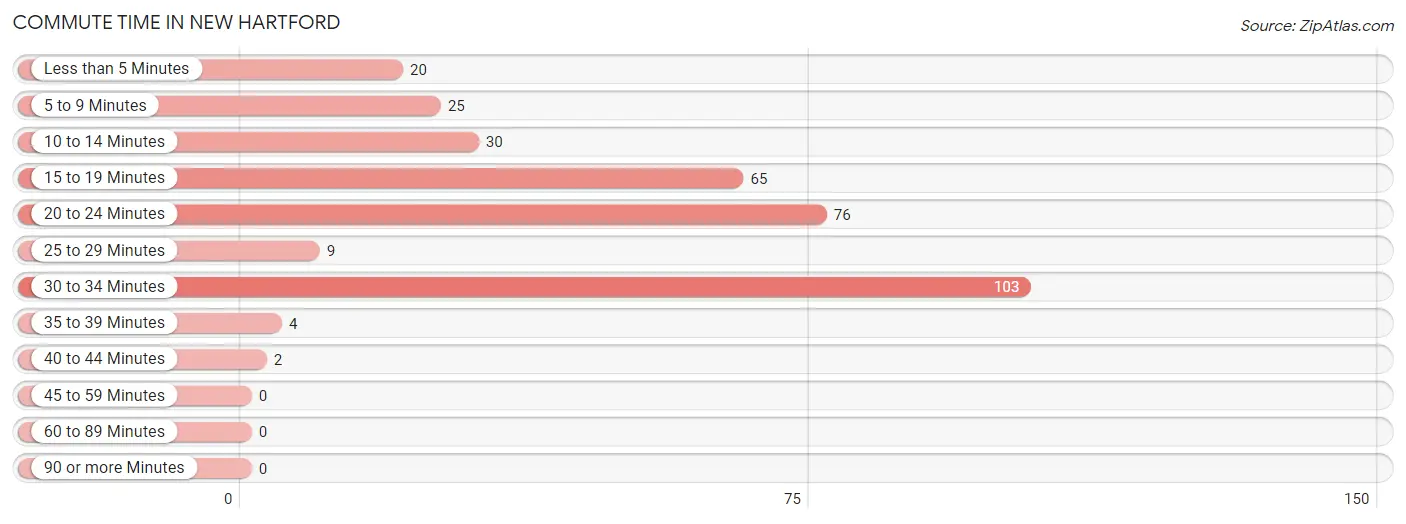
| Commute Time | # Commuters | % Commuters |
| Less than 5 Minutes | 20 | 6.0% |
| 5 to 9 Minutes | 25 | 7.5% |
| 10 to 14 Minutes | 30 | 9.0% |
| 15 to 19 Minutes | 65 | 19.5% |
| 20 to 24 Minutes | 76 | 22.8% |
| 25 to 29 Minutes | 9 | 2.7% |
| 30 to 34 Minutes | 103 | 30.8% |
| 35 to 39 Minutes | 4 | 1.2% |
| 40 to 44 Minutes | 2 | 0.6% |
| 45 to 59 Minutes | 0 | 0.0% |
| 60 to 89 Minutes | 0 | 0.0% |
| 90 or more Minutes | 0 | 0.0% |
Commute Time by Sex in New Hartford
The most common commute times in New Hartford are 15 to 19 minutes (47 commuters, 35.1%) for males and 30 to 34 minutes (65 commuters, 32.5%) for females.
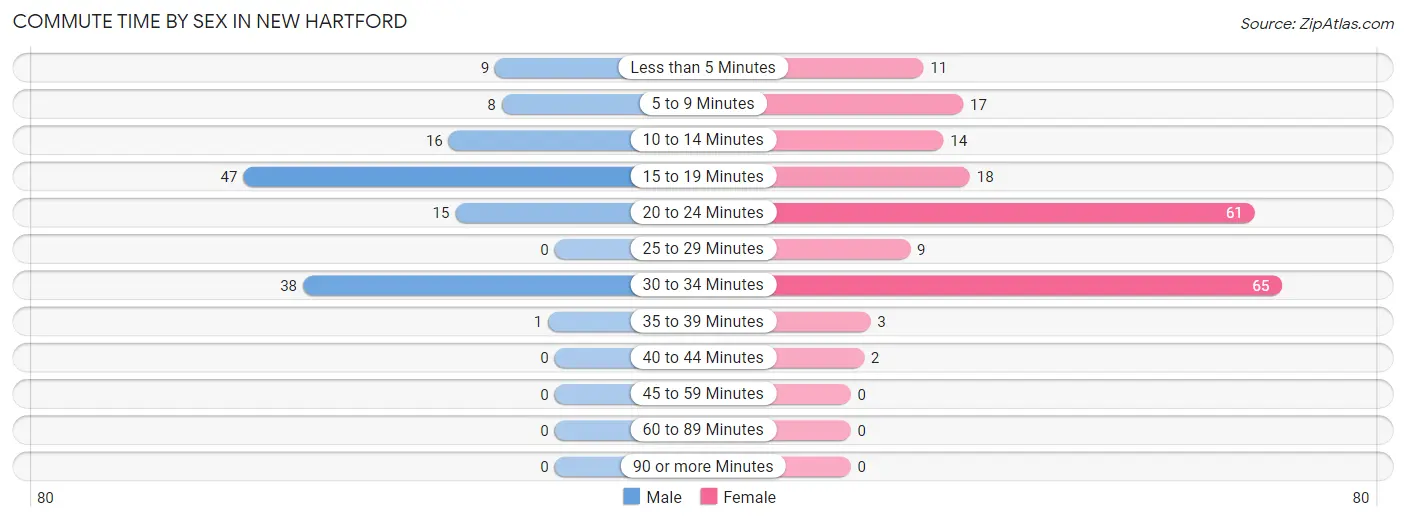
| Commute Time | Male | Female |
| Less than 5 Minutes | 9 (6.7%) | 11 (5.5%) |
| 5 to 9 Minutes | 8 (6.0%) | 17 (8.5%) |
| 10 to 14 Minutes | 16 (11.9%) | 14 (7.0%) |
| 15 to 19 Minutes | 47 (35.1%) | 18 (9.0%) |
| 20 to 24 Minutes | 15 (11.2%) | 61 (30.5%) |
| 25 to 29 Minutes | 0 (0.0%) | 9 (4.5%) |
| 30 to 34 Minutes | 38 (28.4%) | 65 (32.5%) |
| 35 to 39 Minutes | 1 (0.7%) | 3 (1.5%) |
| 40 to 44 Minutes | 0 (0.0%) | 2 (1.0%) |
| 45 to 59 Minutes | 0 (0.0%) | 0 (0.0%) |
| 60 to 89 Minutes | 0 (0.0%) | 0 (0.0%) |
| 90 or more Minutes | 0 (0.0%) | 0 (0.0%) |
Time of Departure to Work by Sex in New Hartford
The most frequent times of departure to work in New Hartford are 7:00 AM to 7:29 AM (41, 30.6%) for males and 8:00 AM to 8:29 AM (37, 18.5%) for females.
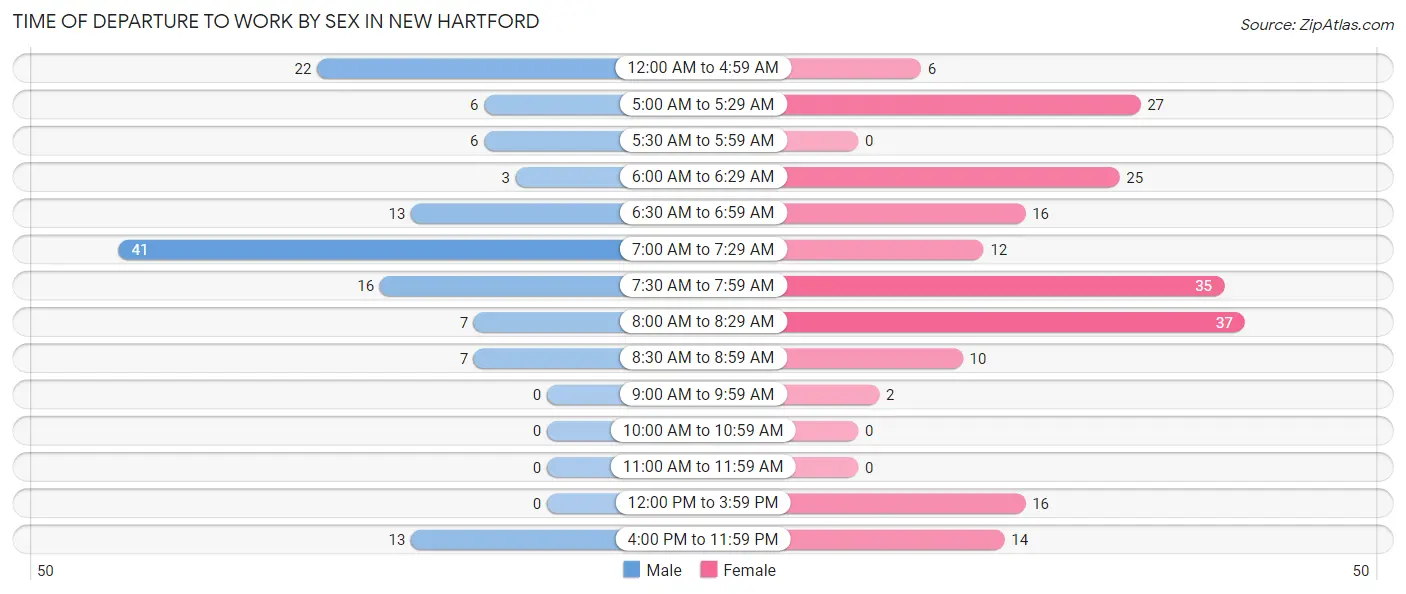
| Time of Departure | Male | Female |
| 12:00 AM to 4:59 AM | 22 (16.4%) | 6 (3.0%) |
| 5:00 AM to 5:29 AM | 6 (4.5%) | 27 (13.5%) |
| 5:30 AM to 5:59 AM | 6 (4.5%) | 0 (0.0%) |
| 6:00 AM to 6:29 AM | 3 (2.2%) | 25 (12.5%) |
| 6:30 AM to 6:59 AM | 13 (9.7%) | 16 (8.0%) |
| 7:00 AM to 7:29 AM | 41 (30.6%) | 12 (6.0%) |
| 7:30 AM to 7:59 AM | 16 (11.9%) | 35 (17.5%) |
| 8:00 AM to 8:29 AM | 7 (5.2%) | 37 (18.5%) |
| 8:30 AM to 8:59 AM | 7 (5.2%) | 10 (5.0%) |
| 9:00 AM to 9:59 AM | 0 (0.0%) | 2 (1.0%) |
| 10:00 AM to 10:59 AM | 0 (0.0%) | 0 (0.0%) |
| 11:00 AM to 11:59 AM | 0 (0.0%) | 0 (0.0%) |
| 12:00 PM to 3:59 PM | 0 (0.0%) | 16 (8.0%) |
| 4:00 PM to 11:59 PM | 13 (9.7%) | 14 (7.0%) |
| Total | 134 (100.0%) | 200 (100.0%) |
Housing Occupancy in New Hartford
Occupancy by Ownership in New Hartford
Of the total 273 dwellings in New Hartford, owner-occupied units account for 200 (73.3%), while renter-occupied units make up 73 (26.7%).
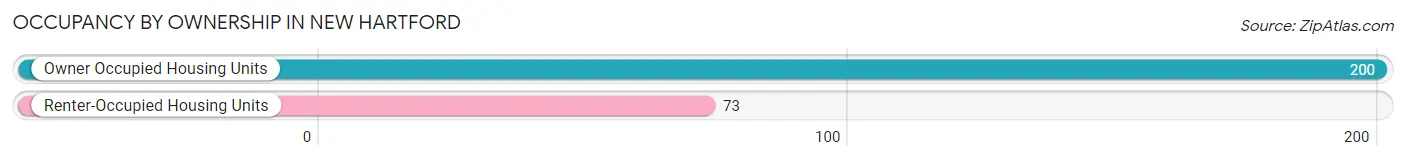
| Occupancy | # Housing Units | % Housing Units |
| Owner Occupied Housing Units | 200 | 73.3% |
| Renter-Occupied Housing Units | 73 | 26.7% |
| Total Occupied Housing Units | 273 | 100.0% |
Occupancy by Household Size in New Hartford
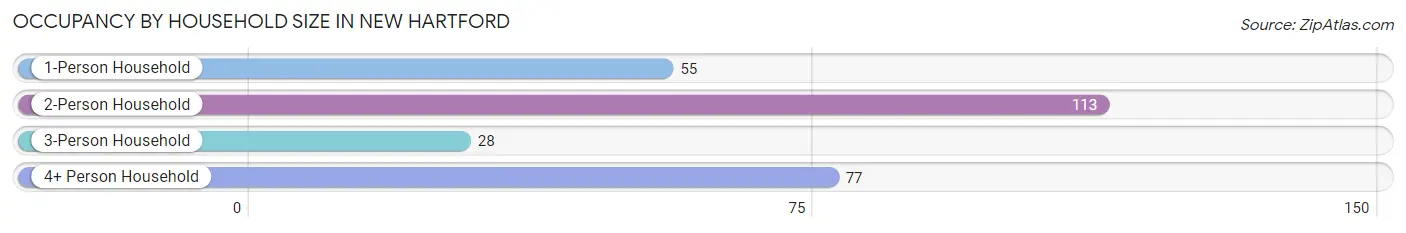
| Household Size | # Housing Units | % Housing Units |
| 1-Person Household | 55 | 20.2% |
| 2-Person Household | 113 | 41.4% |
| 3-Person Household | 28 | 10.3% |
| 4+ Person Household | 77 | 28.2% |
| Total Housing Units | 273 | 100.0% |
Occupancy by Ownership by Household Size in New Hartford
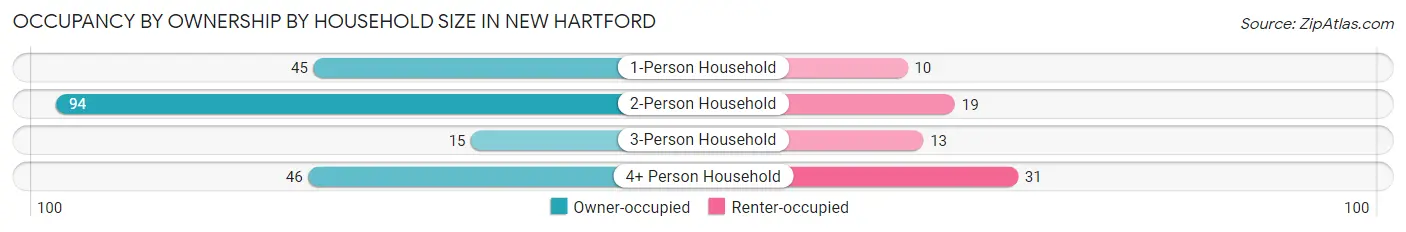
| Household Size | Owner-occupied | Renter-occupied |
| 1-Person Household | 45 (81.8%) | 10 (18.2%) |
| 2-Person Household | 94 (83.2%) | 19 (16.8%) |
| 3-Person Household | 15 (53.6%) | 13 (46.4%) |
| 4+ Person Household | 46 (59.7%) | 31 (40.3%) |
| Total Housing Units | 200 (73.3%) | 73 (26.7%) |
Occupancy by Educational Attainment in New Hartford
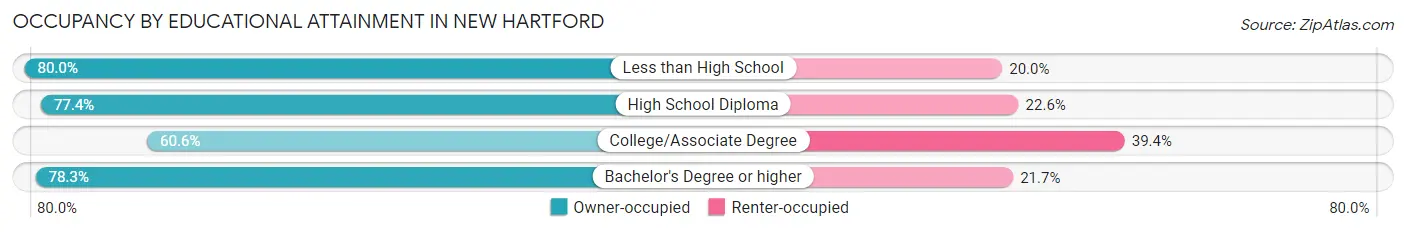
| Household Size | Owner-occupied | Renter-occupied |
| Less than High School | 8 (80.0%) | 2 (20.0%) |
| High School Diploma | 113 (77.4%) | 33 (22.6%) |
| College/Associate Degree | 43 (60.6%) | 28 (39.4%) |
| Bachelor's Degree or higher | 36 (78.3%) | 10 (21.7%) |
Occupancy by Age of Householder in New Hartford
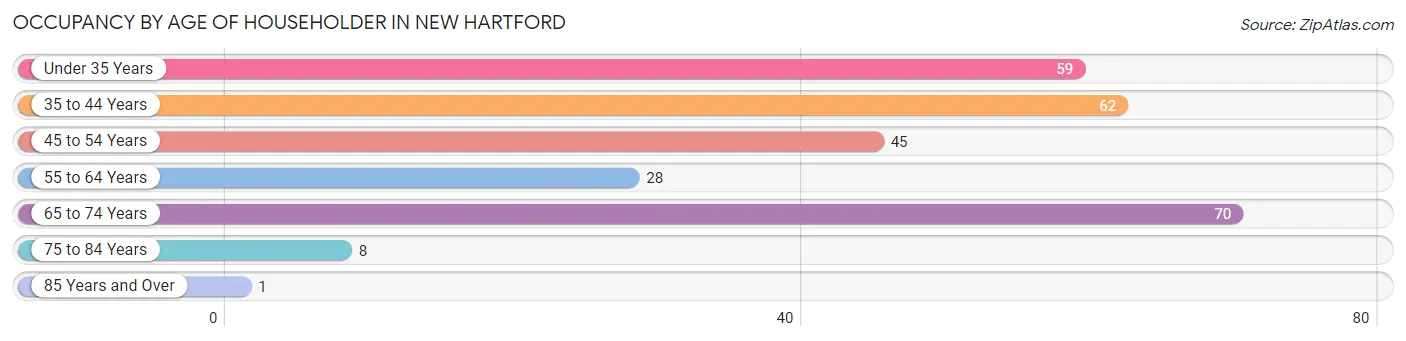
| Age Bracket | # Households | % Households |
| Under 35 Years | 59 | 21.6% |
| 35 to 44 Years | 62 | 22.7% |
| 45 to 54 Years | 45 | 16.5% |
| 55 to 64 Years | 28 | 10.3% |
| 65 to 74 Years | 70 | 25.6% |
| 75 to 84 Years | 8 | 2.9% |
| 85 Years and Over | 1 | 0.4% |
| Total | 273 | 100.0% |
Housing Finances in New Hartford
Median Income by Occupancy in New Hartford
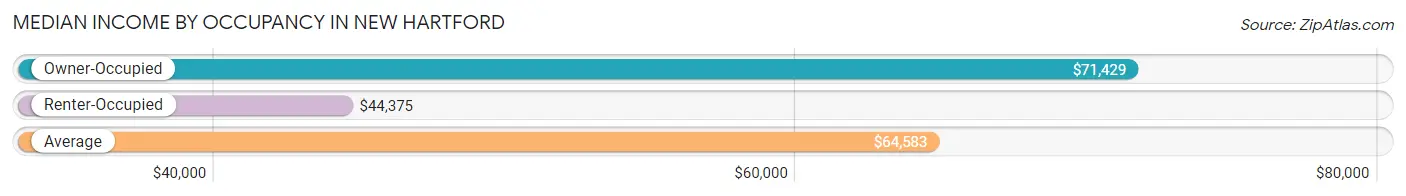
| Occupancy Type | # Households | Median Income |
| Owner-Occupied | 200 (73.3%) | $71,429 |
| Renter-Occupied | 73 (26.7%) | $44,375 |
| Average | 273 (100.0%) | $64,583 |
Occupancy by Householder Income Bracket in New Hartford
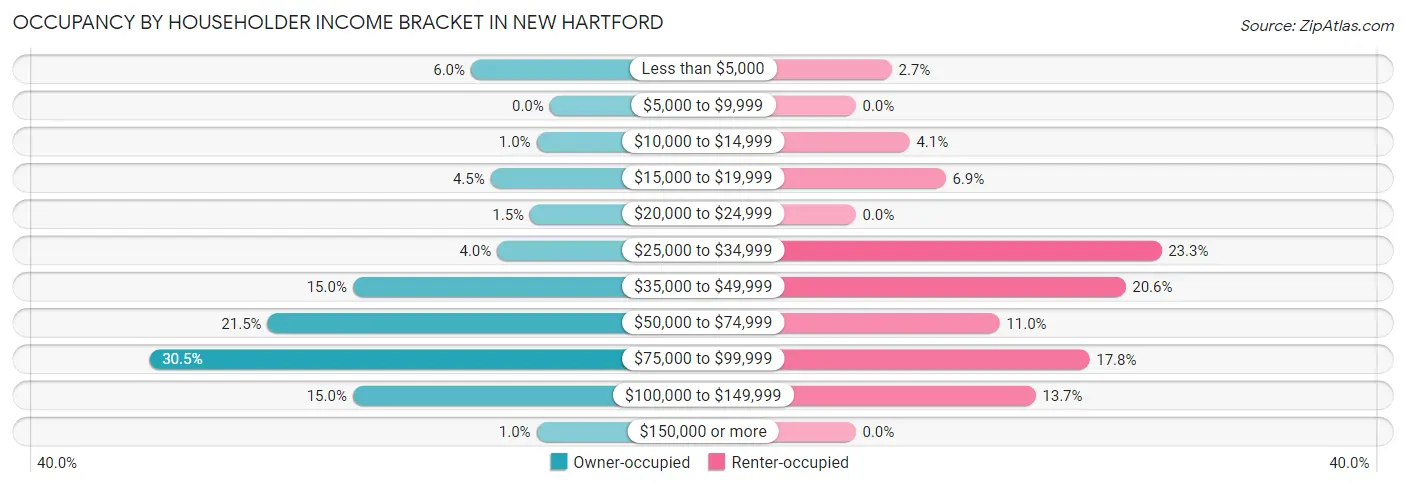
| Income Bracket | Owner-occupied | Renter-occupied |
| Less than $5,000 | 12 (6.0%) | 2 (2.7%) |
| $5,000 to $9,999 | 0 (0.0%) | 0 (0.0%) |
| $10,000 to $14,999 | 2 (1.0%) | 3 (4.1%) |
| $15,000 to $19,999 | 9 (4.5%) | 5 (6.9%) |
| $20,000 to $24,999 | 3 (1.5%) | 0 (0.0%) |
| $25,000 to $34,999 | 8 (4.0%) | 17 (23.3%) |
| $35,000 to $49,999 | 30 (15.0%) | 15 (20.5%) |
| $50,000 to $74,999 | 43 (21.5%) | 8 (11.0%) |
| $75,000 to $99,999 | 61 (30.5%) | 13 (17.8%) |
| $100,000 to $149,999 | 30 (15.0%) | 10 (13.7%) |
| $150,000 or more | 2 (1.0%) | 0 (0.0%) |
| Total | 200 (100.0%) | 73 (100.0%) |
Monthly Housing Cost Tiers in New Hartford
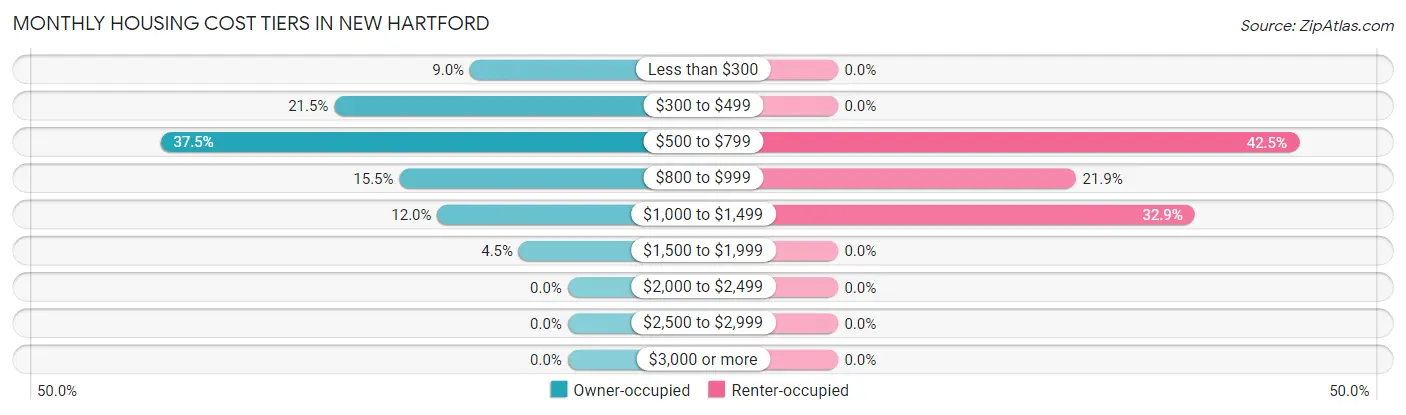
| Monthly Cost | Owner-occupied | Renter-occupied |
| Less than $300 | 18 (9.0%) | 0 (0.0%) |
| $300 to $499 | 43 (21.5%) | 0 (0.0%) |
| $500 to $799 | 75 (37.5%) | 31 (42.5%) |
| $800 to $999 | 31 (15.5%) | 16 (21.9%) |
| $1,000 to $1,499 | 24 (12.0%) | 24 (32.9%) |
| $1,500 to $1,999 | 9 (4.5%) | 0 (0.0%) |
| $2,000 to $2,499 | 0 (0.0%) | 0 (0.0%) |
| $2,500 to $2,999 | 0 (0.0%) | 0 (0.0%) |
| $3,000 or more | 0 (0.0%) | 0 (0.0%) |
| Total | 200 (100.0%) | 73 (100.0%) |
Physical Housing Characteristics in New Hartford
Housing Structures in New Hartford
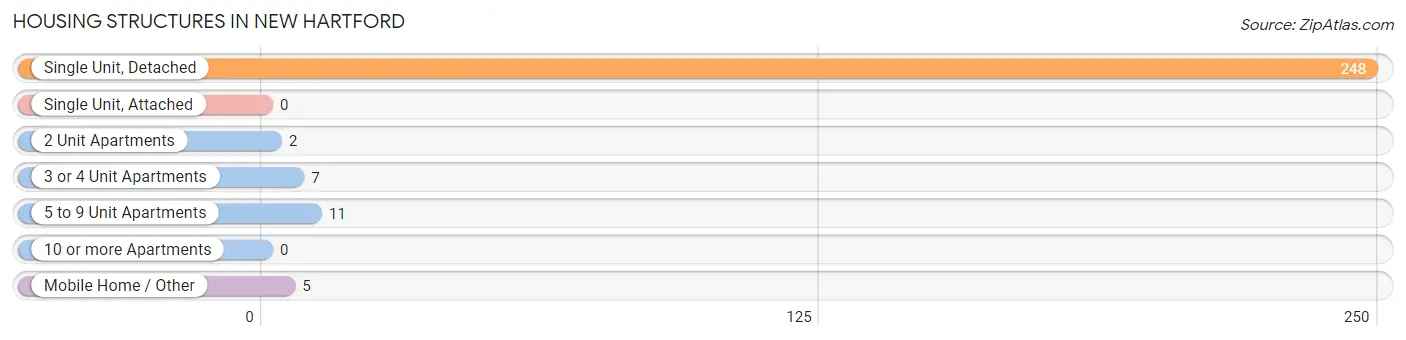
| Structure Type | # Housing Units | % Housing Units |
| Single Unit, Detached | 248 | 90.8% |
| Single Unit, Attached | 0 | 0.0% |
| 2 Unit Apartments | 2 | 0.7% |
| 3 or 4 Unit Apartments | 7 | 2.6% |
| 5 to 9 Unit Apartments | 11 | 4.0% |
| 10 or more Apartments | 0 | 0.0% |
| Mobile Home / Other | 5 | 1.8% |
| Total | 273 | 100.0% |
Housing Structures by Occupancy in New Hartford
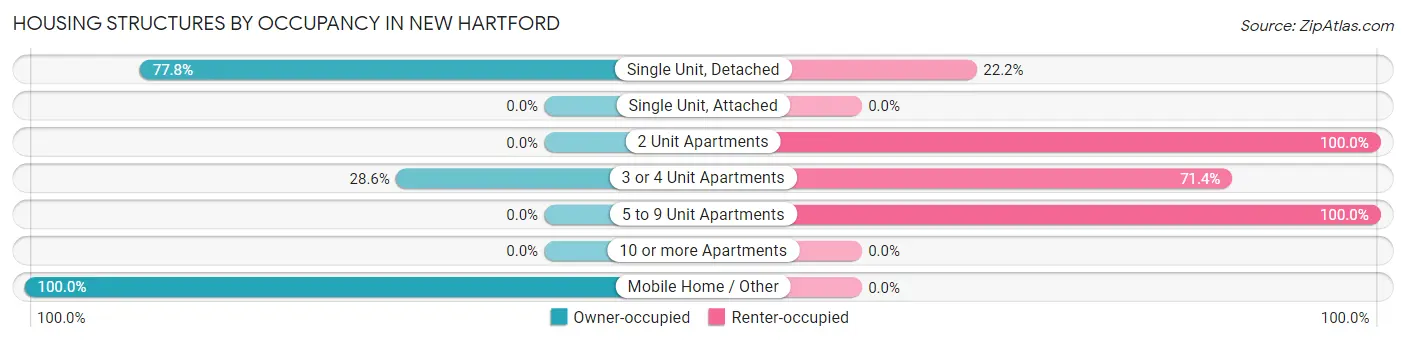
| Structure Type | Owner-occupied | Renter-occupied |
| Single Unit, Detached | 193 (77.8%) | 55 (22.2%) |
| Single Unit, Attached | 0 (0.0%) | 0 (0.0%) |
| 2 Unit Apartments | 0 (0.0%) | 2 (100.0%) |
| 3 or 4 Unit Apartments | 2 (28.6%) | 5 (71.4%) |
| 5 to 9 Unit Apartments | 0 (0.0%) | 11 (100.0%) |
| 10 or more Apartments | 0 (0.0%) | 0 (0.0%) |
| Mobile Home / Other | 5 (100.0%) | 0 (0.0%) |
| Total | 200 (73.3%) | 73 (26.7%) |
Housing Structures by Number of Rooms in New Hartford
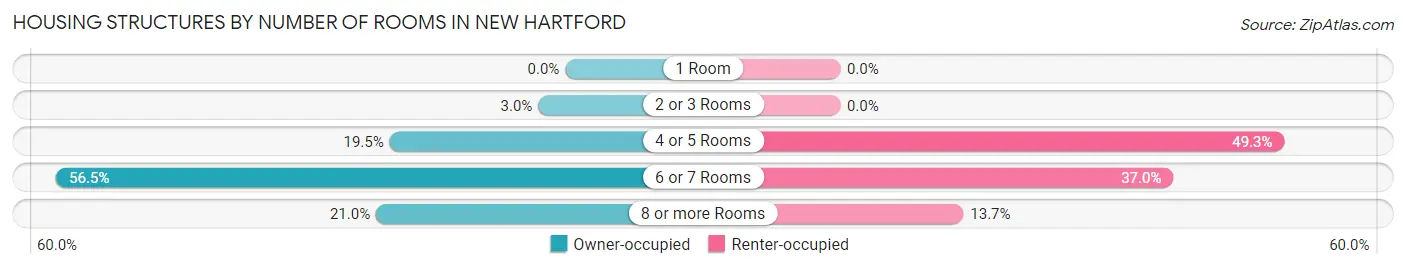
| Number of Rooms | Owner-occupied | Renter-occupied |
| 1 Room | 0 (0.0%) | 0 (0.0%) |
| 2 or 3 Rooms | 6 (3.0%) | 0 (0.0%) |
| 4 or 5 Rooms | 39 (19.5%) | 36 (49.3%) |
| 6 or 7 Rooms | 113 (56.5%) | 27 (37.0%) |
| 8 or more Rooms | 42 (21.0%) | 10 (13.7%) |
| Total | 200 (100.0%) | 73 (100.0%) |
Housing Structure by Heating Type in New Hartford
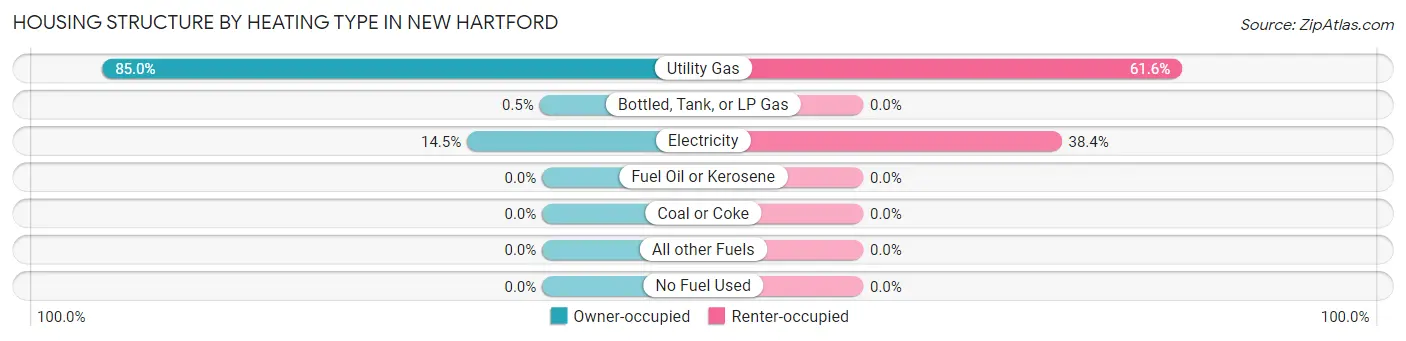
| Heating Type | Owner-occupied | Renter-occupied |
| Utility Gas | 170 (85.0%) | 45 (61.6%) |
| Bottled, Tank, or LP Gas | 1 (0.5%) | 0 (0.0%) |
| Electricity | 29 (14.5%) | 28 (38.4%) |
| Fuel Oil or Kerosene | 0 (0.0%) | 0 (0.0%) |
| Coal or Coke | 0 (0.0%) | 0 (0.0%) |
| All other Fuels | 0 (0.0%) | 0 (0.0%) |
| No Fuel Used | 0 (0.0%) | 0 (0.0%) |
| Total | 200 (100.0%) | 73 (100.0%) |
Household Vehicle Usage in New Hartford
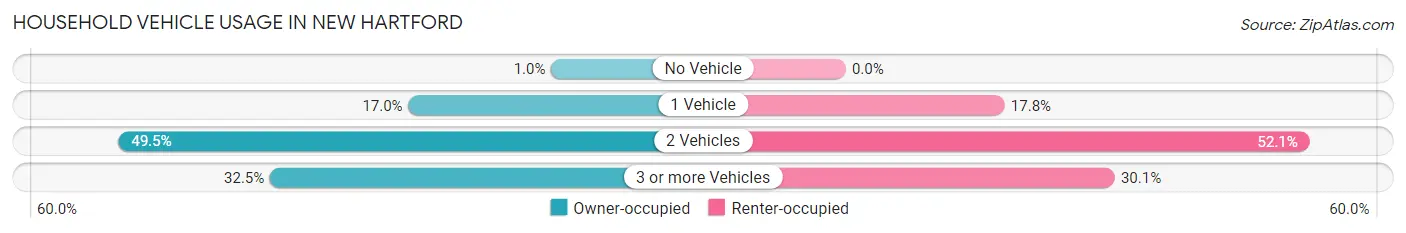
| Vehicles per Household | Owner-occupied | Renter-occupied |
| No Vehicle | 2 (1.0%) | 0 (0.0%) |
| 1 Vehicle | 34 (17.0%) | 13 (17.8%) |
| 2 Vehicles | 99 (49.5%) | 38 (52.0%) |
| 3 or more Vehicles | 65 (32.5%) | 22 (30.1%) |
| Total | 200 (100.0%) | 73 (100.0%) |
Real Estate & Mortgages in New Hartford
Real Estate and Mortgage Overview in New Hartford
| Characteristic | Without Mortgage | With Mortgage |
| Housing Units | 104 | 96 |
| Median Property Value | $100,000 | $91,700 |
| Median Household Income | $66,250 | $2 |
| Monthly Housing Costs | $395 | $0 |
| Real Estate Taxes | $1,625 | $2 |
Property Value by Mortgage Status in New Hartford
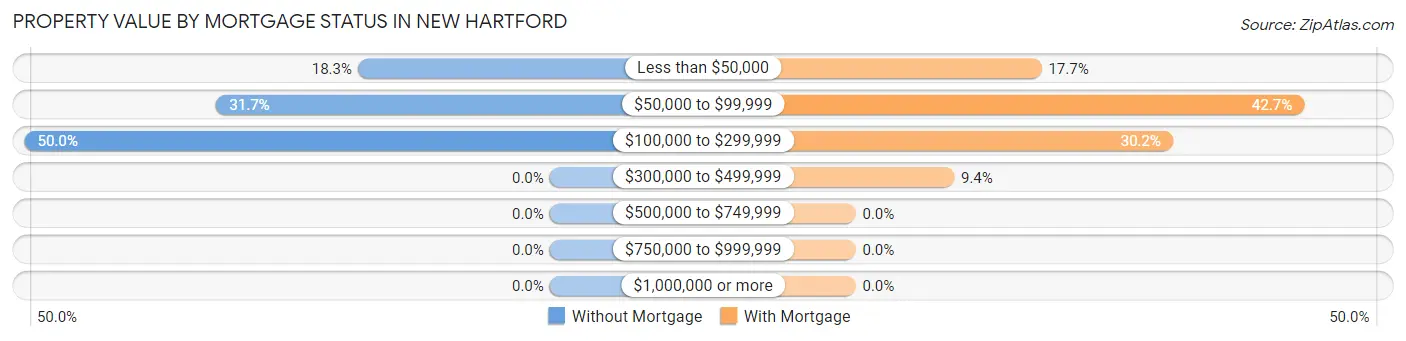
| Property Value | Without Mortgage | With Mortgage |
| Less than $50,000 | 19 (18.3%) | 17 (17.7%) |
| $50,000 to $99,999 | 33 (31.7%) | 41 (42.7%) |
| $100,000 to $299,999 | 52 (50.0%) | 29 (30.2%) |
| $300,000 to $499,999 | 0 (0.0%) | 9 (9.4%) |
| $500,000 to $749,999 | 0 (0.0%) | 0 (0.0%) |
| $750,000 to $999,999 | 0 (0.0%) | 0 (0.0%) |
| $1,000,000 or more | 0 (0.0%) | 0 (0.0%) |
| Total | 104 (100.0%) | 96 (100.0%) |
Household Income by Mortgage Status in New Hartford
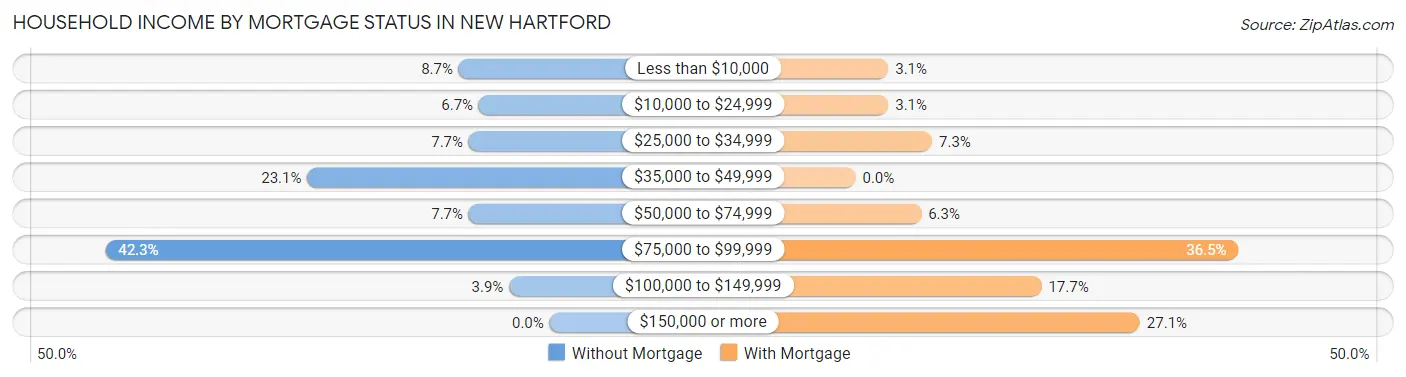
| Household Income | Without Mortgage | With Mortgage |
| Less than $10,000 | 9 (8.6%) | 3 (3.1%) |
| $10,000 to $24,999 | 7 (6.7%) | 3 (3.1%) |
| $25,000 to $34,999 | 8 (7.7%) | 7 (7.3%) |
| $35,000 to $49,999 | 24 (23.1%) | 0 (0.0%) |
| $50,000 to $74,999 | 8 (7.7%) | 6 (6.2%) |
| $75,000 to $99,999 | 44 (42.3%) | 35 (36.5%) |
| $100,000 to $149,999 | 4 (3.8%) | 17 (17.7%) |
| $150,000 or more | 0 (0.0%) | 26 (27.1%) |
| Total | 104 (100.0%) | 96 (100.0%) |
Property Value to Household Income Ratio in New Hartford
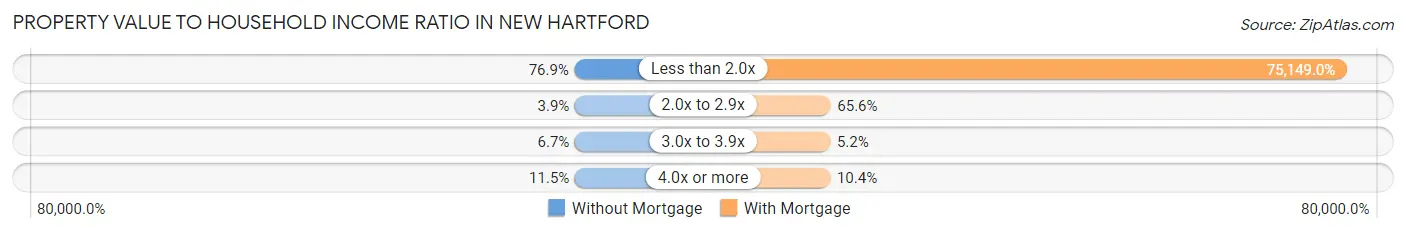
| Value-to-Income Ratio | Without Mortgage | With Mortgage |
| Less than 2.0x | 80 (76.9%) | 72,143 (75,149.0%) |
| 2.0x to 2.9x | 4 (3.8%) | 63 (65.6%) |
| 3.0x to 3.9x | 7 (6.7%) | 5 (5.2%) |
| 4.0x or more | 12 (11.5%) | 10 (10.4%) |
| Total | 104 (100.0%) | 96 (100.0%) |
Real Estate Taxes by Mortgage Status in New Hartford
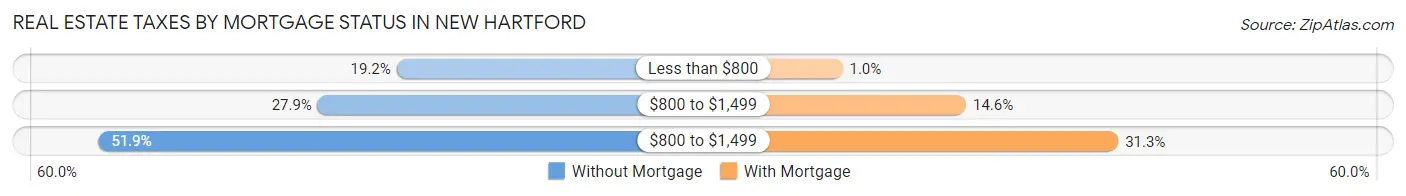
| Property Taxes | Without Mortgage | With Mortgage |
| Less than $800 | 20 (19.2%) | 1 (1.0%) |
| $800 to $1,499 | 29 (27.9%) | 14 (14.6%) |
| $800 to $1,499 | 54 (51.9%) | 30 (31.2%) |
| Total | 104 (100.0%) | 96 (100.0%) |
Health & Disability in New Hartford
Health Insurance Coverage by Age in New Hartford
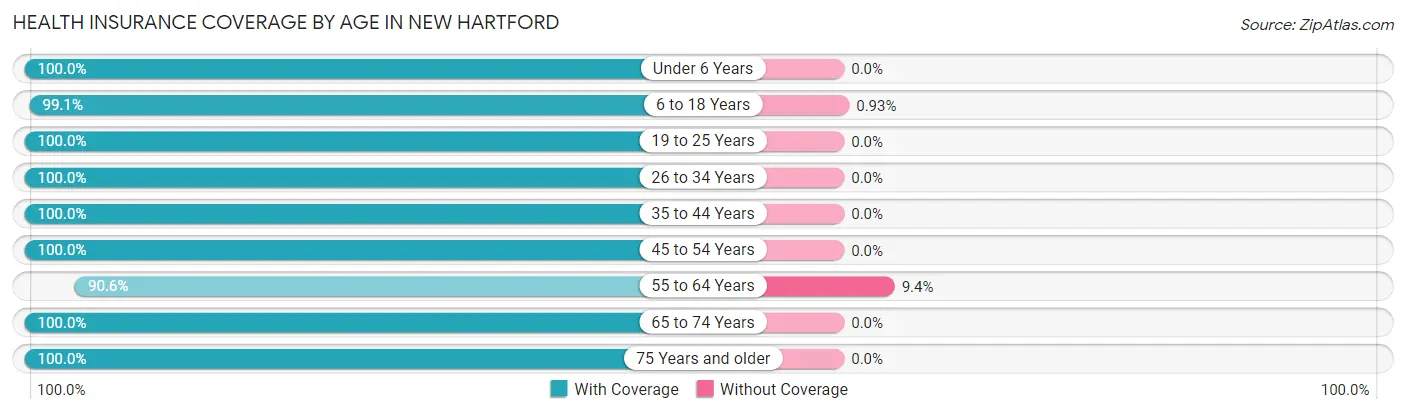
| Age Bracket | With Coverage | Without Coverage |
| Under 6 Years | 18 (100.0%) | 0 (0.0%) |
| 6 to 18 Years | 212 (99.1%) | 2 (0.9%) |
| 19 to 25 Years | 64 (100.0%) | 0 (0.0%) |
| 26 to 34 Years | 62 (100.0%) | 0 (0.0%) |
| 35 to 44 Years | 133 (100.0%) | 0 (0.0%) |
| 45 to 54 Years | 86 (100.0%) | 0 (0.0%) |
| 55 to 64 Years | 77 (90.6%) | 8 (9.4%) |
| 65 to 74 Years | 86 (100.0%) | 0 (0.0%) |
| 75 Years and older | 10 (100.0%) | 0 (0.0%) |
| Total | 748 (98.7%) | 10 (1.3%) |
Health Insurance Coverage by Citizenship Status in New Hartford
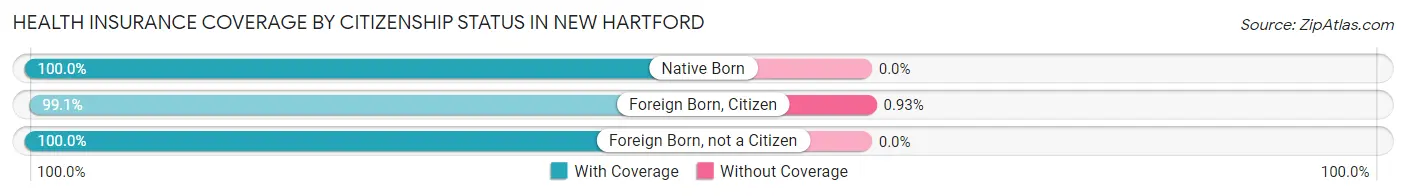
| Citizenship Status | With Coverage | Without Coverage |
| Native Born | 18 (100.0%) | 0 (0.0%) |
| Foreign Born, Citizen | 212 (99.1%) | 2 (0.9%) |
| Foreign Born, not a Citizen | 64 (100.0%) | 0 (0.0%) |
Health Insurance Coverage by Household Income in New Hartford
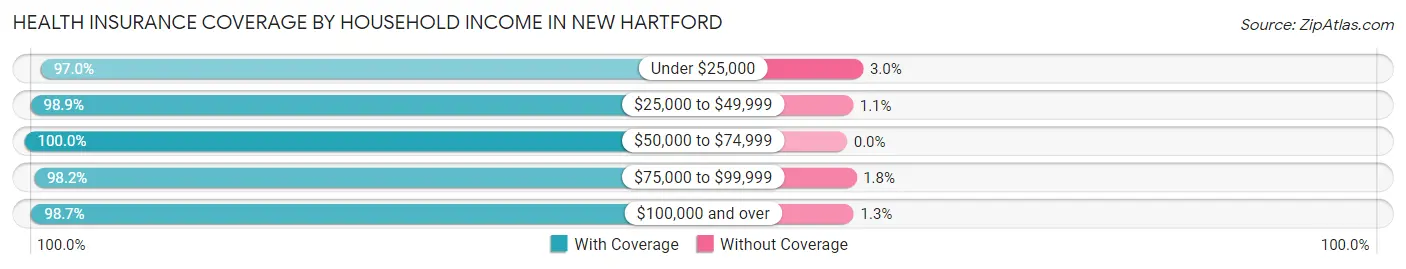
| Household Income | With Coverage | Without Coverage |
| Under $25,000 | 64 (97.0%) | 2 (3.0%) |
| $25,000 to $49,999 | 266 (98.9%) | 3 (1.1%) |
| $50,000 to $74,999 | 96 (100.0%) | 0 (0.0%) |
| $75,000 to $99,999 | 167 (98.2%) | 3 (1.8%) |
| $100,000 and over | 155 (98.7%) | 2 (1.3%) |
Public vs Private Health Insurance Coverage by Age in New Hartford
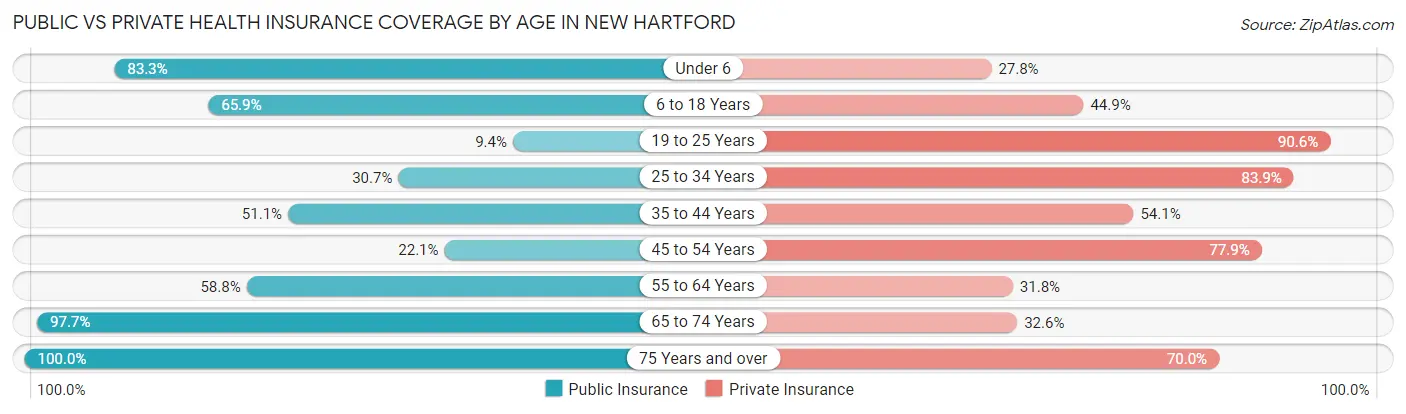
| Age Bracket | Public Insurance | Private Insurance |
| Under 6 | 15 (83.3%) | 5 (27.8%) |
| 6 to 18 Years | 141 (65.9%) | 96 (44.9%) |
| 19 to 25 Years | 6 (9.4%) | 58 (90.6%) |
| 25 to 34 Years | 19 (30.6%) | 52 (83.9%) |
| 35 to 44 Years | 68 (51.1%) | 72 (54.1%) |
| 45 to 54 Years | 19 (22.1%) | 67 (77.9%) |
| 55 to 64 Years | 50 (58.8%) | 27 (31.8%) |
| 65 to 74 Years | 84 (97.7%) | 28 (32.6%) |
| 75 Years and over | 10 (100.0%) | 7 (70.0%) |
| Total | 412 (54.3%) | 412 (54.3%) |
Disability Status by Sex by Age in New Hartford
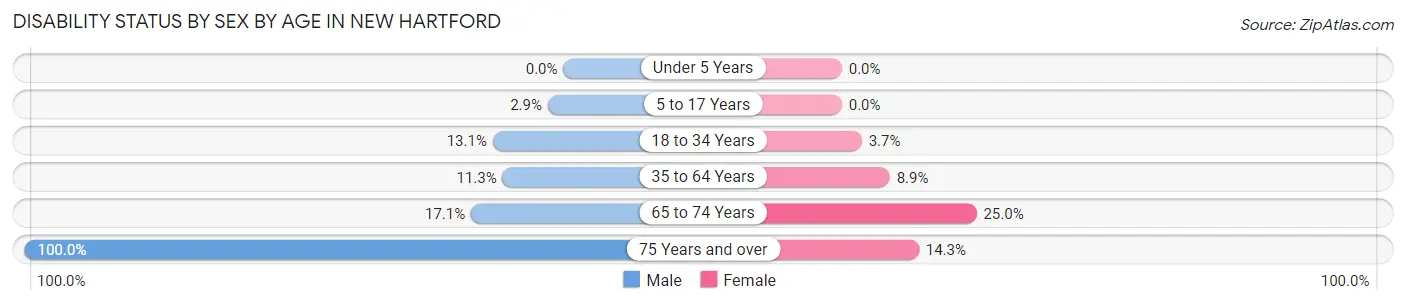
| Age Bracket | Male | Female |
| Under 5 Years | 0 (0.0%) | 0 (0.0%) |
| 5 to 17 Years | 4 (2.9%) | 0 (0.0%) |
| 18 to 34 Years | 8 (13.1%) | 3 (3.7%) |
| 35 to 64 Years | 14 (11.3%) | 16 (8.9%) |
| 65 to 74 Years | 12 (17.1%) | 4 (25.0%) |
| 75 Years and over | 3 (100.0%) | 1 (14.3%) |
Disability Class by Sex by Age in New Hartford
Disability Class: Hearing Difficulty
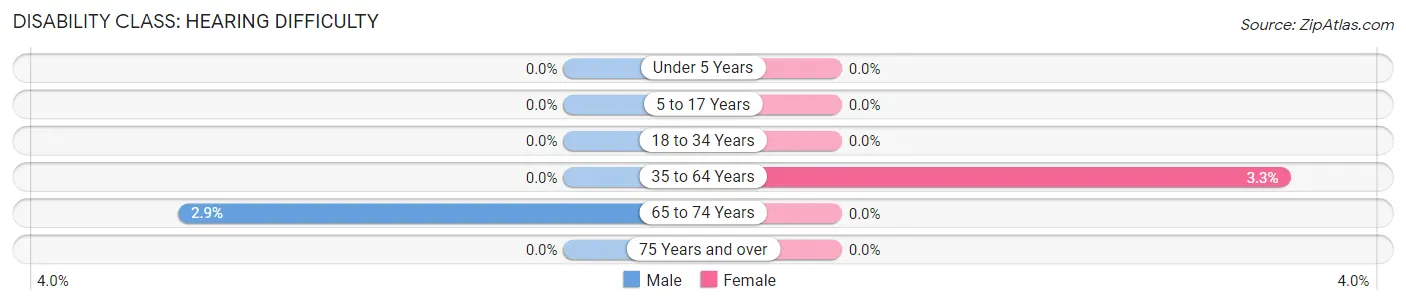
| Age Bracket | Male | Female |
| Under 5 Years | 0 (0.0%) | 0 (0.0%) |
| 5 to 17 Years | 0 (0.0%) | 0 (0.0%) |
| 18 to 34 Years | 0 (0.0%) | 0 (0.0%) |
| 35 to 64 Years | 0 (0.0%) | 6 (3.3%) |
| 65 to 74 Years | 2 (2.9%) | 0 (0.0%) |
| 75 Years and over | 0 (0.0%) | 0 (0.0%) |
Disability Class: Vision Difficulty
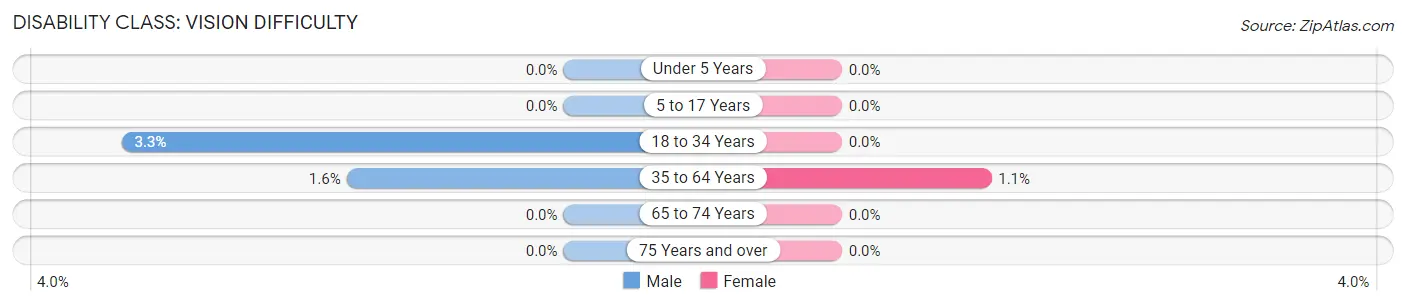
| Age Bracket | Male | Female |
| Under 5 Years | 0 (0.0%) | 0 (0.0%) |
| 5 to 17 Years | 0 (0.0%) | 0 (0.0%) |
| 18 to 34 Years | 2 (3.3%) | 0 (0.0%) |
| 35 to 64 Years | 2 (1.6%) | 2 (1.1%) |
| 65 to 74 Years | 0 (0.0%) | 0 (0.0%) |
| 75 Years and over | 0 (0.0%) | 0 (0.0%) |
Disability Class: Cognitive Difficulty
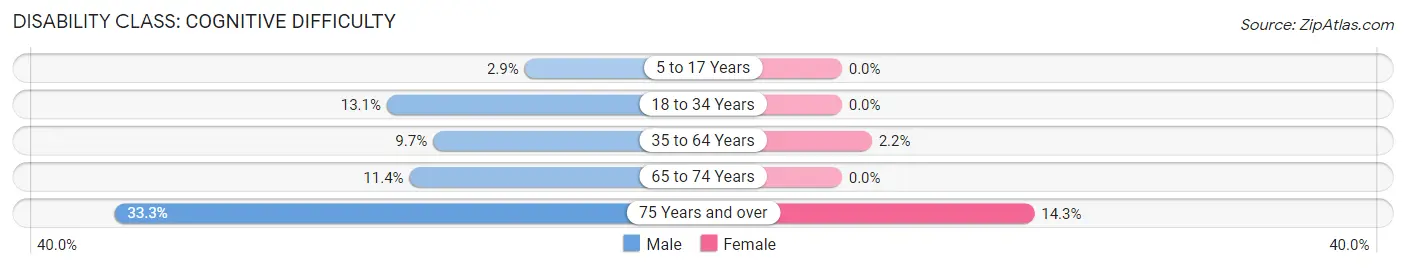
| Age Bracket | Male | Female |
| 5 to 17 Years | 4 (2.9%) | 0 (0.0%) |
| 18 to 34 Years | 8 (13.1%) | 0 (0.0%) |
| 35 to 64 Years | 12 (9.7%) | 4 (2.2%) |
| 65 to 74 Years | 8 (11.4%) | 0 (0.0%) |
| 75 Years and over | 1 (33.3%) | 1 (14.3%) |
Disability Class: Ambulatory Difficulty
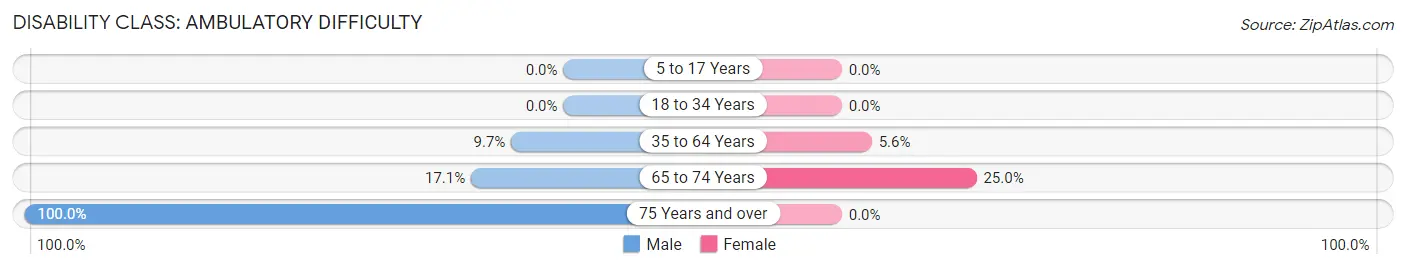
| Age Bracket | Male | Female |
| 5 to 17 Years | 0 (0.0%) | 0 (0.0%) |
| 18 to 34 Years | 0 (0.0%) | 0 (0.0%) |
| 35 to 64 Years | 12 (9.7%) | 10 (5.6%) |
| 65 to 74 Years | 12 (17.1%) | 4 (25.0%) |
| 75 Years and over | 3 (100.0%) | 0 (0.0%) |
Disability Class: Self-Care Difficulty
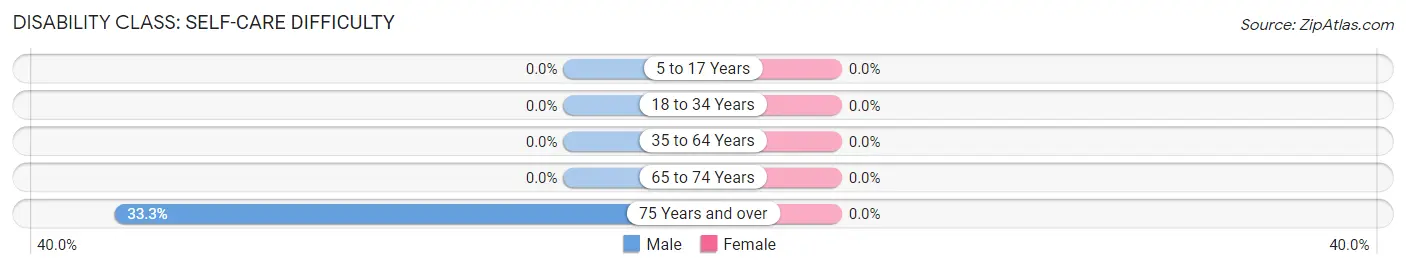
| Age Bracket | Male | Female |
| 5 to 17 Years | 0 (0.0%) | 0 (0.0%) |
| 18 to 34 Years | 0 (0.0%) | 0 (0.0%) |
| 35 to 64 Years | 0 (0.0%) | 0 (0.0%) |
| 65 to 74 Years | 0 (0.0%) | 0 (0.0%) |
| 75 Years and over | 1 (33.3%) | 0 (0.0%) |
Technology Access in New Hartford
Computing Device Access in New Hartford
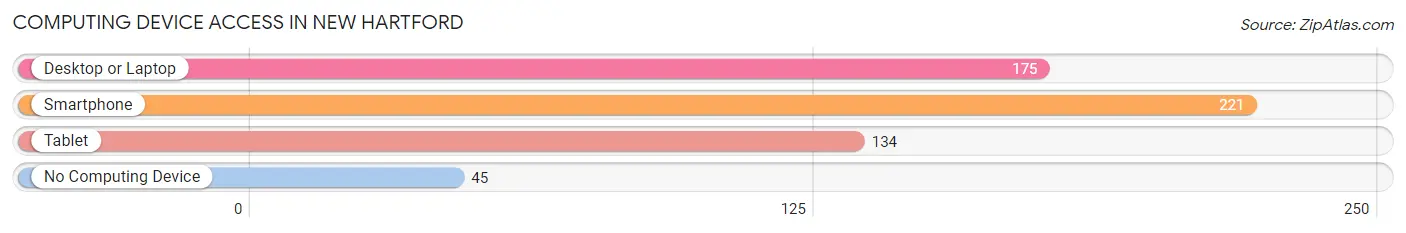
| Device Type | # Households | % Households |
| Desktop or Laptop | 175 | 64.1% |
| Smartphone | 221 | 80.9% |
| Tablet | 134 | 49.1% |
| No Computing Device | 45 | 16.5% |
| Total | 273 | 100.0% |
Internet Access in New Hartford
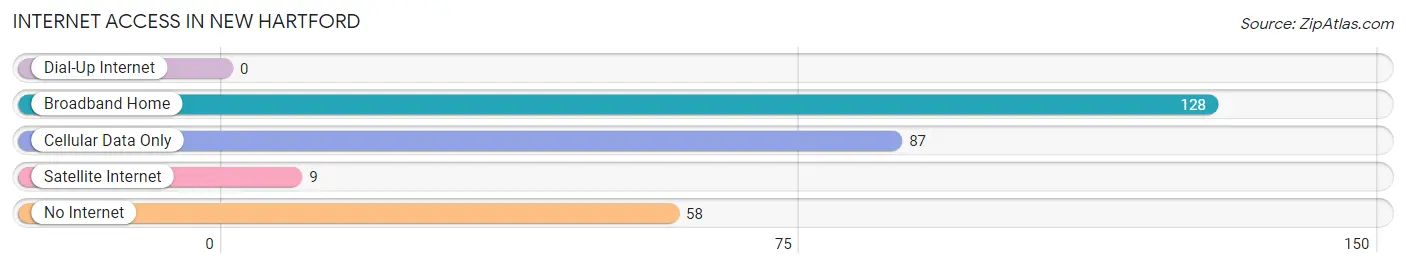
| Internet Type | # Households | % Households |
| Dial-Up Internet | 0 | 0.0% |
| Broadband Home | 128 | 46.9% |
| Cellular Data Only | 87 | 31.9% |
| Satellite Internet | 9 | 3.3% |
| No Internet | 58 | 21.2% |
| Total | 273 | 100.0% |
New Hartford Summary
New Hartford is a small city located in Butler County, Iowa, United States. It is situated on the banks of the Cedar River, approximately 20 miles east of Waterloo. The population was 1,845 at the 2010 census.
History
New Hartford was founded in 1854 by a group of settlers from New York. The town was named after Hartford, Connecticut, the hometown of many of the settlers. The first post office was established in 1855.
In 1856, the first school was built and the first church was organized. The first newspaper, the New Hartford Times, was established in 1858.
In 1867, the Cedar Valley Railroad was built through New Hartford, connecting it to Waterloo and Cedar Falls. This allowed the town to become a major shipping center for the surrounding area.
In 1871 the first bank was established and the first telephone line was installed
In 1875 the first fire department was organized
In 1876 the first public library was established
In 1877 the first newspaper the New Hartford Times was established
In 1878 the first hospital was built
In 1879 the first electric lights were installed
In 1881 the first waterworks were built
In 1882 the first bank was established
In 1883 the first telephone exchange was established
In 1884 the first public park was established
In 1885 the first public library was established
In 1886 the first high school was built
In 1887 the first public swimming pool was built
In 1888 the first public golf course was established
In 1889 the first public library was established
In 1890 the first public park was established
In 1891 the first public swimming pool was built
In 1892 the first public golf course was established
In 1893 the first public library was established
In 1895 the first public park was established
In 1896 the first public swimming pool was built
In 1897 the first public golf course was established
In 1898 the first public library was established
In 1899 the first public park was established
In 1900 the first public swimming pool was built
In 1901 the first public golf course was established
In 1902 the first public library was established
In 1903 the first public park was established
In 1904 the first public swimming pool was built
In 1905 the first public golf course was established
In 1906 the first public library was established
In 1907 the first public park was established
In 1908 the first public swimming pool was built
In 1909 the first public golf course was established
In 1910 the first public library was established
In 1911 the first public park was established
In 1912 the first public swimming pool was built
In 1913 the first public golf course was established
In 1914 the first public library was established
In 1915 the first public park was established
In 1916 the first public swimming pool was built
In 1917 the first public golf course was established
In 1918 the first public library was established
In 1919 the first public park was established
In 1920 the first public swimming pool was built
In 1921 the first public golf course was established
In 1922 the first public library was established
In 1923 the first public park was established
In 1924 the first public swimming pool was built
In 1925 the first public golf course was established
In 1926 the first public library was established
In 1927 the first public park was established
In 1928 the first public swimming pool was built
In 1929 the first public golf course was established
In 1930 the first public library was established
In 1931 the first public park was established
In 1932 the first public swimming pool was built
In 1933 the first public golf course was established
In 1934 the first public library was established
In 1935 the first public park was established
In 1936 the first public swimming pool was built
In 1937 the first public golf course was established
In 1938 the first public library was established
In 1939 the first public park was established
In 1940 the first public swimming pool was built
In 1941 the first public golf course was established
In 1942 the first public library was established
In 1943 the first public park was established
In 1944 the first public swimming pool was built
In 1945 the first public golf course was established
In 1946 the first public library was established
In 1947 the first public park was established
In 1948 the first public swimming pool was built
In 1949 the first public golf course was established
In 1950 the first public library was established
Geography
New Hartford is located at 42°30′N 92°37′W (42.50, -92.62). According to the United States Census Bureau, the city has a total area of 1.2 square miles (3.1 km2), all of it land.
Economy
New Hartford’s economy is largely based on agriculture and manufacturing. The city is home to several large agricultural businesses, including a feed mill, a grain elevator, and a dairy. The city also has several manufacturing businesses, including a furniture factory, a plastics factory, and a metal fabrication plant.
Demographics
As of the census of 2010, there were 1,845 people, 745 households, and 486 families residing in the city. The population density was 1,539.2 people per square mile (593.7/km2). There were 809 housing units at an average density of 675.8 per square mile (261.2/km2). The racial makeup of the city was 97.2% White, 0.3% African American, 0.2% Native American, 0.3% Asian, 0.2% from other races, and 1.9% from two or more races. Hispanic or Latino of any race were 1.2% of the population.
There were 745 households, out of which 30.2% had children under the age of 18 living with them, 48.2% were married couples living together, 11.3% had a female householder with no husband present, and 36.2% were non-families. 32.2% of all households were made up of individuals, and 16.2% had someone living alone who was 65 years of age or older. The average household size was 2.37 and the average family size was 2.97.
In the city, the population was spread out, with 25.2% under the age of 18, 7.2% from 18 to 24, 25.7% from 25 to 44, 22.2% from 45 to 64, and 19.7% who were 65 years of age or older. The median age was 39 years. For every 100 females, there were 87.2 males. For every 100 females age 18 and over, there were 83.2 males.
The median income for a household in the city was $37,500, and the median income for a family was $45,000. Males had a median income of $31,250 versus $22,500 for females. The per capita income for the city was $18,845. About 6.2% of families and 8.2% of the population were below the poverty line, including 10.2% of those under age 18 and 8.2% of those age 65 or over.
Common Questions
What is Per Capita Income in New Hartford?
Per Capita income in New Hartford is $22,936.
What is the Median Family Income in New Hartford?
Median Family Income in New Hartford is $83,542.
What is the Median Household income in New Hartford?
Median Household Income in New Hartford is $64,583.
What is Income or Wage Gap in New Hartford?
Income or Wage Gap in New Hartford is 40.3%.
Women in New Hartford earn 59.7 cents for every dollar earned by a man.
What is Inequality or Gini Index in New Hartford?
Inequality or Gini Index in New Hartford is 0.30.
What is the Total Population of New Hartford?
Total Population of New Hartford is 758.
What is the Total Male Population of New Hartford?
Total Male Population of New Hartford is 408.
What is the Total Female Population of New Hartford?
Total Female Population of New Hartford is 350.
What is the Ratio of Males per 100 Females in New Hartford?
There are 116.57 Males per 100 Females in New Hartford.
What is the Ratio of Females per 100 Males in New Hartford?
There are 85.78 Females per 100 Males in New Hartford.
What is the Median Population Age in New Hartford?
Median Population Age in New Hartford is 36.5 Years.
What is the Average Family Size in New Hartford
Average Family Size in New Hartford is 3.1 People.
What is the Average Household Size in New Hartford
Average Household Size in New Hartford is 2.8 People.
How Large is the Labor Force in New Hartford?
There are 385 People in the Labor Forcein in New Hartford.
What is the Percentage of People in the Labor Force in New Hartford?
65.8% of People are in the Labor Force in New Hartford.
What is the Unemployment Rate in New Hartford?
Unemployment Rate in New Hartford is 6.5%.