Gray, IA Map & Demographics
Gray Map
Gray Overview
$23,843
PER CAPITA INCOME
$66,667
AVG FAMILY INCOME
$54,904
AVG HOUSEHOLD INCOME
25.5%
WAGE / INCOME GAP [ % ]
74.5¢/ $1
WAGE / INCOME GAP [ $ ]
0.21
INEQUALITY / GINI INDEX
75
TOTAL POPULATION
52
MALE POPULATION
23
FEMALE POPULATION
226.09
MALES / 100 FEMALES
44.23
FEMALES / 100 MALES
37.5
MEDIAN AGE
2.8
AVG FAMILY SIZE
2.8
AVG HOUSEHOLD SIZE
30
LABOR FORCE [ PEOPLE ]
63.8%
PERCENT IN LABOR FORCE
Gray Zip Codes
Gray Area Codes
Income in Gray
Income Overview in Gray
Per Capita Income in Gray is $23,843, while median incomes of families and households are $66,667 and $54,904 respectively.
| Characteristic | Number | Measure |
| Per Capita Income | 75 | $23,843 |
| Median Family Income | 20 | $66,667 |
| Mean Family Income | 20 | $77,610 |
| Median Household Income | 27 | $54,904 |
| Mean Household Income | 27 | $71,367 |
| Income Deficit | 20 | $0 |
| Wage / Income Gap (%) | 75 | 25.48% |
| Wage / Income Gap ($) | 75 | 74.52¢ per $1 |
| Gini / Inequality Index | 75 | 0.21 |
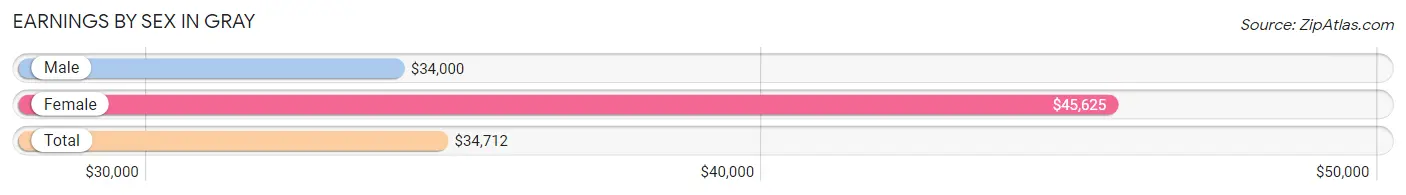
Earnings by Sex in Gray
Average Earnings in Gray are $34,712, $34,000 for men and $45,625 for women, a difference of 25.5%.
| Sex | Number | Average Earnings |
| Male | 18 (58.1%) | $34,000 |
| Female | 13 (41.9%) | $45,625 |
| Total | 31 (100.0%) | $34,712 |
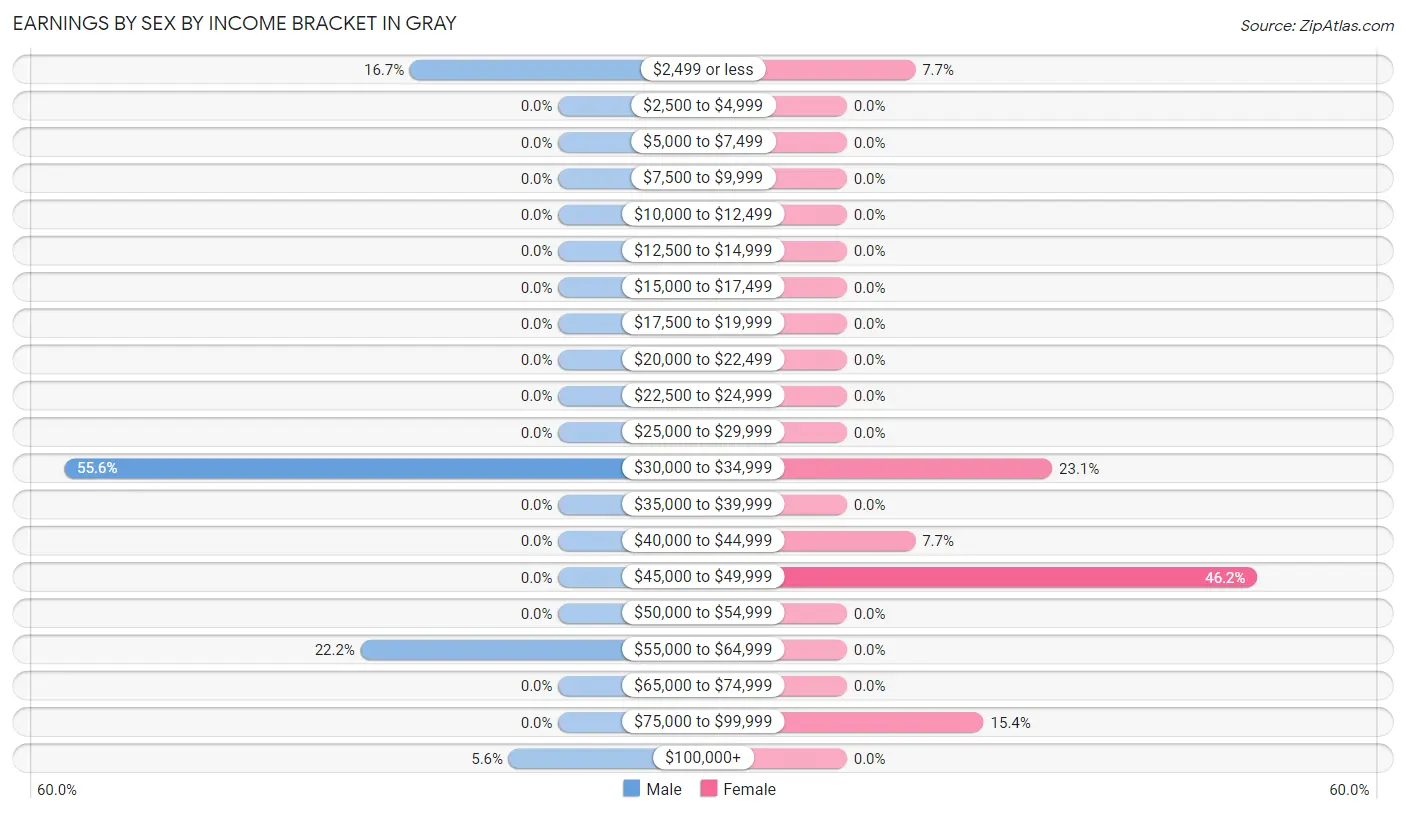
Earnings by Sex by Income Bracket in Gray
The most common earnings brackets in Gray are $30,000 to $34,999 for men (10 | 55.6%) and $45,000 to $49,999 for women (6 | 46.2%).
| Income | Male | Female |
| $2,499 or less | 3 (16.7%) | 1 (7.7%) |
| $2,500 to $4,999 | 0 (0.0%) | 0 (0.0%) |
| $5,000 to $7,499 | 0 (0.0%) | 0 (0.0%) |
| $7,500 to $9,999 | 0 (0.0%) | 0 (0.0%) |
| $10,000 to $12,499 | 0 (0.0%) | 0 (0.0%) |
| $12,500 to $14,999 | 0 (0.0%) | 0 (0.0%) |
| $15,000 to $17,499 | 0 (0.0%) | 0 (0.0%) |
| $17,500 to $19,999 | 0 (0.0%) | 0 (0.0%) |
| $20,000 to $22,499 | 0 (0.0%) | 0 (0.0%) |
| $22,500 to $24,999 | 0 (0.0%) | 0 (0.0%) |
| $25,000 to $29,999 | 0 (0.0%) | 0 (0.0%) |
| $30,000 to $34,999 | 10 (55.6%) | 3 (23.1%) |
| $35,000 to $39,999 | 0 (0.0%) | 0 (0.0%) |
| $40,000 to $44,999 | 0 (0.0%) | 1 (7.7%) |
| $45,000 to $49,999 | 0 (0.0%) | 6 (46.2%) |
| $50,000 to $54,999 | 0 (0.0%) | 0 (0.0%) |
| $55,000 to $64,999 | 4 (22.2%) | 0 (0.0%) |
| $65,000 to $74,999 | 0 (0.0%) | 0 (0.0%) |
| $75,000 to $99,999 | 0 (0.0%) | 2 (15.4%) |
| $100,000+ | 1 (5.6%) | 0 (0.0%) |
| Total | 18 (100.0%) | 13 (100.0%) |
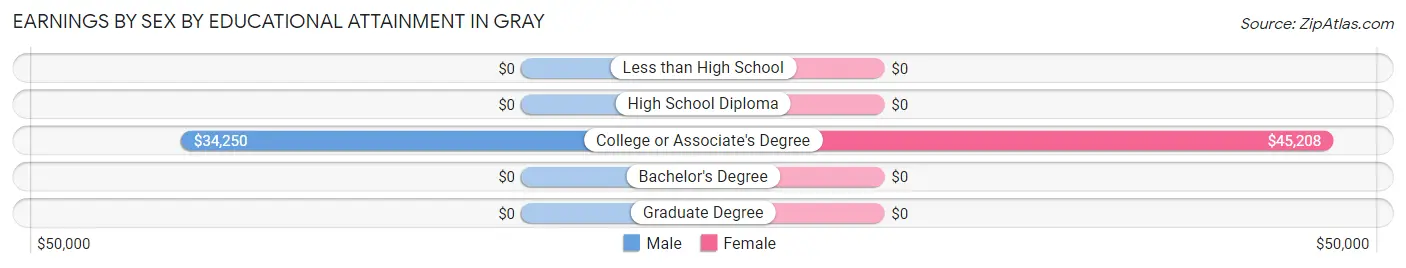
Earnings by Sex by Educational Attainment in Gray
Average earnings in Gray are $34,375 for men and $45,625 for women, a difference of 24.7%. Men with an educational attainment of college or associate's degree enjoy the highest average annual earnings of $34,250, while those with college or associate's degree education earn the least with $34,250. Women with an educational attainment of college or associate's degree earn the most with the average annual earnings of $45,208, while those with college or associate's degree education have the smallest earnings of $45,208.
| Educational Attainment | Male Income | Female Income |
| Less than High School | - | - |
| High School Diploma | - | - |
| College or Associate's Degree | $34,250 | $45,208 |
| Bachelor's Degree | - | - |
| Graduate Degree | - | - |
| Total | $34,375 | $45,625 |
Family Income in Gray
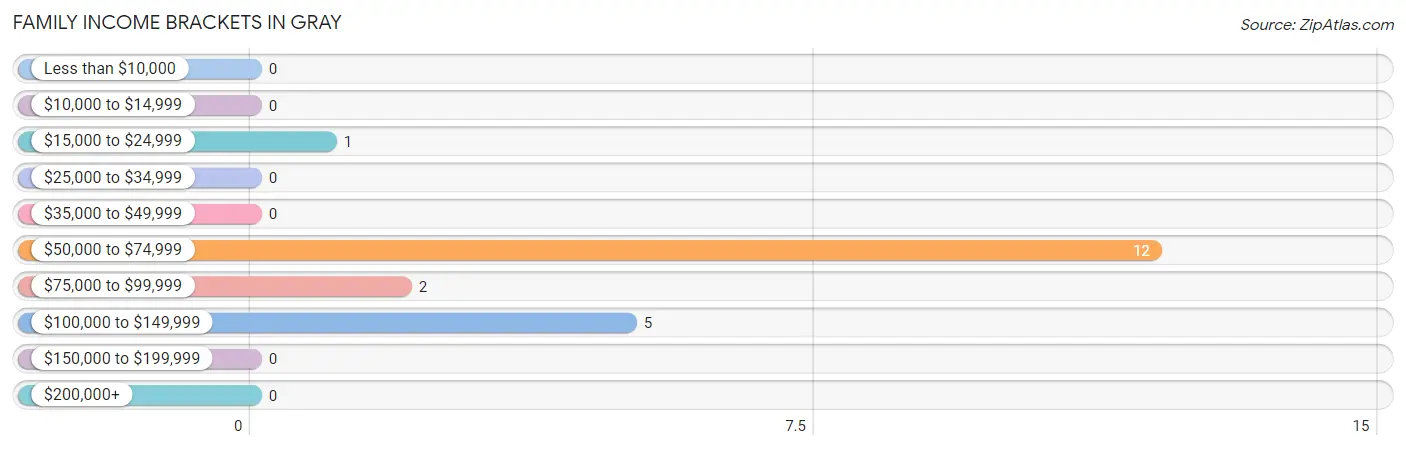
Family Income Brackets in Gray
According to the Gray family income data, there are 12 families falling into the $50,000 to $74,999 income range, which is the most common income bracket and makes up 60.0% of all families.
| Income Bracket | # Families | % Families |
| Less than $10,000 | 0 | 0.0% |
| $10,000 to $14,999 | 0 | 0.0% |
| $15,000 to $24,999 | 1 | 5.0% |
| $25,000 to $34,999 | 0 | 0.0% |
| $35,000 to $49,999 | 0 | 0.0% |
| $50,000 to $74,999 | 12 | 60.0% |
| $75,000 to $99,999 | 2 | 10.0% |
| $100,000 to $149,999 | 5 | 25.0% |
| $150,000 to $199,999 | 0 | 0.0% |
| $200,000+ | 0 | 0.0% |
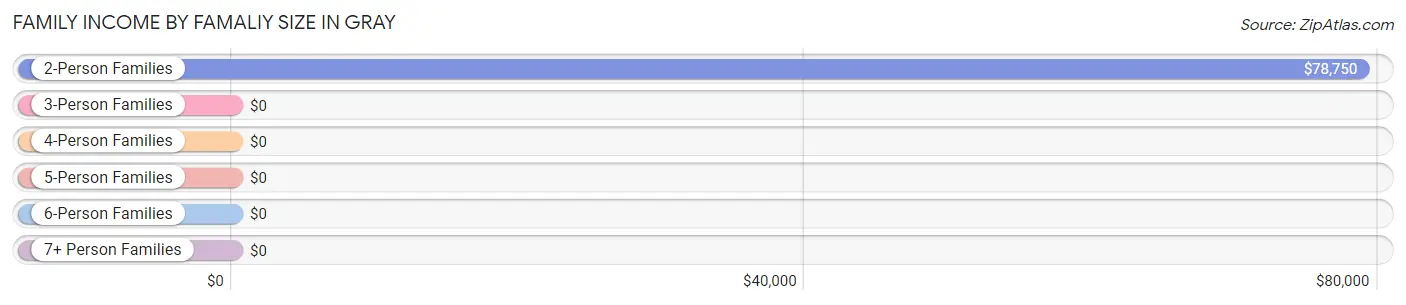
Family Income by Famaliy Size in Gray
2-person families (12 | 60.0%) account for the highest median family income in Gray with $78,750 per family, while 2-person families (12 | 60.0%) have the highest median income of $39,375 per family member.
| Income Bracket | # Families | Median Income |
| 2-Person Families | 12 (60.0%) | $78,750 |
| 3-Person Families | 0 (0.0%) | $0 |
| 4-Person Families | 7 (35.0%) | $0 |
| 5-Person Families | 1 (5.0%) | $0 |
| 6-Person Families | 0 (0.0%) | $0 |
| 7+ Person Families | 0 (0.0%) | $0 |
| Total | 20 (100.0%) | $66,667 |
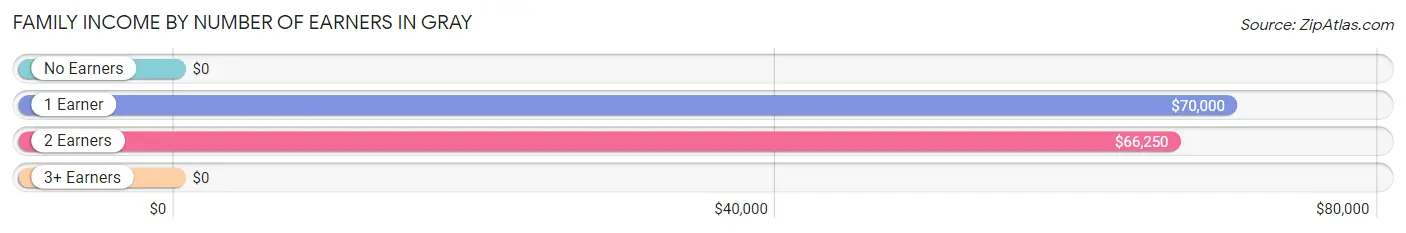
Family Income by Number of Earners in Gray
| Number of Earners | # Families | Median Income |
| No Earners | 3 (15.0%) | $0 |
| 1 Earner | 12 (60.0%) | $70,000 |
| 2 Earners | 5 (25.0%) | $66,250 |
| 3+ Earners | 0 (0.0%) | $0 |
| Total | 20 (100.0%) | $66,667 |
Household Income in Gray
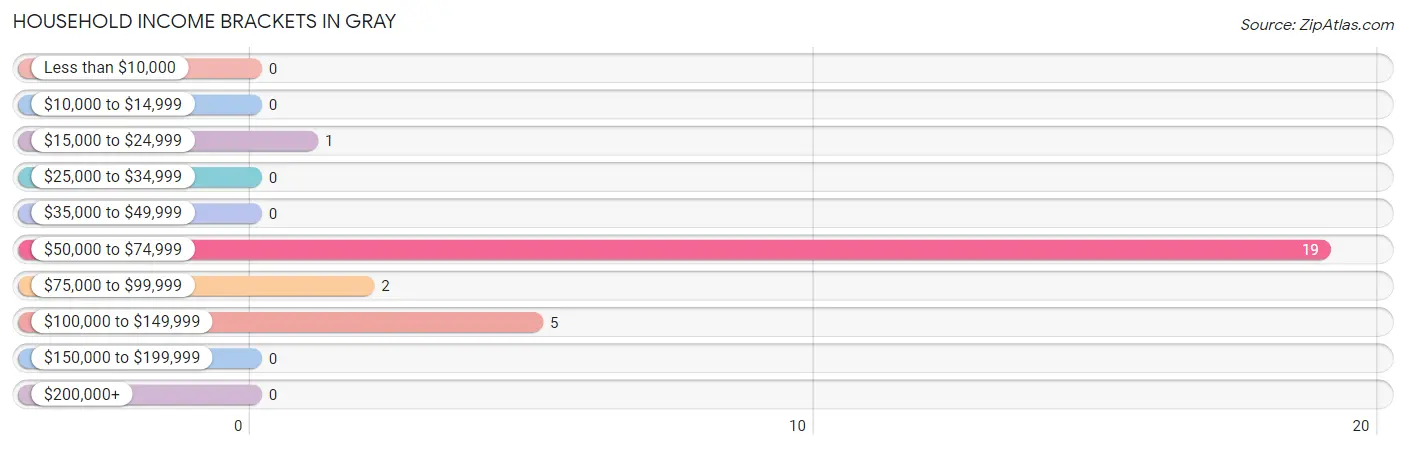
Household Income Brackets in Gray
With 19 households falling in the category, the $50,000 to $74,999 income range is the most frequent in Gray, accounting for 70.4% of all households.
| Income Bracket | # Households | % Households |
| Less than $10,000 | 0 | 0.0% |
| $10,000 to $14,999 | 0 | 0.0% |
| $15,000 to $24,999 | 1 | 3.7% |
| $25,000 to $34,999 | 0 | 0.0% |
| $35,000 to $49,999 | 0 | 0.0% |
| $50,000 to $74,999 | 19 | 70.4% |
| $75,000 to $99,999 | 2 | 7.4% |
| $100,000 to $149,999 | 5 | 18.5% |
| $150,000 to $199,999 | 0 | 0.0% |
| $200,000+ | 0 | 0.0% |
Household Income by Householder Age in Gray
The median household income in Gray is $54,904, with the highest median household income of $123,125 found in the 45 to 64 years age bracket for the primary householder. A total of 7 households (25.9%) fall into this category.
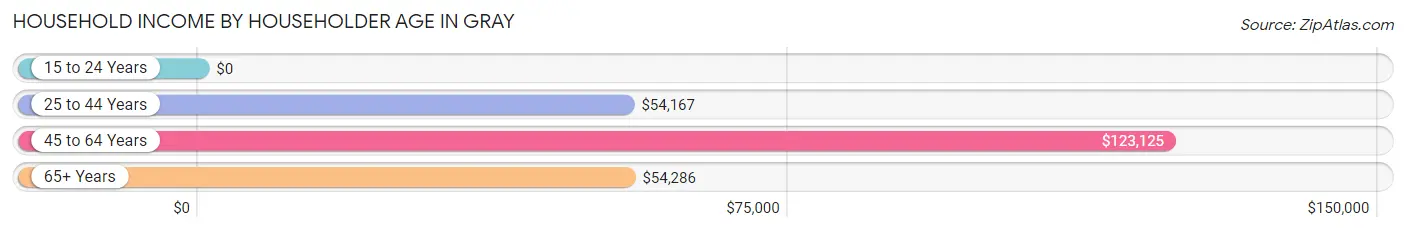
| Income Bracket | # Households | Median Income |
| 15 to 24 Years | 0 (0.0%) | $0 |
| 25 to 44 Years | 8 (29.6%) | $54,167 |
| 45 to 64 Years | 7 (25.9%) | $123,125 |
| 65+ Years | 12 (44.4%) | $54,286 |
| Total | 27 (100.0%) | $54,904 |
Poverty in Gray
Income Below Poverty by Sex and Age in Gray
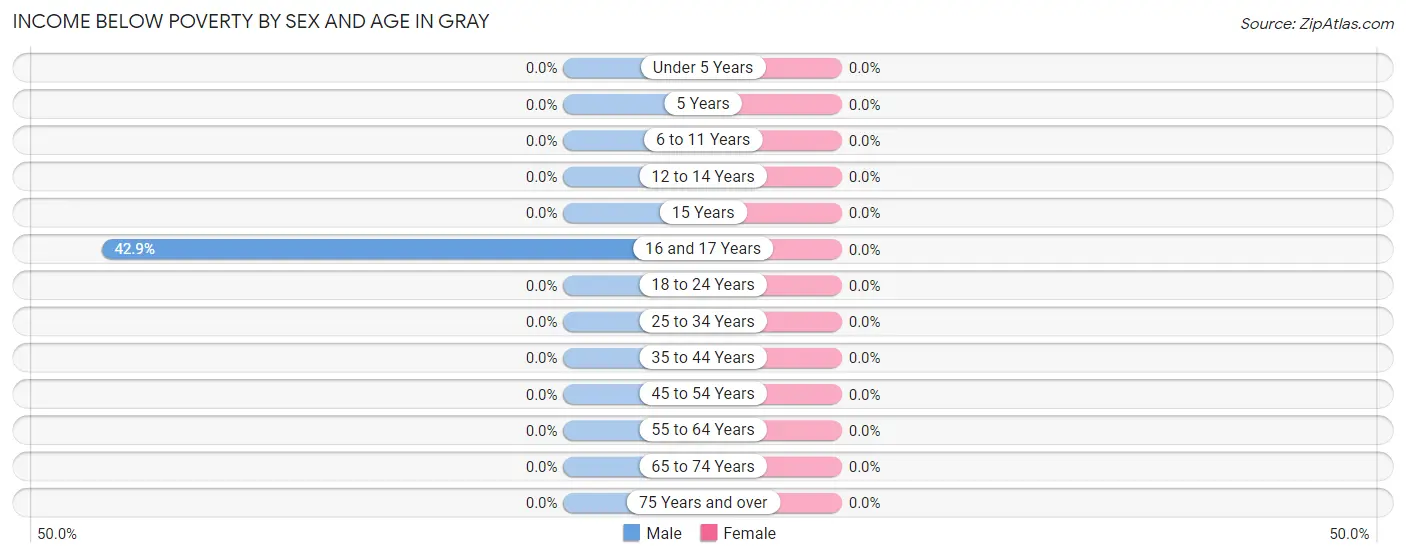
| Age Bracket | Male | Female |
| Under 5 Years | 0 (0.0%) | 0 (0.0%) |
| 5 Years | 0 (0.0%) | 0 (0.0%) |
| 6 to 11 Years | 0 (0.0%) | 0 (0.0%) |
| 12 to 14 Years | 0 (0.0%) | 0 (0.0%) |
| 15 Years | 0 (0.0%) | 0 (0.0%) |
| 16 and 17 Years | 3 (42.9%) | 0 (0.0%) |
| 18 to 24 Years | 0 (0.0%) | 0 (0.0%) |
| 25 to 34 Years | 0 (0.0%) | 0 (0.0%) |
| 35 to 44 Years | 0 (0.0%) | 0 (0.0%) |
| 45 to 54 Years | 0 (0.0%) | 0 (0.0%) |
| 55 to 64 Years | 0 (0.0%) | 0 (0.0%) |
| 65 to 74 Years | 0 (0.0%) | 0 (0.0%) |
| 75 Years and over | 0 (0.0%) | 0 (0.0%) |
| Total | 3 (7.1%) | 0 (0.0%) |
Income Above Poverty by Sex and Age in Gray
According to the poverty statistics in Gray, males aged under 5 years and females aged under 5 years are the age groups that are most secure financially, with 100.0% of males and 100.0% of females in these age groups living above the poverty line.
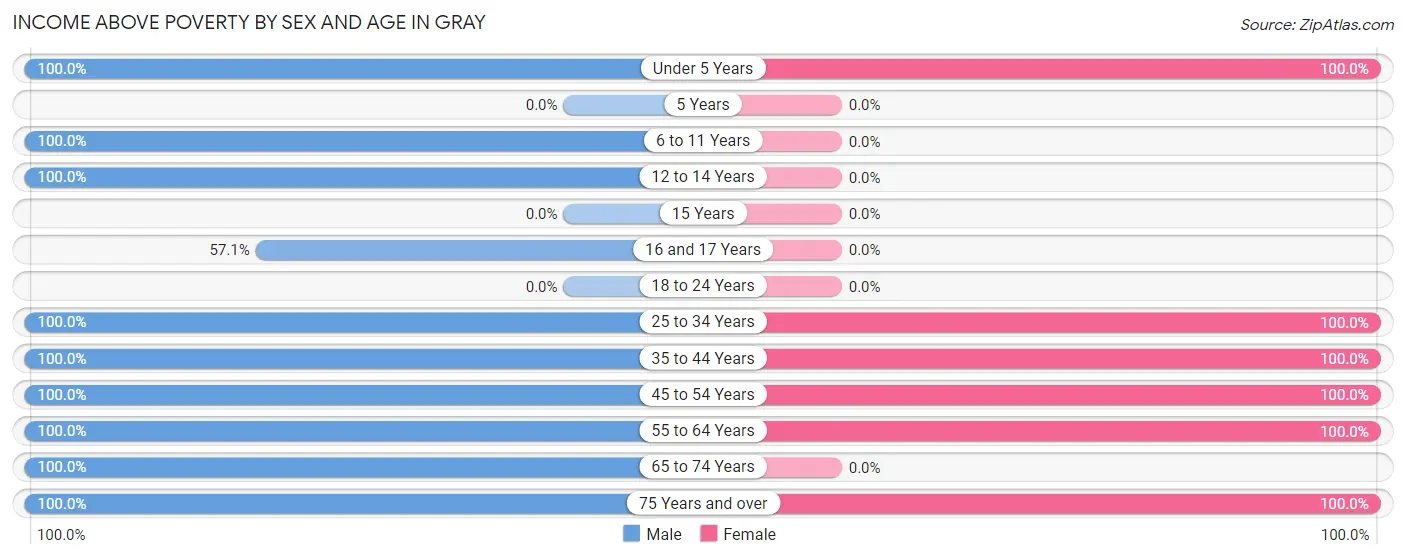
| Age Bracket | Male | Female |
| Under 5 Years | 6 (100.0%) | 2 (100.0%) |
| 5 Years | 0 (0.0%) | 0 (0.0%) |
| 6 to 11 Years | 1 (100.0%) | 0 (0.0%) |
| 12 to 14 Years | 9 (100.0%) | 0 (0.0%) |
| 15 Years | 0 (0.0%) | 0 (0.0%) |
| 16 and 17 Years | 4 (57.1%) | 0 (0.0%) |
| 18 to 24 Years | 0 (0.0%) | 0 (0.0%) |
| 25 to 34 Years | 1 (100.0%) | 1 (100.0%) |
| 35 to 44 Years | 1 (100.0%) | 7 (100.0%) |
| 45 to 54 Years | 1 (100.0%) | 5 (100.0%) |
| 55 to 64 Years | 3 (100.0%) | 3 (100.0%) |
| 65 to 74 Years | 10 (100.0%) | 0 (0.0%) |
| 75 Years and over | 3 (100.0%) | 5 (100.0%) |
| Total | 39 (92.9%) | 23 (100.0%) |
Income Below Poverty Among Married-Couple Families in Gray
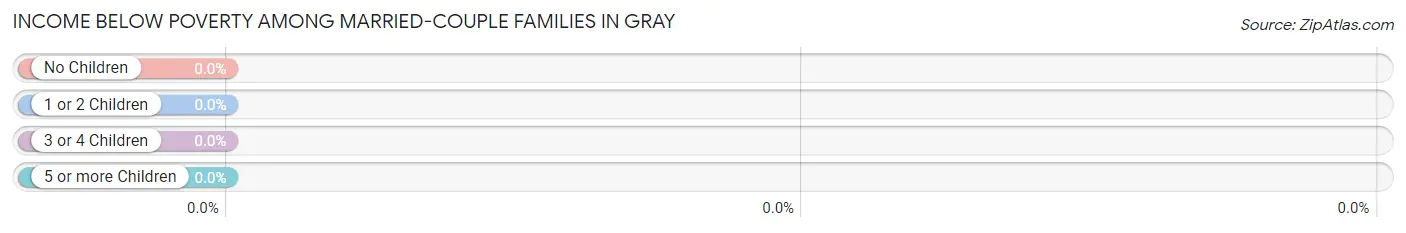
| Children | Above Poverty | Below Poverty |
| No Children | 12 (100.0%) | 0 (0.0%) |
| 1 or 2 Children | 1 (100.0%) | 0 (0.0%) |
| 3 or 4 Children | 1 (100.0%) | 0 (0.0%) |
| 5 or more Children | 0 (0.0%) | 0 (0.0%) |
| Total | 14 (100.0%) | 0 (0.0%) |
Income Below Poverty Among Single-Parent Households in Gray
| Children | Single Father | Single Mother |
| No Children | 0 (0.0%) | 0 (0.0%) |
| 1 or 2 Children | 0 (0.0%) | 0 (0.0%) |
| 3 or 4 Children | 0 (0.0%) | 0 (0.0%) |
| 5 or more Children | 0 (0.0%) | 0 (0.0%) |
| Total | 0 (0.0%) | 0 (0.0%) |
Income Below Poverty Among Married-Couple vs Single-Parent Households in Gray
| Children | Married-Couple Families | Single-Parent Households |
| No Children | 0 (0.0%) | 0 (0.0%) |
| 1 or 2 Children | 0 (0.0%) | 0 (0.0%) |
| 3 or 4 Children | 0 (0.0%) | 0 (0.0%) |
| 5 or more Children | 0 (0.0%) | 0 (0.0%) |
| Total | 0 (0.0%) | 0 (0.0%) |
Race in Gray
The most populous races in Gray are White / Caucasian (65 | 86.7%), Black / African American (6 | 8.0%), and Hispanic or Latino (4 | 5.3%).
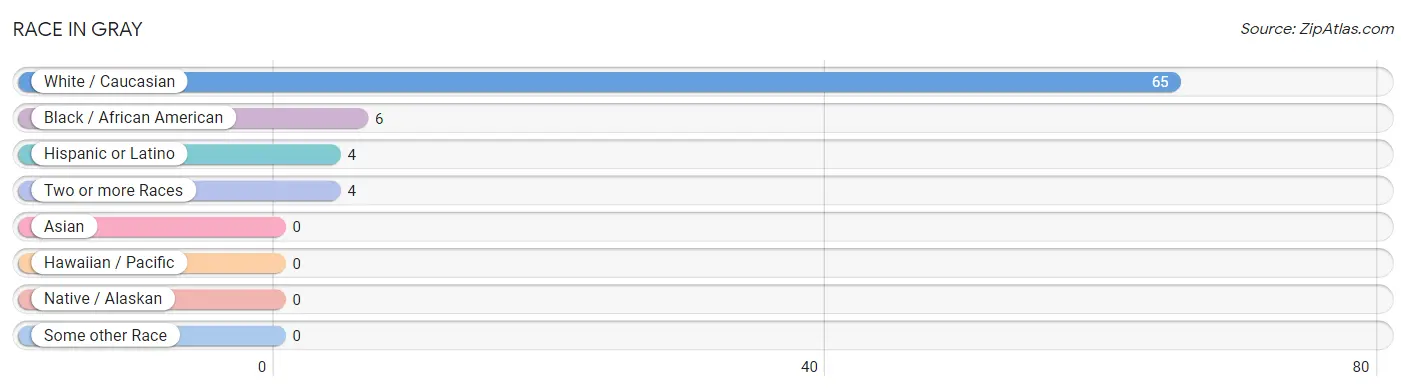
| Race | # Population | % Population |
| Asian | 0 | 0.0% |
| Black / African American | 6 | 8.0% |
| Hawaiian / Pacific | 0 | 0.0% |
| Hispanic or Latino | 4 | 5.3% |
| Native / Alaskan | 0 | 0.0% |
| White / Caucasian | 65 | 86.7% |
| Two or more Races | 4 | 5.3% |
| Some other Race | 0 | 0.0% |
| Total | 75 | 100.0% |
Ancestry in Gray
The most populous ancestries reported in Gray are Irish (28 | 37.3%), German (15 | 20.0%), English (10 | 13.3%), European (9 | 12.0%), and Spanish (4 | 5.3%), together accounting for 88.0% of all Gray residents.
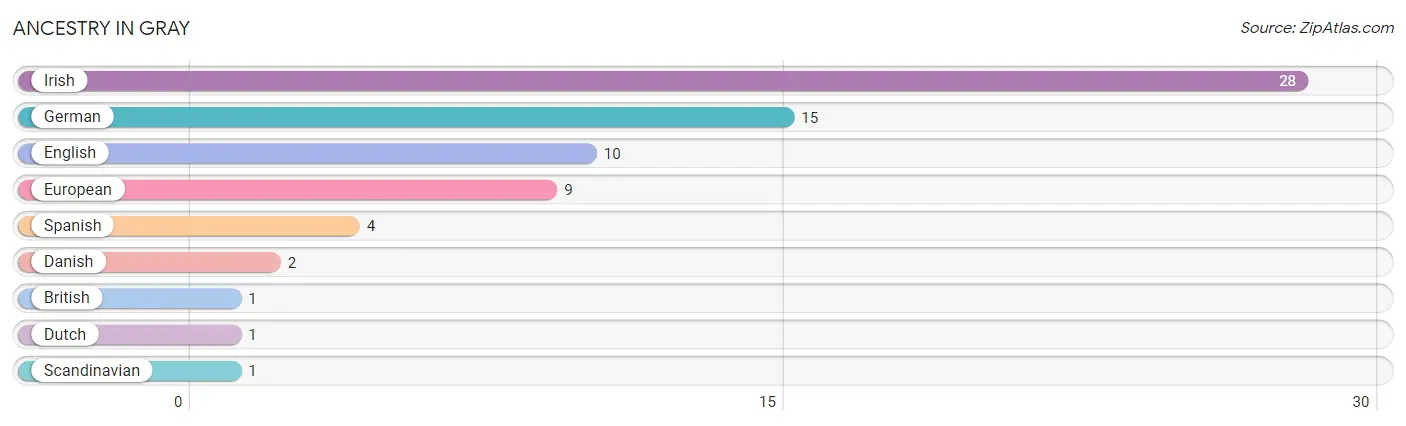
| Ancestry | # Population | % Population |
| British | 1 | 1.3% |
| Danish | 2 | 2.7% |
| Dutch | 1 | 1.3% |
| English | 10 | 13.3% |
| European | 9 | 12.0% |
| German | 15 | 20.0% |
| Irish | 28 | 37.3% |
| Scandinavian | 1 | 1.3% |
| Spanish | 4 | 5.3% | View All 9 Rows |
Immigrants in Gray

| Immigration Origin | # Population | % Population | View All 0 Rows |
Sex and Age in Gray
Sex and Age in Gray
The most populous age groups in Gray are 10 to 14 Years (15 | 28.8%) for men and 40 to 44 Years (6 | 26.1%) for women.
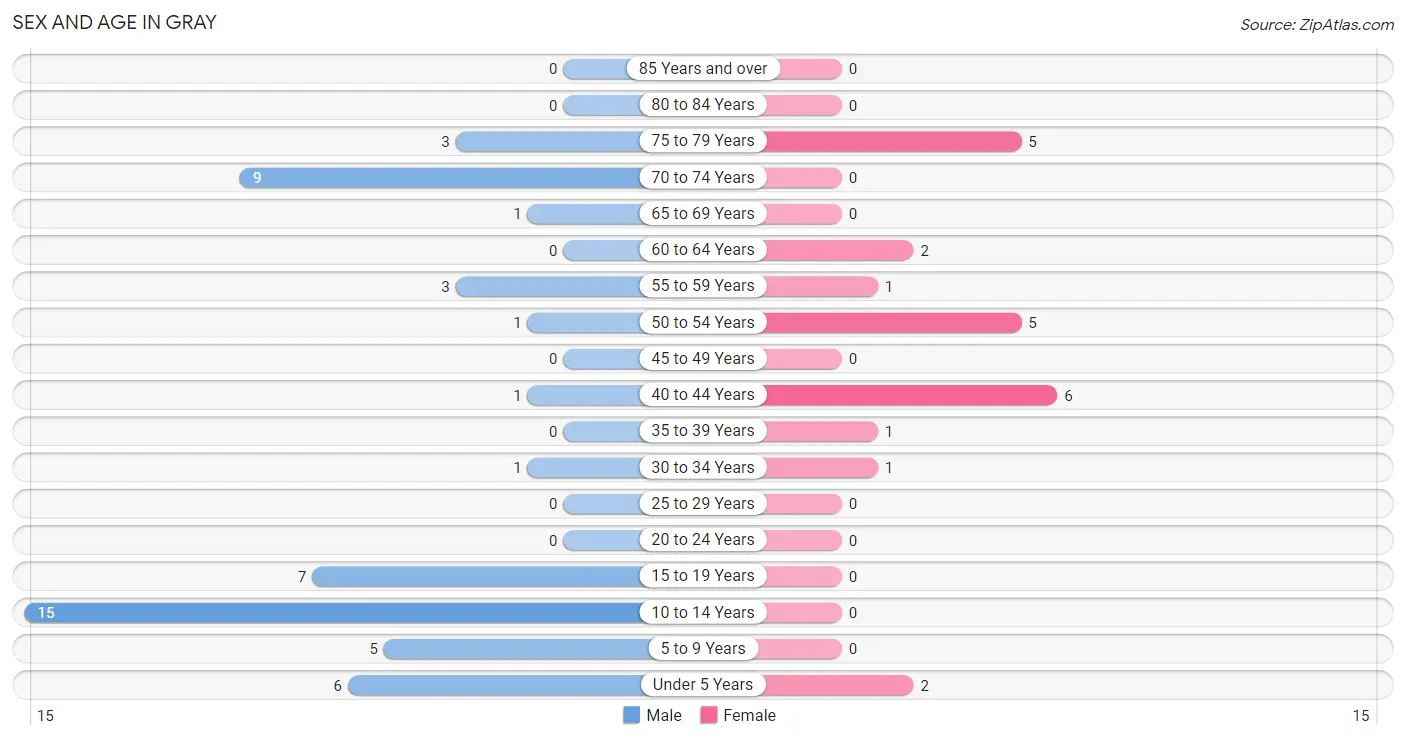
| Age Bracket | Male | Female |
| Under 5 Years | 6 (11.5%) | 2 (8.7%) |
| 5 to 9 Years | 5 (9.6%) | 0 (0.0%) |
| 10 to 14 Years | 15 (28.8%) | 0 (0.0%) |
| 15 to 19 Years | 7 (13.5%) | 0 (0.0%) |
| 20 to 24 Years | 0 (0.0%) | 0 (0.0%) |
| 25 to 29 Years | 0 (0.0%) | 0 (0.0%) |
| 30 to 34 Years | 1 (1.9%) | 1 (4.3%) |
| 35 to 39 Years | 0 (0.0%) | 1 (4.3%) |
| 40 to 44 Years | 1 (1.9%) | 6 (26.1%) |
| 45 to 49 Years | 0 (0.0%) | 0 (0.0%) |
| 50 to 54 Years | 1 (1.9%) | 5 (21.7%) |
| 55 to 59 Years | 3 (5.8%) | 1 (4.3%) |
| 60 to 64 Years | 0 (0.0%) | 2 (8.7%) |
| 65 to 69 Years | 1 (1.9%) | 0 (0.0%) |
| 70 to 74 Years | 9 (17.3%) | 0 (0.0%) |
| 75 to 79 Years | 3 (5.8%) | 5 (21.7%) |
| 80 to 84 Years | 0 (0.0%) | 0 (0.0%) |
| 85 Years and over | 0 (0.0%) | 0 (0.0%) |
| Total | 52 (100.0%) | 23 (100.0%) |
Families and Households in Gray
Median Family Size in Gray
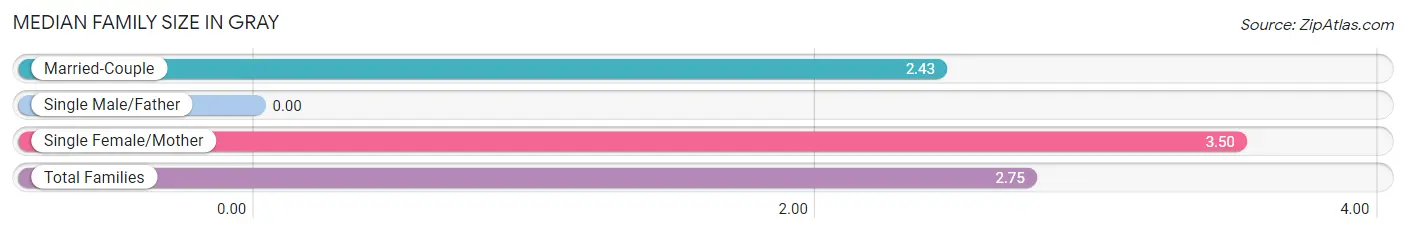
| Family Type | # Families | Family Size |
| Married-Couple | 14 (70.0%) | 2.43 |
| Single Male/Father | 0 (0.0%) | - |
| Single Female/Mother | 6 (30.0%) | 3.50 |
| Total Families | 20 (100.0%) | 2.75 |
Median Household Size in Gray
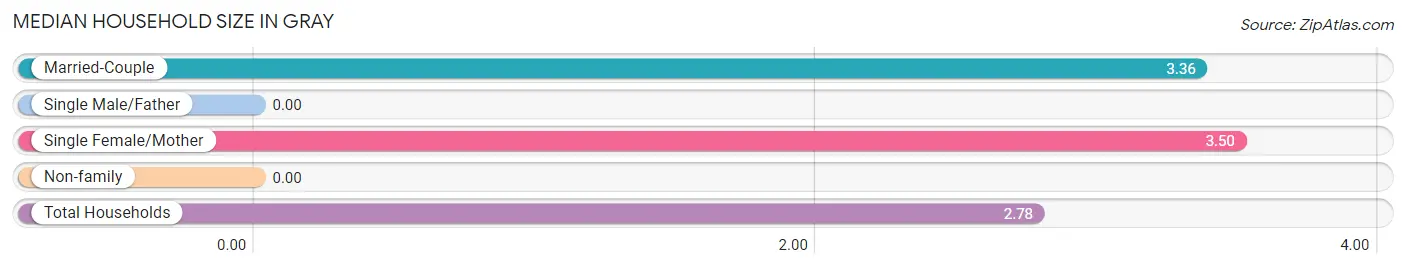
| Household Type | # Households | Household Size |
| Married-Couple | 14 (51.8%) | 3.36 |
| Single Male/Father | 0 (0.0%) | - |
| Single Female/Mother | 6 (22.2%) | 3.50 |
| Non-family | 7 (25.9%) | - |
| Total Households | 27 (100.0%) | 2.78 |
Household Size by Marriage Status in Gray
Out of a total of 27 households in Gray, 20 (74.1%) are family households, while 7 (25.9%) are nonfamily households. The most numerous type of family households are 2-person households, comprising 9, and the most common type of nonfamily households are 1-person households, comprising 7.
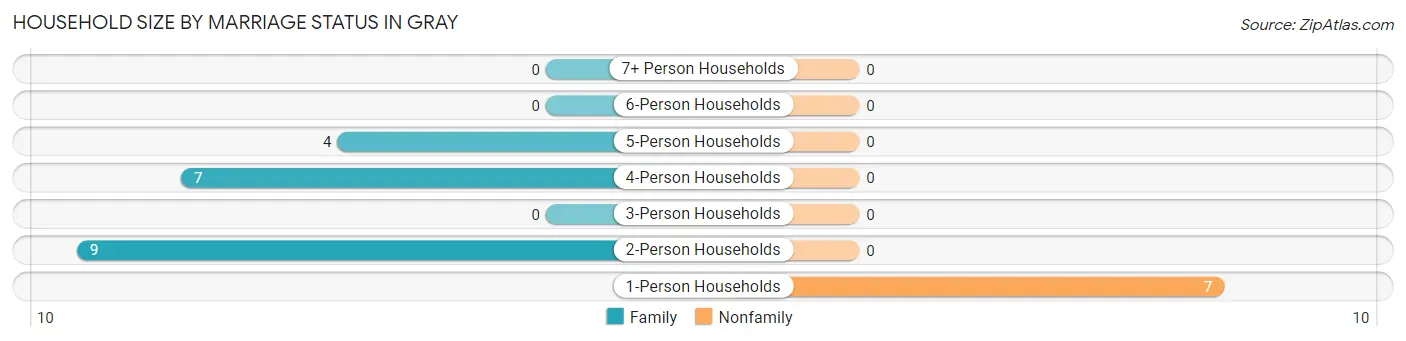
| Household Size | Family Households | Nonfamily Households |
| 1-Person Households | - | 7 (25.9%) |
| 2-Person Households | 9 (33.3%) | 0 (0.0%) |
| 3-Person Households | 0 (0.0%) | 0 (0.0%) |
| 4-Person Households | 7 (25.9%) | 0 (0.0%) |
| 5-Person Households | 4 (14.8%) | 0 (0.0%) |
| 6-Person Households | 0 (0.0%) | 0 (0.0%) |
| 7+ Person Households | 0 (0.0%) | 0 (0.0%) |
| Total | 20 (74.1%) | 7 (25.9%) |
Female Fertility in Gray
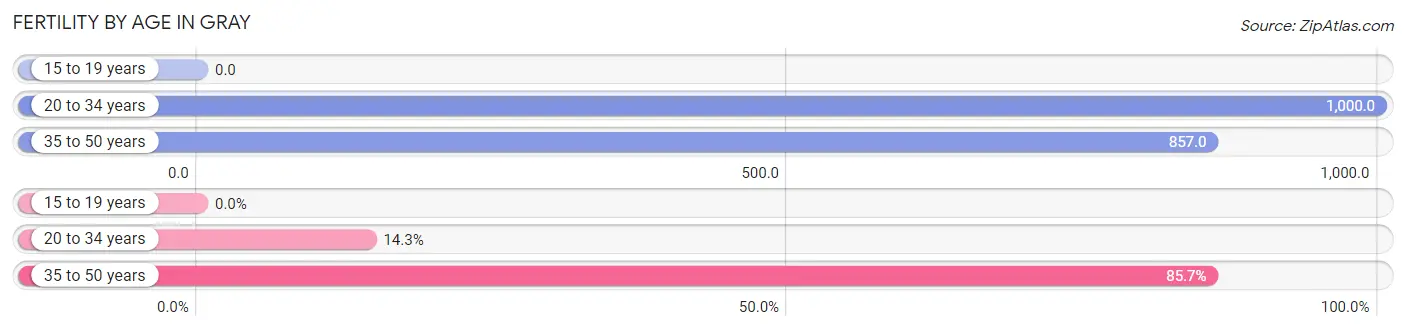
Fertility by Age in Gray
Average fertility rate in Gray is 875.0 births per 1,000 women. Women in the age bracket of 20 to 34 years have the highest fertility rate with 1,000.0 births per 1,000 women. Women in the age bracket of 35 to 50 years acount for 85.7% of all women with births.
| Age Bracket | Women with Births | Births / 1,000 Women |
| 15 to 19 years | 0 (0.0%) | 0.0 |
| 20 to 34 years | 1 (14.3%) | 1,000.0 |
| 35 to 50 years | 6 (85.7%) | 857.0 |
| Total | 7 (100.0%) | 875.0 |
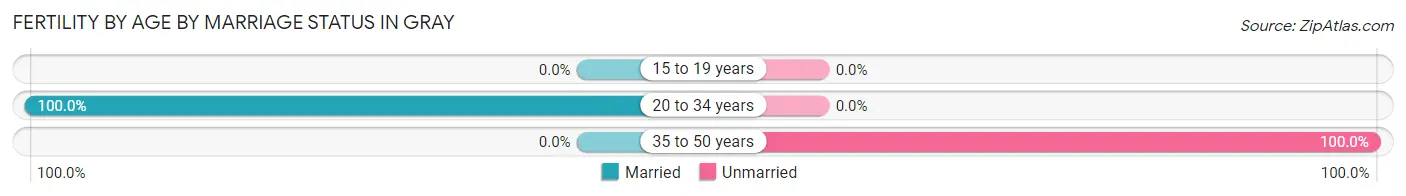
Fertility by Age by Marriage Status in Gray
14.3% of women with births (7) in Gray are married. The highest percentage of unmarried women with births falls into 35 to 50 years age bracket with 100.0% of them unmarried at the time of birth, while the lowest percentage of unmarried women with births belong to 20 to 34 years age bracket with 0.0% of them unmarried.
| Age Bracket | Married | Unmarried |
| 15 to 19 years | 0 (0.0%) | 0 (0.0%) |
| 20 to 34 years | 1 (100.0%) | 0 (0.0%) |
| 35 to 50 years | 0 (0.0%) | 6 (100.0%) |
| Total | 1 (14.3%) | 6 (85.7%) |
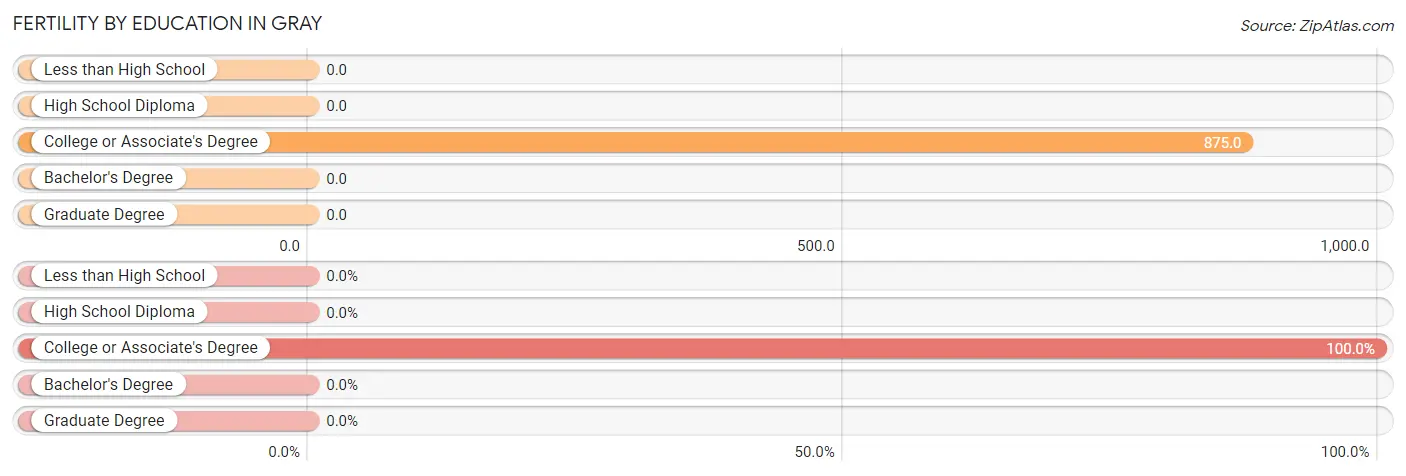
Fertility by Education in Gray
| Educational Attainment | Women with Births | Births / 1,000 Women |
| Less than High School | 0 (0.0%) | 0.0 |
| High School Diploma | 0 (0.0%) | 0.0 |
| College or Associate's Degree | 7 (100.0%) | 875.0 |
| Bachelor's Degree | 0 (0.0%) | 0.0 |
| Graduate Degree | 0 (0.0%) | 0.0 |
| Total | 7 (100.0%) | 875.0 |
Fertility by Education by Marriage Status in Gray
85.7% of women with births in Gray are unmarried. Women with the educational attainment of college or associate's degree are most likely to be married with 14.3% of them married at childbirth, while women with the educational attainment of college or associate's degree are least likely to be married with 85.7% of them unmarried at childbirth.
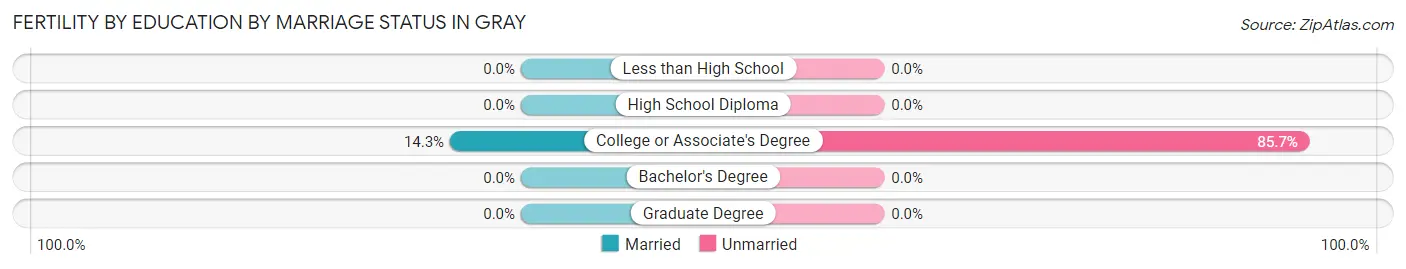
| Educational Attainment | Married | Unmarried |
| Less than High School | 0 (0.0%) | 0 (0.0%) |
| High School Diploma | 0 (0.0%) | 0 (0.0%) |
| College or Associate's Degree | 1 (14.3%) | 6 (85.7%) |
| Bachelor's Degree | 0 (0.0%) | 0 (0.0%) |
| Graduate Degree | 0 (0.0%) | 0 (0.0%) |
| Total | 1 (14.3%) | 6 (85.7%) |
Employment Characteristics in Gray
Employment by Class of Employer in Gray
Among the 24 employed individuals in Gray, private company employees (10 | 41.7%), self-employed (not incorporated) (6 | 25.0%), and local government employees (6 | 25.0%) make up the most common classes of employment.
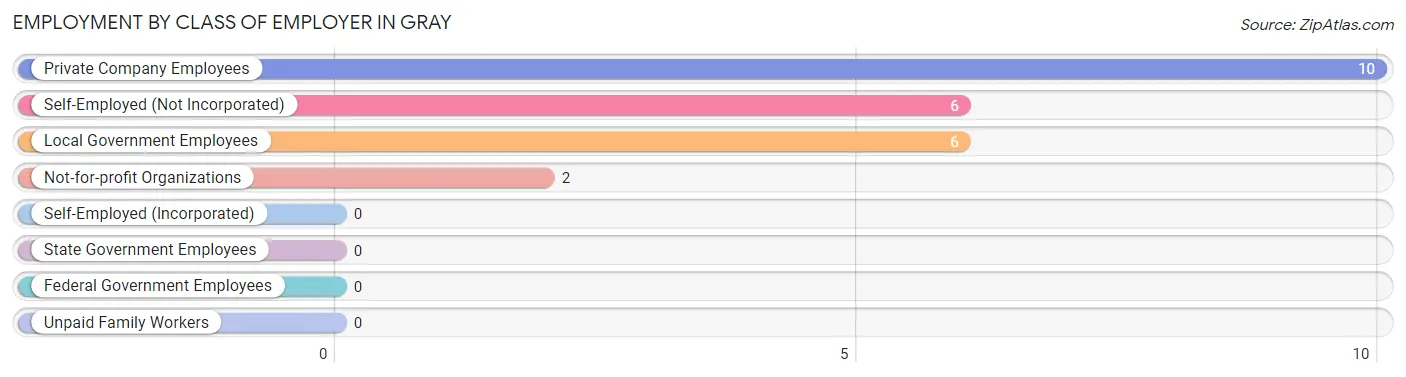
| Employer Class | # Employees | % Employees |
| Private Company Employees | 10 | 41.7% |
| Self-Employed (Incorporated) | 0 | 0.0% |
| Self-Employed (Not Incorporated) | 6 | 25.0% |
| Not-for-profit Organizations | 2 | 8.3% |
| Local Government Employees | 6 | 25.0% |
| State Government Employees | 0 | 0.0% |
| Federal Government Employees | 0 | 0.0% |
| Unpaid Family Workers | 0 | 0.0% |
| Total | 24 | 100.0% |
Employment Status by Age in Gray
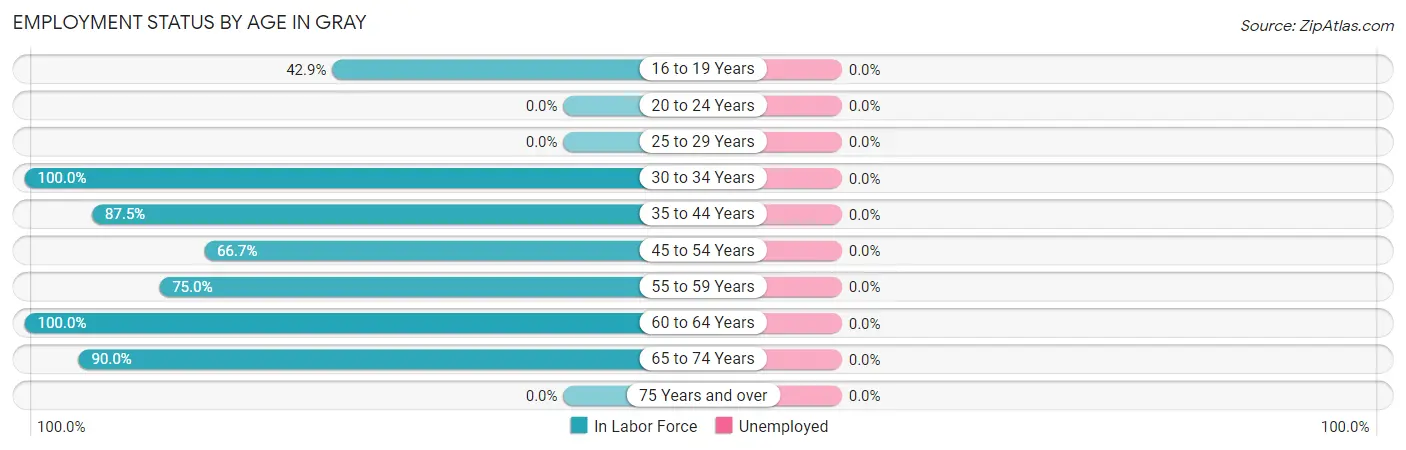
| Age Bracket | In Labor Force | Unemployed |
| 16 to 19 Years | 3 (42.9%) | 0 (0.0%) |
| 20 to 24 Years | 0 (0.0%) | 0 (0.0%) |
| 25 to 29 Years | 0 (0.0%) | 0 (0.0%) |
| 30 to 34 Years | 2 (100.0%) | 0 (0.0%) |
| 35 to 44 Years | 7 (87.5%) | 0 (0.0%) |
| 45 to 54 Years | 4 (66.7%) | 0 (0.0%) |
| 55 to 59 Years | 3 (75.0%) | 0 (0.0%) |
| 60 to 64 Years | 2 (100.0%) | 0 (0.0%) |
| 65 to 74 Years | 9 (90.0%) | 0 (0.0%) |
| 75 Years and over | 0 (0.0%) | 0 (0.0%) |
| Total | 30 (63.8%) | 0 (0.0%) |
Employment Status by Educational Attainment in Gray
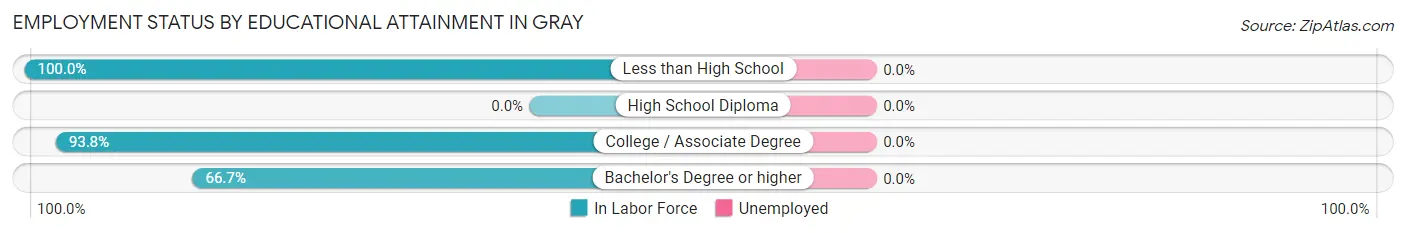
| Educational Attainment | In Labor Force | Unemployed |
| Less than High School | 1 (100.0%) | 0 (0.0%) |
| High School Diploma | 0 (0.0%) | 0 (0.0%) |
| College / Associate Degree | 15 (93.8%) | 0 (0.0%) |
| Bachelor's Degree or higher | 2 (66.7%) | 0 (0.0%) |
| Total | 18 (81.8%) | 0 (0.0%) |
Employment Occupations by Sex in Gray
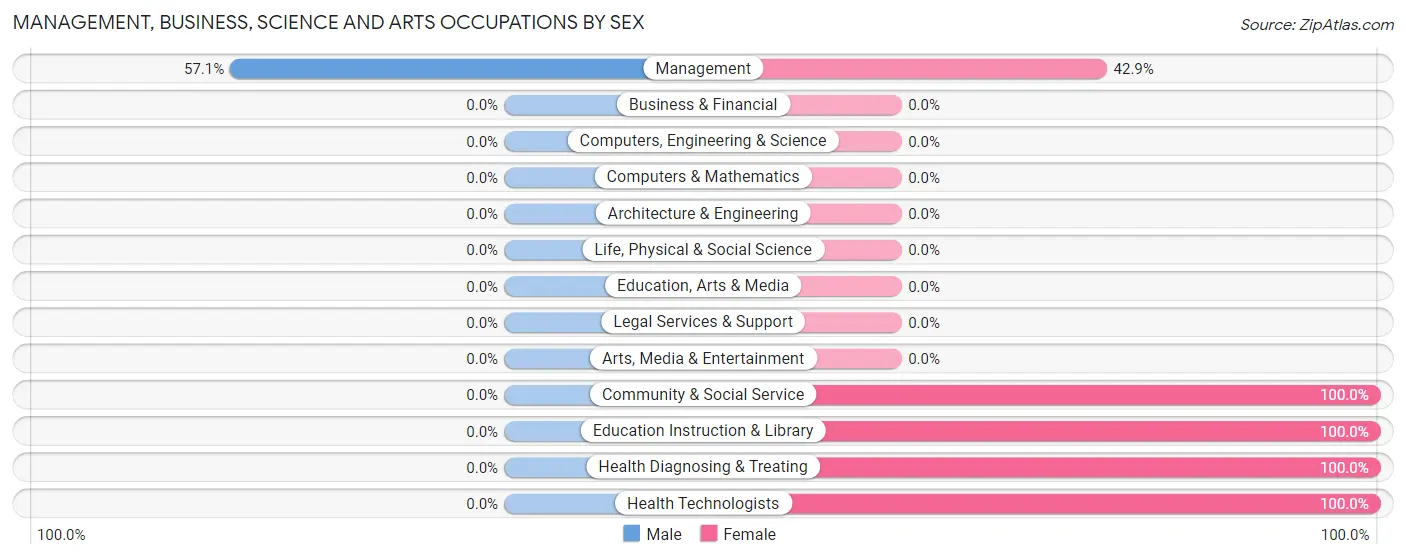
Management, Business, Science and Arts Occupations
The most common Management, Business, Science and Arts occupations in Gray are Management (7 | 23.3%), Community & Social Service (2 | 6.7%), Education Instruction & Library (2 | 6.7%), Health Diagnosing & Treating (1 | 3.3%), and Health Technologists (1 | 3.3%).
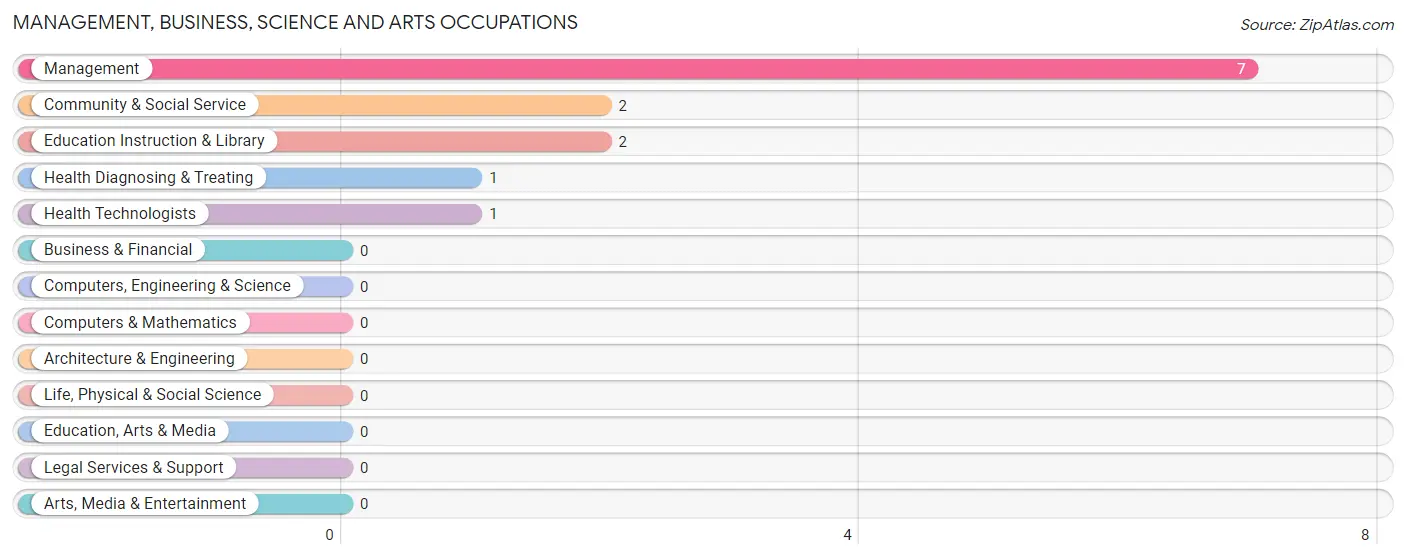
Management, Business, Science and Arts Occupations by Sex
| Occupation | Male | Female |
| Management | 4 (57.1%) | 3 (42.9%) |
| Business & Financial | 0 (0.0%) | 0 (0.0%) |
| Computers, Engineering & Science | 0 (0.0%) | 0 (0.0%) |
| Computers & Mathematics | 0 (0.0%) | 0 (0.0%) |
| Architecture & Engineering | 0 (0.0%) | 0 (0.0%) |
| Life, Physical & Social Science | 0 (0.0%) | 0 (0.0%) |
| Community & Social Service | 0 (0.0%) | 2 (100.0%) |
| Education, Arts & Media | 0 (0.0%) | 0 (0.0%) |
| Legal Services & Support | 0 (0.0%) | 0 (0.0%) |
| Education Instruction & Library | 0 (0.0%) | 2 (100.0%) |
| Arts, Media & Entertainment | 0 (0.0%) | 0 (0.0%) |
| Health Diagnosing & Treating | 0 (0.0%) | 1 (100.0%) |
| Health Technologists | 0 (0.0%) | 1 (100.0%) |
| Total (Category) | 4 (40.0%) | 6 (60.0%) |
| Total (Overall) | 18 (60.0%) | 12 (40.0%) |
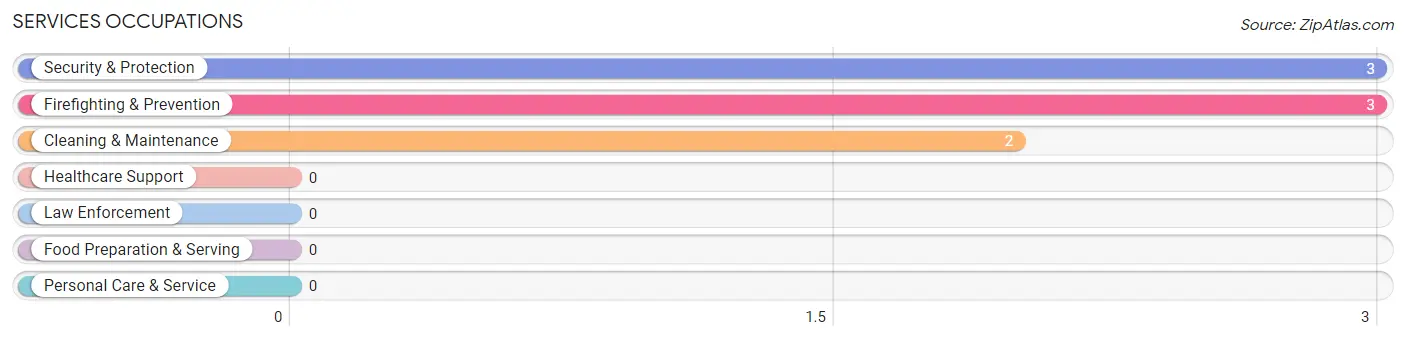
Services Occupations
The most common Services occupations in Gray are Security & Protection (3 | 10.0%), Firefighting & Prevention (3 | 10.0%), and Cleaning & Maintenance (2 | 6.7%).
Services Occupations by Sex
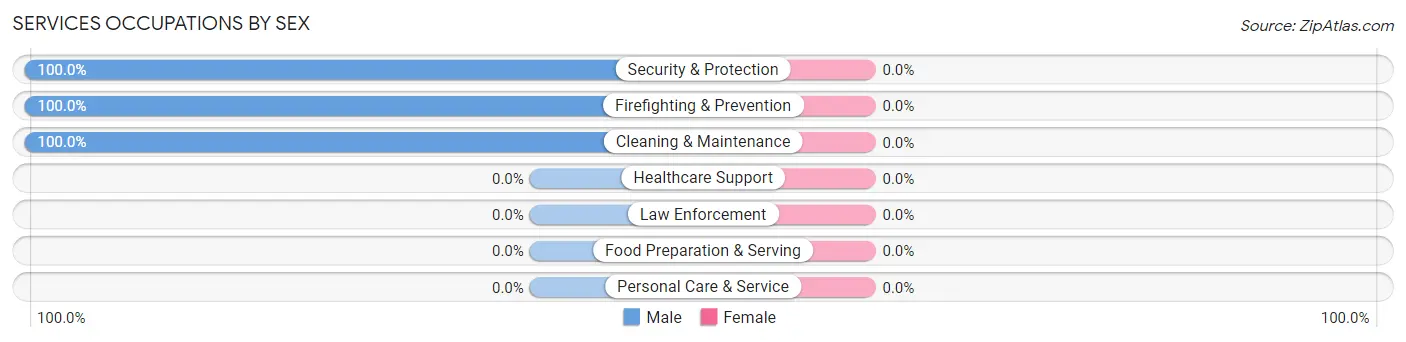
| Occupation | Male | Female |
| Healthcare Support | 0 (0.0%) | 0 (0.0%) |
| Security & Protection | 3 (100.0%) | 0 (0.0%) |
| Firefighting & Prevention | 3 (100.0%) | 0 (0.0%) |
| Law Enforcement | 0 (0.0%) | 0 (0.0%) |
| Food Preparation & Serving | 0 (0.0%) | 0 (0.0%) |
| Cleaning & Maintenance | 2 (100.0%) | 0 (0.0%) |
| Personal Care & Service | 0 (0.0%) | 0 (0.0%) |
| Total (Category) | 5 (100.0%) | 0 (0.0%) |
| Total (Overall) | 18 (60.0%) | 12 (40.0%) |
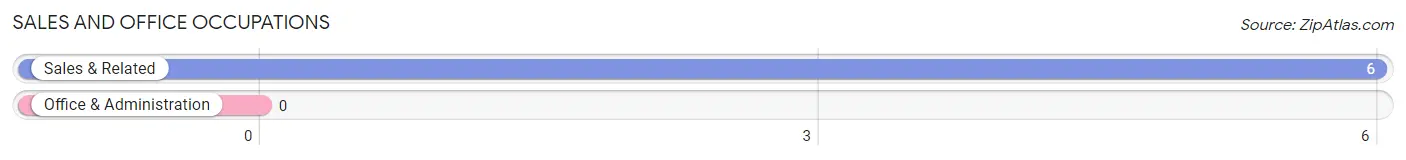
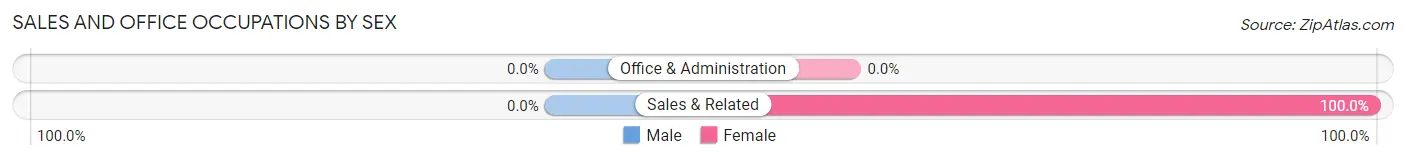
Sales and Office Occupations
The most common Sales and Office occupations in Gray are , and Sales & Related (6 | 20.0%).
Sales and Office Occupations by Sex
| Occupation | Male | Female |
| Sales & Related | 0 (0.0%) | 6 (100.0%) |
| Office & Administration | 0 (0.0%) | 0 (0.0%) |
| Total (Category) | 0 (0.0%) | 6 (100.0%) |
| Total (Overall) | 18 (60.0%) | 12 (40.0%) |
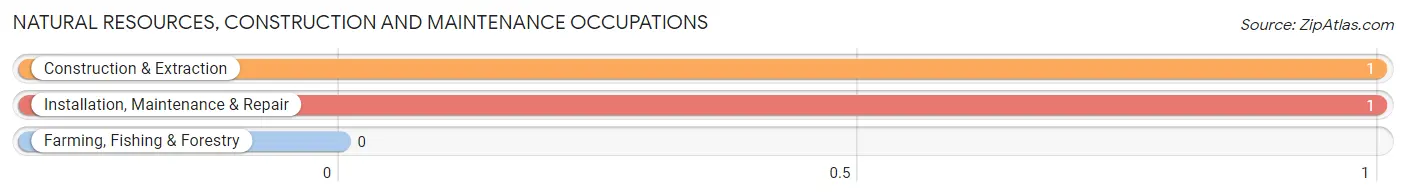
Natural Resources, Construction and Maintenance Occupations
The most common Natural Resources, Construction and Maintenance occupations in Gray are Construction & Extraction (1 | 3.3%), and Installation, Maintenance & Repair (1 | 3.3%).
Natural Resources, Construction and Maintenance Occupations by Sex
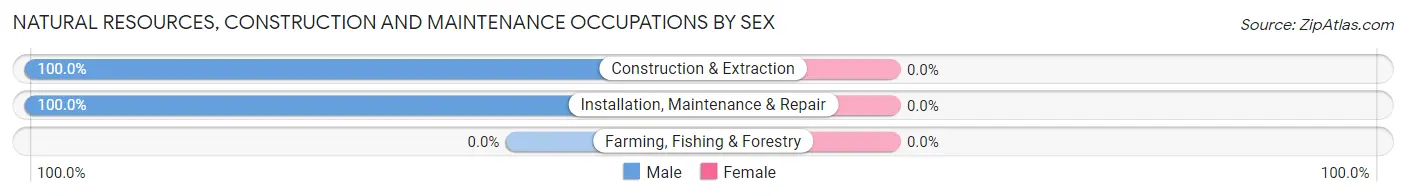
| Occupation | Male | Female |
| Farming, Fishing & Forestry | 0 (0.0%) | 0 (0.0%) |
| Construction & Extraction | 1 (100.0%) | 0 (0.0%) |
| Installation, Maintenance & Repair | 1 (100.0%) | 0 (0.0%) |
| Total (Category) | 2 (100.0%) | 0 (0.0%) |
| Total (Overall) | 18 (60.0%) | 12 (40.0%) |
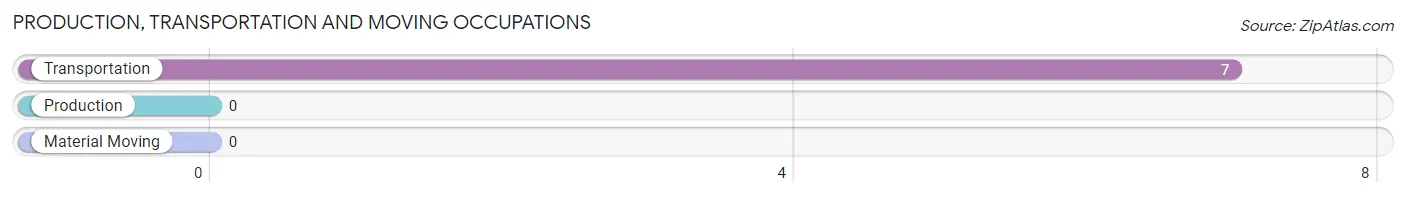
Production, Transportation and Moving Occupations
The most common Production, Transportation and Moving occupations in Gray are , and Transportation (7 | 23.3%).
Production, Transportation and Moving Occupations by Sex
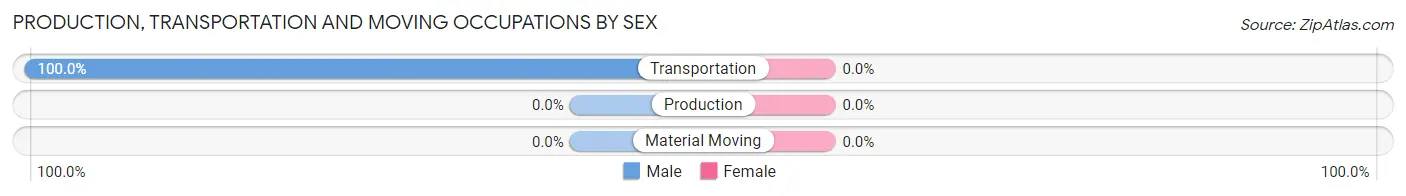
| Occupation | Male | Female |
| Production | 0 (0.0%) | 0 (0.0%) |
| Transportation | 7 (100.0%) | 0 (0.0%) |
| Material Moving | 0 (0.0%) | 0 (0.0%) |
| Total (Category) | 7 (100.0%) | 0 (0.0%) |
| Total (Overall) | 18 (60.0%) | 12 (40.0%) |
Employment Industries by Sex in Gray
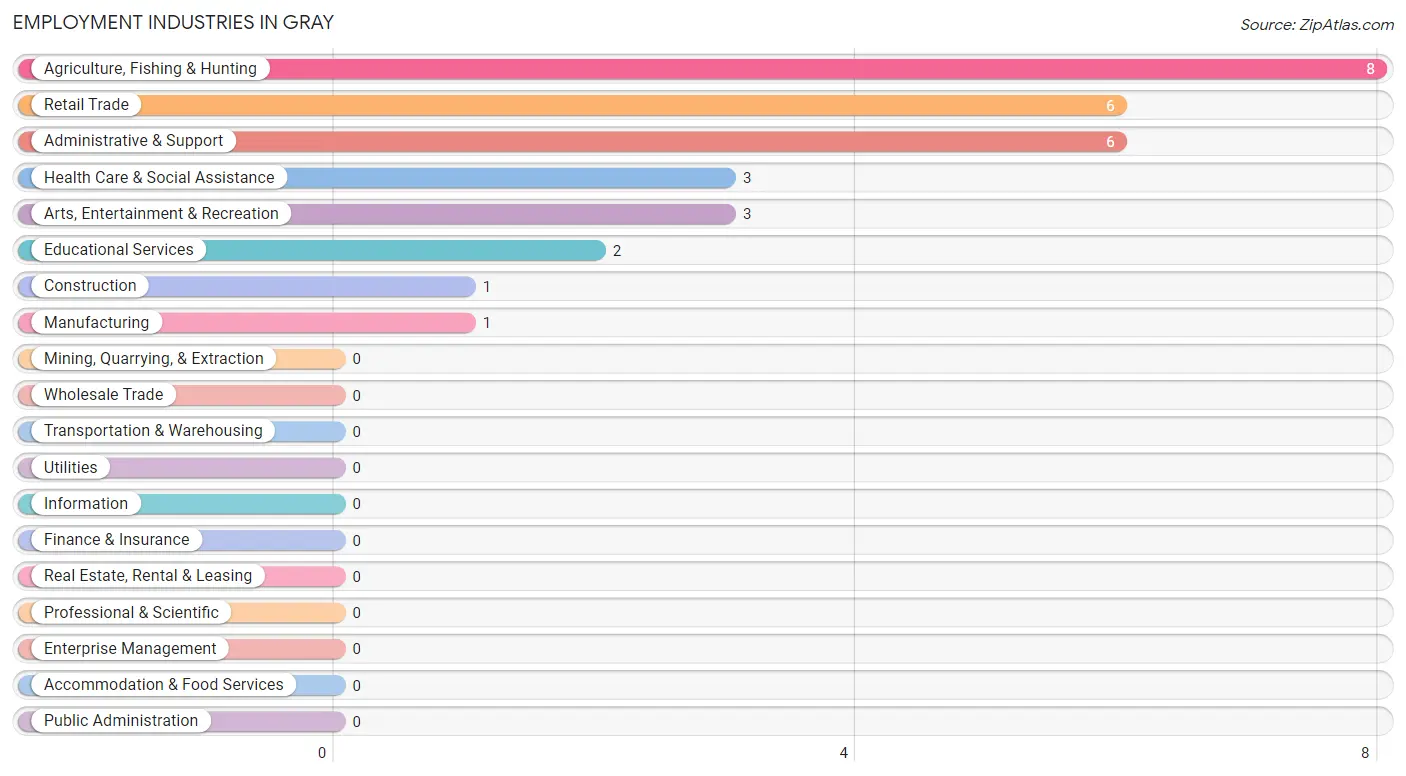
Employment Industries in Gray
The major employment industries in Gray include Agriculture, Fishing & Hunting (8 | 26.7%), Retail Trade (6 | 20.0%), Administrative & Support (6 | 20.0%), Health Care & Social Assistance (3 | 10.0%), and Arts, Entertainment & Recreation (3 | 10.0%).
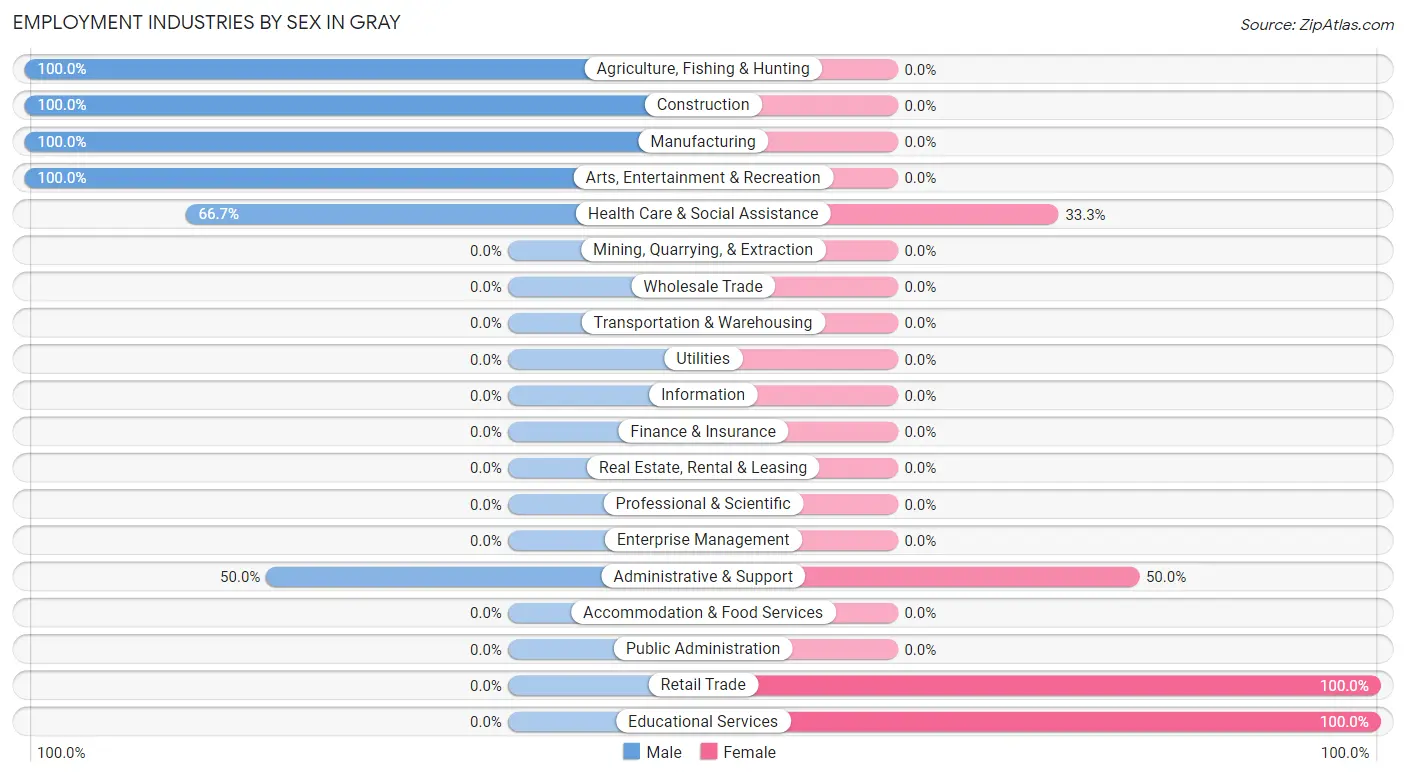
Employment Industries by Sex in Gray
The Gray industries that see more men than women are Agriculture, Fishing & Hunting (100.0%), Construction (100.0%), and Manufacturing (100.0%), whereas the industries that tend to have a higher number of women are Retail Trade (100.0%), Educational Services (100.0%), and Administrative & Support (50.0%).
| Industry | Male | Female |
| Agriculture, Fishing & Hunting | 8 (100.0%) | 0 (0.0%) |
| Mining, Quarrying, & Extraction | 0 (0.0%) | 0 (0.0%) |
| Construction | 1 (100.0%) | 0 (0.0%) |
| Manufacturing | 1 (100.0%) | 0 (0.0%) |
| Wholesale Trade | 0 (0.0%) | 0 (0.0%) |
| Retail Trade | 0 (0.0%) | 6 (100.0%) |
| Transportation & Warehousing | 0 (0.0%) | 0 (0.0%) |
| Utilities | 0 (0.0%) | 0 (0.0%) |
| Information | 0 (0.0%) | 0 (0.0%) |
| Finance & Insurance | 0 (0.0%) | 0 (0.0%) |
| Real Estate, Rental & Leasing | 0 (0.0%) | 0 (0.0%) |
| Professional & Scientific | 0 (0.0%) | 0 (0.0%) |
| Enterprise Management | 0 (0.0%) | 0 (0.0%) |
| Administrative & Support | 3 (50.0%) | 3 (50.0%) |
| Educational Services | 0 (0.0%) | 2 (100.0%) |
| Health Care & Social Assistance | 2 (66.7%) | 1 (33.3%) |
| Arts, Entertainment & Recreation | 3 (100.0%) | 0 (0.0%) |
| Accommodation & Food Services | 0 (0.0%) | 0 (0.0%) |
| Public Administration | 0 (0.0%) | 0 (0.0%) |
| Total | 18 (60.0%) | 12 (40.0%) |
Education in Gray
School Enrollment in Gray
The most common levels of schooling among the 28 students in Gray are high school (13 | 46.4%), middle school (9 | 32.1%), and elementary school (5 | 17.9%).
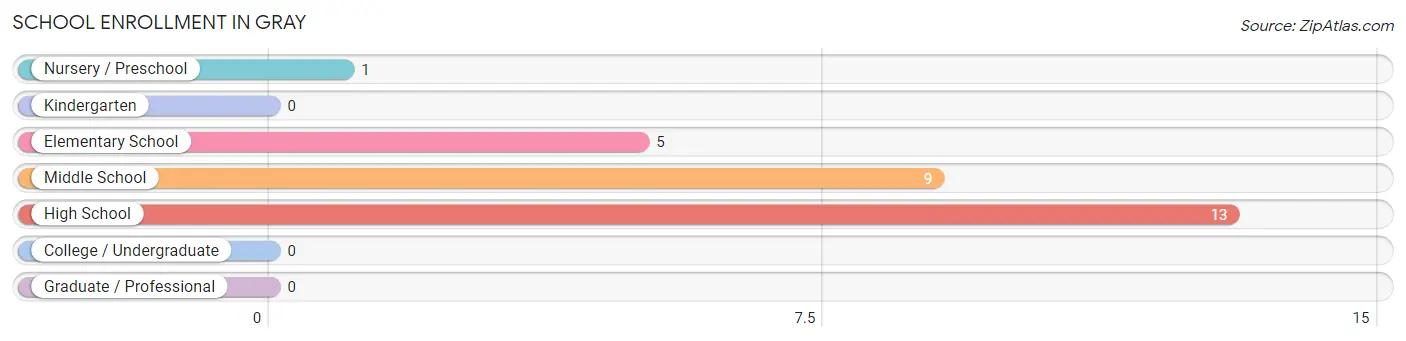
| School Level | # Students | % Students |
| Nursery / Preschool | 1 | 3.6% |
| Kindergarten | 0 | 0.0% |
| Elementary School | 5 | 17.9% |
| Middle School | 9 | 32.1% |
| High School | 13 | 46.4% |
| College / Undergraduate | 0 | 0.0% |
| Graduate / Professional | 0 | 0.0% |
| Total | 28 | 100.0% |
School Enrollment by Age by Funding Source in Gray
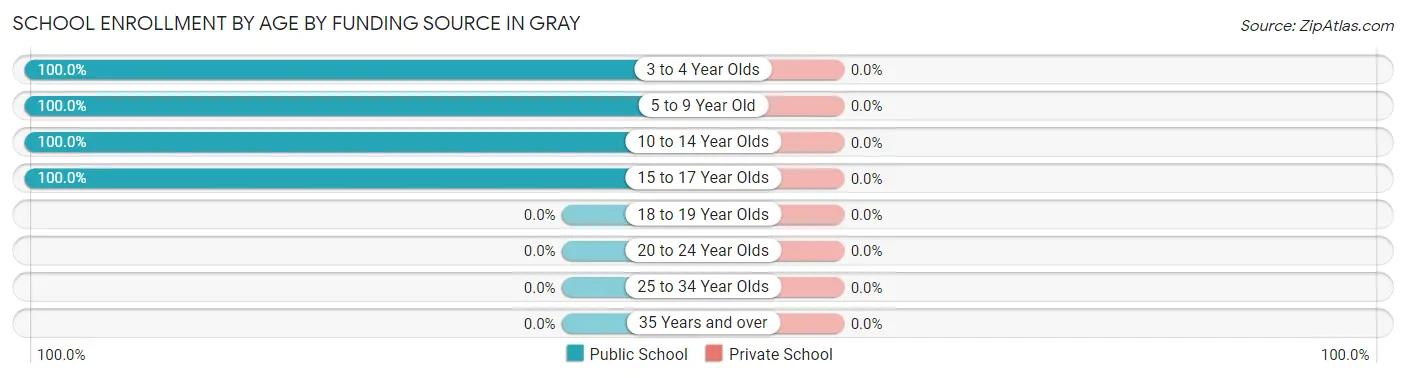
| Age Bracket | Public School | Private School |
| 3 to 4 Year Olds | 1 (100.0%) | 0 (0.0%) |
| 5 to 9 Year Old | 5 (100.0%) | 0 (0.0%) |
| 10 to 14 Year Olds | 15 (100.0%) | 0 (0.0%) |
| 15 to 17 Year Olds | 7 (100.0%) | 0 (0.0%) |
| 18 to 19 Year Olds | 0 (0.0%) | 0 (0.0%) |
| 20 to 24 Year Olds | 0 (0.0%) | 0 (0.0%) |
| 25 to 34 Year Olds | 0 (0.0%) | 0 (0.0%) |
| 35 Years and over | 0 (0.0%) | 0 (0.0%) |
| Total | 28 (100.0%) | 0 (0.0%) |
Educational Attainment by Field of Study in Gray
Science & technology (2 | 50.0%), bio, nature & agricultural (1 | 25.0%), and arts & humanities (1 | 25.0%) are the most common fields of study among 4 individuals in Gray who have obtained a bachelor's degree or higher.
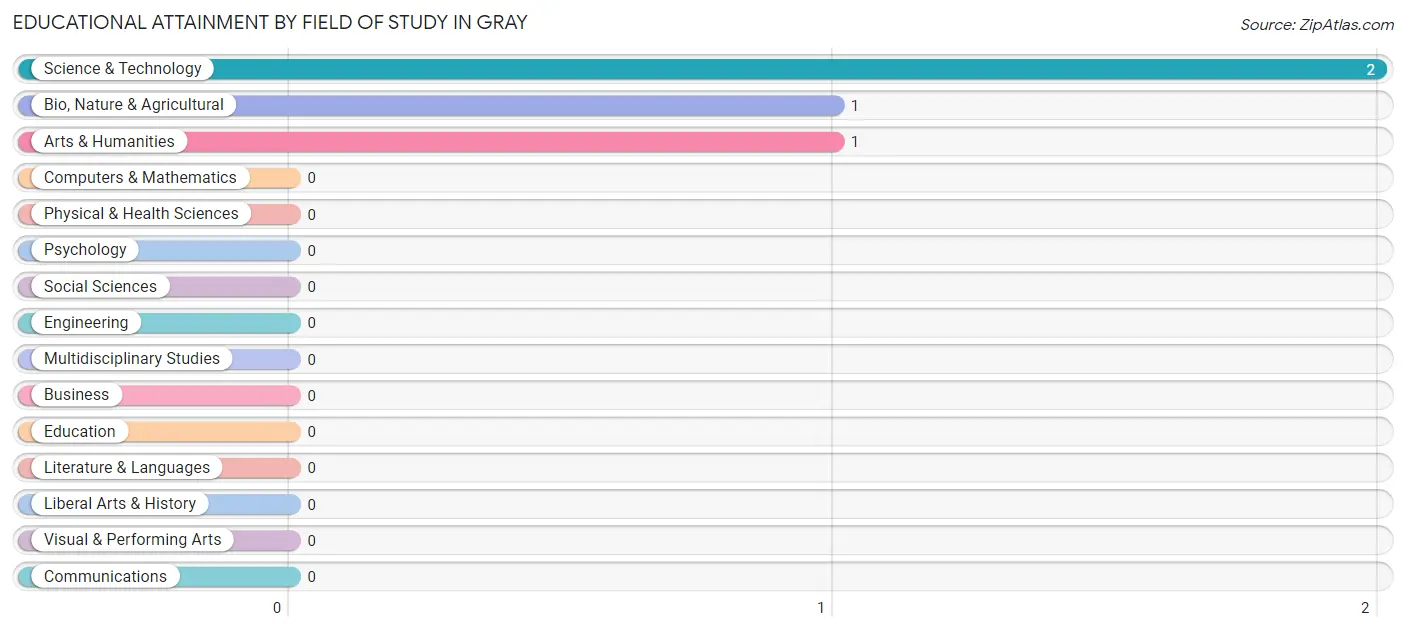
| Field of Study | # Graduates | % Graduates |
| Computers & Mathematics | 0 | 0.0% |
| Bio, Nature & Agricultural | 1 | 25.0% |
| Physical & Health Sciences | 0 | 0.0% |
| Psychology | 0 | 0.0% |
| Social Sciences | 0 | 0.0% |
| Engineering | 0 | 0.0% |
| Multidisciplinary Studies | 0 | 0.0% |
| Science & Technology | 2 | 50.0% |
| Business | 0 | 0.0% |
| Education | 0 | 0.0% |
| Literature & Languages | 0 | 0.0% |
| Liberal Arts & History | 0 | 0.0% |
| Visual & Performing Arts | 0 | 0.0% |
| Communications | 0 | 0.0% |
| Arts & Humanities | 1 | 25.0% |
| Total | 4 | 100.0% |
Transportation & Commute in Gray
Vehicle Availability by Sex in Gray
The most prevalent vehicle ownership categories in Gray are males with 1 vehicle (7, accounting for 38.9%) and females with 1 vehicle (0, making up 116.7%).
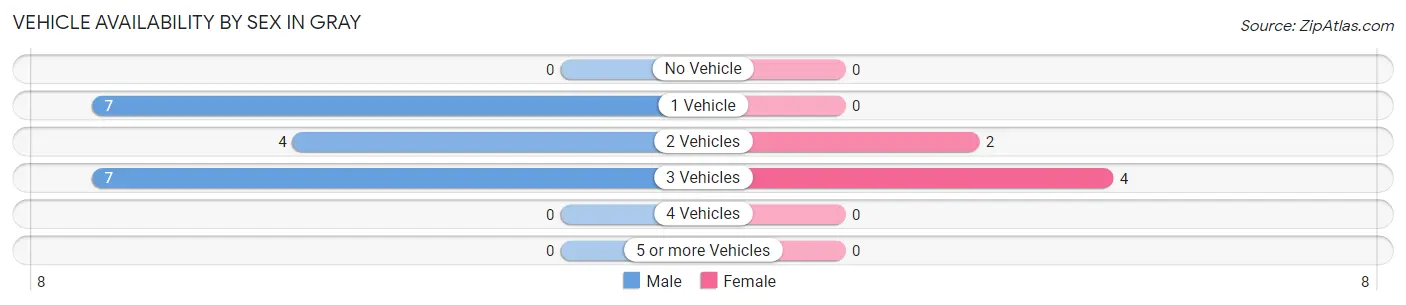
| Vehicles Available | Male | Female |
| No Vehicle | 0 (0.0%) | 0 (0.0%) |
| 1 Vehicle | 7 (38.9%) | 0 (0.0%) |
| 2 Vehicles | 4 (22.2%) | 2 (33.3%) |
| 3 Vehicles | 7 (38.9%) | 4 (66.7%) |
| 4 Vehicles | 0 (0.0%) | 0 (0.0%) |
| 5 or more Vehicles | 0 (0.0%) | 0 (0.0%) |
| Total | 18 (100.0%) | 6 (100.0%) |
Commute Time in Gray
The most frequently occuring commute durations in Gray are 40 to 44 minutes (7 commuters, 46.7%), 20 to 24 minutes (3 commuters, 20.0%), and 15 to 19 minutes (2 commuters, 13.3%).
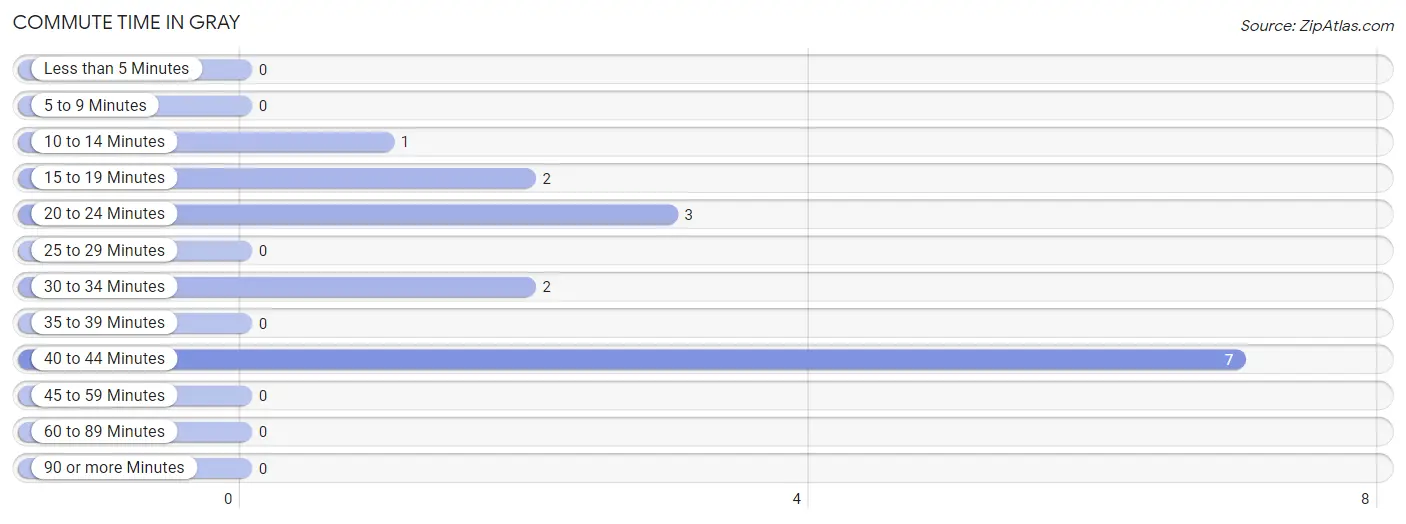
| Commute Time | # Commuters | % Commuters |
| Less than 5 Minutes | 0 | 0.0% |
| 5 to 9 Minutes | 0 | 0.0% |
| 10 to 14 Minutes | 1 | 6.7% |
| 15 to 19 Minutes | 2 | 13.3% |
| 20 to 24 Minutes | 3 | 20.0% |
| 25 to 29 Minutes | 0 | 0.0% |
| 30 to 34 Minutes | 2 | 13.3% |
| 35 to 39 Minutes | 0 | 0.0% |
| 40 to 44 Minutes | 7 | 46.7% |
| 45 to 59 Minutes | 0 | 0.0% |
| 60 to 89 Minutes | 0 | 0.0% |
| 90 or more Minutes | 0 | 0.0% |
Commute Time by Sex in Gray
The most common commute times in Gray are 40 to 44 minutes (7 commuters, 58.3%) for males and 15 to 19 minutes (2 commuters, 66.7%) for females.
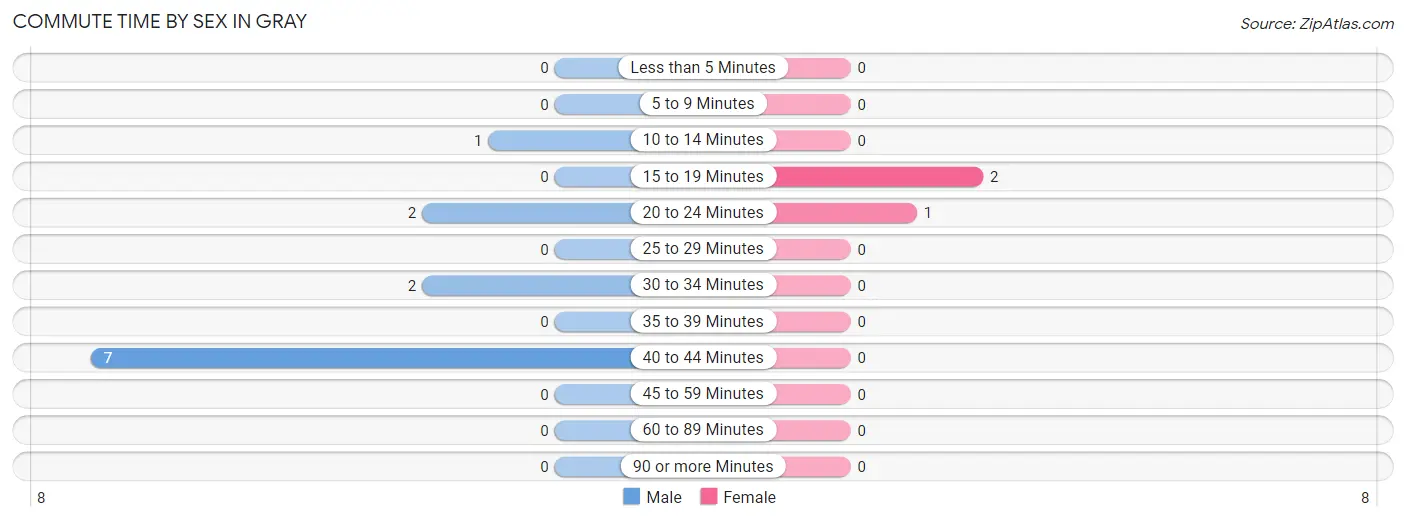
| Commute Time | Male | Female |
| Less than 5 Minutes | 0 (0.0%) | 0 (0.0%) |
| 5 to 9 Minutes | 0 (0.0%) | 0 (0.0%) |
| 10 to 14 Minutes | 1 (8.3%) | 0 (0.0%) |
| 15 to 19 Minutes | 0 (0.0%) | 2 (66.7%) |
| 20 to 24 Minutes | 2 (16.7%) | 1 (33.3%) |
| 25 to 29 Minutes | 0 (0.0%) | 0 (0.0%) |
| 30 to 34 Minutes | 2 (16.7%) | 0 (0.0%) |
| 35 to 39 Minutes | 0 (0.0%) | 0 (0.0%) |
| 40 to 44 Minutes | 7 (58.3%) | 0 (0.0%) |
| 45 to 59 Minutes | 0 (0.0%) | 0 (0.0%) |
| 60 to 89 Minutes | 0 (0.0%) | 0 (0.0%) |
| 90 or more Minutes | 0 (0.0%) | 0 (0.0%) |
Time of Departure to Work by Sex in Gray
The most frequent times of departure to work in Gray are 6:00 AM to 6:29 AM (7, 58.3%) for males and 7:30 AM to 7:59 AM (2, 66.7%) for females.
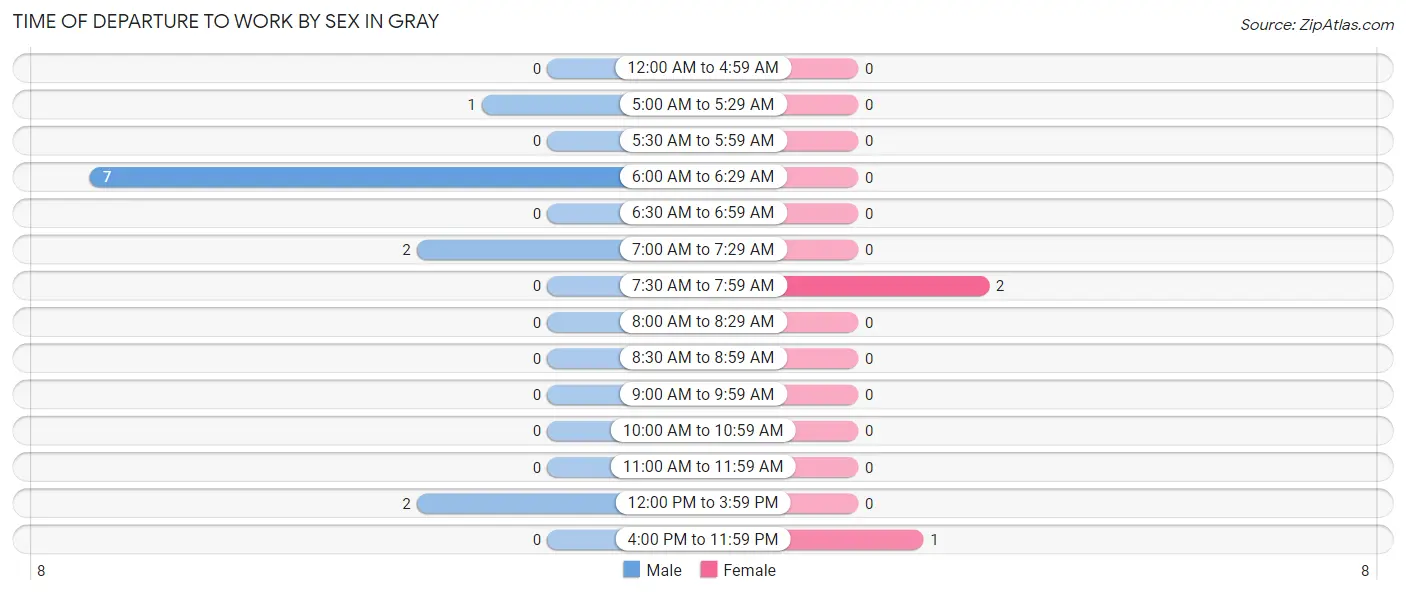
| Time of Departure | Male | Female |
| 12:00 AM to 4:59 AM | 0 (0.0%) | 0 (0.0%) |
| 5:00 AM to 5:29 AM | 1 (8.3%) | 0 (0.0%) |
| 5:30 AM to 5:59 AM | 0 (0.0%) | 0 (0.0%) |
| 6:00 AM to 6:29 AM | 7 (58.3%) | 0 (0.0%) |
| 6:30 AM to 6:59 AM | 0 (0.0%) | 0 (0.0%) |
| 7:00 AM to 7:29 AM | 2 (16.7%) | 0 (0.0%) |
| 7:30 AM to 7:59 AM | 0 (0.0%) | 2 (66.7%) |
| 8:00 AM to 8:29 AM | 0 (0.0%) | 0 (0.0%) |
| 8:30 AM to 8:59 AM | 0 (0.0%) | 0 (0.0%) |
| 9:00 AM to 9:59 AM | 0 (0.0%) | 0 (0.0%) |
| 10:00 AM to 10:59 AM | 0 (0.0%) | 0 (0.0%) |
| 11:00 AM to 11:59 AM | 0 (0.0%) | 0 (0.0%) |
| 12:00 PM to 3:59 PM | 2 (16.7%) | 0 (0.0%) |
| 4:00 PM to 11:59 PM | 0 (0.0%) | 1 (33.3%) |
| Total | 12 (100.0%) | 3 (100.0%) |
Housing Occupancy in Gray
Occupancy by Ownership in Gray
Of the total 27 dwellings in Gray, owner-occupied units account for 21 (77.8%), while renter-occupied units make up 6 (22.2%).
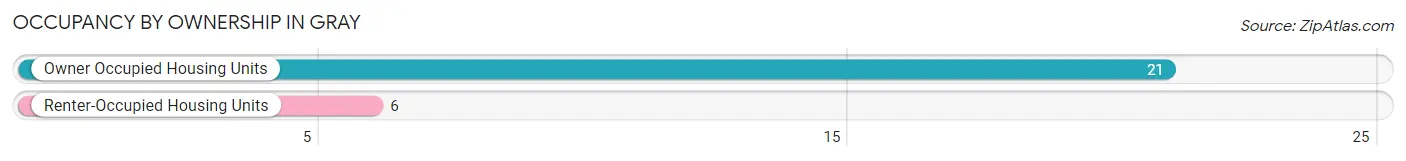
| Occupancy | # Housing Units | % Housing Units |
| Owner Occupied Housing Units | 21 | 77.8% |
| Renter-Occupied Housing Units | 6 | 22.2% |
| Total Occupied Housing Units | 27 | 100.0% |
Occupancy by Household Size in Gray
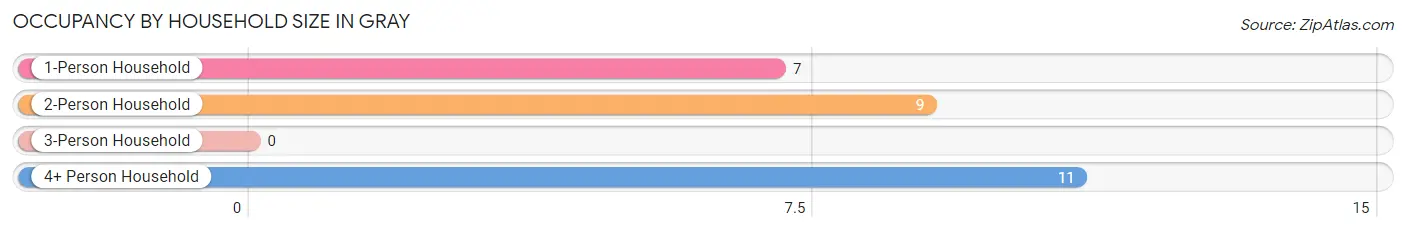
| Household Size | # Housing Units | % Housing Units |
| 1-Person Household | 7 | 25.9% |
| 2-Person Household | 9 | 33.3% |
| 3-Person Household | 0 | 0.0% |
| 4+ Person Household | 11 | 40.7% |
| Total Housing Units | 27 | 100.0% |
Occupancy by Ownership by Household Size in Gray
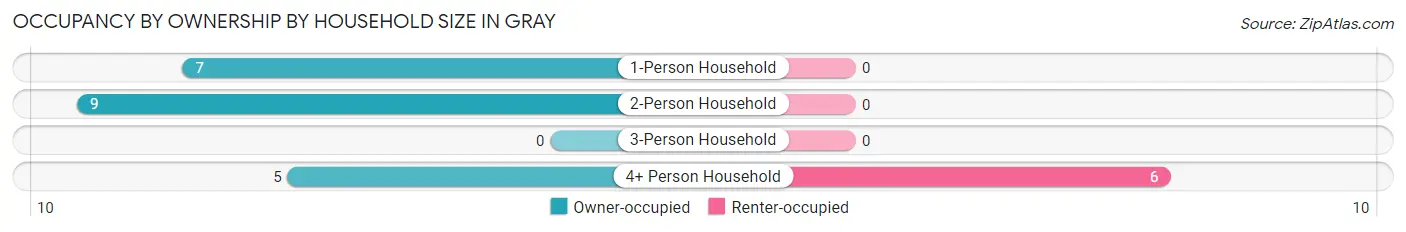
| Household Size | Owner-occupied | Renter-occupied |
| 1-Person Household | 7 (100.0%) | 0 (0.0%) |
| 2-Person Household | 9 (100.0%) | 0 (0.0%) |
| 3-Person Household | 0 (0.0%) | 0 (0.0%) |
| 4+ Person Household | 5 (45.5%) | 6 (54.5%) |
| Total Housing Units | 21 (77.8%) | 6 (22.2%) |
Occupancy by Educational Attainment in Gray
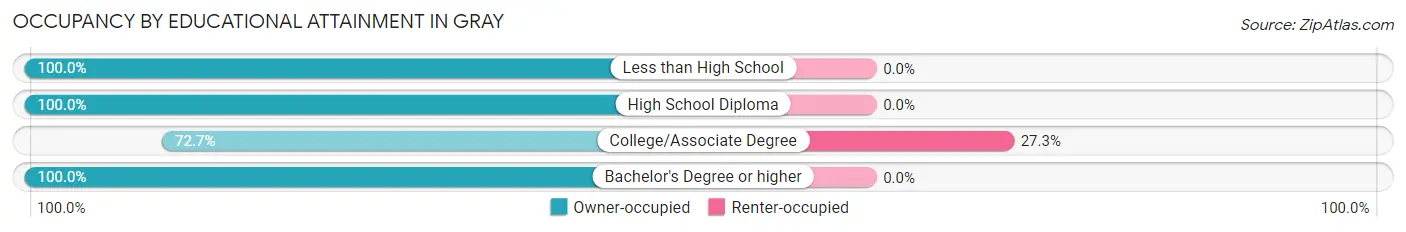
| Household Size | Owner-occupied | Renter-occupied |
| Less than High School | 1 (100.0%) | 0 (0.0%) |
| High School Diploma | 2 (100.0%) | 0 (0.0%) |
| College/Associate Degree | 16 (72.7%) | 6 (27.3%) |
| Bachelor's Degree or higher | 2 (100.0%) | 0 (0.0%) |
Occupancy by Age of Householder in Gray
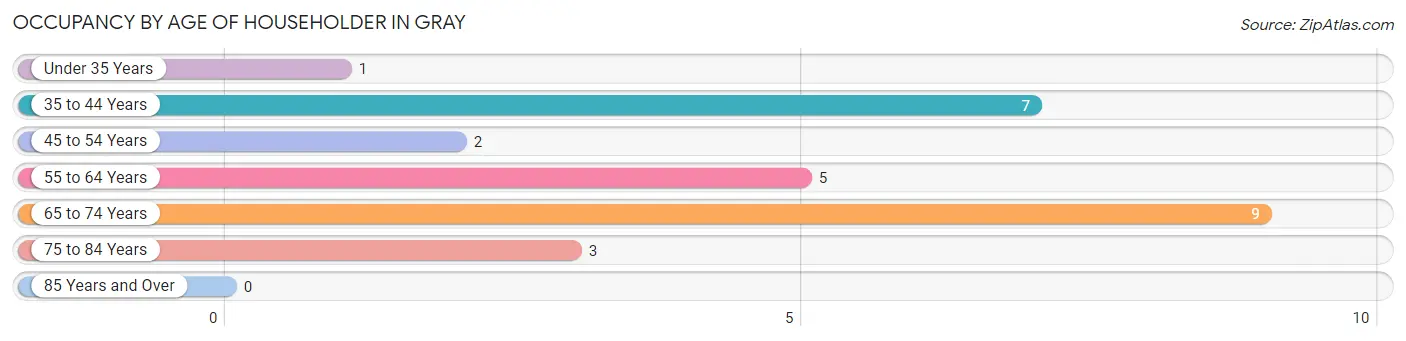
| Age Bracket | # Households | % Households |
| Under 35 Years | 1 | 3.7% |
| 35 to 44 Years | 7 | 25.9% |
| 45 to 54 Years | 2 | 7.4% |
| 55 to 64 Years | 5 | 18.5% |
| 65 to 74 Years | 9 | 33.3% |
| 75 to 84 Years | 3 | 11.1% |
| 85 Years and Over | 0 | 0.0% |
| Total | 27 | 100.0% |
Housing Finances in Gray
Median Income by Occupancy in Gray
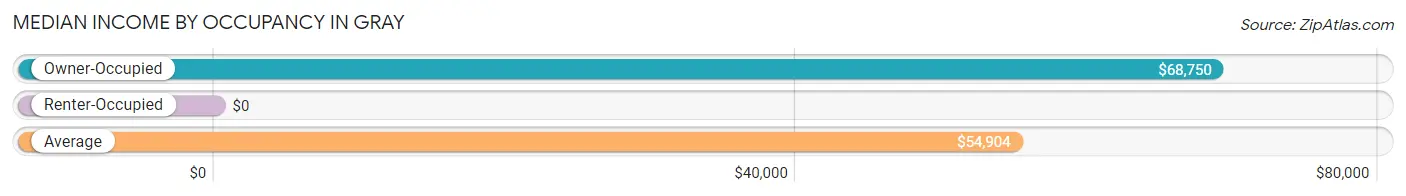
| Occupancy Type | # Households | Median Income |
| Owner-Occupied | 21 (77.8%) | $68,750 |
| Renter-Occupied | 6 (22.2%) | $0 |
| Average | 27 (100.0%) | $54,904 |
Occupancy by Householder Income Bracket in Gray
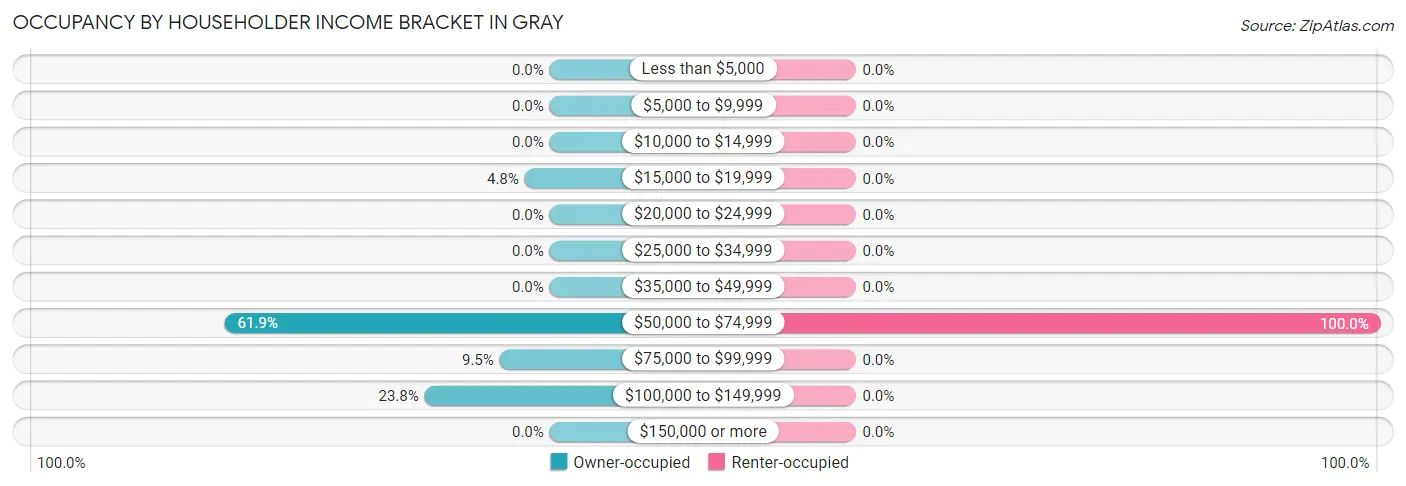
| Income Bracket | Owner-occupied | Renter-occupied |
| Less than $5,000 | 0 (0.0%) | 0 (0.0%) |
| $5,000 to $9,999 | 0 (0.0%) | 0 (0.0%) |
| $10,000 to $14,999 | 0 (0.0%) | 0 (0.0%) |
| $15,000 to $19,999 | 1 (4.8%) | 0 (0.0%) |
| $20,000 to $24,999 | 0 (0.0%) | 0 (0.0%) |
| $25,000 to $34,999 | 0 (0.0%) | 0 (0.0%) |
| $35,000 to $49,999 | 0 (0.0%) | 0 (0.0%) |
| $50,000 to $74,999 | 13 (61.9%) | 6 (100.0%) |
| $75,000 to $99,999 | 2 (9.5%) | 0 (0.0%) |
| $100,000 to $149,999 | 5 (23.8%) | 0 (0.0%) |
| $150,000 or more | 0 (0.0%) | 0 (0.0%) |
| Total | 21 (100.0%) | 6 (100.0%) |
Monthly Housing Cost Tiers in Gray
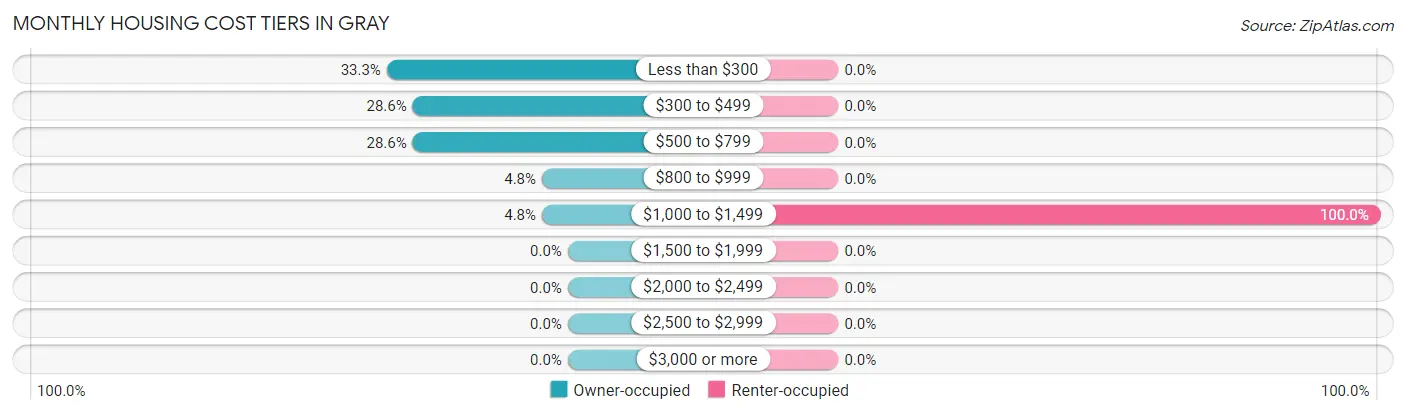
| Monthly Cost | Owner-occupied | Renter-occupied |
| Less than $300 | 7 (33.3%) | 0 (0.0%) |
| $300 to $499 | 6 (28.6%) | 0 (0.0%) |
| $500 to $799 | 6 (28.6%) | 0 (0.0%) |
| $800 to $999 | 1 (4.8%) | 0 (0.0%) |
| $1,000 to $1,499 | 1 (4.8%) | 6 (100.0%) |
| $1,500 to $1,999 | 0 (0.0%) | 0 (0.0%) |
| $2,000 to $2,499 | 0 (0.0%) | 0 (0.0%) |
| $2,500 to $2,999 | 0 (0.0%) | 0 (0.0%) |
| $3,000 or more | 0 (0.0%) | 0 (0.0%) |
| Total | 21 (100.0%) | 6 (100.0%) |
Physical Housing Characteristics in Gray
Housing Structures in Gray
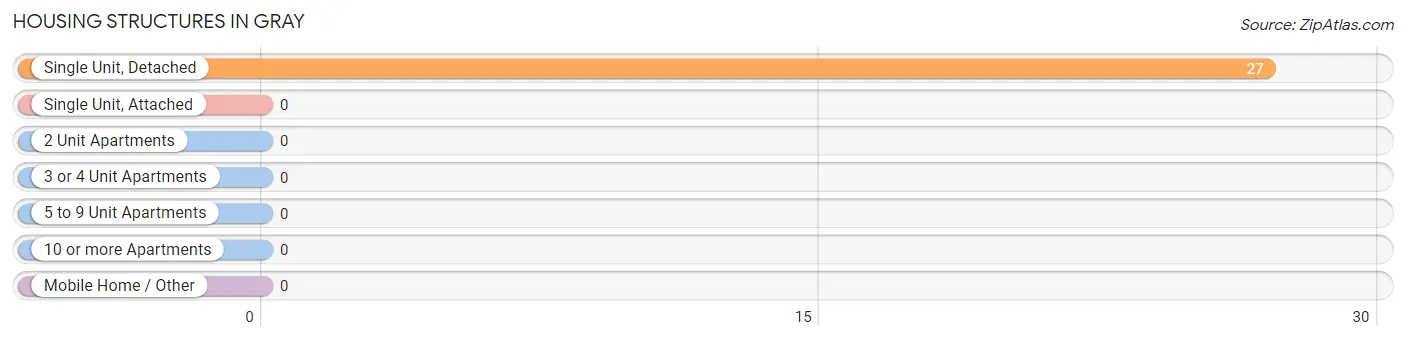
| Structure Type | # Housing Units | % Housing Units |
| Single Unit, Detached | 27 | 100.0% |
| Single Unit, Attached | 0 | 0.0% |
| 2 Unit Apartments | 0 | 0.0% |
| 3 or 4 Unit Apartments | 0 | 0.0% |
| 5 to 9 Unit Apartments | 0 | 0.0% |
| 10 or more Apartments | 0 | 0.0% |
| Mobile Home / Other | 0 | 0.0% |
| Total | 27 | 100.0% |
Housing Structures by Occupancy in Gray
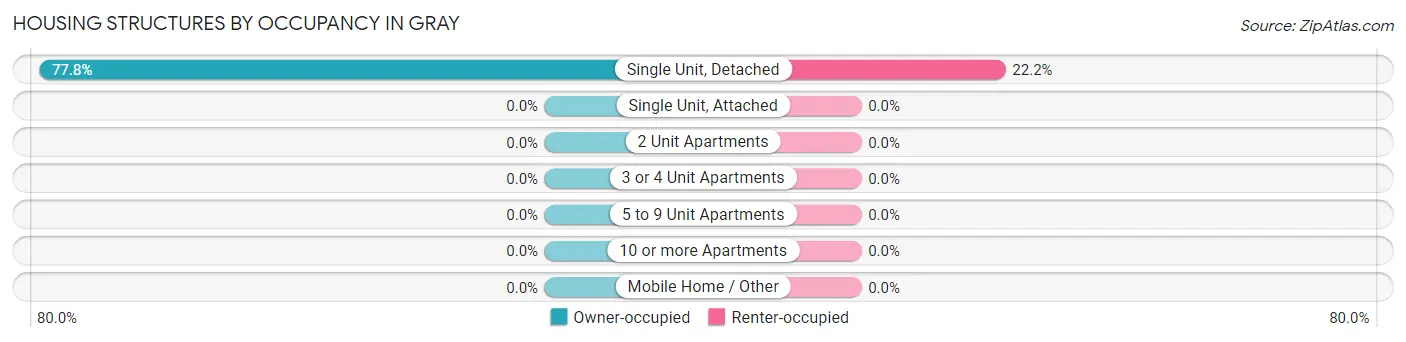
| Structure Type | Owner-occupied | Renter-occupied |
| Single Unit, Detached | 21 (77.8%) | 6 (22.2%) |
| Single Unit, Attached | 0 (0.0%) | 0 (0.0%) |
| 2 Unit Apartments | 0 (0.0%) | 0 (0.0%) |
| 3 or 4 Unit Apartments | 0 (0.0%) | 0 (0.0%) |
| 5 to 9 Unit Apartments | 0 (0.0%) | 0 (0.0%) |
| 10 or more Apartments | 0 (0.0%) | 0 (0.0%) |
| Mobile Home / Other | 0 (0.0%) | 0 (0.0%) |
| Total | 21 (77.8%) | 6 (22.2%) |
Housing Structures by Number of Rooms in Gray
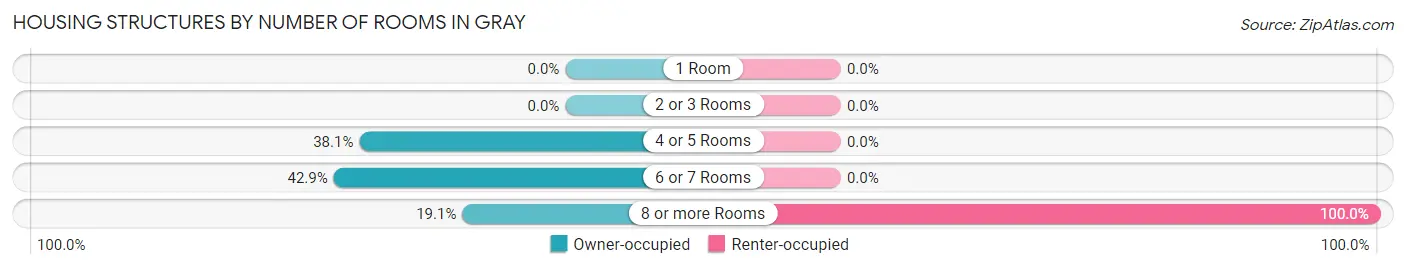
| Number of Rooms | Owner-occupied | Renter-occupied |
| 1 Room | 0 (0.0%) | 0 (0.0%) |
| 2 or 3 Rooms | 0 (0.0%) | 0 (0.0%) |
| 4 or 5 Rooms | 8 (38.1%) | 0 (0.0%) |
| 6 or 7 Rooms | 9 (42.9%) | 0 (0.0%) |
| 8 or more Rooms | 4 (19.1%) | 6 (100.0%) |
| Total | 21 (100.0%) | 6 (100.0%) |
Housing Structure by Heating Type in Gray
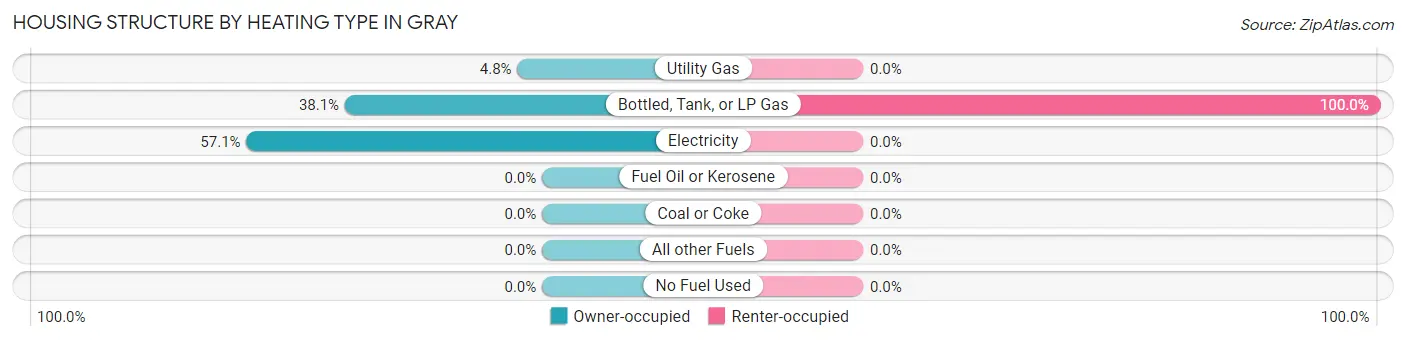
| Heating Type | Owner-occupied | Renter-occupied |
| Utility Gas | 1 (4.8%) | 0 (0.0%) |
| Bottled, Tank, or LP Gas | 8 (38.1%) | 6 (100.0%) |
| Electricity | 12 (57.1%) | 0 (0.0%) |
| Fuel Oil or Kerosene | 0 (0.0%) | 0 (0.0%) |
| Coal or Coke | 0 (0.0%) | 0 (0.0%) |
| All other Fuels | 0 (0.0%) | 0 (0.0%) |
| No Fuel Used | 0 (0.0%) | 0 (0.0%) |
| Total | 21 (100.0%) | 6 (100.0%) |
Household Vehicle Usage in Gray
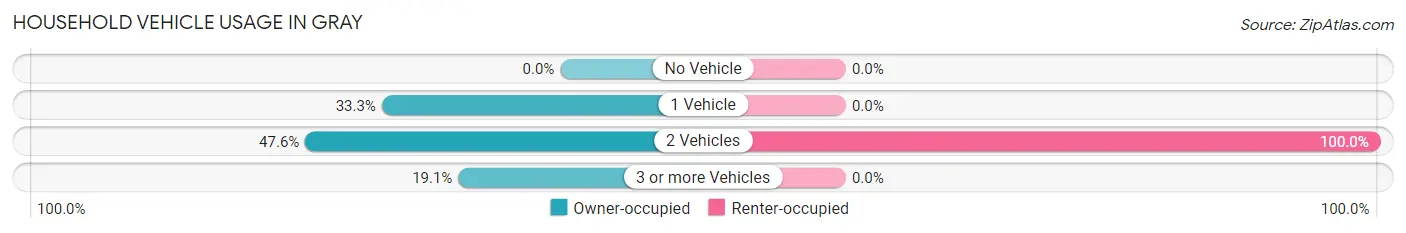
| Vehicles per Household | Owner-occupied | Renter-occupied |
| No Vehicle | 0 (0.0%) | 0 (0.0%) |
| 1 Vehicle | 7 (33.3%) | 0 (0.0%) |
| 2 Vehicles | 10 (47.6%) | 6 (100.0%) |
| 3 or more Vehicles | 4 (19.1%) | 0 (0.0%) |
| Total | 21 (100.0%) | 6 (100.0%) |
Real Estate & Mortgages in Gray
Real Estate and Mortgage Overview in Gray
| Characteristic | Without Mortgage | With Mortgage |
| Housing Units | 16 | 5 |
| Median Property Value | - | - |
| Median Household Income | $62,500 | $0 |
| Monthly Housing Costs | $417 | $0 |
| Real Estate Taxes | $400 | $1 |
Property Value by Mortgage Status in Gray
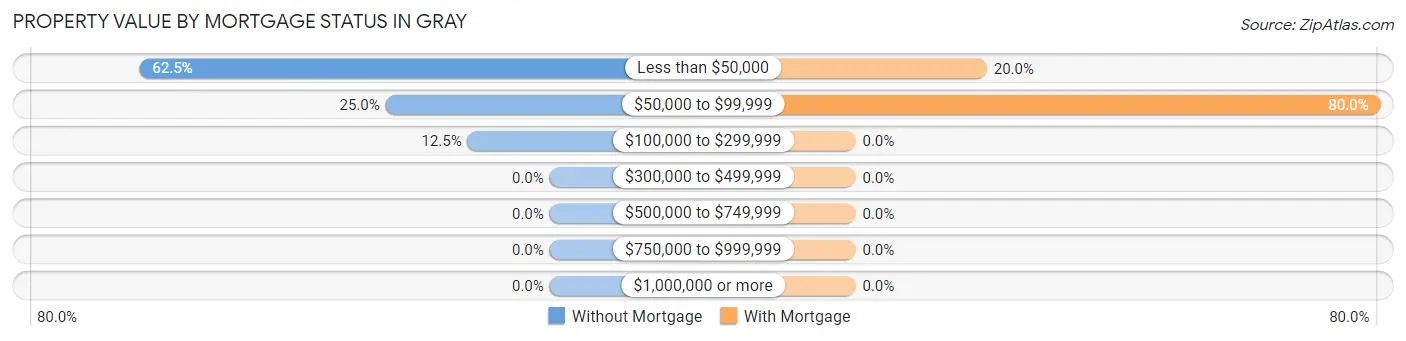
| Property Value | Without Mortgage | With Mortgage |
| Less than $50,000 | 10 (62.5%) | 1 (20.0%) |
| $50,000 to $99,999 | 4 (25.0%) | 4 (80.0%) |
| $100,000 to $299,999 | 2 (12.5%) | 0 (0.0%) |
| $300,000 to $499,999 | 0 (0.0%) | 0 (0.0%) |
| $500,000 to $749,999 | 0 (0.0%) | 0 (0.0%) |
| $750,000 to $999,999 | 0 (0.0%) | 0 (0.0%) |
| $1,000,000 or more | 0 (0.0%) | 0 (0.0%) |
| Total | 16 (100.0%) | 5 (100.0%) |
Household Income by Mortgage Status in Gray
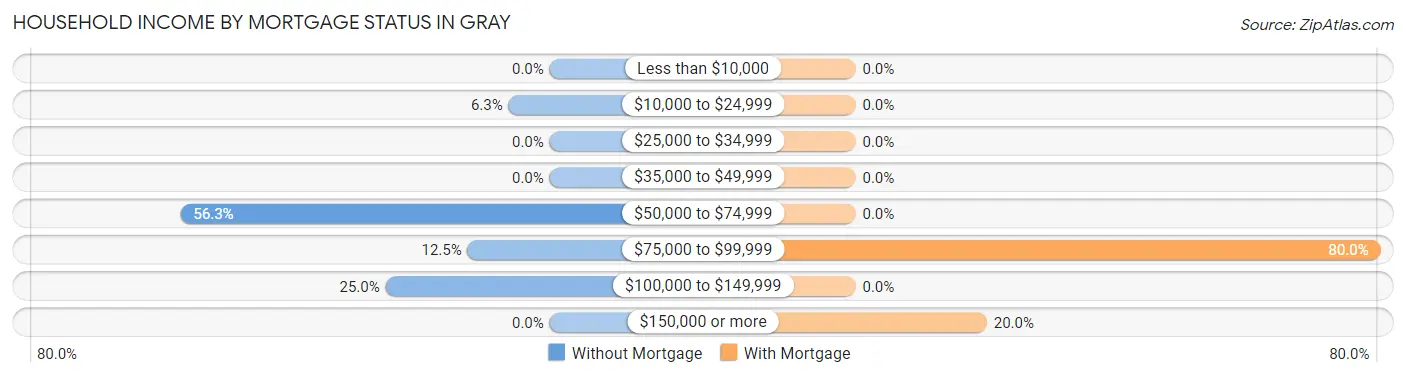
| Household Income | Without Mortgage | With Mortgage |
| Less than $10,000 | 0 (0.0%) | 0 (0.0%) |
| $10,000 to $24,999 | 1 (6.2%) | 0 (0.0%) |
| $25,000 to $34,999 | 0 (0.0%) | 0 (0.0%) |
| $35,000 to $49,999 | 0 (0.0%) | 0 (0.0%) |
| $50,000 to $74,999 | 9 (56.2%) | 0 (0.0%) |
| $75,000 to $99,999 | 2 (12.5%) | 4 (80.0%) |
| $100,000 to $149,999 | 4 (25.0%) | 0 (0.0%) |
| $150,000 or more | 0 (0.0%) | 1 (20.0%) |
| Total | 16 (100.0%) | 5 (100.0%) |
Property Value to Household Income Ratio in Gray
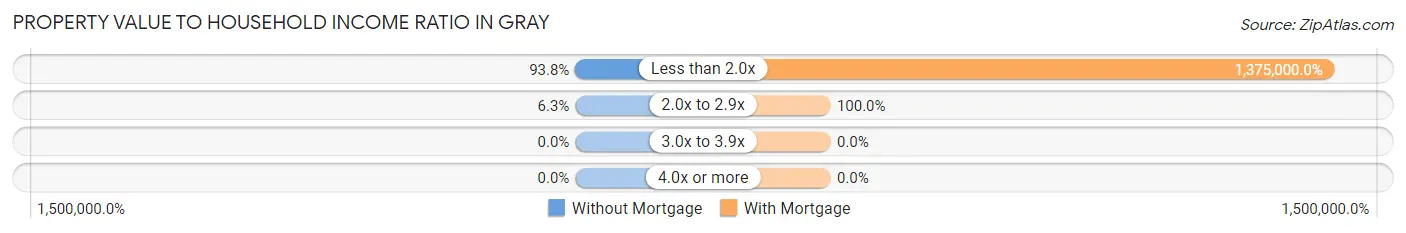
| Value-to-Income Ratio | Without Mortgage | With Mortgage |
| Less than 2.0x | 15 (93.8%) | 68,750 (1,375,000.0%) |
| 2.0x to 2.9x | 1 (6.2%) | 5 (100.0%) |
| 3.0x to 3.9x | 0 (0.0%) | 0 (0.0%) |
| 4.0x or more | 0 (0.0%) | 0 (0.0%) |
| Total | 16 (100.0%) | 5 (100.0%) |
Real Estate Taxes by Mortgage Status in Gray
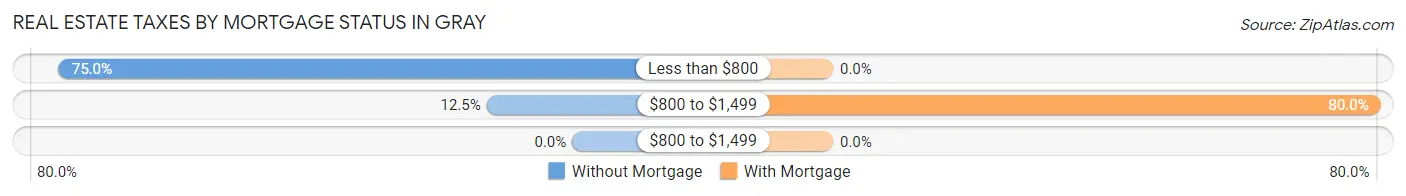
| Property Taxes | Without Mortgage | With Mortgage |
| Less than $800 | 12 (75.0%) | 0 (0.0%) |
| $800 to $1,499 | 2 (12.5%) | 4 (80.0%) |
| $800 to $1,499 | 0 (0.0%) | 0 (0.0%) |
| Total | 16 (100.0%) | 5 (100.0%) |
Health & Disability in Gray
Health Insurance Coverage by Age in Gray
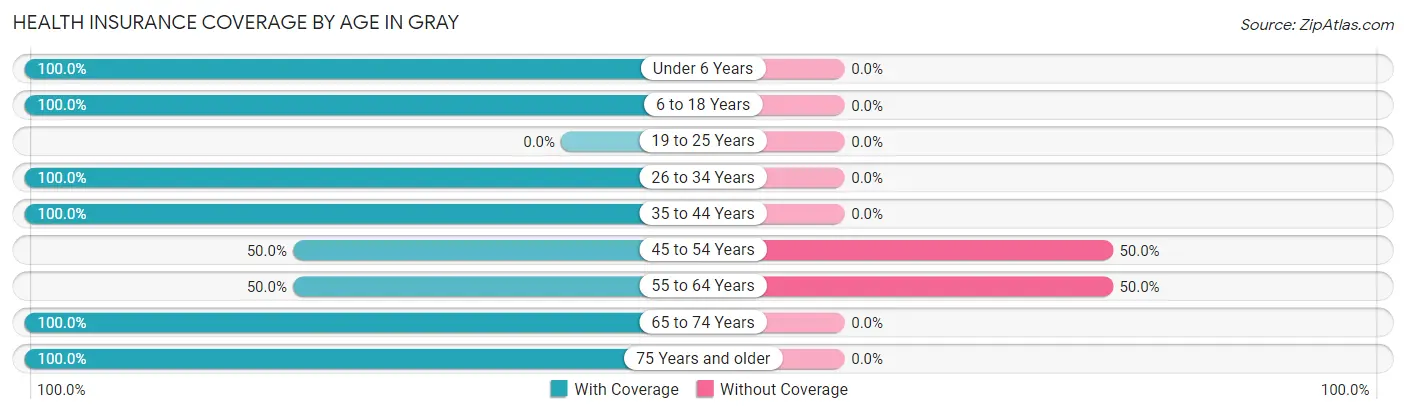
| Age Bracket | With Coverage | Without Coverage |
| Under 6 Years | 12 (100.0%) | 0 (0.0%) |
| 6 to 18 Years | 23 (100.0%) | 0 (0.0%) |
| 19 to 25 Years | 0 (0.0%) | 0 (0.0%) |
| 26 to 34 Years | 2 (100.0%) | 0 (0.0%) |
| 35 to 44 Years | 8 (100.0%) | 0 (0.0%) |
| 45 to 54 Years | 3 (50.0%) | 3 (50.0%) |
| 55 to 64 Years | 3 (50.0%) | 3 (50.0%) |
| 65 to 74 Years | 10 (100.0%) | 0 (0.0%) |
| 75 Years and older | 8 (100.0%) | 0 (0.0%) |
| Total | 69 (92.0%) | 6 (8.0%) |
Health Insurance Coverage by Citizenship Status in Gray
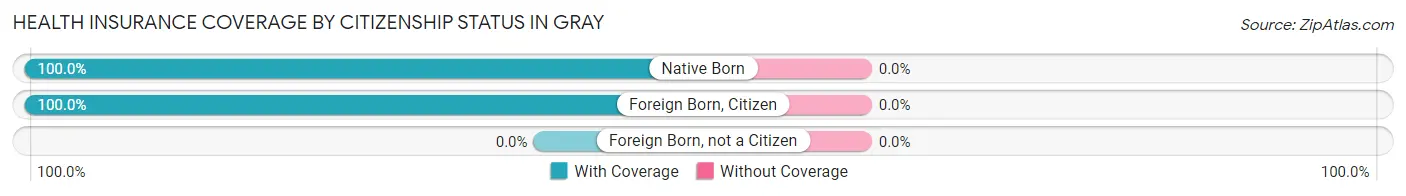
| Citizenship Status | With Coverage | Without Coverage |
| Native Born | 12 (100.0%) | 0 (0.0%) |
| Foreign Born, Citizen | 23 (100.0%) | 0 (0.0%) |
| Foreign Born, not a Citizen | 0 (0.0%) | 0 (0.0%) |
Health Insurance Coverage by Household Income in Gray
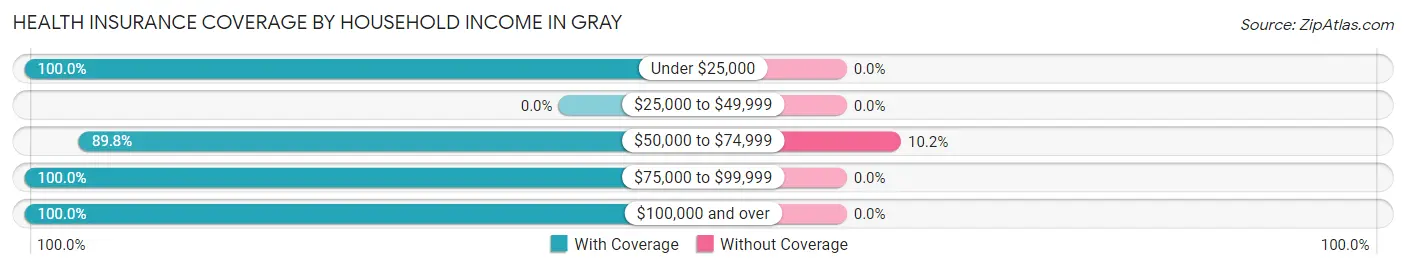
| Household Income | With Coverage | Without Coverage |
| Under $25,000 | 2 (100.0%) | 0 (0.0%) |
| $25,000 to $49,999 | 0 (0.0%) | 0 (0.0%) |
| $50,000 to $74,999 | 53 (89.8%) | 6 (10.2%) |
| $75,000 to $99,999 | 3 (100.0%) | 0 (0.0%) |
| $100,000 and over | 11 (100.0%) | 0 (0.0%) |
Public vs Private Health Insurance Coverage by Age in Gray
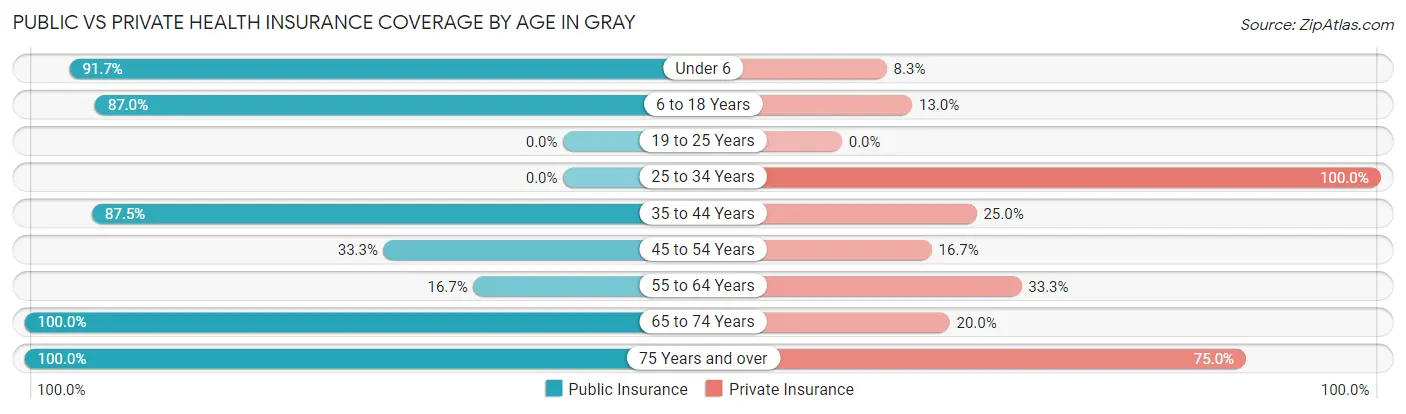
| Age Bracket | Public Insurance | Private Insurance |
| Under 6 | 11 (91.7%) | 1 (8.3%) |
| 6 to 18 Years | 20 (87.0%) | 3 (13.0%) |
| 19 to 25 Years | 0 (0.0%) | 0 (0.0%) |
| 25 to 34 Years | 0 (0.0%) | 2 (100.0%) |
| 35 to 44 Years | 7 (87.5%) | 2 (25.0%) |
| 45 to 54 Years | 2 (33.3%) | 1 (16.7%) |
| 55 to 64 Years | 1 (16.7%) | 2 (33.3%) |
| 65 to 74 Years | 10 (100.0%) | 2 (20.0%) |
| 75 Years and over | 8 (100.0%) | 6 (75.0%) |
| Total | 59 (78.7%) | 19 (25.3%) |
Disability Status by Sex by Age in Gray
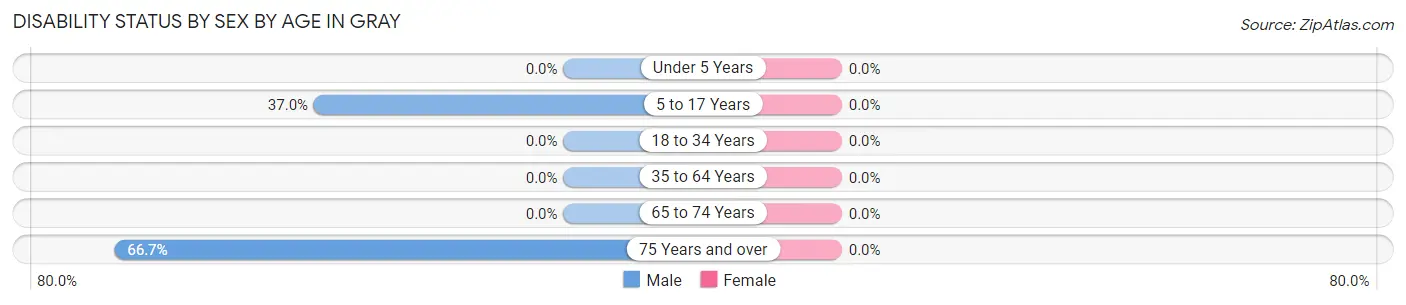
| Age Bracket | Male | Female |
| Under 5 Years | 0 (0.0%) | 0 (0.0%) |
| 5 to 17 Years | 10 (37.0%) | 0 (0.0%) |
| 18 to 34 Years | 0 (0.0%) | 0 (0.0%) |
| 35 to 64 Years | 0 (0.0%) | 0 (0.0%) |
| 65 to 74 Years | 0 (0.0%) | 0 (0.0%) |
| 75 Years and over | 2 (66.7%) | 0 (0.0%) |
Disability Class by Sex by Age in Gray
Disability Class: Hearing Difficulty
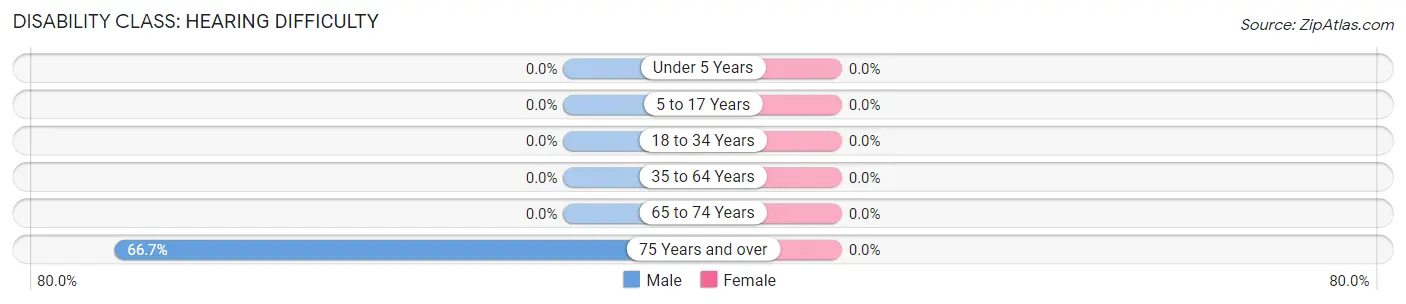
| Age Bracket | Male | Female |
| Under 5 Years | 0 (0.0%) | 0 (0.0%) |
| 5 to 17 Years | 0 (0.0%) | 0 (0.0%) |
| 18 to 34 Years | 0 (0.0%) | 0 (0.0%) |
| 35 to 64 Years | 0 (0.0%) | 0 (0.0%) |
| 65 to 74 Years | 0 (0.0%) | 0 (0.0%) |
| 75 Years and over | 2 (66.7%) | 0 (0.0%) |
Disability Class: Vision Difficulty
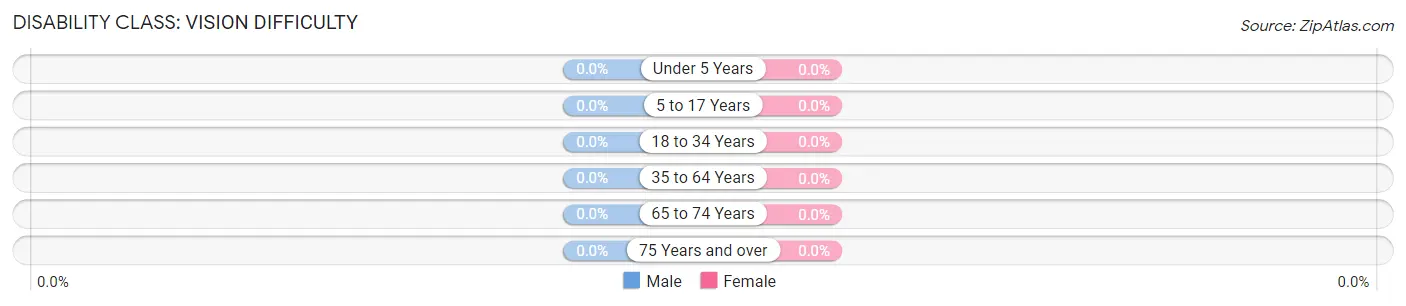
| Age Bracket | Male | Female |
| Under 5 Years | 0 (0.0%) | 0 (0.0%) |
| 5 to 17 Years | 0 (0.0%) | 0 (0.0%) |
| 18 to 34 Years | 0 (0.0%) | 0 (0.0%) |
| 35 to 64 Years | 0 (0.0%) | 0 (0.0%) |
| 65 to 74 Years | 0 (0.0%) | 0 (0.0%) |
| 75 Years and over | 0 (0.0%) | 0 (0.0%) |
Disability Class: Cognitive Difficulty
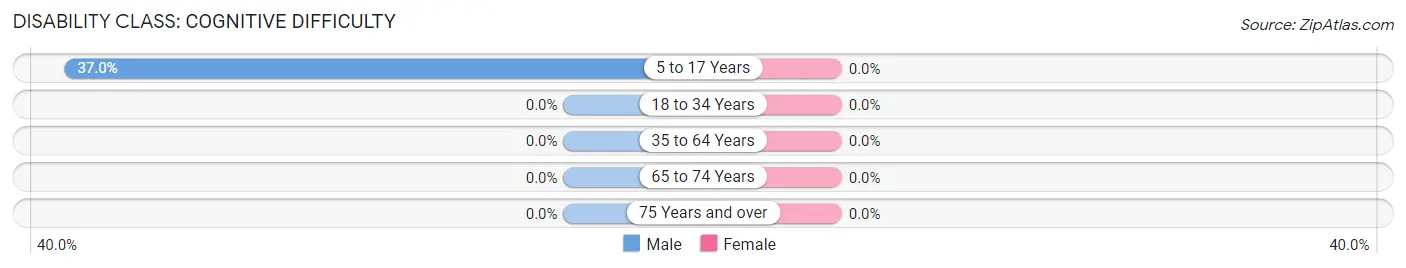
| Age Bracket | Male | Female |
| 5 to 17 Years | 10 (37.0%) | 0 (0.0%) |
| 18 to 34 Years | 0 (0.0%) | 0 (0.0%) |
| 35 to 64 Years | 0 (0.0%) | 0 (0.0%) |
| 65 to 74 Years | 0 (0.0%) | 0 (0.0%) |
| 75 Years and over | 0 (0.0%) | 0 (0.0%) |
Disability Class: Ambulatory Difficulty
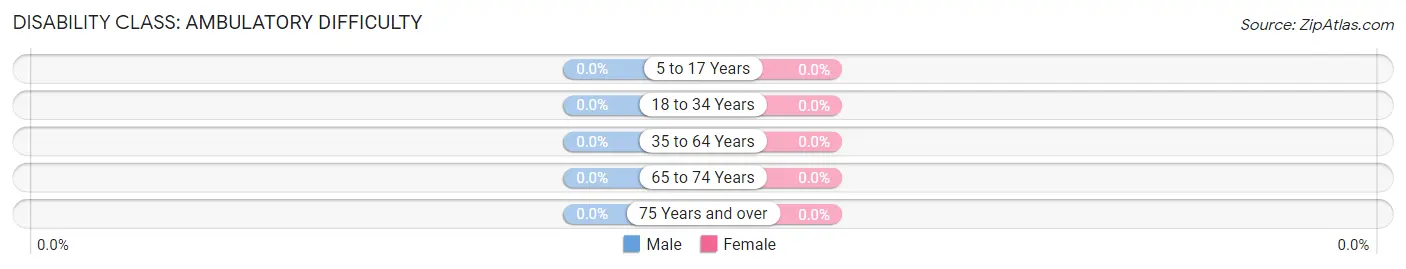
| Age Bracket | Male | Female |
| 5 to 17 Years | 0 (0.0%) | 0 (0.0%) |
| 18 to 34 Years | 0 (0.0%) | 0 (0.0%) |
| 35 to 64 Years | 0 (0.0%) | 0 (0.0%) |
| 65 to 74 Years | 0 (0.0%) | 0 (0.0%) |
| 75 Years and over | 0 (0.0%) | 0 (0.0%) |
Disability Class: Self-Care Difficulty
| Age Bracket | Male | Female |
| 5 to 17 Years | 0 (0.0%) | 0 (0.0%) |
| 18 to 34 Years | 0 (0.0%) | 0 (0.0%) |
| 35 to 64 Years | 0 (0.0%) | 0 (0.0%) |
| 65 to 74 Years | 0 (0.0%) | 0 (0.0%) |
| 75 Years and over | 0 (0.0%) | 0 (0.0%) |
Technology Access in Gray
Computing Device Access in Gray
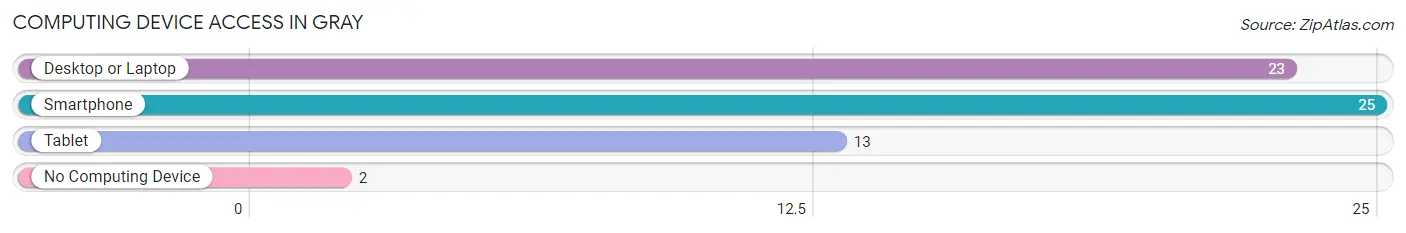
| Device Type | # Households | % Households |
| Desktop or Laptop | 23 | 85.2% |
| Smartphone | 25 | 92.6% |
| Tablet | 13 | 48.1% |
| No Computing Device | 2 | 7.4% |
| Total | 27 | 100.0% |
Internet Access in Gray
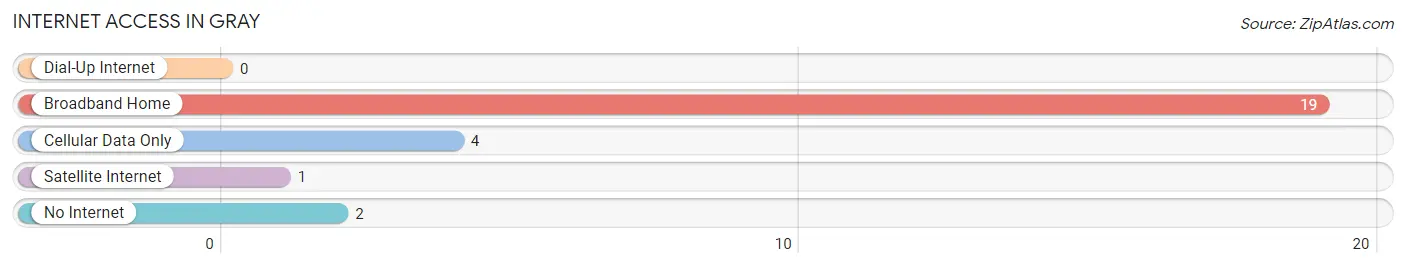
| Internet Type | # Households | % Households |
| Dial-Up Internet | 0 | 0.0% |
| Broadband Home | 19 | 70.4% |
| Cellular Data Only | 4 | 14.8% |
| Satellite Internet | 1 | 3.7% |
| No Internet | 2 | 7.4% |
| Total | 27 | 100.0% |
Gray Summary
Gray, Iowa is a small city located in the state of Iowa in the United States. It is located in the county of Jones and is part of the Cedar Rapids Metropolitan Statistical Area. The population of Gray was 1,845 at the 2010 census.
History
Gray was founded in 1854 by a group of settlers from Ohio. The town was named after the Gray family, who were among the first settlers. The town was originally a farming community, but it soon developed into a small industrial center. The first industry in Gray was a sawmill, which was built in 1856. The sawmill was followed by a grist mill, a woolen mill, and a brickyard.
In 1871, the Chicago, Milwaukee & St. Paul Railroad built a line through Gray, which helped to spur the town's growth. The railroad brought new businesses and industries to the area, and the population of Gray began to grow. By the early 1900s, Gray had become a thriving community with a variety of businesses and industries.
Geography
Gray is located in the eastern part of Jones County, Iowa. It is situated on the banks of the Wapsipinicon River, which flows through the city. The city is located about 25 miles east of Cedar Rapids and about 40 miles west of Iowa City.
The terrain around Gray is mostly flat, with some rolling hills. The city is located in the Loess Hills region of Iowa, which is characterized by its steep, rolling hills and deep ravines. The area is also known for its fertile soil, which is ideal for farming.
Economy
The economy of Gray is largely based on agriculture and manufacturing. The city is home to several large farms, which produce a variety of crops, including corn, soybeans, and hay. The city also has several manufacturing plants, which produce a variety of products, including furniture, plastics, and automotive parts.
In addition to agriculture and manufacturing, Gray also has a thriving retail sector. The city is home to several small businesses, including restaurants, shops, and other services. The city also has a number of tourist attractions, including the Wapsipinicon River, which is popular for fishing and boating.
Demographics
As of the 2010 census, the population of Gray was 1,845. The racial makeup of the city was 97.3% White, 0.7% African American, 0.2% Native American, 0.3% Asian, 0.1% Pacific Islander, 0.4% from other races, and 1.0% from two or more races. Hispanic or Latino of any race were 1.3% of the population.
The median household income in Gray was $45,938, and the median family income was $54,844. The per capita income for the city was $21,945. About 8.3% of families and 10.3% of the population were below the poverty line, including 14.2% of those under age 18 and 6.2% of those age 65 or over.
Common Questions
What is Per Capita Income in Gray?
Per Capita income in Gray is $23,843.
What is the Median Family Income in Gray?
Median Family Income in Gray is $66,667.
What is the Median Household income in Gray?
Median Household Income in Gray is $54,904.
What is Income or Wage Gap in Gray?
Income or Wage Gap in Gray is 25.5%.
Women in Gray earn 74.5 cents for every dollar earned by a man.
What is Inequality or Gini Index in Gray?
Inequality or Gini Index in Gray is 0.21.
What is the Total Population of Gray?
Total Population of Gray is 75.
What is the Total Male Population of Gray?
Total Male Population of Gray is 52.
What is the Total Female Population of Gray?
Total Female Population of Gray is 23.
What is the Ratio of Males per 100 Females in Gray?
There are 226.09 Males per 100 Females in Gray.
What is the Ratio of Females per 100 Males in Gray?
There are 44.23 Females per 100 Males in Gray.
What is the Median Population Age in Gray?
Median Population Age in Gray is 37.5 Years.
What is the Average Family Size in Gray
Average Family Size in Gray is 2.8 People.
What is the Average Household Size in Gray
Average Household Size in Gray is 2.8 People.
How Large is the Labor Force in Gray?
There are 30 People in the Labor Forcein in Gray.
What is the Percentage of People in the Labor Force in Gray?
63.8% of People are in the Labor Force in Gray.