McGregor, IA Map & Demographics
McGregor Map
McGregor Overview
$35,149
PER CAPITA INCOME
$96,964
AVG FAMILY INCOME
$52,639
AVG HOUSEHOLD INCOME
26.1%
WAGE / INCOME GAP [ % ]
73.9¢/ $1
WAGE / INCOME GAP [ $ ]
0.48
INEQUALITY / GINI INDEX
686
TOTAL POPULATION
324
MALE POPULATION
362
FEMALE POPULATION
89.50
MALES / 100 FEMALES
111.73
FEMALES / 100 MALES
53.0
MEDIAN AGE
2.7
AVG FAMILY SIZE
2.0
AVG HOUSEHOLD SIZE
324
LABOR FORCE [ PEOPLE ]
54.6%
PERCENT IN LABOR FORCE
Income in McGregor
Income Overview in McGregor
Per Capita Income in McGregor is $35,149, while median incomes of families and households are $96,964 and $52,639 respectively.
| Characteristic | Number | Measure |
| Per Capita Income | 686 | $35,149 |
| Median Family Income | 183 | $96,964 |
| Mean Family Income | 183 | $90,061 |
| Median Household Income | 322 | $52,639 |
| Mean Household Income | 322 | $74,172 |
| Income Deficit | 183 | $0 |
| Wage / Income Gap (%) | 686 | 26.12% |
| Wage / Income Gap ($) | 686 | 73.88¢ per $1 |
| Gini / Inequality Index | 686 | 0.48 |
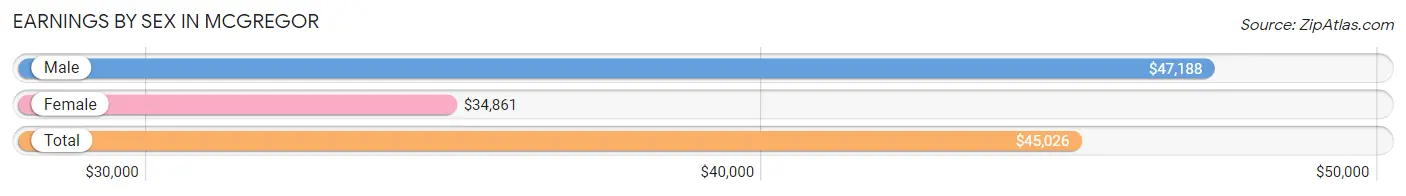
Earnings by Sex in McGregor
Average Earnings in McGregor are $45,026, $47,188 for men and $34,861 for women, a difference of 26.1%.
| Sex | Number | Average Earnings |
| Male | 162 (47.2%) | $47,188 |
| Female | 181 (52.8%) | $34,861 |
| Total | 343 (100.0%) | $45,026 |
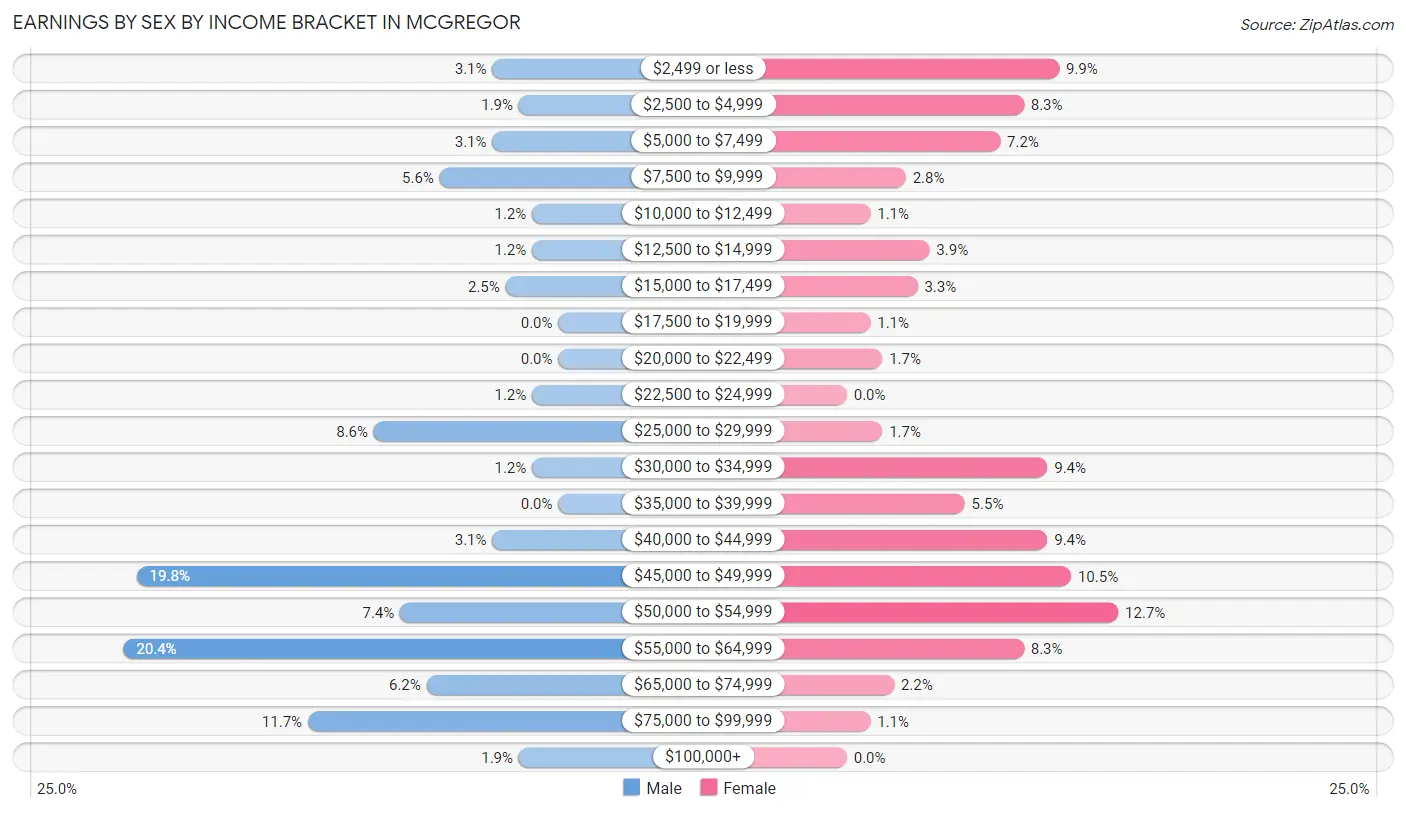
Earnings by Sex by Income Bracket in McGregor
The most common earnings brackets in McGregor are $55,000 to $64,999 for men (33 | 20.4%) and $50,000 to $54,999 for women (23 | 12.7%).
| Income | Male | Female |
| $2,499 or less | 5 (3.1%) | 18 (9.9%) |
| $2,500 to $4,999 | 3 (1.8%) | 15 (8.3%) |
| $5,000 to $7,499 | 5 (3.1%) | 13 (7.2%) |
| $7,500 to $9,999 | 9 (5.6%) | 5 (2.8%) |
| $10,000 to $12,499 | 2 (1.2%) | 2 (1.1%) |
| $12,500 to $14,999 | 2 (1.2%) | 7 (3.9%) |
| $15,000 to $17,499 | 4 (2.5%) | 6 (3.3%) |
| $17,500 to $19,999 | 0 (0.0%) | 2 (1.1%) |
| $20,000 to $22,499 | 0 (0.0%) | 3 (1.7%) |
| $22,500 to $24,999 | 2 (1.2%) | 0 (0.0%) |
| $25,000 to $29,999 | 14 (8.6%) | 3 (1.7%) |
| $30,000 to $34,999 | 2 (1.2%) | 17 (9.4%) |
| $35,000 to $39,999 | 0 (0.0%) | 10 (5.5%) |
| $40,000 to $44,999 | 5 (3.1%) | 17 (9.4%) |
| $45,000 to $49,999 | 32 (19.8%) | 19 (10.5%) |
| $50,000 to $54,999 | 12 (7.4%) | 23 (12.7%) |
| $55,000 to $64,999 | 33 (20.4%) | 15 (8.3%) |
| $65,000 to $74,999 | 10 (6.2%) | 4 (2.2%) |
| $75,000 to $99,999 | 19 (11.7%) | 2 (1.1%) |
| $100,000+ | 3 (1.8%) | 0 (0.0%) |
| Total | 162 (100.0%) | 181 (100.0%) |
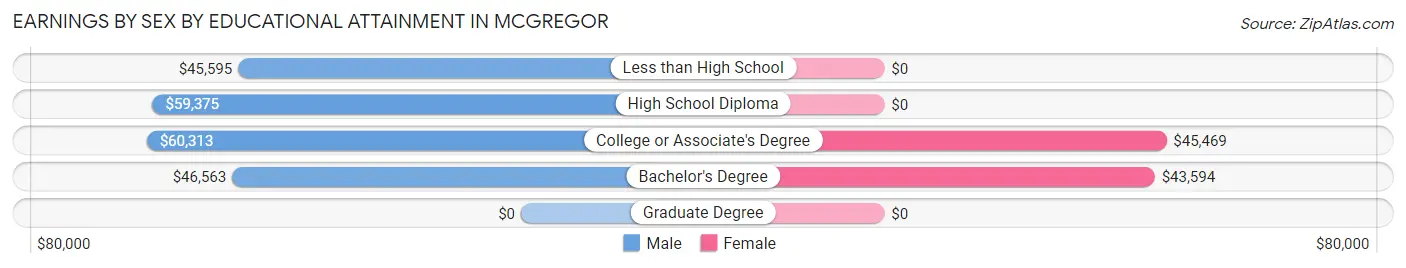
Earnings by Sex by Educational Attainment in McGregor
Average earnings in McGregor are $48,750 for men and $39,625 for women, a difference of 18.7%. Men with an educational attainment of college or associate's degree enjoy the highest average annual earnings of $60,313, while those with less than high school education earn the least with $45,595. Women with an educational attainment of college or associate's degree earn the most with the average annual earnings of $45,469, while those with bachelor's degree education have the smallest earnings of $43,594.
| Educational Attainment | Male Income | Female Income |
| Less than High School | $45,595 | $0 |
| High School Diploma | $59,375 | $0 |
| College or Associate's Degree | $60,313 | $45,469 |
| Bachelor's Degree | $46,563 | $43,594 |
| Graduate Degree | - | - |
| Total | $48,750 | $39,625 |
Family Income in McGregor
Family Income Brackets in McGregor
According to the McGregor family income data, there are 82 families falling into the $100,000 to $149,999 income range, which is the most common income bracket and makes up 44.8% of all families.
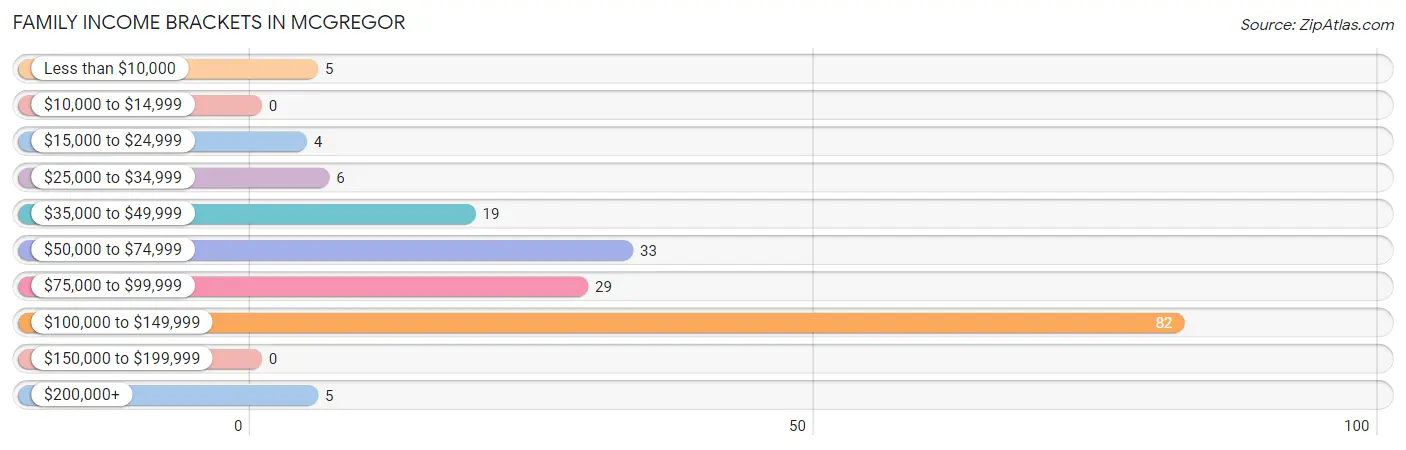
| Income Bracket | # Families | % Families |
| Less than $10,000 | 5 | 2.7% |
| $10,000 to $14,999 | 0 | 0.0% |
| $15,000 to $24,999 | 4 | 2.2% |
| $25,000 to $34,999 | 6 | 3.3% |
| $35,000 to $49,999 | 19 | 10.4% |
| $50,000 to $74,999 | 33 | 18.0% |
| $75,000 to $99,999 | 29 | 15.8% |
| $100,000 to $149,999 | 82 | 44.8% |
| $150,000 to $199,999 | 0 | 0.0% |
| $200,000+ | 5 | 2.7% |
Family Income by Famaliy Size in McGregor
4-person families (27 | 14.7%) account for the highest median family income in McGregor with $116,771 per family, while 2-person families (107 | 58.5%) have the highest median income of $37,422 per family member.
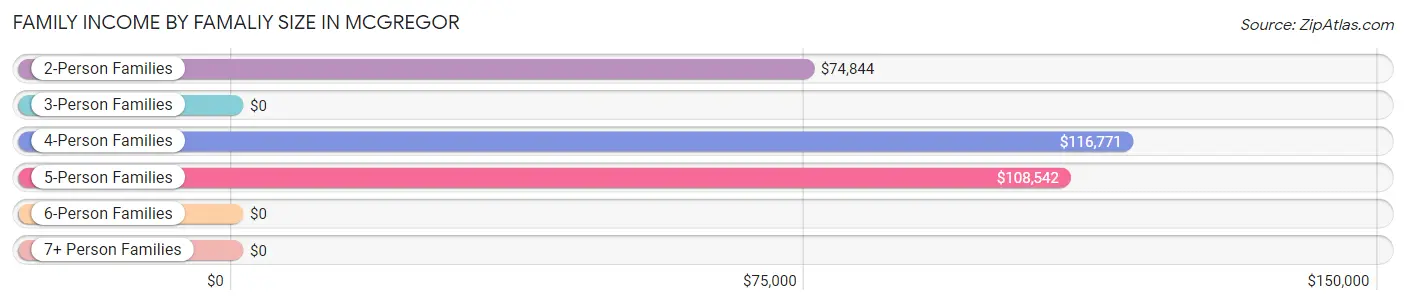
| Income Bracket | # Families | Median Income |
| 2-Person Families | 107 (58.5%) | $74,844 |
| 3-Person Families | 23 (12.6%) | $0 |
| 4-Person Families | 27 (14.7%) | $116,771 |
| 5-Person Families | 21 (11.5%) | $108,542 |
| 6-Person Families | 5 (2.7%) | $0 |
| 7+ Person Families | 0 (0.0%) | $0 |
| Total | 183 (100.0%) | $96,964 |
Family Income by Number of Earners in McGregor
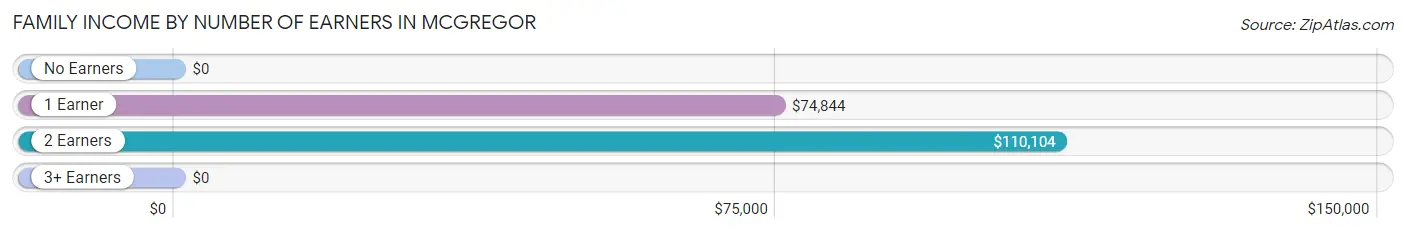
| Number of Earners | # Families | Median Income |
| No Earners | 38 (20.8%) | $0 |
| 1 Earner | 41 (22.4%) | $74,844 |
| 2 Earners | 91 (49.7%) | $110,104 |
| 3+ Earners | 13 (7.1%) | $0 |
| Total | 183 (100.0%) | $96,964 |
Household Income in McGregor
Household Income Brackets in McGregor
With 87 households falling in the category, the $100,000 to $149,999 income range is the most frequent in McGregor, accounting for 27.0% of all households.
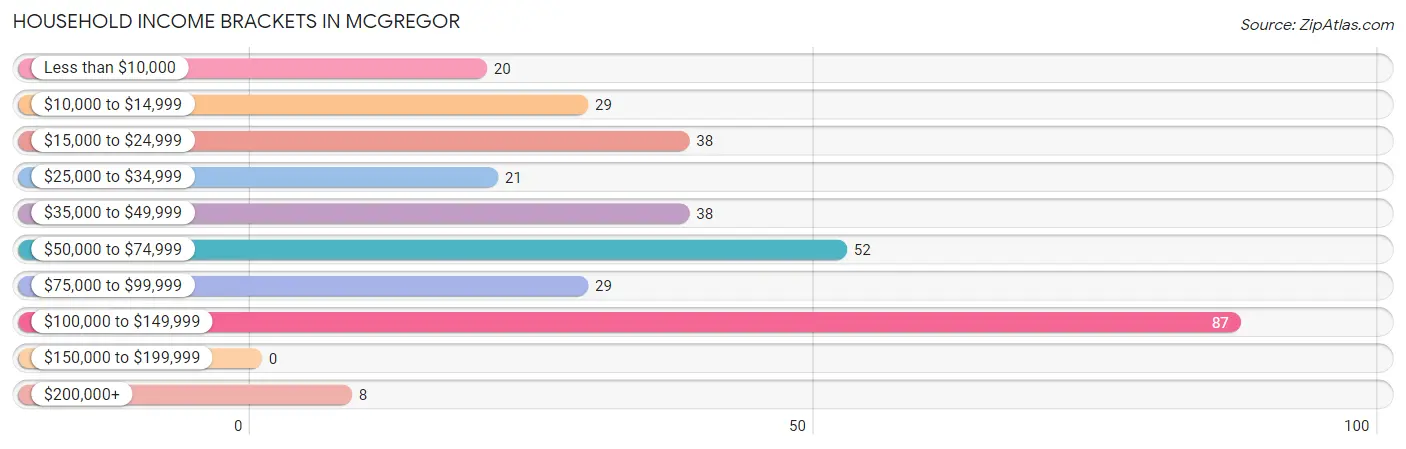
| Income Bracket | # Households | % Households |
| Less than $10,000 | 20 | 6.2% |
| $10,000 to $14,999 | 29 | 9.0% |
| $15,000 to $24,999 | 38 | 11.8% |
| $25,000 to $34,999 | 21 | 6.5% |
| $35,000 to $49,999 | 38 | 11.8% |
| $50,000 to $74,999 | 52 | 16.1% |
| $75,000 to $99,999 | 29 | 9.0% |
| $100,000 to $149,999 | 87 | 27.0% |
| $150,000 to $199,999 | 0 | 0.0% |
| $200,000+ | 8 | 2.5% |
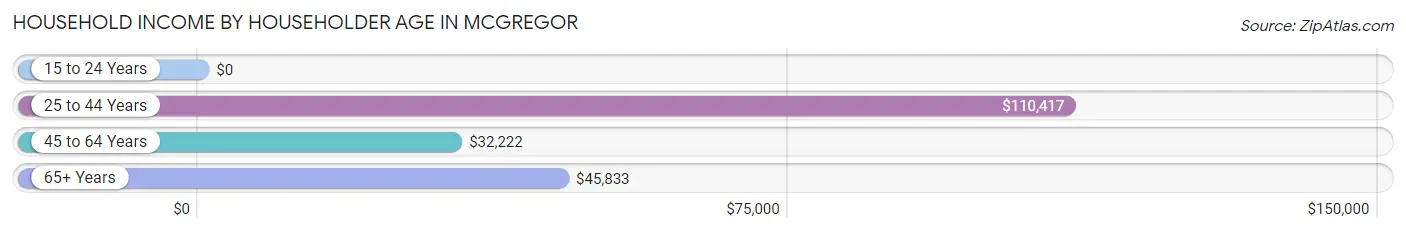
Household Income by Householder Age in McGregor
The median household income in McGregor is $52,639, with the highest median household income of $110,417 found in the 25 to 44 years age bracket for the primary householder. A total of 90 households (28.0%) fall into this category.
| Income Bracket | # Households | Median Income |
| 15 to 24 Years | 0 (0.0%) | $0 |
| 25 to 44 Years | 90 (28.0%) | $110,417 |
| 45 to 64 Years | 114 (35.4%) | $32,222 |
| 65+ Years | 118 (36.6%) | $45,833 |
| Total | 322 (100.0%) | $52,639 |
Poverty in McGregor
Income Below Poverty by Sex and Age in McGregor
With 6.0% poverty level for males and 16.1% for females among the residents of McGregor, 55 to 64 year old males and 45 to 54 year old females are the most vulnerable to poverty, with 11 males (16.4%) and 25 females (49.0%) in their respective age groups living below the poverty level.
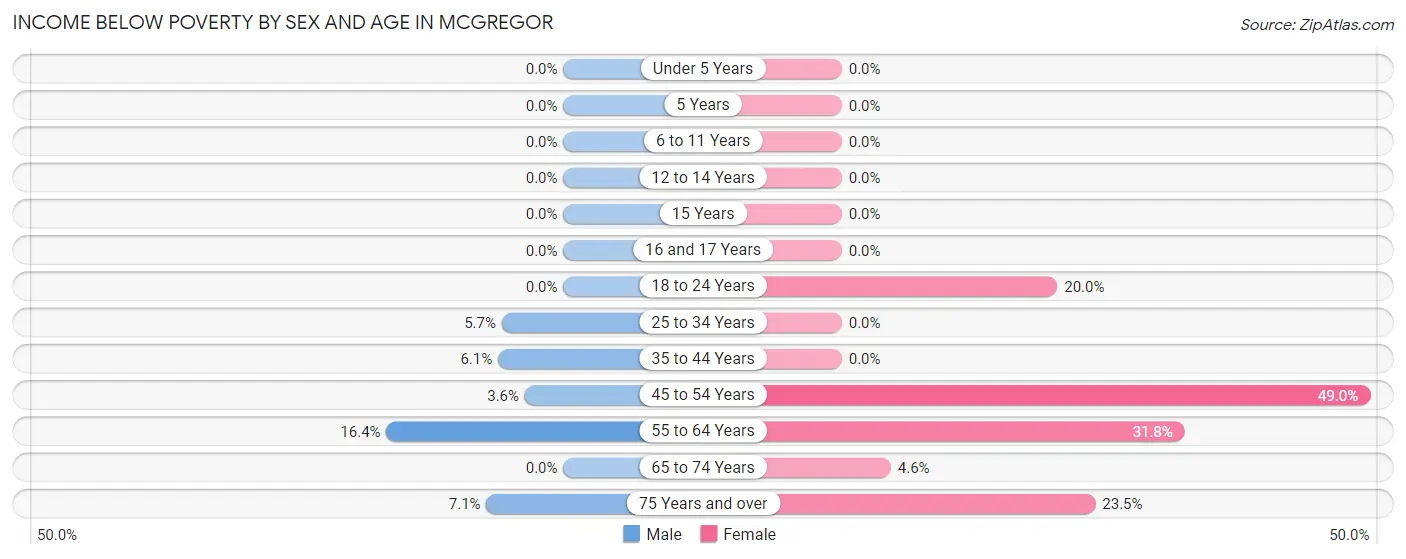
| Age Bracket | Male | Female |
| Under 5 Years | 0 (0.0%) | 0 (0.0%) |
| 5 Years | 0 (0.0%) | 0 (0.0%) |
| 6 to 11 Years | 0 (0.0%) | 0 (0.0%) |
| 12 to 14 Years | 0 (0.0%) | 0 (0.0%) |
| 15 Years | 0 (0.0%) | 0 (0.0%) |
| 16 and 17 Years | 0 (0.0%) | 0 (0.0%) |
| 18 to 24 Years | 0 (0.0%) | 3 (20.0%) |
| 25 to 34 Years | 2 (5.7%) | 0 (0.0%) |
| 35 to 44 Years | 2 (6.1%) | 0 (0.0%) |
| 45 to 54 Years | 1 (3.6%) | 25 (49.0%) |
| 55 to 64 Years | 11 (16.4%) | 14 (31.8%) |
| 65 to 74 Years | 0 (0.0%) | 2 (4.5%) |
| 75 Years and over | 2 (7.1%) | 12 (23.5%) |
| Total | 18 (6.0%) | 56 (16.1%) |
Income Above Poverty by Sex and Age in McGregor
According to the poverty statistics in McGregor, males aged 5 years and females aged under 5 years are the age groups that are most secure financially, with 100.0% of males and 100.0% of females in these age groups living above the poverty line.
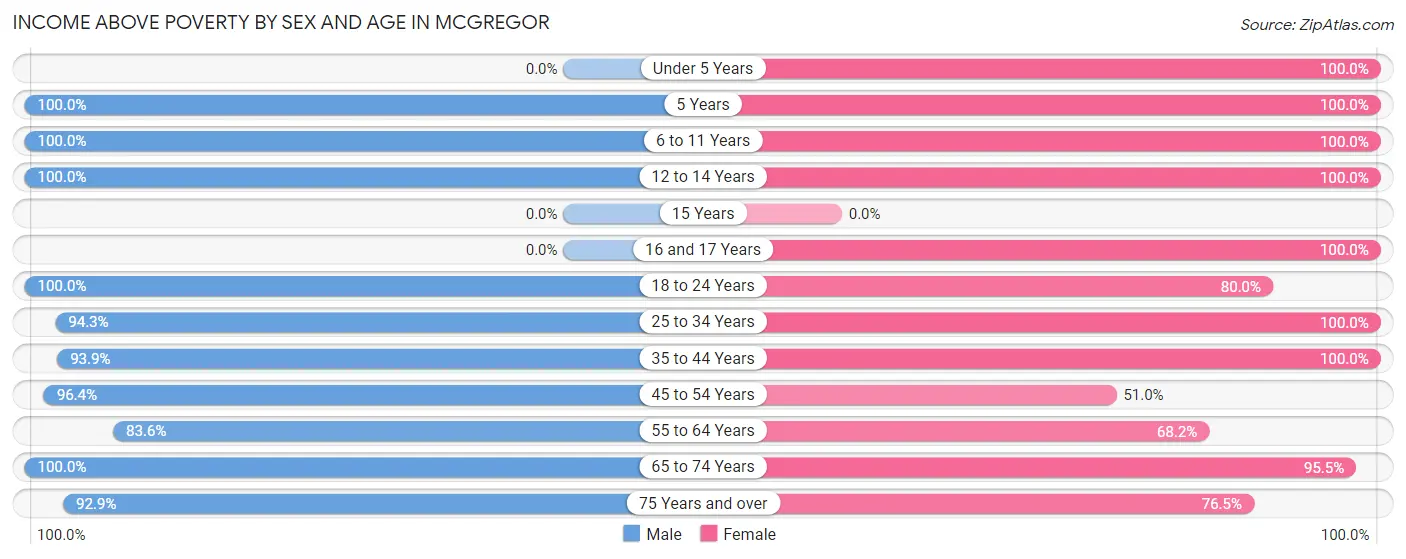
| Age Bracket | Male | Female |
| Under 5 Years | 0 (0.0%) | 4 (100.0%) |
| 5 Years | 18 (100.0%) | 3 (100.0%) |
| 6 to 11 Years | 24 (100.0%) | 27 (100.0%) |
| 12 to 14 Years | 5 (100.0%) | 12 (100.0%) |
| 15 Years | 0 (0.0%) | 0 (0.0%) |
| 16 and 17 Years | 0 (0.0%) | 13 (100.0%) |
| 18 to 24 Years | 11 (100.0%) | 12 (80.0%) |
| 25 to 34 Years | 33 (94.3%) | 23 (100.0%) |
| 35 to 44 Years | 31 (93.9%) | 61 (100.0%) |
| 45 to 54 Years | 27 (96.4%) | 26 (51.0%) |
| 55 to 64 Years | 56 (83.6%) | 30 (68.2%) |
| 65 to 74 Years | 53 (100.0%) | 42 (95.5%) |
| 75 Years and over | 26 (92.9%) | 39 (76.5%) |
| Total | 284 (94.0%) | 292 (83.9%) |
Income Below Poverty Among Married-Couple Families in McGregor
The poverty statistics for married-couple families in McGregor show that 4.0% or 7 of the total 175 families live below the poverty line. Families with no children have the highest poverty rate of 6.2%, comprising of 7 families. On the other hand, families with 1 or 2 children have the lowest poverty rate of 0.0%, which includes 0 families.
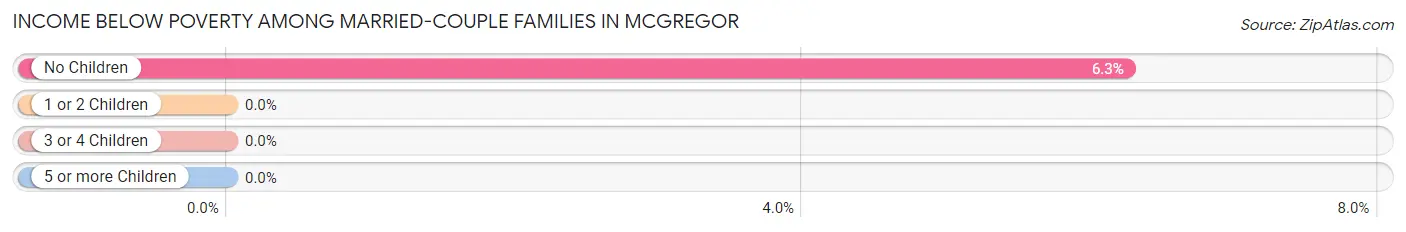
| Children | Above Poverty | Below Poverty |
| No Children | 105 (93.8%) | 7 (6.2%) |
| 1 or 2 Children | 52 (100.0%) | 0 (0.0%) |
| 3 or 4 Children | 11 (100.0%) | 0 (0.0%) |
| 5 or more Children | 0 (0.0%) | 0 (0.0%) |
| Total | 168 (96.0%) | 7 (4.0%) |
Income Below Poverty Among Single-Parent Households in McGregor
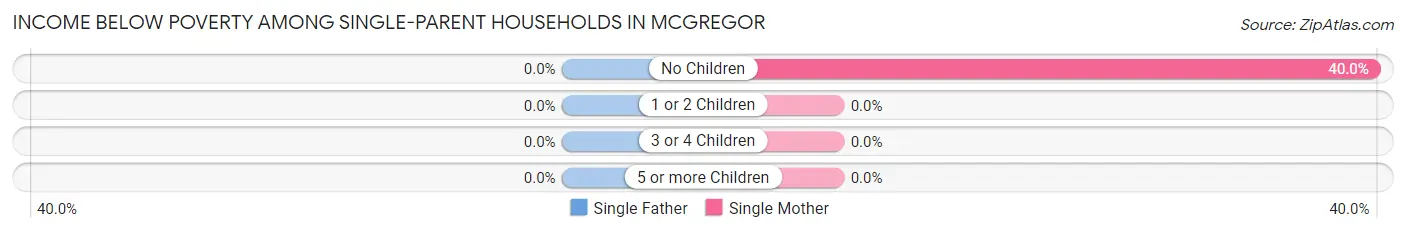
| Children | Single Father | Single Mother |
| No Children | 0 (0.0%) | 2 (40.0%) |
| 1 or 2 Children | 0 (0.0%) | 0 (0.0%) |
| 3 or 4 Children | 0 (0.0%) | 0 (0.0%) |
| 5 or more Children | 0 (0.0%) | 0 (0.0%) |
| Total | 0 (0.0%) | 2 (40.0%) |
Income Below Poverty Among Married-Couple vs Single-Parent Households in McGregor
The poverty data for McGregor shows that 7 of the married-couple family households (4.0%) and 2 of the single-parent households (25.0%) are living below the poverty level. Within the married-couple family households, those with no children have the highest poverty rate, with 7 households (6.2%) falling below the poverty line. Among the single-parent households, those with no children have the highest poverty rate, with 2 household (40.0%) living below poverty.
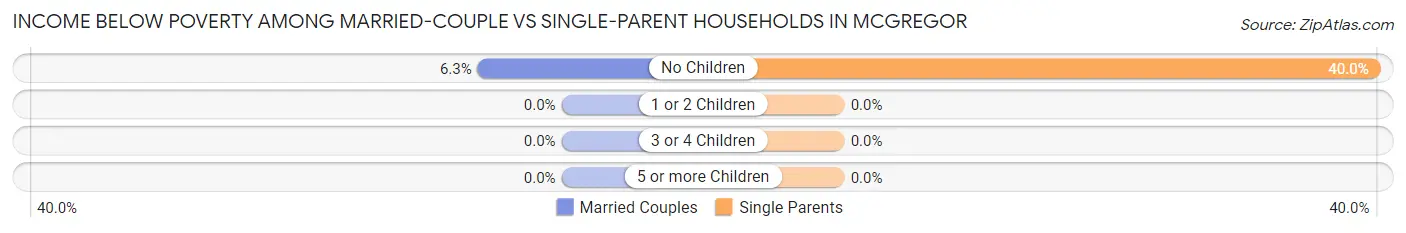
| Children | Married-Couple Families | Single-Parent Households |
| No Children | 7 (6.2%) | 2 (40.0%) |
| 1 or 2 Children | 0 (0.0%) | 0 (0.0%) |
| 3 or 4 Children | 0 (0.0%) | 0 (0.0%) |
| 5 or more Children | 0 (0.0%) | 0 (0.0%) |
| Total | 7 (4.0%) | 2 (25.0%) |
Race in McGregor
The most populous races in McGregor are White / Caucasian (668 | 97.4%), Two or more Races (10 | 1.5%), and Hispanic or Latino (5 | 0.7%).
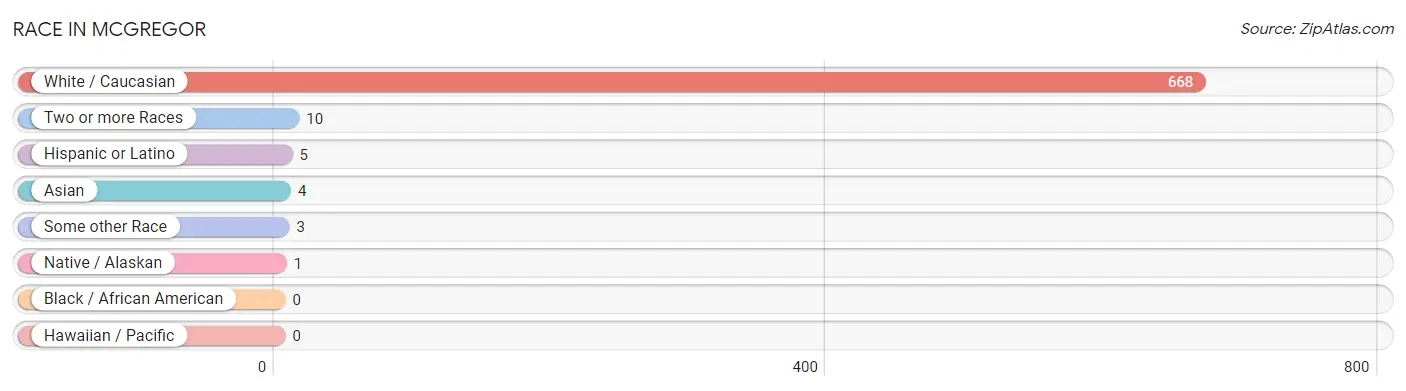
| Race | # Population | % Population |
| Asian | 4 | 0.6% |
| Black / African American | 0 | 0.0% |
| Hawaiian / Pacific | 0 | 0.0% |
| Hispanic or Latino | 5 | 0.7% |
| Native / Alaskan | 1 | 0.2% |
| White / Caucasian | 668 | 97.4% |
| Two or more Races | 10 | 1.5% |
| Some other Race | 3 | 0.4% |
| Total | 686 | 100.0% |
Ancestry in McGregor
The most populous ancestries reported in McGregor are German (271 | 39.5%), Norwegian (86 | 12.5%), English (75 | 10.9%), Irish (74 | 10.8%), and Polish (28 | 4.1%), together accounting for 77.8% of all McGregor residents.
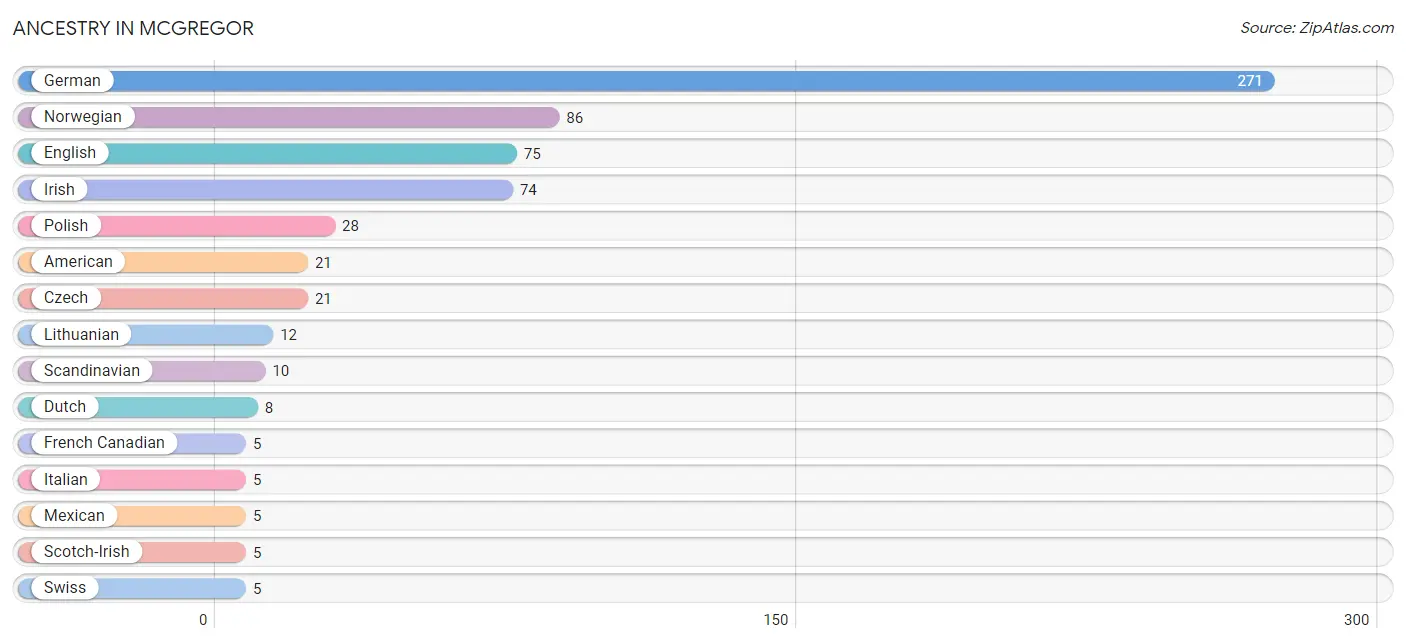
| Ancestry | # Population | % Population |
| American | 21 | 3.1% |
| Belgian | 3 | 0.4% |
| Chippewa | 1 | 0.2% |
| Czech | 21 | 3.1% |
| Dutch | 8 | 1.2% |
| Eastern European | 2 | 0.3% |
| English | 75 | 10.9% |
| French | 4 | 0.6% |
| French Canadian | 5 | 0.7% |
| German | 271 | 39.5% |
| Greek | 3 | 0.4% |
| Indonesian | 4 | 0.6% |
| Irish | 74 | 10.8% |
| Italian | 5 | 0.7% |
| Lithuanian | 12 | 1.8% |
| Mexican | 5 | 0.7% |
| Northern European | 2 | 0.3% |
| Norwegian | 86 | 12.5% |
| Polish | 28 | 4.1% |
| Portuguese | 2 | 0.3% |
| Scandinavian | 10 | 1.5% |
| Scotch-Irish | 5 | 0.7% |
| Scottish | 3 | 0.4% |
| Swedish | 4 | 0.6% |
| Swiss | 5 | 0.7% | View All 25 Rows |
Immigrants in McGregor
The most numerous immigrant groups reported in McGregor came from Asia (4 | 0.6%), South Eastern Asia (4 | 0.6%), Africa (3 | 0.4%), Central America (3 | 0.4%), and Latin America (3 | 0.4%), together accounting for 2.5% of all McGregor residents.
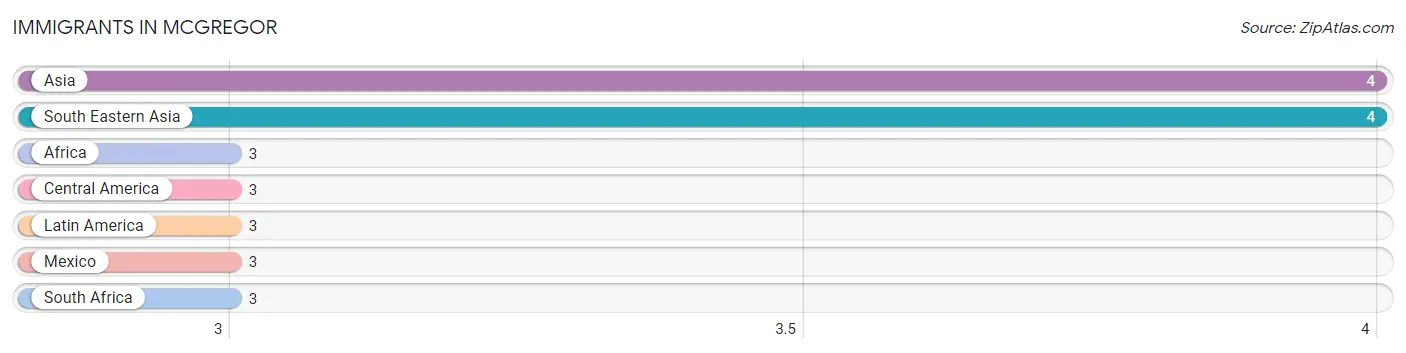
| Immigration Origin | # Population | % Population |
| Africa | 3 | 0.4% |
| Asia | 4 | 0.6% |
| Central America | 3 | 0.4% |
| Latin America | 3 | 0.4% |
| Mexico | 3 | 0.4% |
| South Africa | 3 | 0.4% |
| South Eastern Asia | 4 | 0.6% | View All 7 Rows |
Sex and Age in McGregor
Sex and Age in McGregor
The most populous age groups in McGregor are 55 to 59 Years (43 | 13.3%) for men and 40 to 44 Years (40 | 11.1%) for women.
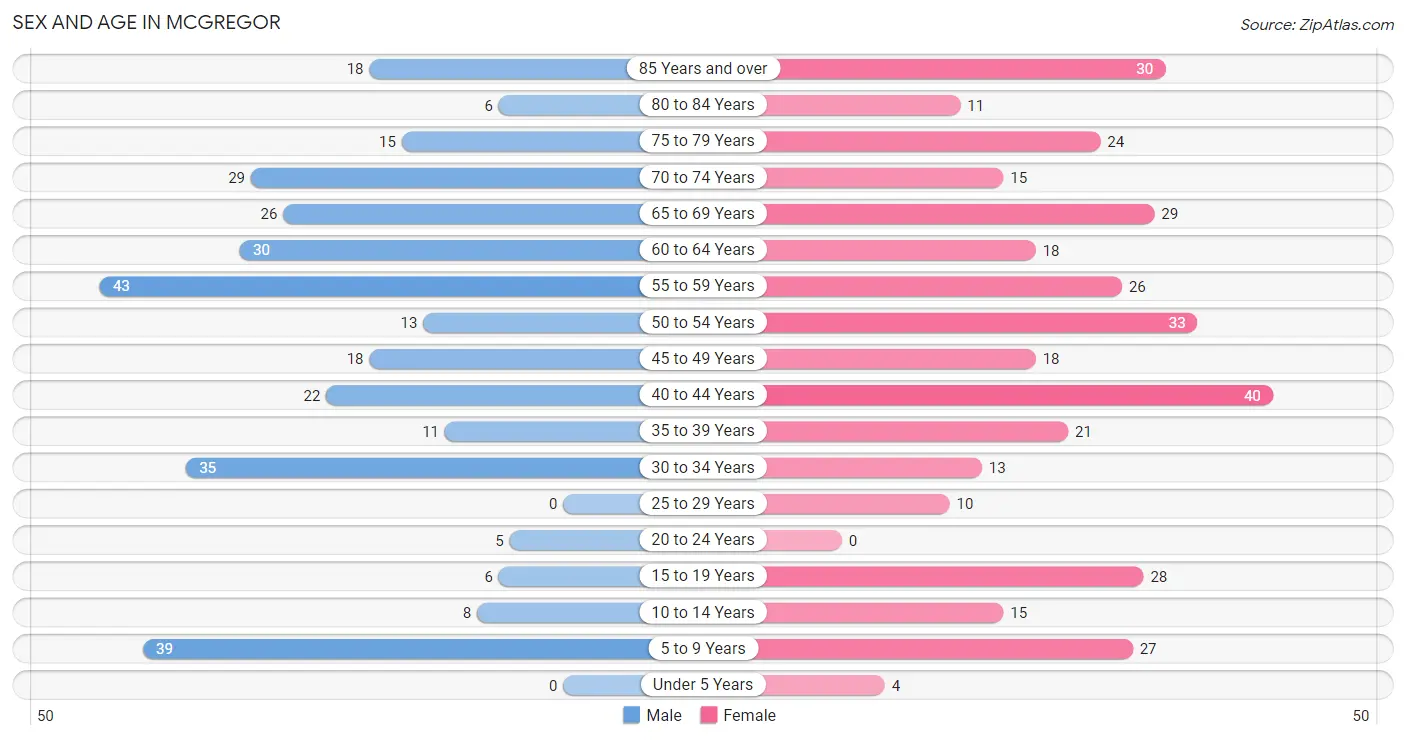
| Age Bracket | Male | Female |
| Under 5 Years | 0 (0.0%) | 4 (1.1%) |
| 5 to 9 Years | 39 (12.0%) | 27 (7.5%) |
| 10 to 14 Years | 8 (2.5%) | 15 (4.1%) |
| 15 to 19 Years | 6 (1.8%) | 28 (7.7%) |
| 20 to 24 Years | 5 (1.5%) | 0 (0.0%) |
| 25 to 29 Years | 0 (0.0%) | 10 (2.8%) |
| 30 to 34 Years | 35 (10.8%) | 13 (3.6%) |
| 35 to 39 Years | 11 (3.4%) | 21 (5.8%) |
| 40 to 44 Years | 22 (6.8%) | 40 (11.1%) |
| 45 to 49 Years | 18 (5.6%) | 18 (5.0%) |
| 50 to 54 Years | 13 (4.0%) | 33 (9.1%) |
| 55 to 59 Years | 43 (13.3%) | 26 (7.2%) |
| 60 to 64 Years | 30 (9.3%) | 18 (5.0%) |
| 65 to 69 Years | 26 (8.0%) | 29 (8.0%) |
| 70 to 74 Years | 29 (8.9%) | 15 (4.1%) |
| 75 to 79 Years | 15 (4.6%) | 24 (6.6%) |
| 80 to 84 Years | 6 (1.8%) | 11 (3.0%) |
| 85 Years and over | 18 (5.6%) | 30 (8.3%) |
| Total | 324 (100.0%) | 362 (100.0%) |
Families and Households in McGregor
Median Family Size in McGregor
The median family size in McGregor is 2.70 persons per family, with single female/mother families (5 | 2.7%) accounting for the largest median family size of 2.8 persons per family. On the other hand, single male/father families (3 | 1.6%) represent the smallest median family size with 2.00 persons per family.
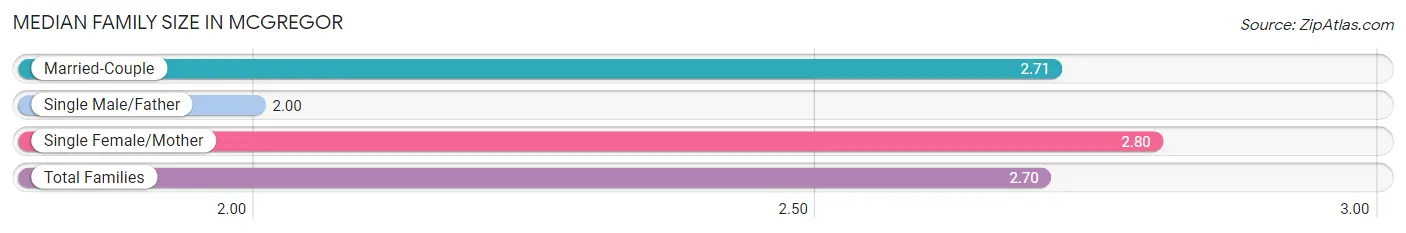
| Family Type | # Families | Family Size |
| Married-Couple | 175 (95.6%) | 2.71 |
| Single Male/Father | 3 (1.6%) | 2.00 |
| Single Female/Mother | 5 (2.7%) | 2.80 |
| Total Families | 183 (100.0%) | 2.70 |
Median Household Size in McGregor
The median household size in McGregor is 2.02 persons per household, with single female/mother households (5 | 1.5%) accounting for the largest median household size of 2.8 persons per household. non-family households (139 | 43.2%) represent the smallest median household size with 1.12 persons per household.
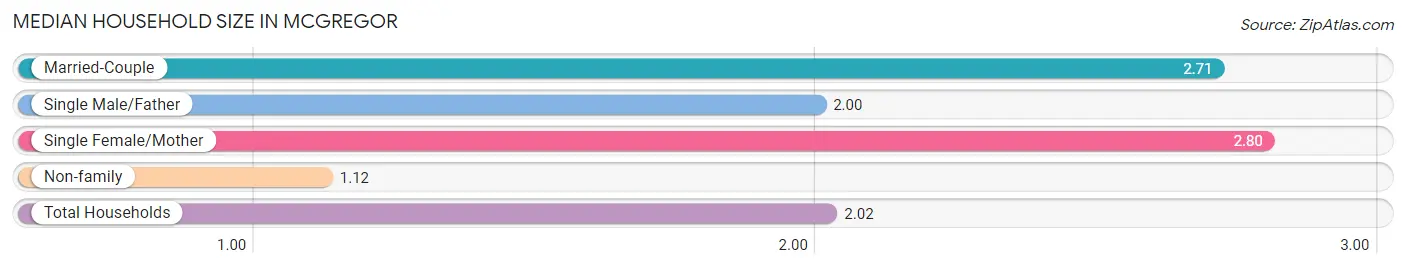
| Household Type | # Households | Household Size |
| Married-Couple | 175 (54.3%) | 2.71 |
| Single Male/Father | 3 (0.9%) | 2.00 |
| Single Female/Mother | 5 (1.5%) | 2.80 |
| Non-family | 139 (43.2%) | 1.12 |
| Total Households | 322 (100.0%) | 2.02 |
Household Size by Marriage Status in McGregor
Out of a total of 322 households in McGregor, 183 (56.8%) are family households, while 139 (43.2%) are nonfamily households. The most numerous type of family households are 2-person households, comprising 107, and the most common type of nonfamily households are 1-person households, comprising 126.
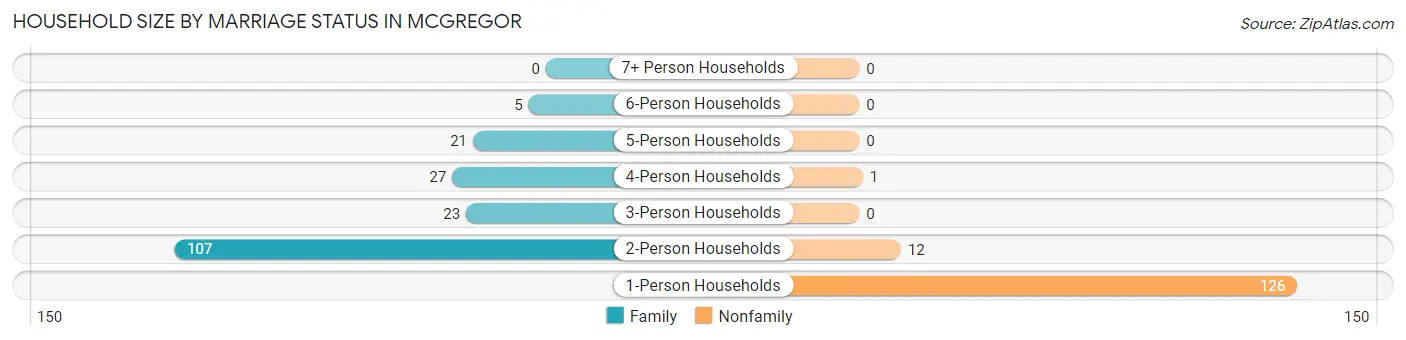
| Household Size | Family Households | Nonfamily Households |
| 1-Person Households | - | 126 (39.1%) |
| 2-Person Households | 107 (33.2%) | 12 (3.7%) |
| 3-Person Households | 23 (7.1%) | 0 (0.0%) |
| 4-Person Households | 27 (8.4%) | 1 (0.3%) |
| 5-Person Households | 21 (6.5%) | 0 (0.0%) |
| 6-Person Households | 5 (1.5%) | 0 (0.0%) |
| 7+ Person Households | 0 (0.0%) | 0 (0.0%) |
| Total | 183 (56.8%) | 139 (43.2%) |
Female Fertility in McGregor
Fertility by Age in McGregor
| Age Bracket | Women with Births | Births / 1,000 Women |
| 15 to 19 years | 0 (0.0%) | 0.0 |
| 20 to 34 years | 0 (0.0%) | 0.0 |
| 35 to 50 years | 0 (0.0%) | 0.0 |
| Total | 0 (0.0%) | 0.0 |
Fertility by Age by Marriage Status in McGregor
| Age Bracket | Married | Unmarried |
| 15 to 19 years | 0 (0.0%) | 0 (0.0%) |
| 20 to 34 years | 0 (0.0%) | 0 (0.0%) |
| 35 to 50 years | 0 (0.0%) | 0 (0.0%) |
| Total | 0 (0.0%) | 0 (0.0%) |
Fertility by Education in McGregor
| Educational Attainment | Women with Births | Births / 1,000 Women |
| Less than High School | 0 (0.0%) | 0.0 |
| High School Diploma | 0 (0.0%) | 0.0 |
| College or Associate's Degree | 0 (0.0%) | 0.0 |
| Bachelor's Degree | 0 (0.0%) | 0.0 |
| Graduate Degree | 0 (0.0%) | 0.0 |
| Total | 0 (0.0%) | 0.0 |
Fertility by Education by Marriage Status in McGregor
| Educational Attainment | Married | Unmarried |
| Less than High School | 0 (0.0%) | 0 (0.0%) |
| High School Diploma | 0 (0.0%) | 0 (0.0%) |
| College or Associate's Degree | 0 (0.0%) | 0 (0.0%) |
| Bachelor's Degree | 0 (0.0%) | 0 (0.0%) |
| Graduate Degree | 0 (0.0%) | 0 (0.0%) |
| Total | 0 (0.0%) | 0 (0.0%) |
Employment Characteristics in McGregor
Employment by Class of Employer in McGregor
Among the 319 employed individuals in McGregor, private company employees (207 | 64.9%), local government employees (52 | 16.3%), and state government employees (19 | 6.0%) make up the most common classes of employment.
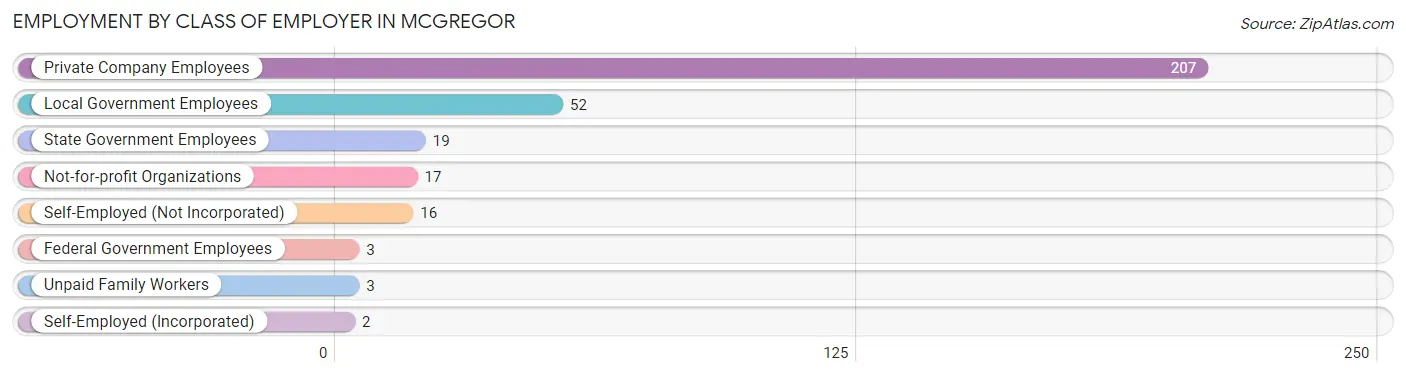
| Employer Class | # Employees | % Employees |
| Private Company Employees | 207 | 64.9% |
| Self-Employed (Incorporated) | 2 | 0.6% |
| Self-Employed (Not Incorporated) | 16 | 5.0% |
| Not-for-profit Organizations | 17 | 5.3% |
| Local Government Employees | 52 | 16.3% |
| State Government Employees | 19 | 6.0% |
| Federal Government Employees | 3 | 0.9% |
| Unpaid Family Workers | 3 | 0.9% |
| Total | 319 | 100.0% |
Employment Status by Age in McGregor
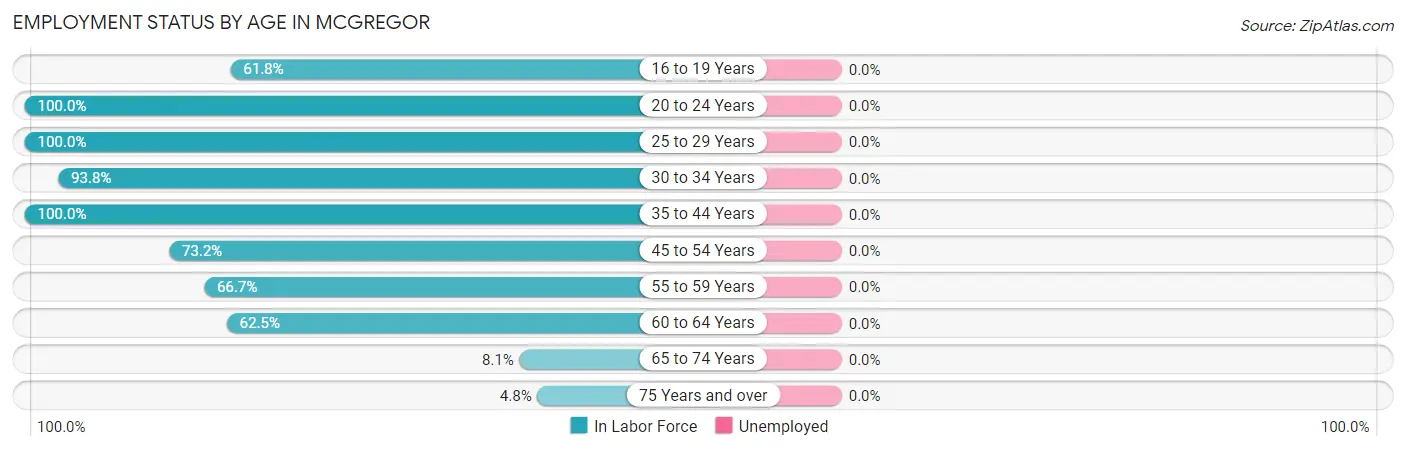
| Age Bracket | In Labor Force | Unemployed |
| 16 to 19 Years | 21 (61.8%) | 0 (0.0%) |
| 20 to 24 Years | 5 (100.0%) | 0 (0.0%) |
| 25 to 29 Years | 10 (100.0%) | 0 (0.0%) |
| 30 to 34 Years | 45 (93.8%) | 0 (0.0%) |
| 35 to 44 Years | 94 (100.0%) | 0 (0.0%) |
| 45 to 54 Years | 60 (73.2%) | 0 (0.0%) |
| 55 to 59 Years | 46 (66.7%) | 0 (0.0%) |
| 60 to 64 Years | 30 (62.5%) | 0 (0.0%) |
| 65 to 74 Years | 8 (8.1%) | 0 (0.0%) |
| 75 Years and over | 5 (4.8%) | 0 (0.0%) |
| Total | 324 (54.6%) | 0 (0.0%) |
Employment Status by Educational Attainment in McGregor
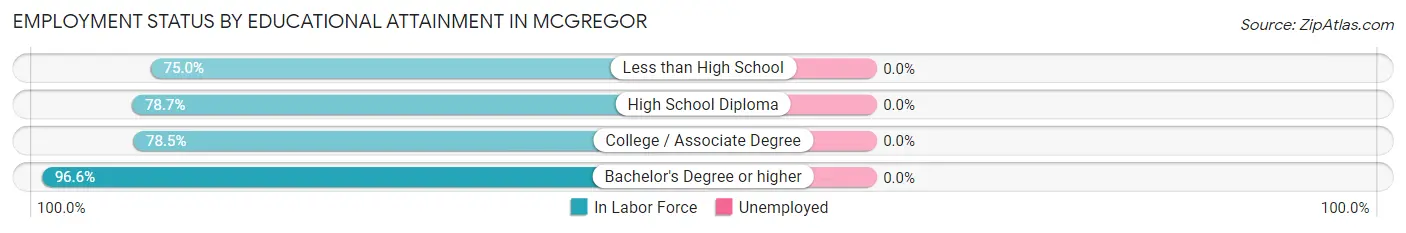
| Educational Attainment | In Labor Force | Unemployed |
| Less than High School | 27 (75.0%) | 0 (0.0%) |
| High School Diploma | 118 (78.7%) | 0 (0.0%) |
| College / Associate Degree | 84 (78.5%) | 0 (0.0%) |
| Bachelor's Degree or higher | 56 (96.6%) | 0 (0.0%) |
| Total | 285 (81.2%) | 0 (0.0%) |
Employment Occupations by Sex in McGregor
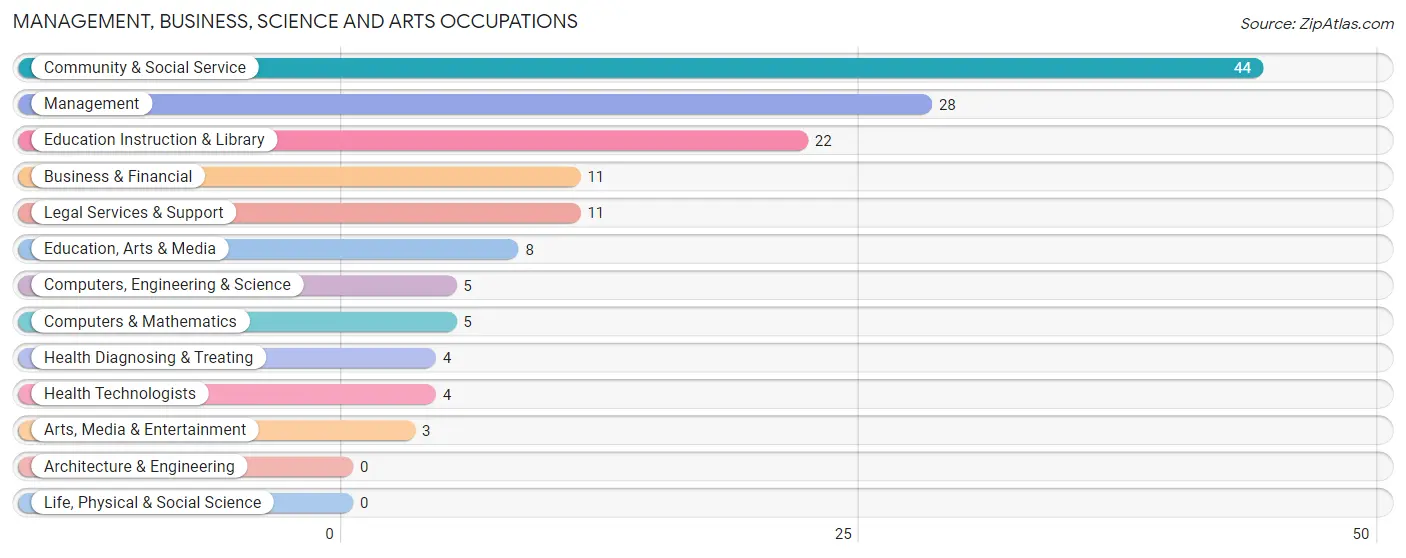
Management, Business, Science and Arts Occupations
The most common Management, Business, Science and Arts occupations in McGregor are Community & Social Service (44 | 13.7%), Management (28 | 8.7%), Education Instruction & Library (22 | 6.9%), Business & Financial (11 | 3.4%), and Legal Services & Support (11 | 3.4%).
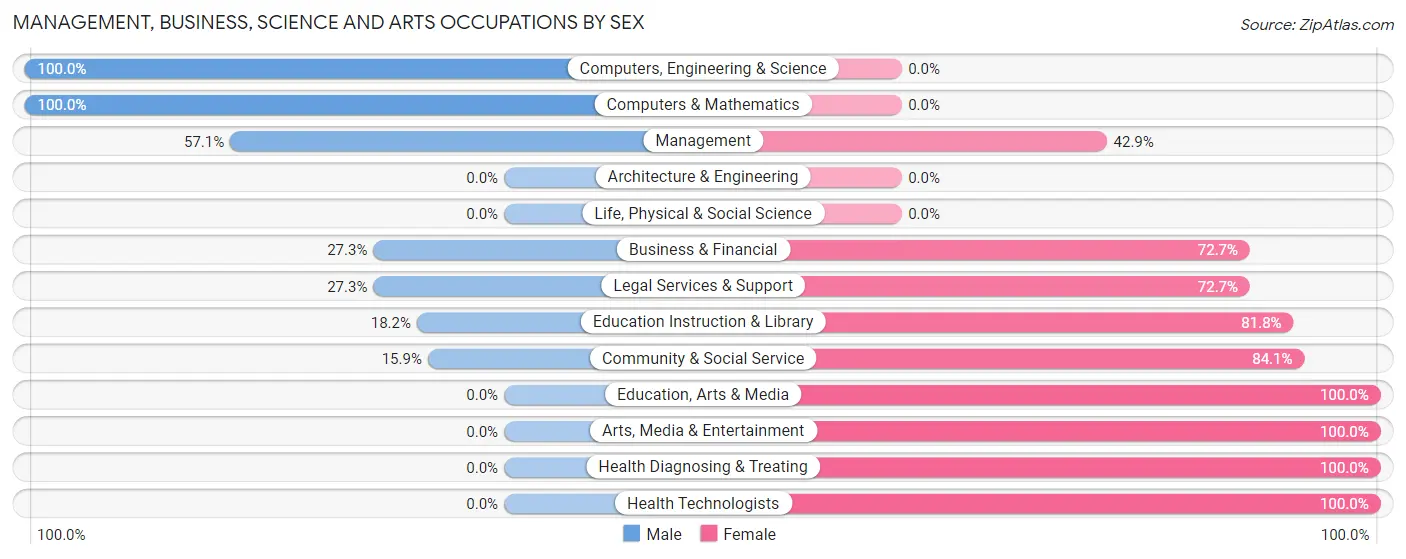
Management, Business, Science and Arts Occupations by Sex
Within the Management, Business, Science and Arts occupations in McGregor, the most male-oriented occupations are Computers, Engineering & Science (100.0%), Computers & Mathematics (100.0%), and Management (57.1%), while the most female-oriented occupations are Education, Arts & Media (100.0%), Arts, Media & Entertainment (100.0%), and Health Diagnosing & Treating (100.0%).
| Occupation | Male | Female |
| Management | 16 (57.1%) | 12 (42.9%) |
| Business & Financial | 3 (27.3%) | 8 (72.7%) |
| Computers, Engineering & Science | 5 (100.0%) | 0 (0.0%) |
| Computers & Mathematics | 5 (100.0%) | 0 (0.0%) |
| Architecture & Engineering | 0 (0.0%) | 0 (0.0%) |
| Life, Physical & Social Science | 0 (0.0%) | 0 (0.0%) |
| Community & Social Service | 7 (15.9%) | 37 (84.1%) |
| Education, Arts & Media | 0 (0.0%) | 8 (100.0%) |
| Legal Services & Support | 3 (27.3%) | 8 (72.7%) |
| Education Instruction & Library | 4 (18.2%) | 18 (81.8%) |
| Arts, Media & Entertainment | 0 (0.0%) | 3 (100.0%) |
| Health Diagnosing & Treating | 0 (0.0%) | 4 (100.0%) |
| Health Technologists | 0 (0.0%) | 4 (100.0%) |
| Total (Category) | 31 (33.7%) | 61 (66.3%) |
| Total (Overall) | 149 (46.4%) | 172 (53.6%) |
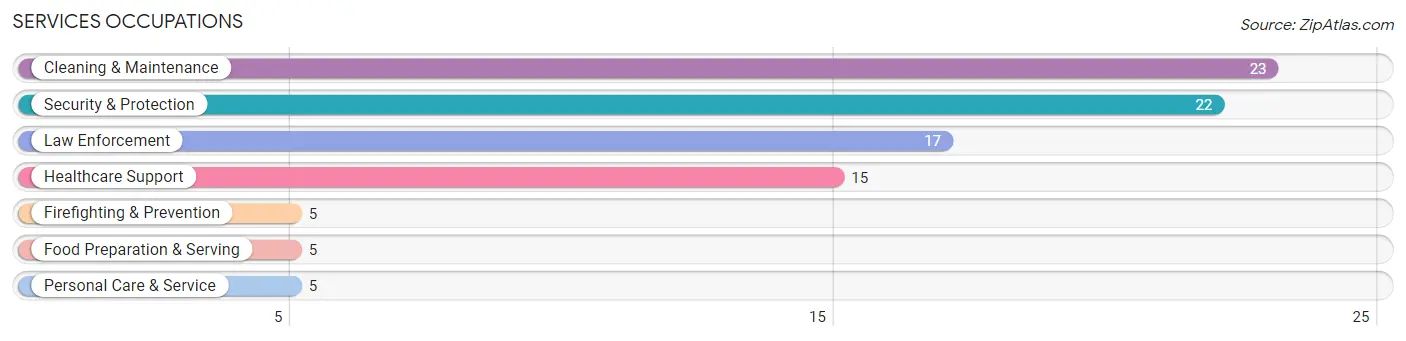
Services Occupations
The most common Services occupations in McGregor are Cleaning & Maintenance (23 | 7.2%), Security & Protection (22 | 6.9%), Law Enforcement (17 | 5.3%), Healthcare Support (15 | 4.7%), and Firefighting & Prevention (5 | 1.6%).
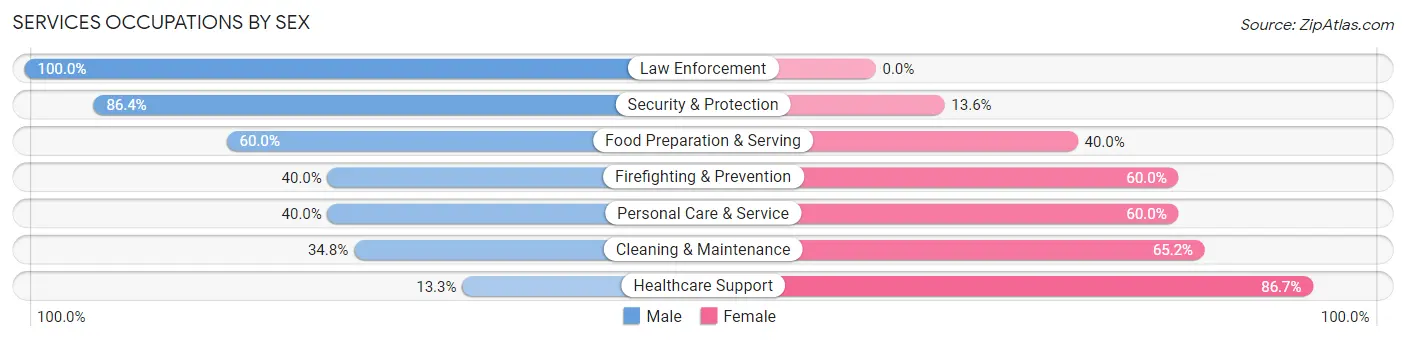
Services Occupations by Sex
Within the Services occupations in McGregor, the most male-oriented occupations are Law Enforcement (100.0%), Security & Protection (86.4%), and Food Preparation & Serving (60.0%), while the most female-oriented occupations are Healthcare Support (86.7%), Cleaning & Maintenance (65.2%), and Firefighting & Prevention (60.0%).
| Occupation | Male | Female |
| Healthcare Support | 2 (13.3%) | 13 (86.7%) |
| Security & Protection | 19 (86.4%) | 3 (13.6%) |
| Firefighting & Prevention | 2 (40.0%) | 3 (60.0%) |
| Law Enforcement | 17 (100.0%) | 0 (0.0%) |
| Food Preparation & Serving | 3 (60.0%) | 2 (40.0%) |
| Cleaning & Maintenance | 8 (34.8%) | 15 (65.2%) |
| Personal Care & Service | 2 (40.0%) | 3 (60.0%) |
| Total (Category) | 34 (48.6%) | 36 (51.4%) |
| Total (Overall) | 149 (46.4%) | 172 (53.6%) |
Sales and Office Occupations
The most common Sales and Office occupations in McGregor are Office & Administration (52 | 16.2%), and Sales & Related (16 | 5.0%).
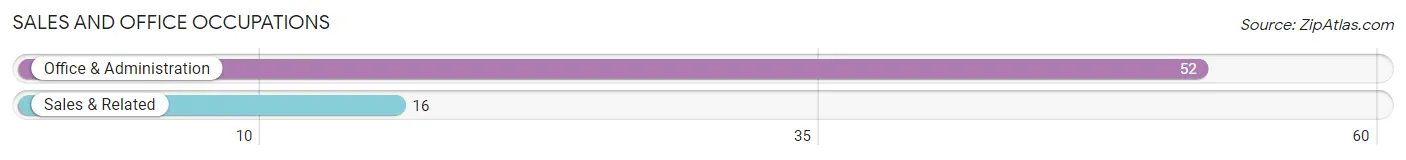
Sales and Office Occupations by Sex
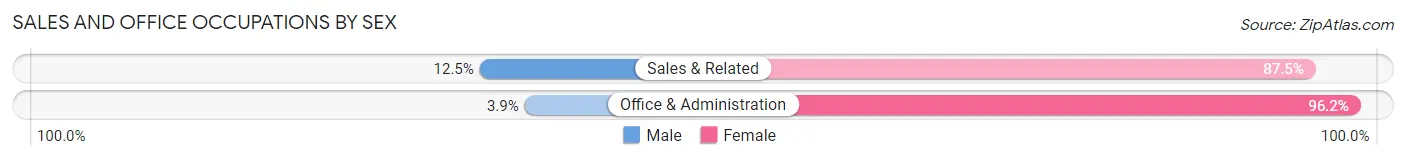
| Occupation | Male | Female |
| Sales & Related | 2 (12.5%) | 14 (87.5%) |
| Office & Administration | 2 (3.8%) | 50 (96.2%) |
| Total (Category) | 4 (5.9%) | 64 (94.1%) |
| Total (Overall) | 149 (46.4%) | 172 (53.6%) |
Natural Resources, Construction and Maintenance Occupations
The most common Natural Resources, Construction and Maintenance occupations in McGregor are Construction & Extraction (15 | 4.7%), and Installation, Maintenance & Repair (5 | 1.6%).
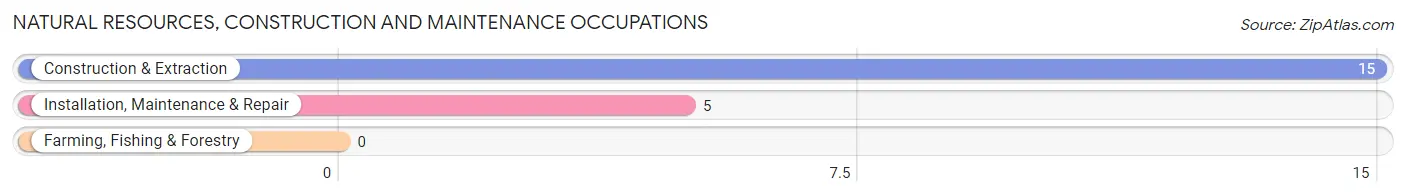
Natural Resources, Construction and Maintenance Occupations by Sex
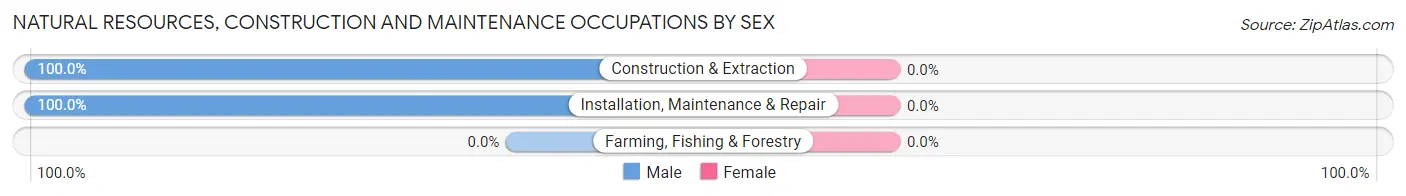
| Occupation | Male | Female |
| Farming, Fishing & Forestry | 0 (0.0%) | 0 (0.0%) |
| Construction & Extraction | 15 (100.0%) | 0 (0.0%) |
| Installation, Maintenance & Repair | 5 (100.0%) | 0 (0.0%) |
| Total (Category) | 20 (100.0%) | 0 (0.0%) |
| Total (Overall) | 149 (46.4%) | 172 (53.6%) |
Production, Transportation and Moving Occupations
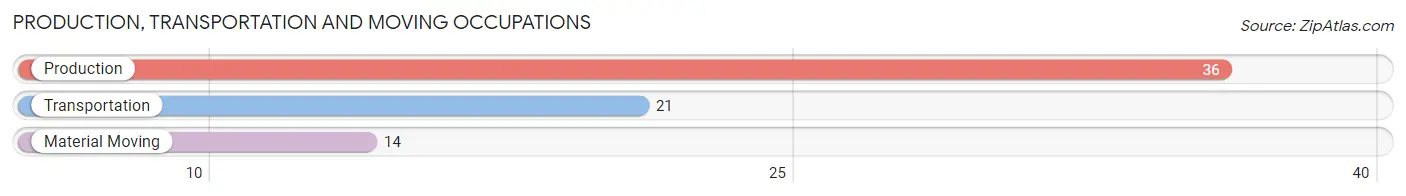
The most common Production, Transportation and Moving occupations in McGregor are Production (36 | 11.2%), Transportation (21 | 6.5%), and Material Moving (14 | 4.4%).
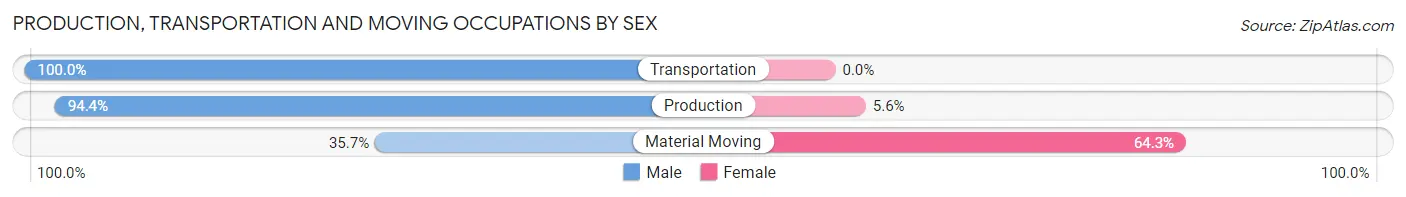
Production, Transportation and Moving Occupations by Sex
| Occupation | Male | Female |
| Production | 34 (94.4%) | 2 (5.6%) |
| Transportation | 21 (100.0%) | 0 (0.0%) |
| Material Moving | 5 (35.7%) | 9 (64.3%) |
| Total (Category) | 60 (84.5%) | 11 (15.5%) |
| Total (Overall) | 149 (46.4%) | 172 (53.6%) |
Employment Industries by Sex in McGregor
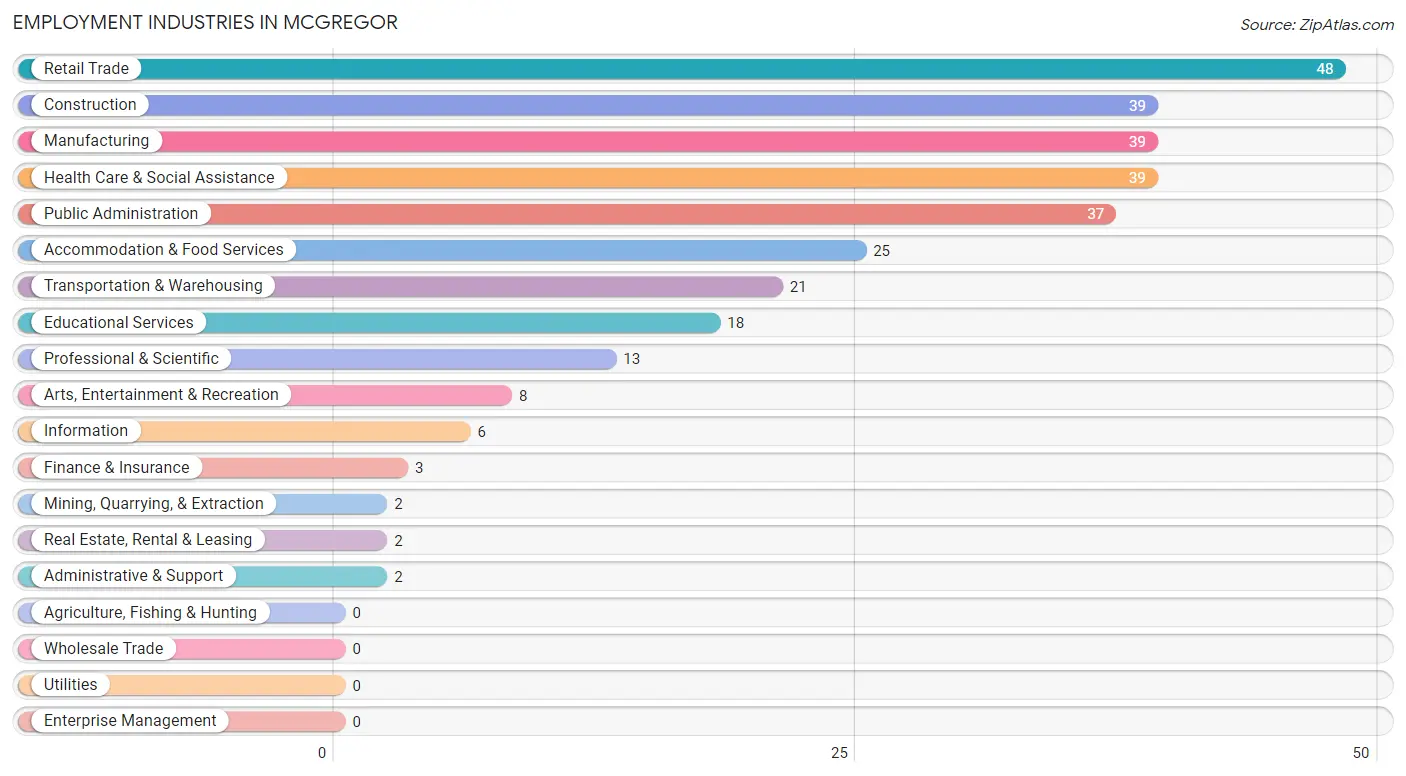
Employment Industries in McGregor
The major employment industries in McGregor include Retail Trade (48 | 14.9%), Construction (39 | 12.1%), Manufacturing (39 | 12.1%), Health Care & Social Assistance (39 | 12.1%), and Public Administration (37 | 11.5%).
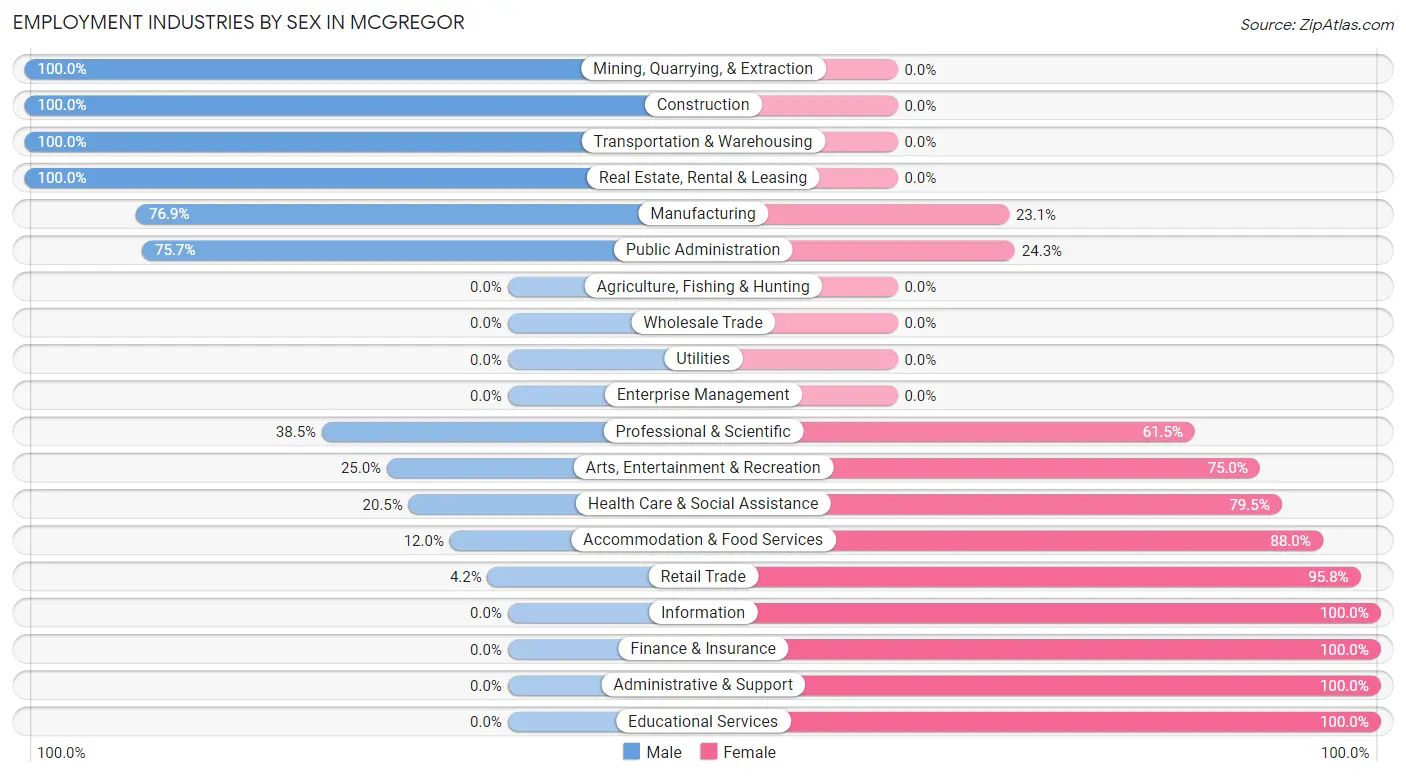
Employment Industries by Sex in McGregor
The McGregor industries that see more men than women are Mining, Quarrying, & Extraction (100.0%), Construction (100.0%), and Transportation & Warehousing (100.0%), whereas the industries that tend to have a higher number of women are Information (100.0%), Finance & Insurance (100.0%), and Administrative & Support (100.0%).
| Industry | Male | Female |
| Agriculture, Fishing & Hunting | 0 (0.0%) | 0 (0.0%) |
| Mining, Quarrying, & Extraction | 2 (100.0%) | 0 (0.0%) |
| Construction | 39 (100.0%) | 0 (0.0%) |
| Manufacturing | 30 (76.9%) | 9 (23.1%) |
| Wholesale Trade | 0 (0.0%) | 0 (0.0%) |
| Retail Trade | 2 (4.2%) | 46 (95.8%) |
| Transportation & Warehousing | 21 (100.0%) | 0 (0.0%) |
| Utilities | 0 (0.0%) | 0 (0.0%) |
| Information | 0 (0.0%) | 6 (100.0%) |
| Finance & Insurance | 0 (0.0%) | 3 (100.0%) |
| Real Estate, Rental & Leasing | 2 (100.0%) | 0 (0.0%) |
| Professional & Scientific | 5 (38.5%) | 8 (61.5%) |
| Enterprise Management | 0 (0.0%) | 0 (0.0%) |
| Administrative & Support | 0 (0.0%) | 2 (100.0%) |
| Educational Services | 0 (0.0%) | 18 (100.0%) |
| Health Care & Social Assistance | 8 (20.5%) | 31 (79.5%) |
| Arts, Entertainment & Recreation | 2 (25.0%) | 6 (75.0%) |
| Accommodation & Food Services | 3 (12.0%) | 22 (88.0%) |
| Public Administration | 28 (75.7%) | 9 (24.3%) |
| Total | 149 (46.4%) | 172 (53.6%) |
Education in McGregor
School Enrollment in McGregor
The most common levels of schooling among the 123 students in McGregor are elementary school (48 | 39.0%), high school (25 | 20.3%), and nursery / preschool (18 | 14.6%).
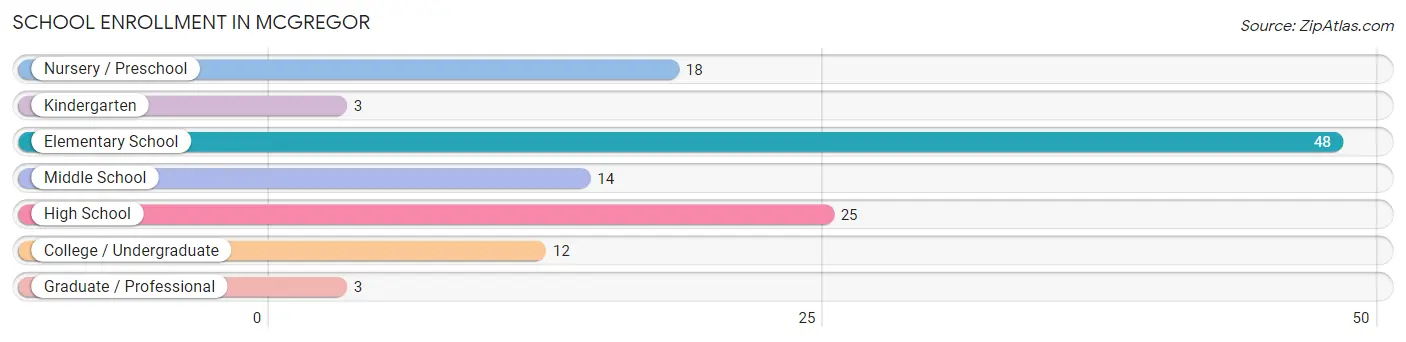
| School Level | # Students | % Students |
| Nursery / Preschool | 18 | 14.6% |
| Kindergarten | 3 | 2.4% |
| Elementary School | 48 | 39.0% |
| Middle School | 14 | 11.4% |
| High School | 25 | 20.3% |
| College / Undergraduate | 12 | 9.8% |
| Graduate / Professional | 3 | 2.4% |
| Total | 123 | 100.0% |
School Enrollment by Age by Funding Source in McGregor
Out of a total of 123 students who are enrolled in schools in McGregor, 33 (26.8%) attend a private institution, while the remaining 90 (73.2%) are enrolled in public schools. The age group of 15 to 17 year olds has the highest likelihood of being enrolled in private schools, with 10 (76.9% in the age bracket) enrolled. Conversely, the age group of 10 to 14 year olds has the lowest likelihood of being enrolled in a private school, with 23 (100.0% in the age bracket) attending a public institution.
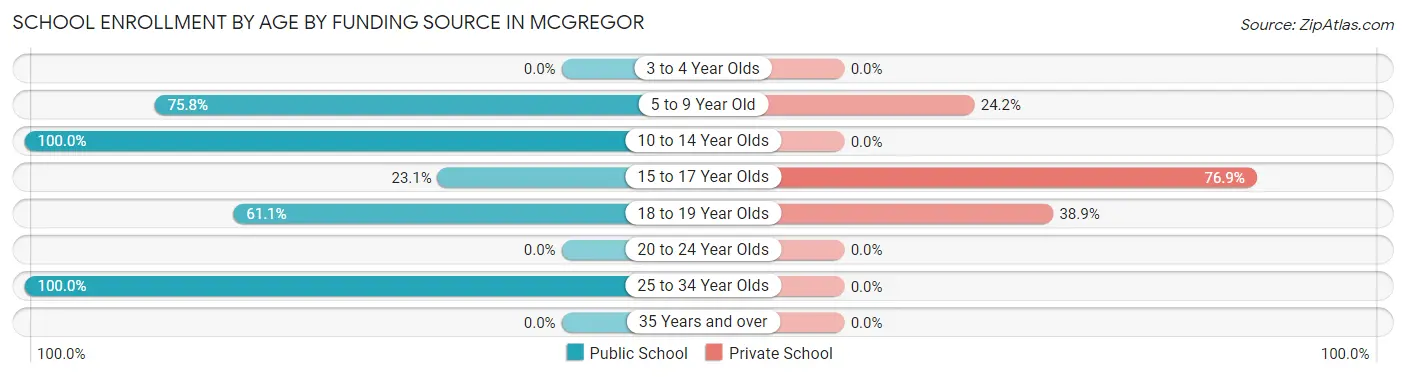
| Age Bracket | Public School | Private School |
| 3 to 4 Year Olds | 0 (0.0%) | 0 (0.0%) |
| 5 to 9 Year Old | 50 (75.8%) | 16 (24.2%) |
| 10 to 14 Year Olds | 23 (100.0%) | 0 (0.0%) |
| 15 to 17 Year Olds | 3 (23.1%) | 10 (76.9%) |
| 18 to 19 Year Olds | 11 (61.1%) | 7 (38.9%) |
| 20 to 24 Year Olds | 0 (0.0%) | 0 (0.0%) |
| 25 to 34 Year Olds | 3 (100.0%) | 0 (0.0%) |
| 35 Years and over | 0 (0.0%) | 0 (0.0%) |
| Total | 90 (73.2%) | 33 (26.8%) |
Educational Attainment by Field of Study in McGregor
Education (51 | 39.5%), social sciences (19 | 14.7%), psychology (13 | 10.1%), liberal arts & history (8 | 6.2%), and communications (8 | 6.2%) are the most common fields of study among 129 individuals in McGregor who have obtained a bachelor's degree or higher.
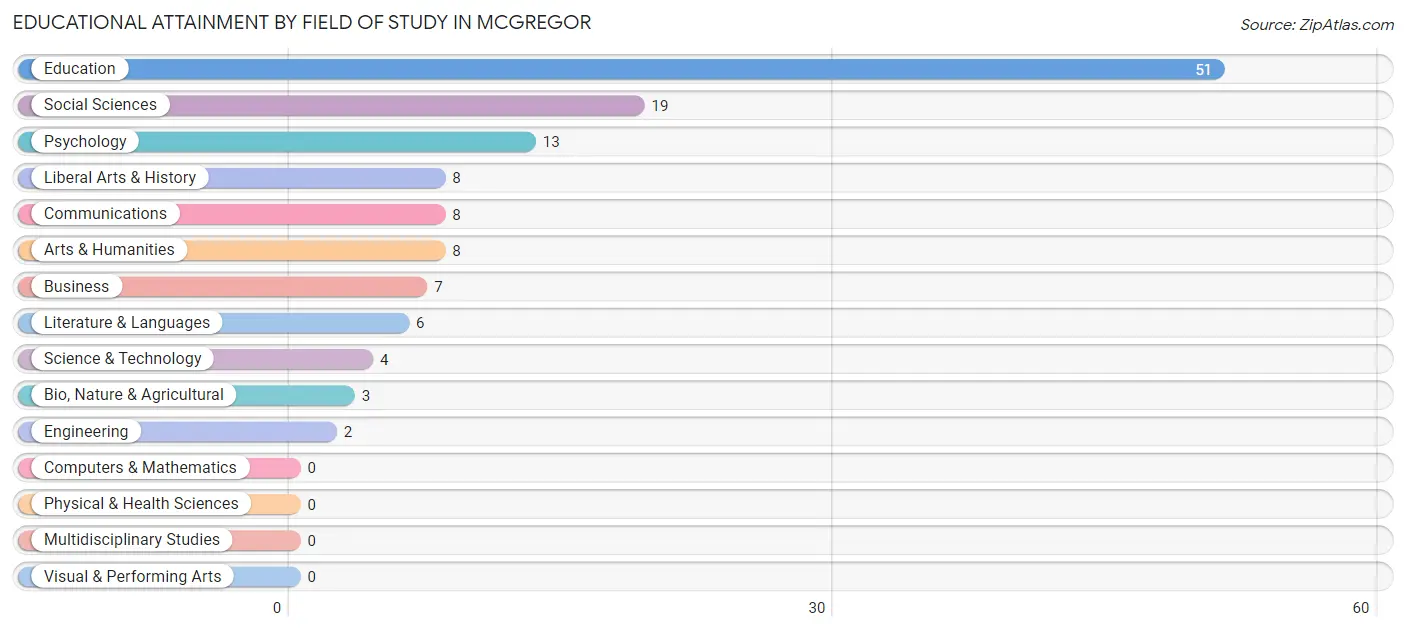
| Field of Study | # Graduates | % Graduates |
| Computers & Mathematics | 0 | 0.0% |
| Bio, Nature & Agricultural | 3 | 2.3% |
| Physical & Health Sciences | 0 | 0.0% |
| Psychology | 13 | 10.1% |
| Social Sciences | 19 | 14.7% |
| Engineering | 2 | 1.5% |
| Multidisciplinary Studies | 0 | 0.0% |
| Science & Technology | 4 | 3.1% |
| Business | 7 | 5.4% |
| Education | 51 | 39.5% |
| Literature & Languages | 6 | 4.6% |
| Liberal Arts & History | 8 | 6.2% |
| Visual & Performing Arts | 0 | 0.0% |
| Communications | 8 | 6.2% |
| Arts & Humanities | 8 | 6.2% |
| Total | 129 | 100.0% |
Transportation & Commute in McGregor
Vehicle Availability by Sex in McGregor
The most prevalent vehicle ownership categories in McGregor are males with 2 vehicles (49, accounting for 32.2%) and females with 2 vehicles (55, making up 29.3%).
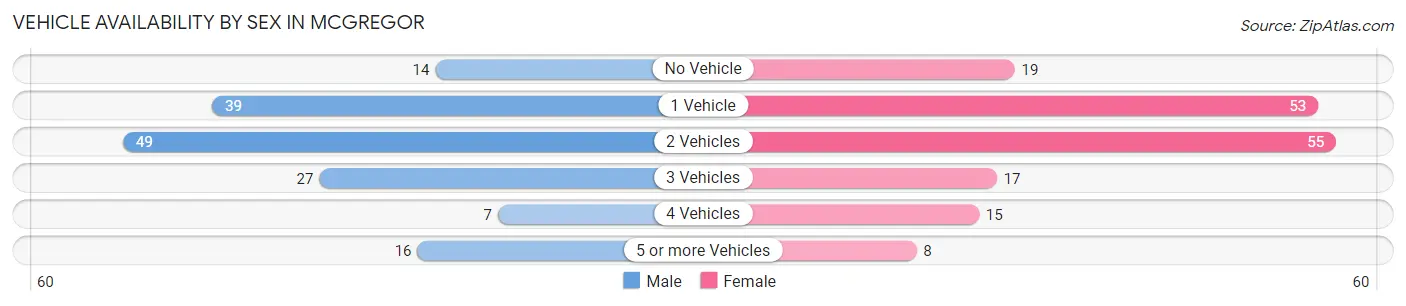
| Vehicles Available | Male | Female |
| No Vehicle | 14 (9.2%) | 19 (11.4%) |
| 1 Vehicle | 39 (25.7%) | 53 (31.7%) |
| 2 Vehicles | 49 (32.2%) | 55 (32.9%) |
| 3 Vehicles | 27 (17.8%) | 17 (10.2%) |
| 4 Vehicles | 7 (4.6%) | 15 (9.0%) |
| 5 or more Vehicles | 16 (10.5%) | 8 (4.8%) |
| Total | 152 (100.0%) | 167 (100.0%) |
Commute Time in McGregor
The most frequently occuring commute durations in McGregor are 5 to 9 minutes (65 commuters, 21.4%), 10 to 14 minutes (57 commuters, 18.8%), and less than 5 minutes (51 commuters, 16.8%).
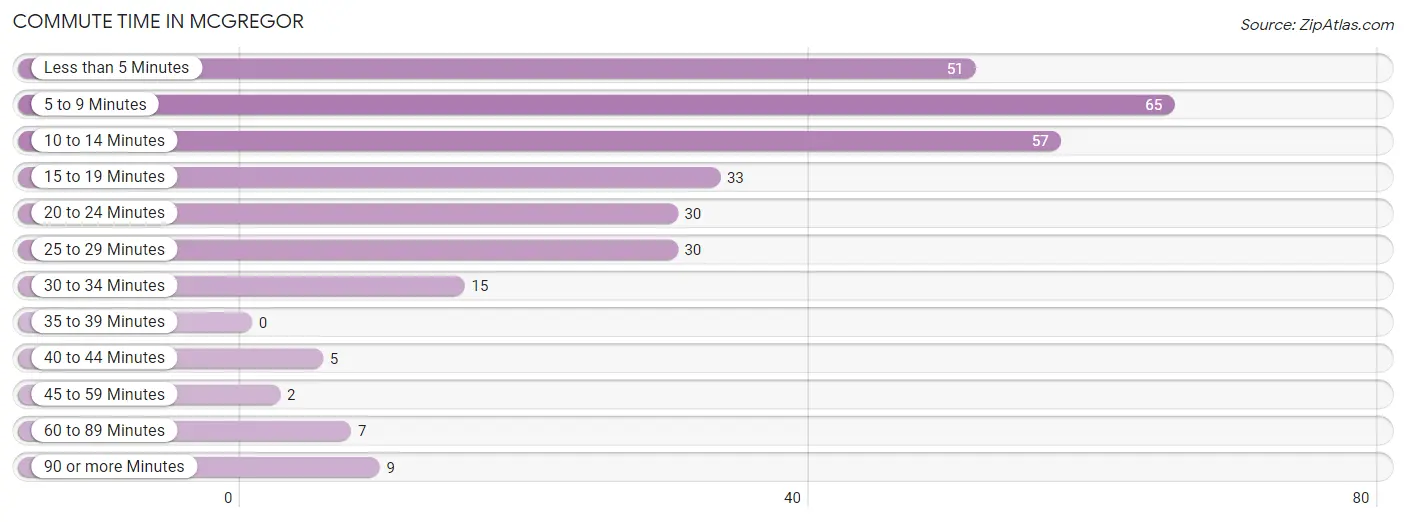
| Commute Time | # Commuters | % Commuters |
| Less than 5 Minutes | 51 | 16.8% |
| 5 to 9 Minutes | 65 | 21.4% |
| 10 to 14 Minutes | 57 | 18.8% |
| 15 to 19 Minutes | 33 | 10.9% |
| 20 to 24 Minutes | 30 | 9.9% |
| 25 to 29 Minutes | 30 | 9.9% |
| 30 to 34 Minutes | 15 | 4.9% |
| 35 to 39 Minutes | 0 | 0.0% |
| 40 to 44 Minutes | 5 | 1.6% |
| 45 to 59 Minutes | 2 | 0.7% |
| 60 to 89 Minutes | 7 | 2.3% |
| 90 or more Minutes | 9 | 3.0% |
Commute Time by Sex in McGregor
The most common commute times in McGregor are less than 5 minutes (29 commuters, 20.7%) for males and 5 to 9 minutes (40 commuters, 24.4%) for females.
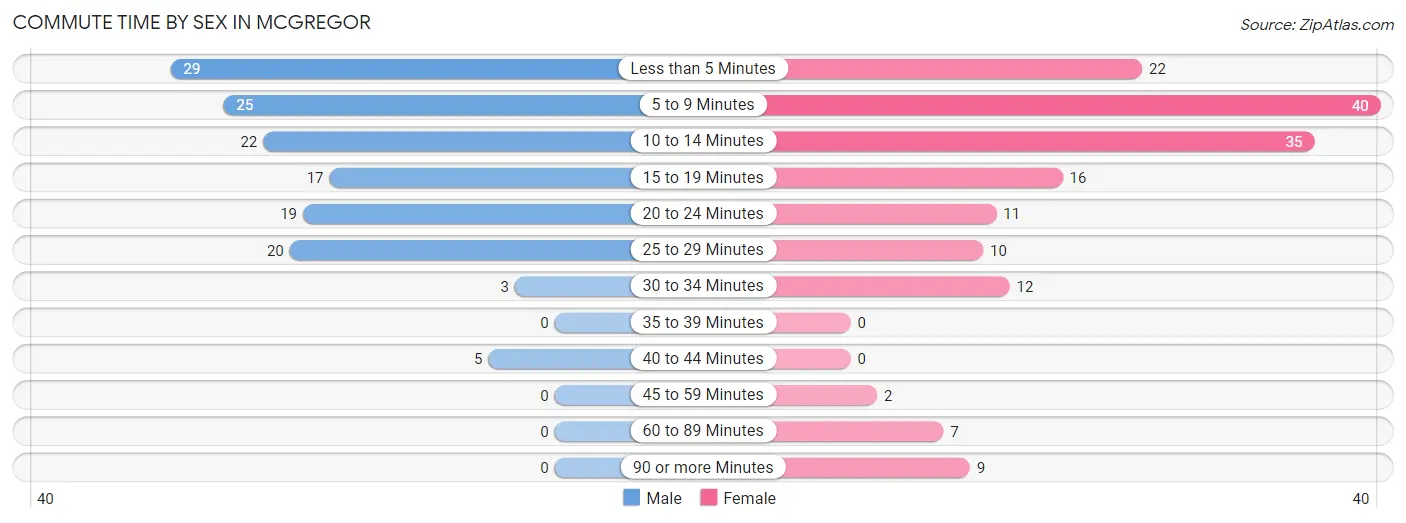
| Commute Time | Male | Female |
| Less than 5 Minutes | 29 (20.7%) | 22 (13.4%) |
| 5 to 9 Minutes | 25 (17.9%) | 40 (24.4%) |
| 10 to 14 Minutes | 22 (15.7%) | 35 (21.3%) |
| 15 to 19 Minutes | 17 (12.1%) | 16 (9.8%) |
| 20 to 24 Minutes | 19 (13.6%) | 11 (6.7%) |
| 25 to 29 Minutes | 20 (14.3%) | 10 (6.1%) |
| 30 to 34 Minutes | 3 (2.1%) | 12 (7.3%) |
| 35 to 39 Minutes | 0 (0.0%) | 0 (0.0%) |
| 40 to 44 Minutes | 5 (3.6%) | 0 (0.0%) |
| 45 to 59 Minutes | 0 (0.0%) | 2 (1.2%) |
| 60 to 89 Minutes | 0 (0.0%) | 7 (4.3%) |
| 90 or more Minutes | 0 (0.0%) | 9 (5.5%) |
Time of Departure to Work by Sex in McGregor
The most frequent times of departure to work in McGregor are 7:00 AM to 7:29 AM (37, 26.4%) for males and 8:00 AM to 8:29 AM (31, 18.9%) for females.
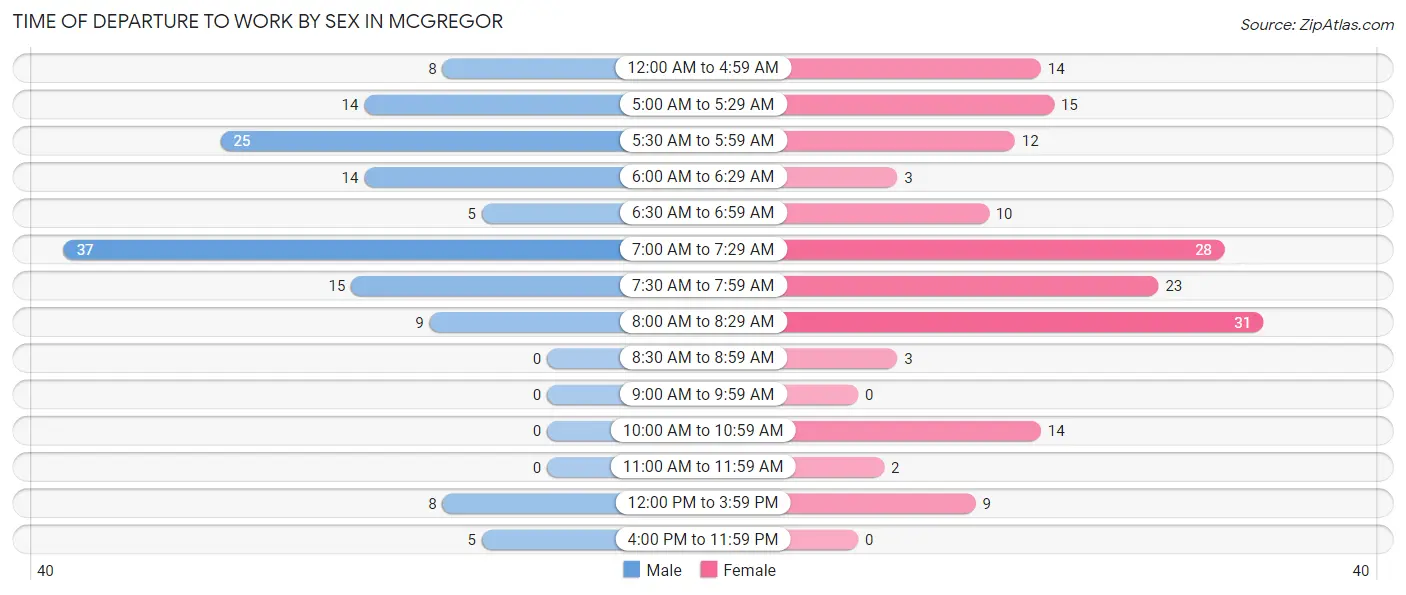
| Time of Departure | Male | Female |
| 12:00 AM to 4:59 AM | 8 (5.7%) | 14 (8.5%) |
| 5:00 AM to 5:29 AM | 14 (10.0%) | 15 (9.1%) |
| 5:30 AM to 5:59 AM | 25 (17.9%) | 12 (7.3%) |
| 6:00 AM to 6:29 AM | 14 (10.0%) | 3 (1.8%) |
| 6:30 AM to 6:59 AM | 5 (3.6%) | 10 (6.1%) |
| 7:00 AM to 7:29 AM | 37 (26.4%) | 28 (17.1%) |
| 7:30 AM to 7:59 AM | 15 (10.7%) | 23 (14.0%) |
| 8:00 AM to 8:29 AM | 9 (6.4%) | 31 (18.9%) |
| 8:30 AM to 8:59 AM | 0 (0.0%) | 3 (1.8%) |
| 9:00 AM to 9:59 AM | 0 (0.0%) | 0 (0.0%) |
| 10:00 AM to 10:59 AM | 0 (0.0%) | 14 (8.5%) |
| 11:00 AM to 11:59 AM | 0 (0.0%) | 2 (1.2%) |
| 12:00 PM to 3:59 PM | 8 (5.7%) | 9 (5.5%) |
| 4:00 PM to 11:59 PM | 5 (3.6%) | 0 (0.0%) |
| Total | 140 (100.0%) | 164 (100.0%) |
Housing Occupancy in McGregor
Occupancy by Ownership in McGregor
Of the total 322 dwellings in McGregor, owner-occupied units account for 228 (70.8%), while renter-occupied units make up 94 (29.2%).
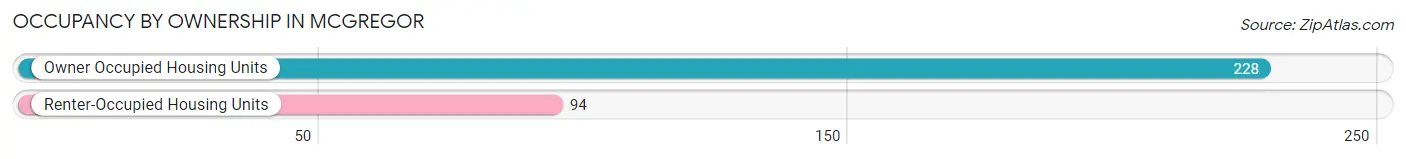
| Occupancy | # Housing Units | % Housing Units |
| Owner Occupied Housing Units | 228 | 70.8% |
| Renter-Occupied Housing Units | 94 | 29.2% |
| Total Occupied Housing Units | 322 | 100.0% |
Occupancy by Household Size in McGregor
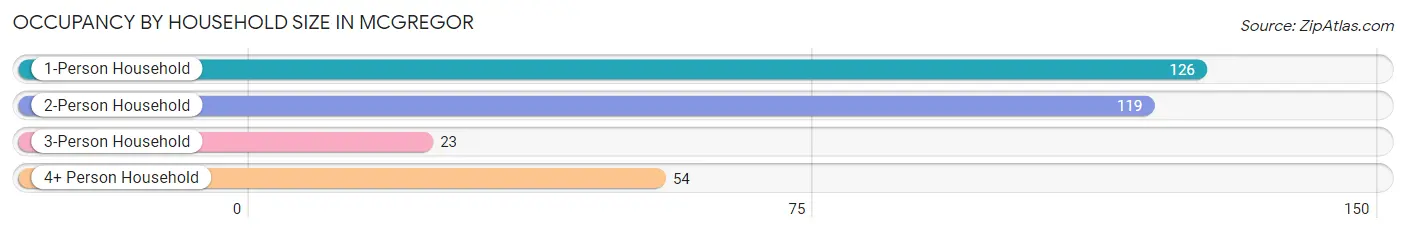
| Household Size | # Housing Units | % Housing Units |
| 1-Person Household | 126 | 39.1% |
| 2-Person Household | 119 | 37.0% |
| 3-Person Household | 23 | 7.1% |
| 4+ Person Household | 54 | 16.8% |
| Total Housing Units | 322 | 100.0% |
Occupancy by Ownership by Household Size in McGregor
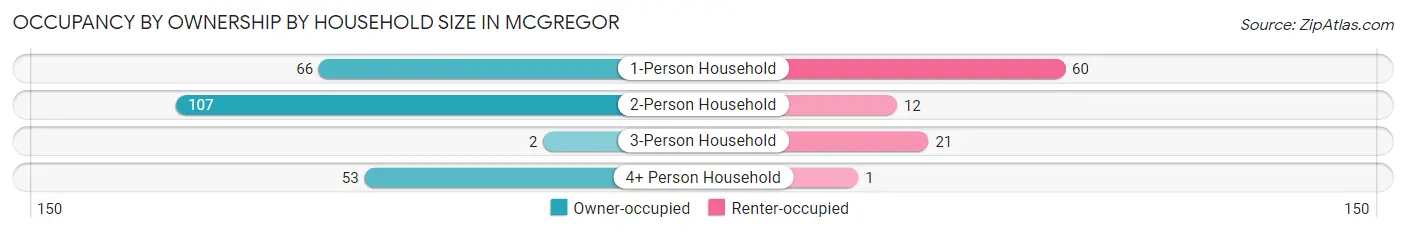
| Household Size | Owner-occupied | Renter-occupied |
| 1-Person Household | 66 (52.4%) | 60 (47.6%) |
| 2-Person Household | 107 (89.9%) | 12 (10.1%) |
| 3-Person Household | 2 (8.7%) | 21 (91.3%) |
| 4+ Person Household | 53 (98.2%) | 1 (1.8%) |
| Total Housing Units | 228 (70.8%) | 94 (29.2%) |
Occupancy by Educational Attainment in McGregor
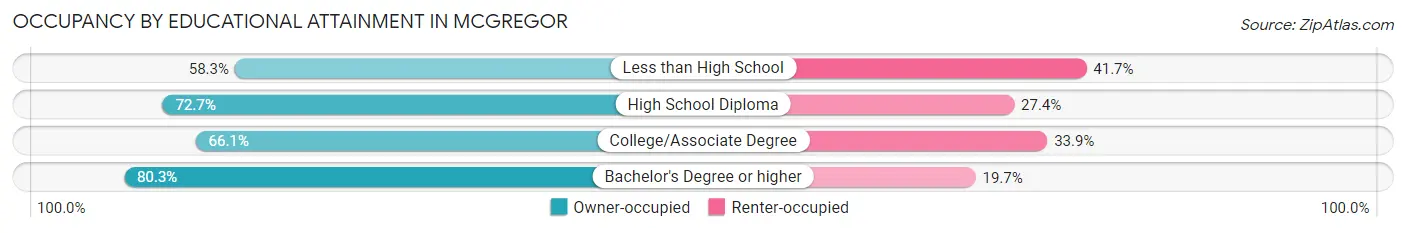
| Household Size | Owner-occupied | Renter-occupied |
| Less than High School | 14 (58.3%) | 10 (41.7%) |
| High School Diploma | 85 (72.7%) | 32 (27.4%) |
| College/Associate Degree | 76 (66.1%) | 39 (33.9%) |
| Bachelor's Degree or higher | 53 (80.3%) | 13 (19.7%) |
Occupancy by Age of Householder in McGregor
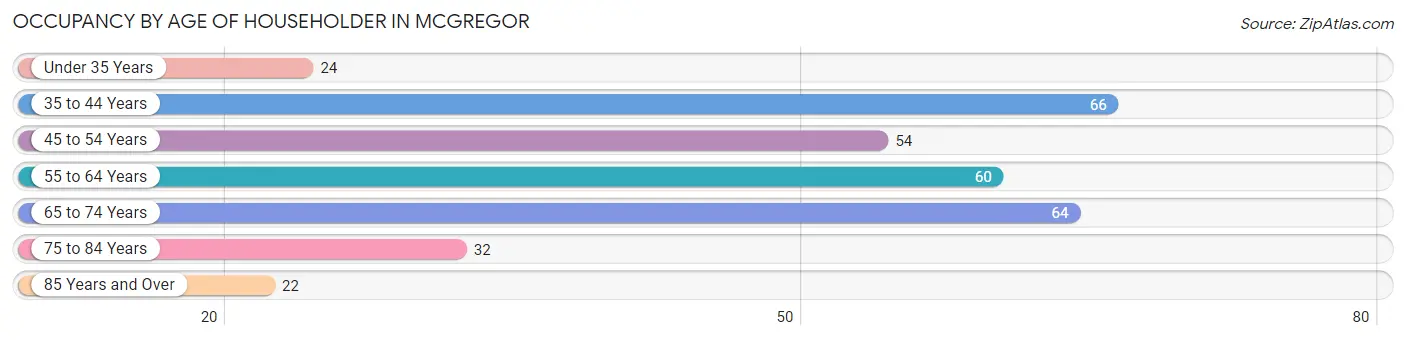
| Age Bracket | # Households | % Households |
| Under 35 Years | 24 | 7.4% |
| 35 to 44 Years | 66 | 20.5% |
| 45 to 54 Years | 54 | 16.8% |
| 55 to 64 Years | 60 | 18.6% |
| 65 to 74 Years | 64 | 19.9% |
| 75 to 84 Years | 32 | 9.9% |
| 85 Years and Over | 22 | 6.8% |
| Total | 322 | 100.0% |
Housing Finances in McGregor
Median Income by Occupancy in McGregor
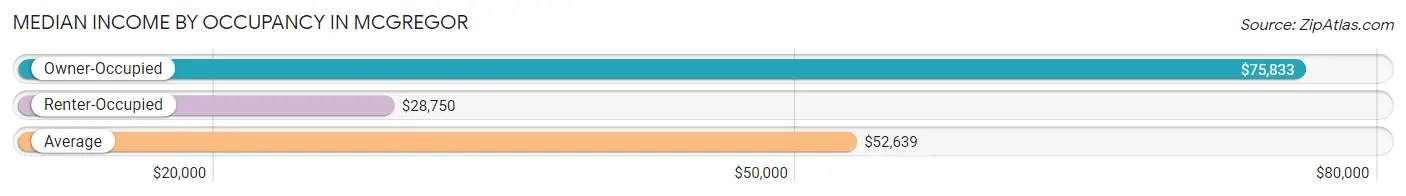
| Occupancy Type | # Households | Median Income |
| Owner-Occupied | 228 (70.8%) | $75,833 |
| Renter-Occupied | 94 (29.2%) | $28,750 |
| Average | 322 (100.0%) | $52,639 |
Occupancy by Householder Income Bracket in McGregor
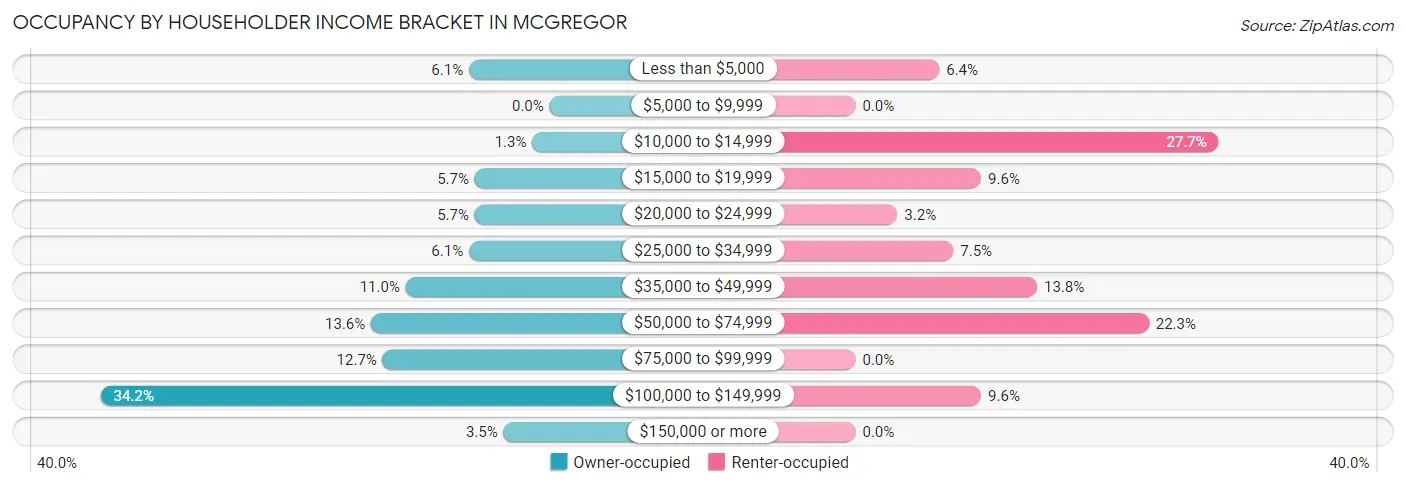
| Income Bracket | Owner-occupied | Renter-occupied |
| Less than $5,000 | 14 (6.1%) | 6 (6.4%) |
| $5,000 to $9,999 | 0 (0.0%) | 0 (0.0%) |
| $10,000 to $14,999 | 3 (1.3%) | 26 (27.7%) |
| $15,000 to $19,999 | 13 (5.7%) | 9 (9.6%) |
| $20,000 to $24,999 | 13 (5.7%) | 3 (3.2%) |
| $25,000 to $34,999 | 14 (6.1%) | 7 (7.4%) |
| $35,000 to $49,999 | 25 (11.0%) | 13 (13.8%) |
| $50,000 to $74,999 | 31 (13.6%) | 21 (22.3%) |
| $75,000 to $99,999 | 29 (12.7%) | 0 (0.0%) |
| $100,000 to $149,999 | 78 (34.2%) | 9 (9.6%) |
| $150,000 or more | 8 (3.5%) | 0 (0.0%) |
| Total | 228 (100.0%) | 94 (100.0%) |
Monthly Housing Cost Tiers in McGregor
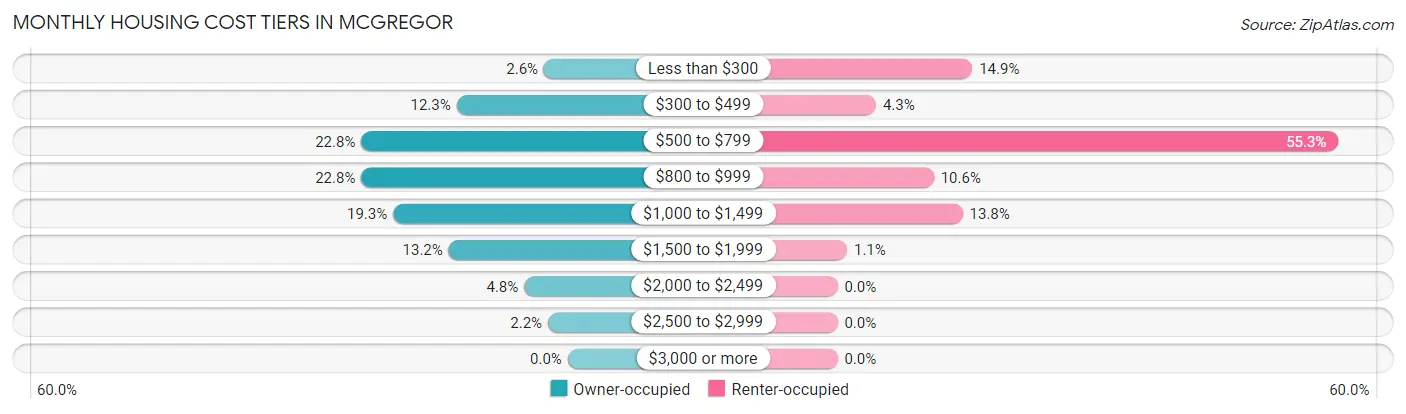
| Monthly Cost | Owner-occupied | Renter-occupied |
| Less than $300 | 6 (2.6%) | 14 (14.9%) |
| $300 to $499 | 28 (12.3%) | 4 (4.3%) |
| $500 to $799 | 52 (22.8%) | 52 (55.3%) |
| $800 to $999 | 52 (22.8%) | 10 (10.6%) |
| $1,000 to $1,499 | 44 (19.3%) | 13 (13.8%) |
| $1,500 to $1,999 | 30 (13.2%) | 1 (1.1%) |
| $2,000 to $2,499 | 11 (4.8%) | 0 (0.0%) |
| $2,500 to $2,999 | 5 (2.2%) | 0 (0.0%) |
| $3,000 or more | 0 (0.0%) | 0 (0.0%) |
| Total | 228 (100.0%) | 94 (100.0%) |
Physical Housing Characteristics in McGregor
Housing Structures in McGregor
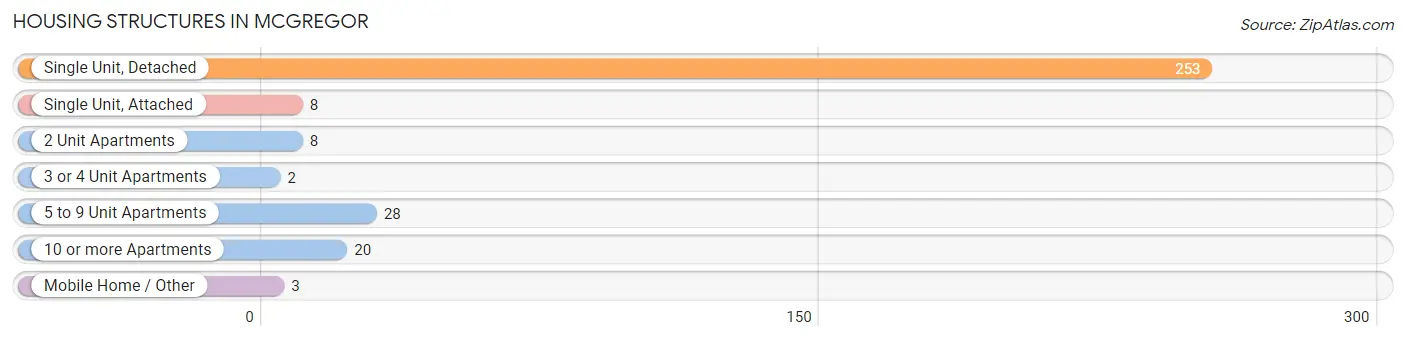
| Structure Type | # Housing Units | % Housing Units |
| Single Unit, Detached | 253 | 78.6% |
| Single Unit, Attached | 8 | 2.5% |
| 2 Unit Apartments | 8 | 2.5% |
| 3 or 4 Unit Apartments | 2 | 0.6% |
| 5 to 9 Unit Apartments | 28 | 8.7% |
| 10 or more Apartments | 20 | 6.2% |
| Mobile Home / Other | 3 | 0.9% |
| Total | 322 | 100.0% |
Housing Structures by Occupancy in McGregor
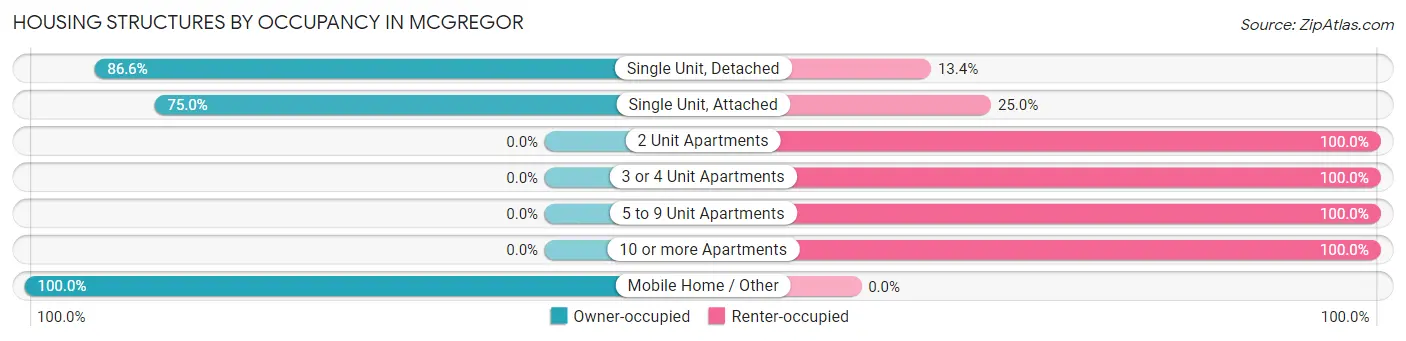
| Structure Type | Owner-occupied | Renter-occupied |
| Single Unit, Detached | 219 (86.6%) | 34 (13.4%) |
| Single Unit, Attached | 6 (75.0%) | 2 (25.0%) |
| 2 Unit Apartments | 0 (0.0%) | 8 (100.0%) |
| 3 or 4 Unit Apartments | 0 (0.0%) | 2 (100.0%) |
| 5 to 9 Unit Apartments | 0 (0.0%) | 28 (100.0%) |
| 10 or more Apartments | 0 (0.0%) | 20 (100.0%) |
| Mobile Home / Other | 3 (100.0%) | 0 (0.0%) |
| Total | 228 (70.8%) | 94 (29.2%) |
Housing Structures by Number of Rooms in McGregor
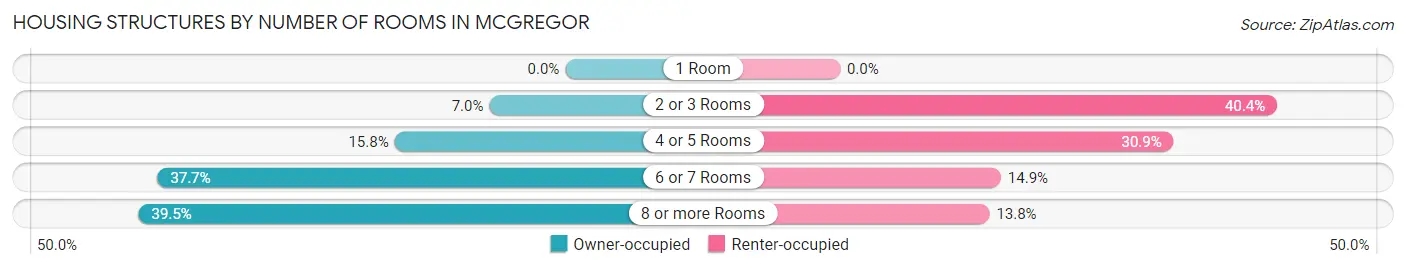
| Number of Rooms | Owner-occupied | Renter-occupied |
| 1 Room | 0 (0.0%) | 0 (0.0%) |
| 2 or 3 Rooms | 16 (7.0%) | 38 (40.4%) |
| 4 or 5 Rooms | 36 (15.8%) | 29 (30.8%) |
| 6 or 7 Rooms | 86 (37.7%) | 14 (14.9%) |
| 8 or more Rooms | 90 (39.5%) | 13 (13.8%) |
| Total | 228 (100.0%) | 94 (100.0%) |
Housing Structure by Heating Type in McGregor
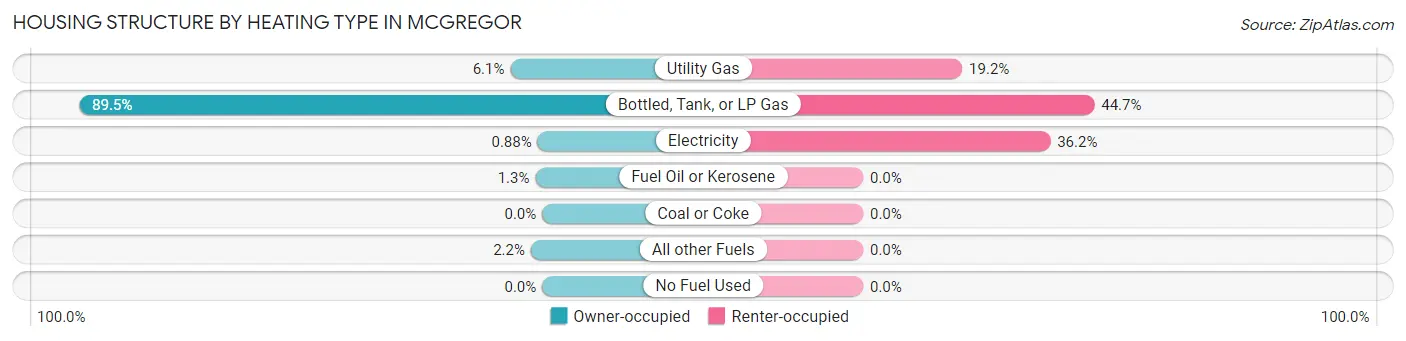
| Heating Type | Owner-occupied | Renter-occupied |
| Utility Gas | 14 (6.1%) | 18 (19.2%) |
| Bottled, Tank, or LP Gas | 204 (89.5%) | 42 (44.7%) |
| Electricity | 2 (0.9%) | 34 (36.2%) |
| Fuel Oil or Kerosene | 3 (1.3%) | 0 (0.0%) |
| Coal or Coke | 0 (0.0%) | 0 (0.0%) |
| All other Fuels | 5 (2.2%) | 0 (0.0%) |
| No Fuel Used | 0 (0.0%) | 0 (0.0%) |
| Total | 228 (100.0%) | 94 (100.0%) |
Household Vehicle Usage in McGregor
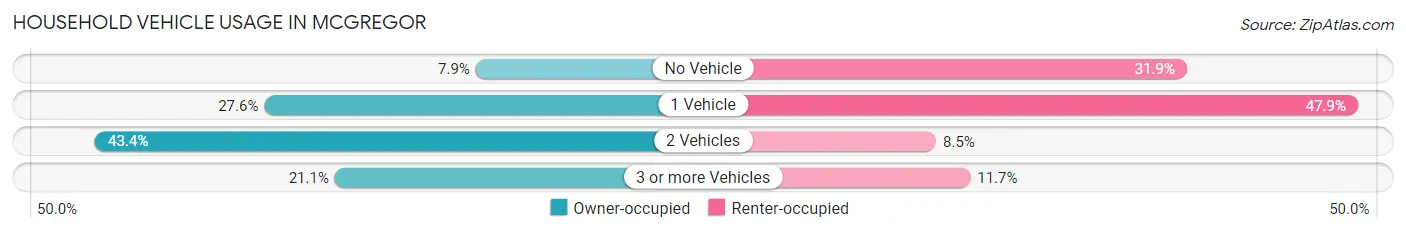
| Vehicles per Household | Owner-occupied | Renter-occupied |
| No Vehicle | 18 (7.9%) | 30 (31.9%) |
| 1 Vehicle | 63 (27.6%) | 45 (47.9%) |
| 2 Vehicles | 99 (43.4%) | 8 (8.5%) |
| 3 or more Vehicles | 48 (21.0%) | 11 (11.7%) |
| Total | 228 (100.0%) | 94 (100.0%) |
Real Estate & Mortgages in McGregor
Real Estate and Mortgage Overview in McGregor
| Characteristic | Without Mortgage | With Mortgage |
| Housing Units | 105 | 123 |
| Median Property Value | $141,300 | $117,900 |
| Median Household Income | $42,344 | $5 |
| Monthly Housing Costs | $650 | $0 |
| Real Estate Taxes | $2,326 | $0 |
Property Value by Mortgage Status in McGregor
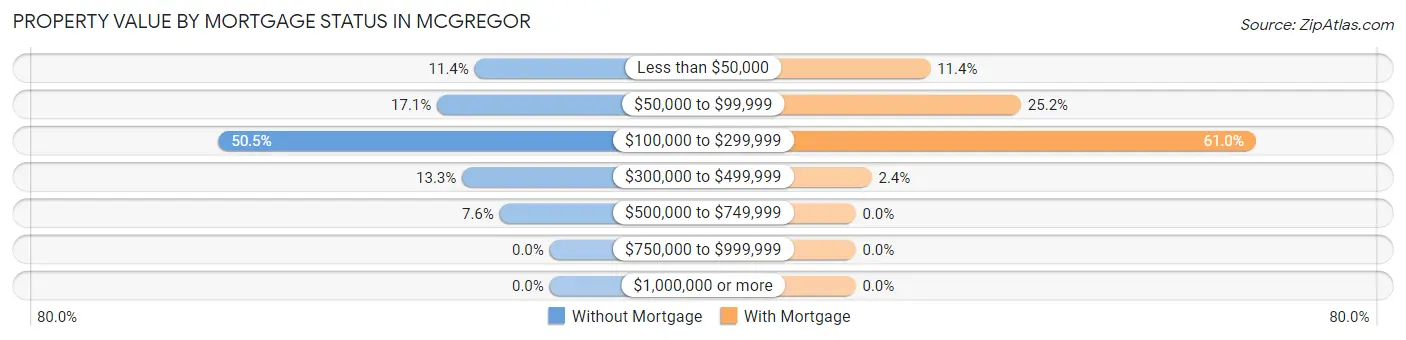
| Property Value | Without Mortgage | With Mortgage |
| Less than $50,000 | 12 (11.4%) | 14 (11.4%) |
| $50,000 to $99,999 | 18 (17.1%) | 31 (25.2%) |
| $100,000 to $299,999 | 53 (50.5%) | 75 (61.0%) |
| $300,000 to $499,999 | 14 (13.3%) | 3 (2.4%) |
| $500,000 to $749,999 | 8 (7.6%) | 0 (0.0%) |
| $750,000 to $999,999 | 0 (0.0%) | 0 (0.0%) |
| $1,000,000 or more | 0 (0.0%) | 0 (0.0%) |
| Total | 105 (100.0%) | 123 (100.0%) |
Household Income by Mortgage Status in McGregor
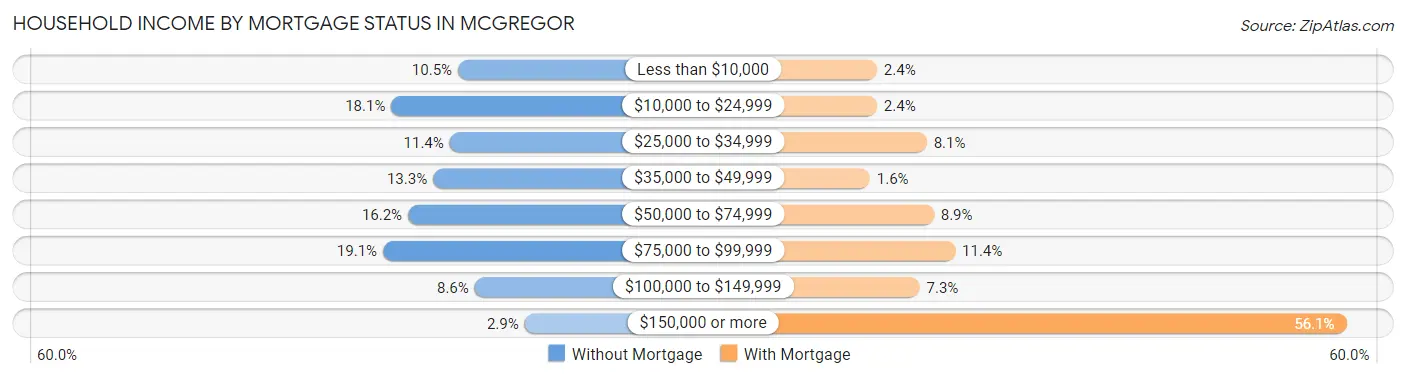
| Household Income | Without Mortgage | With Mortgage |
| Less than $10,000 | 11 (10.5%) | 3 (2.4%) |
| $10,000 to $24,999 | 19 (18.1%) | 3 (2.4%) |
| $25,000 to $34,999 | 12 (11.4%) | 10 (8.1%) |
| $35,000 to $49,999 | 14 (13.3%) | 2 (1.6%) |
| $50,000 to $74,999 | 17 (16.2%) | 11 (8.9%) |
| $75,000 to $99,999 | 20 (19.1%) | 14 (11.4%) |
| $100,000 to $149,999 | 9 (8.6%) | 9 (7.3%) |
| $150,000 or more | 3 (2.9%) | 69 (56.1%) |
| Total | 105 (100.0%) | 123 (100.0%) |
Property Value to Household Income Ratio in McGregor
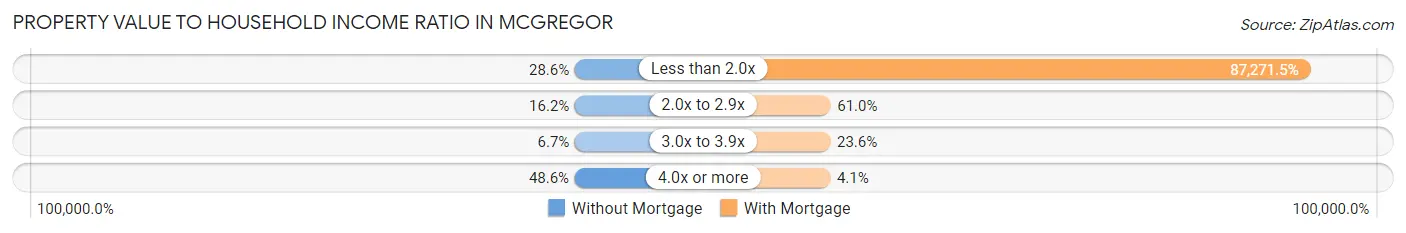
| Value-to-Income Ratio | Without Mortgage | With Mortgage |
| Less than 2.0x | 30 (28.6%) | 107,344 (87,271.5%) |
| 2.0x to 2.9x | 17 (16.2%) | 75 (61.0%) |
| 3.0x to 3.9x | 7 (6.7%) | 29 (23.6%) |
| 4.0x or more | 51 (48.6%) | 5 (4.1%) |
| Total | 105 (100.0%) | 123 (100.0%) |
Real Estate Taxes by Mortgage Status in McGregor
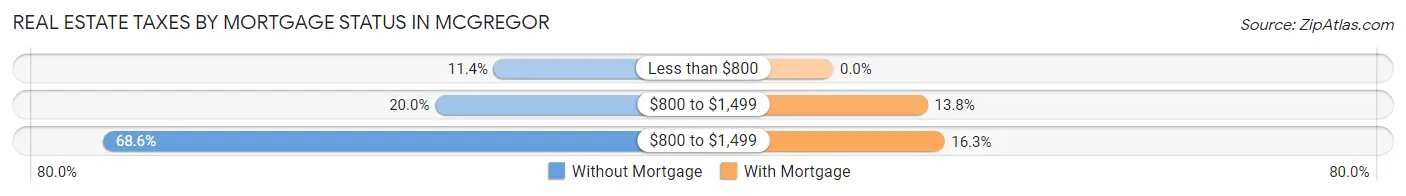
| Property Taxes | Without Mortgage | With Mortgage |
| Less than $800 | 12 (11.4%) | 0 (0.0%) |
| $800 to $1,499 | 21 (20.0%) | 17 (13.8%) |
| $800 to $1,499 | 72 (68.6%) | 20 (16.3%) |
| Total | 105 (100.0%) | 123 (100.0%) |
Health & Disability in McGregor
Health Insurance Coverage by Age in McGregor
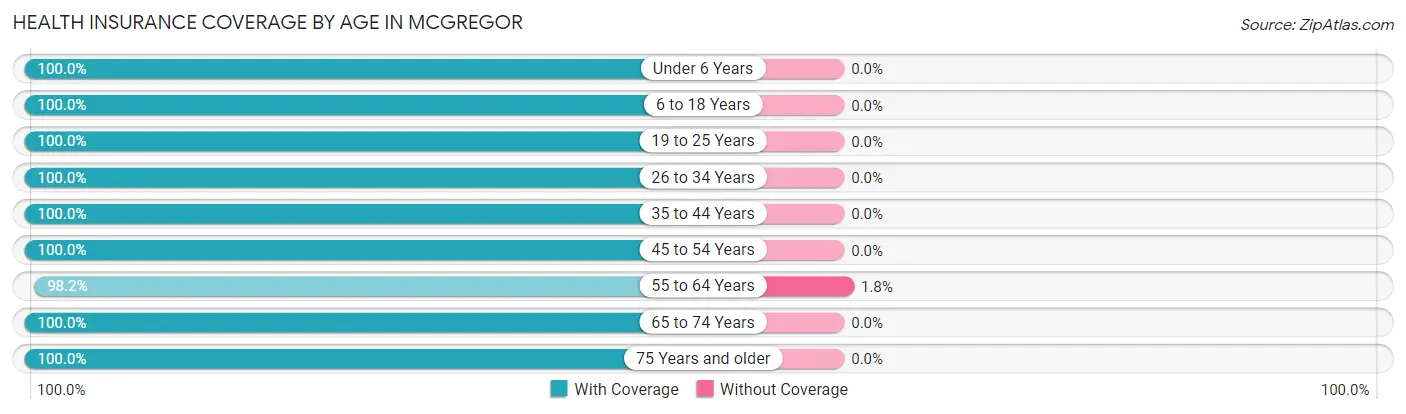
| Age Bracket | With Coverage | Without Coverage |
| Under 6 Years | 25 (100.0%) | 0 (0.0%) |
| 6 to 18 Years | 87 (100.0%) | 0 (0.0%) |
| 19 to 25 Years | 20 (100.0%) | 0 (0.0%) |
| 26 to 34 Years | 55 (100.0%) | 0 (0.0%) |
| 35 to 44 Years | 94 (100.0%) | 0 (0.0%) |
| 45 to 54 Years | 79 (100.0%) | 0 (0.0%) |
| 55 to 64 Years | 109 (98.2%) | 2 (1.8%) |
| 65 to 74 Years | 97 (100.0%) | 0 (0.0%) |
| 75 Years and older | 79 (100.0%) | 0 (0.0%) |
| Total | 645 (99.7%) | 2 (0.3%) |
Health Insurance Coverage by Citizenship Status in McGregor
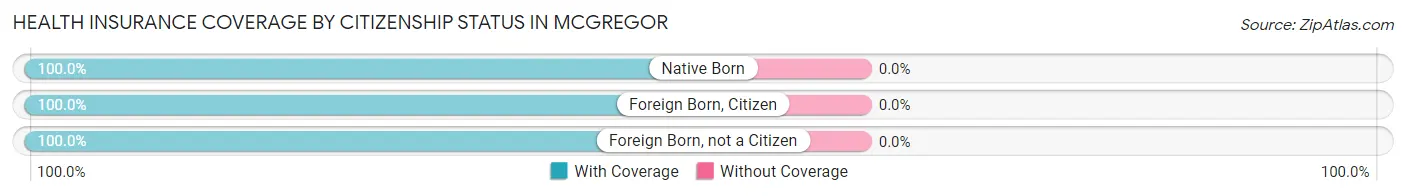
| Citizenship Status | With Coverage | Without Coverage |
| Native Born | 25 (100.0%) | 0 (0.0%) |
| Foreign Born, Citizen | 87 (100.0%) | 0 (0.0%) |
| Foreign Born, not a Citizen | 20 (100.0%) | 0 (0.0%) |
Health Insurance Coverage by Household Income in McGregor
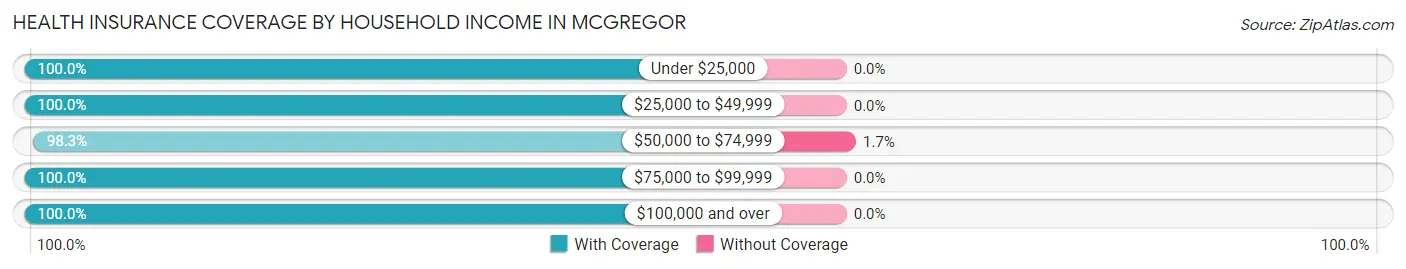
| Household Income | With Coverage | Without Coverage |
| Under $25,000 | 96 (100.0%) | 0 (0.0%) |
| $25,000 to $49,999 | 86 (100.0%) | 0 (0.0%) |
| $50,000 to $74,999 | 113 (98.3%) | 2 (1.7%) |
| $75,000 to $99,999 | 68 (100.0%) | 0 (0.0%) |
| $100,000 and over | 282 (100.0%) | 0 (0.0%) |
Public vs Private Health Insurance Coverage by Age in McGregor
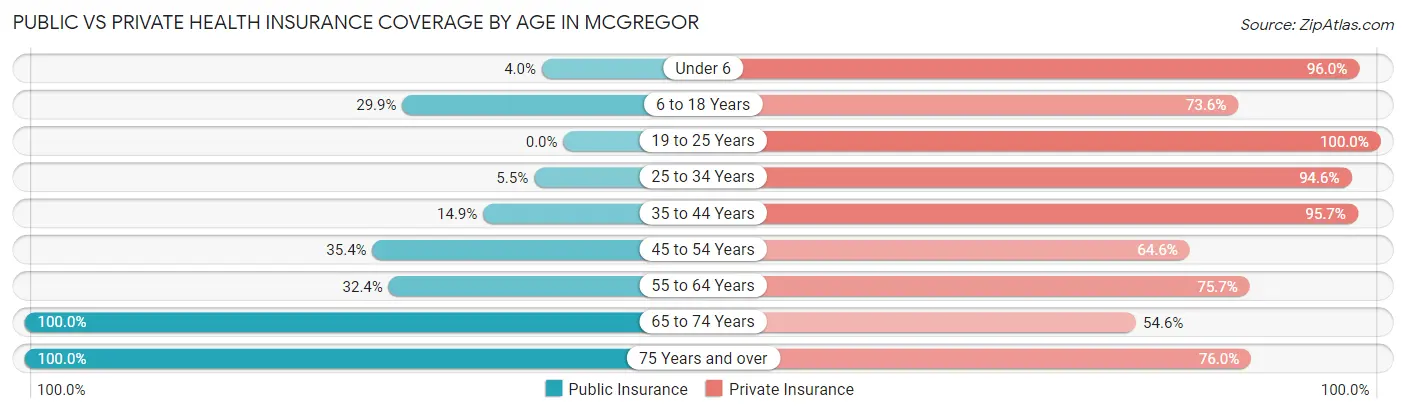
| Age Bracket | Public Insurance | Private Insurance |
| Under 6 | 1 (4.0%) | 24 (96.0%) |
| 6 to 18 Years | 26 (29.9%) | 64 (73.6%) |
| 19 to 25 Years | 0 (0.0%) | 20 (100.0%) |
| 25 to 34 Years | 3 (5.4%) | 52 (94.6%) |
| 35 to 44 Years | 14 (14.9%) | 90 (95.7%) |
| 45 to 54 Years | 28 (35.4%) | 51 (64.6%) |
| 55 to 64 Years | 36 (32.4%) | 84 (75.7%) |
| 65 to 74 Years | 97 (100.0%) | 53 (54.6%) |
| 75 Years and over | 79 (100.0%) | 60 (75.9%) |
| Total | 284 (43.9%) | 498 (77.0%) |
Disability Status by Sex by Age in McGregor
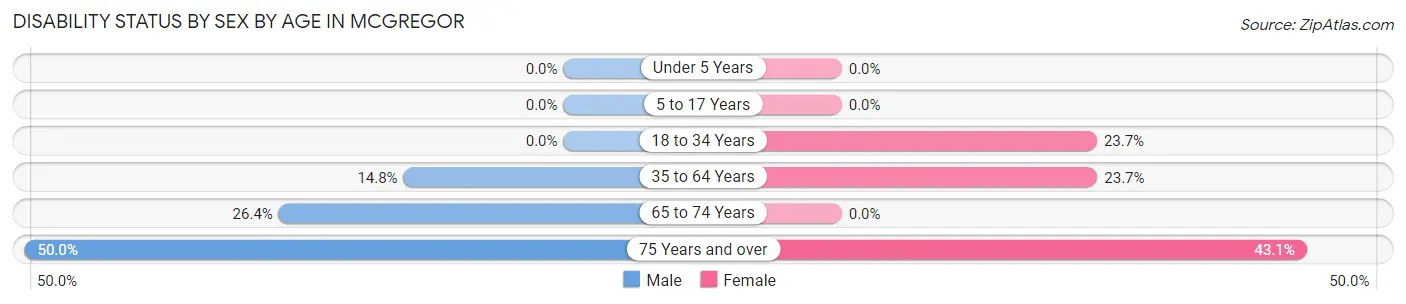
| Age Bracket | Male | Female |
| Under 5 Years | 0 (0.0%) | 0 (0.0%) |
| 5 to 17 Years | 0 (0.0%) | 0 (0.0%) |
| 18 to 34 Years | 0 (0.0%) | 9 (23.7%) |
| 35 to 64 Years | 19 (14.8%) | 37 (23.7%) |
| 65 to 74 Years | 14 (26.4%) | 0 (0.0%) |
| 75 Years and over | 14 (50.0%) | 22 (43.1%) |
Disability Class by Sex by Age in McGregor
Disability Class: Hearing Difficulty
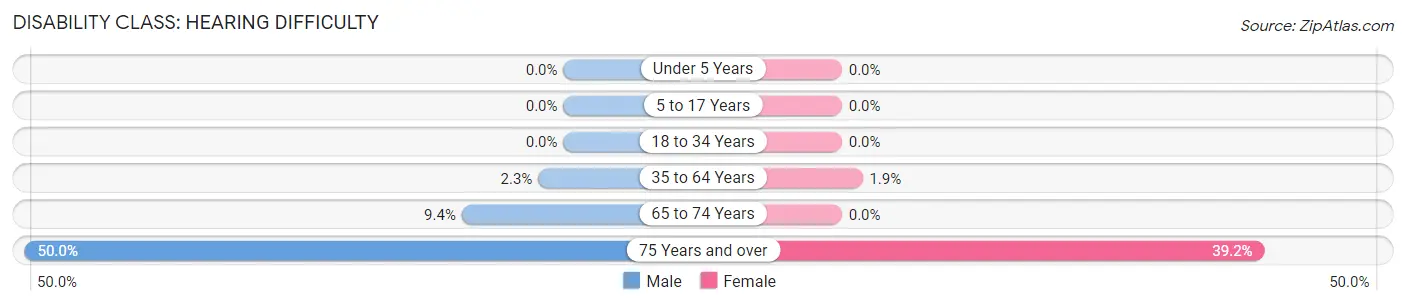
| Age Bracket | Male | Female |
| Under 5 Years | 0 (0.0%) | 0 (0.0%) |
| 5 to 17 Years | 0 (0.0%) | 0 (0.0%) |
| 18 to 34 Years | 0 (0.0%) | 0 (0.0%) |
| 35 to 64 Years | 3 (2.3%) | 3 (1.9%) |
| 65 to 74 Years | 5 (9.4%) | 0 (0.0%) |
| 75 Years and over | 14 (50.0%) | 20 (39.2%) |
Disability Class: Vision Difficulty
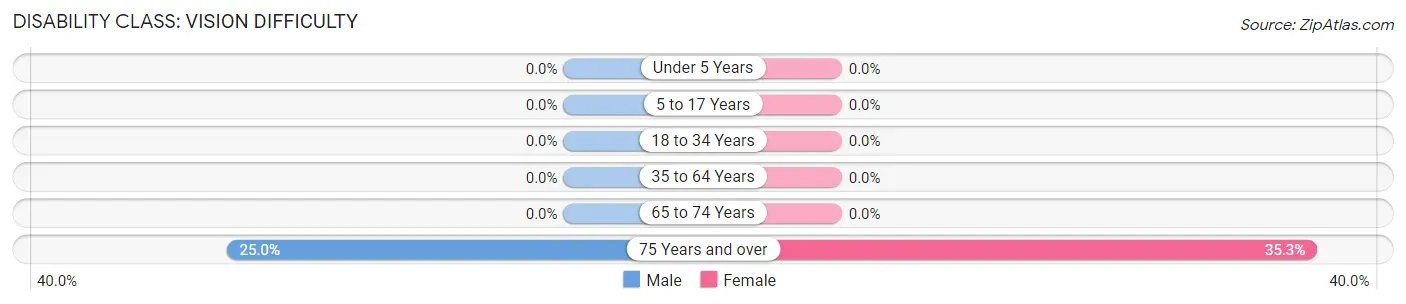
| Age Bracket | Male | Female |
| Under 5 Years | 0 (0.0%) | 0 (0.0%) |
| 5 to 17 Years | 0 (0.0%) | 0 (0.0%) |
| 18 to 34 Years | 0 (0.0%) | 0 (0.0%) |
| 35 to 64 Years | 0 (0.0%) | 0 (0.0%) |
| 65 to 74 Years | 0 (0.0%) | 0 (0.0%) |
| 75 Years and over | 7 (25.0%) | 18 (35.3%) |
Disability Class: Cognitive Difficulty
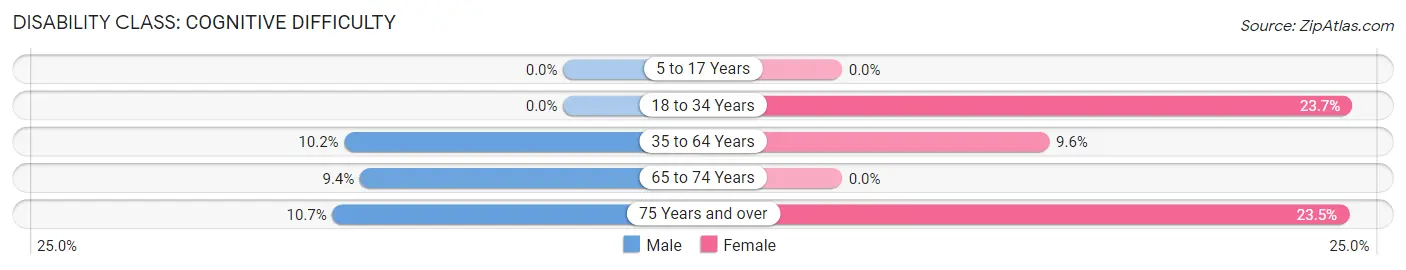
| Age Bracket | Male | Female |
| 5 to 17 Years | 0 (0.0%) | 0 (0.0%) |
| 18 to 34 Years | 0 (0.0%) | 9 (23.7%) |
| 35 to 64 Years | 13 (10.2%) | 15 (9.6%) |
| 65 to 74 Years | 5 (9.4%) | 0 (0.0%) |
| 75 Years and over | 3 (10.7%) | 12 (23.5%) |
Disability Class: Ambulatory Difficulty
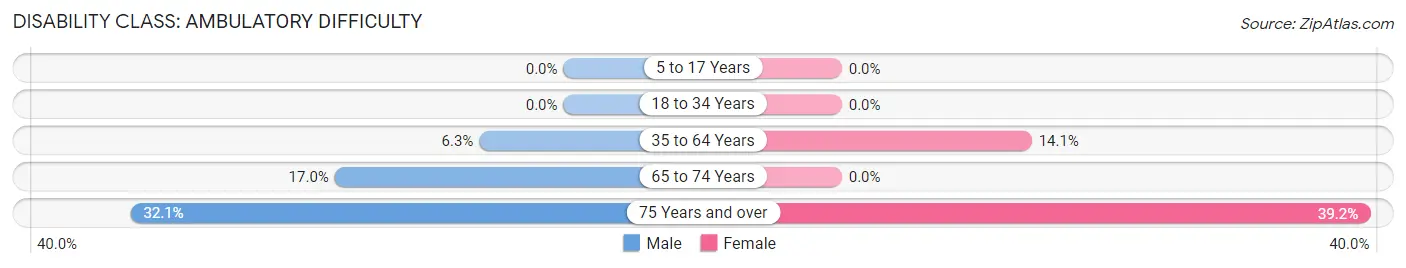
| Age Bracket | Male | Female |
| 5 to 17 Years | 0 (0.0%) | 0 (0.0%) |
| 18 to 34 Years | 0 (0.0%) | 0 (0.0%) |
| 35 to 64 Years | 8 (6.2%) | 22 (14.1%) |
| 65 to 74 Years | 9 (17.0%) | 0 (0.0%) |
| 75 Years and over | 9 (32.1%) | 20 (39.2%) |
Disability Class: Self-Care Difficulty
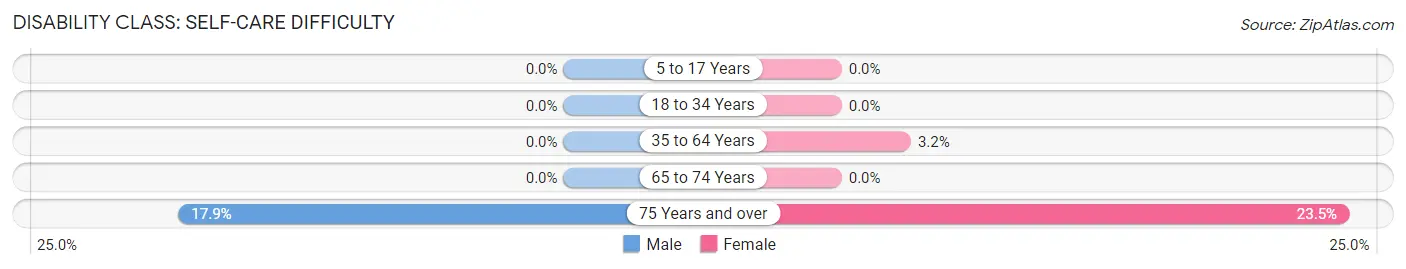
| Age Bracket | Male | Female |
| 5 to 17 Years | 0 (0.0%) | 0 (0.0%) |
| 18 to 34 Years | 0 (0.0%) | 0 (0.0%) |
| 35 to 64 Years | 0 (0.0%) | 5 (3.2%) |
| 65 to 74 Years | 0 (0.0%) | 0 (0.0%) |
| 75 Years and over | 5 (17.9%) | 12 (23.5%) |
Technology Access in McGregor
Computing Device Access in McGregor
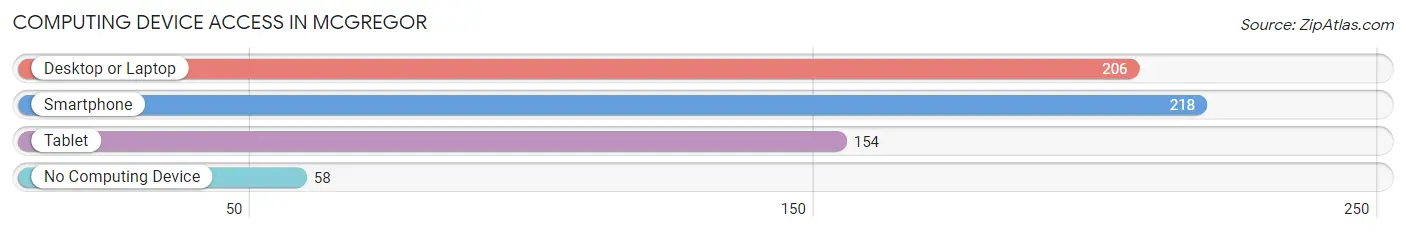
| Device Type | # Households | % Households |
| Desktop or Laptop | 206 | 64.0% |
| Smartphone | 218 | 67.7% |
| Tablet | 154 | 47.8% |
| No Computing Device | 58 | 18.0% |
| Total | 322 | 100.0% |
Internet Access in McGregor
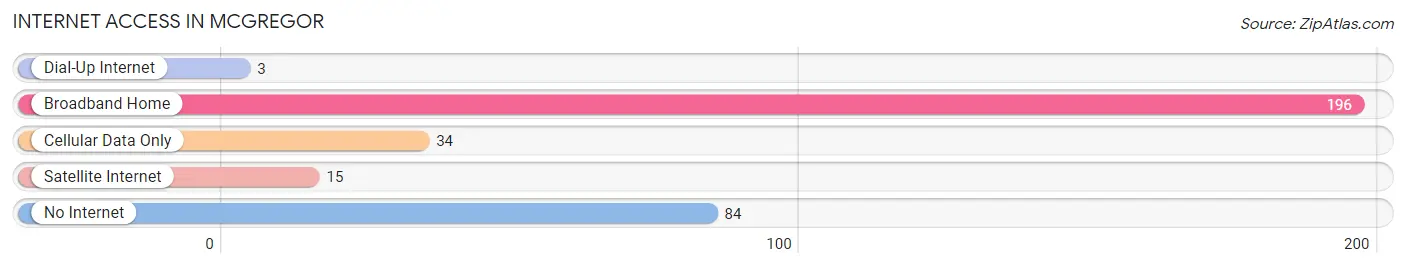
| Internet Type | # Households | % Households |
| Dial-Up Internet | 3 | 0.9% |
| Broadband Home | 196 | 60.9% |
| Cellular Data Only | 34 | 10.6% |
| Satellite Internet | 15 | 4.7% |
| No Internet | 84 | 26.1% |
| Total | 322 | 100.0% |
McGregor Summary
McGregor, Iowa is a small city located in Clayton County, Iowa, United States. It is situated along the Mississippi River, just south of the Minnesota border. The city has a population of 1,717 people, according to the 2010 census.
History
McGregor was founded in 1846 by John McGregor, a Scottish immigrant. He purchased the land from the Winnebago Indians and named the town after himself. The town was incorporated in 1856 and was the first city in Clayton County.
In the late 19th century, McGregor was a major port on the Mississippi River. It was a popular destination for steamboats and barges, and the city was home to several large warehouses and factories. The city was also home to a large number of immigrants, including Germans, Irish, and Scandinavians.
In the early 20th century, McGregor began to decline as a port. The city was bypassed by the railroad and the river traffic began to decline. The city was also hit hard by the Great Depression and World War II.
Geography
McGregor is located in the Upper Mississippi Valley, along the Mississippi River. The city is situated on the east bank of the river, just south of the Minnesota border. The city is surrounded by rolling hills and wooded areas.
The climate in McGregor is humid continental, with hot summers and cold winters. The average annual temperature is 48°F (9°C). The average annual precipitation is 33 inches (84 cm).
Economy
McGregor’s economy is largely based on tourism and agriculture. The city is home to several wineries, breweries, and distilleries, as well as a number of restaurants and shops. The city is also home to several manufacturing companies, including a furniture factory and a plastics factory.
The city is also home to a number of festivals and events, including the McGregor Music Festival, the McGregor Art Festival, and the McGregor Riverfest.
Demographics
According to the 2010 census, the population of McGregor was 1,717 people. The racial makeup of the city was 97.2% White, 0.7% African American, 0.3% Native American, 0.2% Asian, 0.1% Pacific Islander, 0.7% from other races, and 0.9% from two or more races. Hispanic or Latino of any race were 1.7% of the population.
The median income for a household in the city was $37,500, and the median income for a family was $45,000. The per capita income for the city was $19,000. About 11.2% of families and 14.2% of the population were below the poverty line, including 18.2% of those under age 18 and 8.3% of those age 65 or over.
Common Questions
What is Per Capita Income in McGregor?
Per Capita income in McGregor is $35,149.
What is the Median Family Income in McGregor?
Median Family Income in McGregor is $96,964.
What is the Median Household income in McGregor?
Median Household Income in McGregor is $52,639.
What is Income or Wage Gap in McGregor?
Income or Wage Gap in McGregor is 26.1%.
Women in McGregor earn 73.9 cents for every dollar earned by a man.
What is Inequality or Gini Index in McGregor?
Inequality or Gini Index in McGregor is 0.48.
What is the Total Population of McGregor?
Total Population of McGregor is 686.
What is the Total Male Population of McGregor?
Total Male Population of McGregor is 324.
What is the Total Female Population of McGregor?
Total Female Population of McGregor is 362.
What is the Ratio of Males per 100 Females in McGregor?
There are 89.50 Males per 100 Females in McGregor.
What is the Ratio of Females per 100 Males in McGregor?
There are 111.73 Females per 100 Males in McGregor.
What is the Median Population Age in McGregor?
Median Population Age in McGregor is 53.0 Years.
What is the Average Family Size in McGregor
Average Family Size in McGregor is 2.7 People.
What is the Average Household Size in McGregor
Average Household Size in McGregor is 2.0 People.
How Large is the Labor Force in McGregor?
There are 324 People in the Labor Forcein in McGregor.
What is the Percentage of People in the Labor Force in McGregor?
54.6% of People are in the Labor Force in McGregor.